GB Longer Semi-Trailer trial: 2019 Annual Report summary
Published 9 November 2020
Applies to England, Scotland and Wales

© Crown copyright 2020
This publication is licensed under the terms of the Open Government Licence v3.0 except where otherwise stated. To view this licence, visit nationalarchives.gov.uk/doc/open-government-licence/version/3 or write to the Information Policy Team, The National Archives, Kew, London TW9 4DU, or email: psi@nationalarchives.gov.uk.
Where we have identified any third party copyright information you will need to obtain permission from the copyright holders concerned.
This publication is available at https://www.gov.uk/government/publications/longer-semi-trailer-trial-evaluation-annual-report-2019/gb-longer-semi-trailer-trial-2019-annual-report-summary
Tractor unit with longer semi-trailer in Bibby haulage livery, plus Risk Solutions logo and accreditations
Professor David Cebon, University of Cambridge, Director for Sustainable Road Freight in Logistics Report 2017, Freight Transport Association:
Making substantial inroads to the decarbonisation of road freight requires innovation in both vehicle performance and logistics… the single most effective change in the short term is use of higher capacity vehicles.
Headlines
Trial take-up
| Trial take-up | Trial target total: 2,800 LSTs |
|---|---|
| 2,565 (90%) | Longer semi-trailers (LSTs) registered on vehicle special orders (VSOs)(1) (% of trial target of 2,800 trailers) |
| 2,473 (88%) | LSTs on the road and submitted trial data (% of trial target of 2,800 trailers) |
| 228 | Number of operators with trailers on the road and due to submit data in final period of 2019 |
Note: (1) A vehicle service order (VSO) grants permission for a specific operator to operate specific trailer(s) on Great British (GB) roads for the duration of the VSO. All LSTs require a VSO from the Vehicle Certification Authority (VCA) before the trailers go on the road.
Savings
Utilisation and km saved
| Utilisation and km saved | Utilisation and km saved |
|---|---|
| 5.9 million | Journey legs travelled by LSTs during the trial |
| 739 million | km travelled by LSTs during the trial; analysis in 2017 showed LST usage to be 85% trunk, 13% principal and 2% minor roads |
| 54 – 60 million | Vehicle km ‘saved’ by LST operations (end 2019). Lower – upper estimates (upper includes matched empty return legs) |
Journeys saved
| Journeys saved | Estimates of equivalent ‘standard trailer’ journeys saved across whole trial period and all operators |
|---|---|
| 430 – 475,000 | Journeys by 13.6m trailers saved by using LSTs based on 125km average journey. Upper estimate (includes some return legs) |
| 1 in 12 (8%) | Average saving across all operators 1 in ‘n’ journeys (x% distance saved) |
| 1 in 8 (13%) | Highest saving achieved by individual operators |
Emissions saved
| Emissions saved by LSTs on trial to date – 2012–2019 | Emissions saved by LSTs on trial – projection to 10 years | Estimates compared with the emissions from delivering an equivalent quantity of cargo on ‘standard trailers’ – savings of carbon monoxide (CO), particulate matter (PM) (exhaust) and volatile organic compounds (VOC) also calculated |
|---|---|---|
| 48,000 | 71,000 | Tonnes of carbon dioxide equivalent (CO2(e))(1) |
| 241 | 358 | Tonnes of oxides of nitrogen (NOx) of which 6.2% saved within 200m of ‘designated areas’ (2017 modelling estimates) |
Note:(1) Carbon dioxide equivalent or ‘CO2(e)’ is a term for describing different greenhouse gases in a common unit. For any quantity and type of greenhouse gas, CO2(e) signifies the amount of CO2 with an equivalent global warming impact.
Injury incidents
National comparison
| Collisions | Casualties | Collisions / casualties where LST involved on public highways or public access areas (2012–2019) resulting in injury |
|---|---|---|
| 40 (4) | 51 (4) | All personal injury incidents involving an LST (Brackets show collisions / casualties judged to be ‘LST related’) |
| 54 | 68 | 3-year average safety incident rate (all collisions or casualties per billion vehicle km, 2017–2019) |
| 114 | 162 | Equivalent 3-year rate for all GB articulated heavy goods vehicles (HGVs) (per billion vehicle km 2016–2018 – 2019 not yet published) |
| 0.47 | 0.42 | Collision / casualty rate ratio (LST vs all GB articulated HGVs) |
On a per kilometre basis, nationally, we estimate LSTs have been involved in around 53% fewer personal injury collisions and casualties than the GB articulated HGV average.
Urban only/minor road comparison
| Urban(1) | Minor(2) | Collisions/casualties where LST on public highways or public access areas (2012–2019) resulted in injury |
|---|---|---|
| 4 | 3 | Personal injury incidents involving an LST (all – regardless of any ‘LST-related’ judgement) |
| 41 (per billion km) | 203 (per billion km) | Safety incident rate (collisions per billion vehicle km) over whole trial for estimated distance of 13.1% urban and 2.0% minor |
| 518 (per billion km) | 935 (per billion km) | Equivalent rate for all GB articulated HGVs over whole trial period for which data is available, 2012–2018 (per billion vehicle km – 2019 not yet published) |
| 0.08 | 0.22 | Collision rate ratio (LST vs all GB articulated HGVs) |
Notes:
- (1) Urban areas as defined by the Office for National Statistics (ONS) – excluding motorways
- (2) Operations off motorway, trunk or principal roads
On a per kilometre basis, compared with the average for all GB articulated HGVs, LSTs on the trial have been involved in 92% fewer personal injury collisions per kilometre when operating on roads in urban areas and 78% fewer when on minor roads.
Vulnerable road users
| Collisions | Casualties | LST collisions / casualties on public highways or public access areas (2012–2019) that resulted in one or more injury to a pedestrian or cyclist, whether or not judged to be ‘LST related’ |
|---|---|---|
| 3 | 3 | All LST personal injury incidents and casualties where a pedestrian or cyclist was involved |
| 4.06 | 4.06 | LST collision and casualty rate (per billion vehicle km over whole trial period, 2012–2019) |
| 10.82 | 11.26 | Equivalent rates for all GB articulated HGVs (per billion vehicle km over whole trial period, 2012–2018 – 2019 not yet published) |
| 0.38 | 0.36 | Collision / casualty rate ratio (LST vs all GB articulated HGVs) |
The LST injury incident rate for vulnerable road users in all locations appears to be lower than that for the GB HGV fleet, but the difference in rates does not pass a classical statistical significance test.
Damage incidents
| LST | Non-LST | Based on 2018 data from 92 operators for incidents involving both LSTs and non-LSTs in the same operator fleet, occurring on roads, resulting in damage |
|---|---|---|
| 0.87 (incidents) | 6.7 (incidents) | Mean number of incidents expected for an LST fleet and a non-LST fleet after 1 million vehicle km exposure – that is, after completing a million vehicle km as a fleet |
On a per kilometre basis, the average number of damage incidents for non-LSTs is greater than that for LSTs by a factor of about 8.
Progress against key evaluation questions
With this latest report, we believe we now have sufficient quantitative data and other evidence to provide a robust evaluation response to all the key evaluation questions.
In addition to the quantitative results, we have collated industry insights covering the issues considered, and measures taken, by real operators when adopting LSTs –focusing in particular on establishing an efficient and safe operation.
Tractor unit and longer semi-trailer in TNT livery beneath a section break
What is a longer semi-trailer?
Longer semi-trailers, or LSTs, are a new type of heavy goods vehicle (HGV) trailer that have been on trial since 2012. The LSTs are up to 2.05 metres longer than the current standard semi-trailers on our roads (15.65 metres instead of 13.6 metres). These are not the mega trailers or road-trains permitted in some other countries.
While the trailers are longer than existing HGV trailers, they cannot be heavier. The total weight of the trailer, the goods and the tractor unit must still be within the UK domestic weight limit of 44 tonnes. They must also pass the turning circle test applied to the existing 13.6m trailers. To achieve this, LSTs usually have a steering rear axle.
This is a summary ofthe latest findings from the trial of a new type of heavy goods vehicle trailer – the longer semi-trailer. The full results can be found in the 2019 Annual Report produced by the independent trial evaluators (Risk Solutions) for the Department for Transport (DfT).
Why use LSTs?
By making the trailer 2 metres longer, you can carry two more rows of pallets or three more rows of goods cages on each journey compared with existing trailers.
Fully loaded LSTs can move goods using fewer journeys than current trailers, reducing overall emissions, congestion and collision risk.
This differs from other approaches to freight carbon reduction – such as increasing engine efficiency or electric vehicles – in being available without the need for further significant technological and infrastructure development.
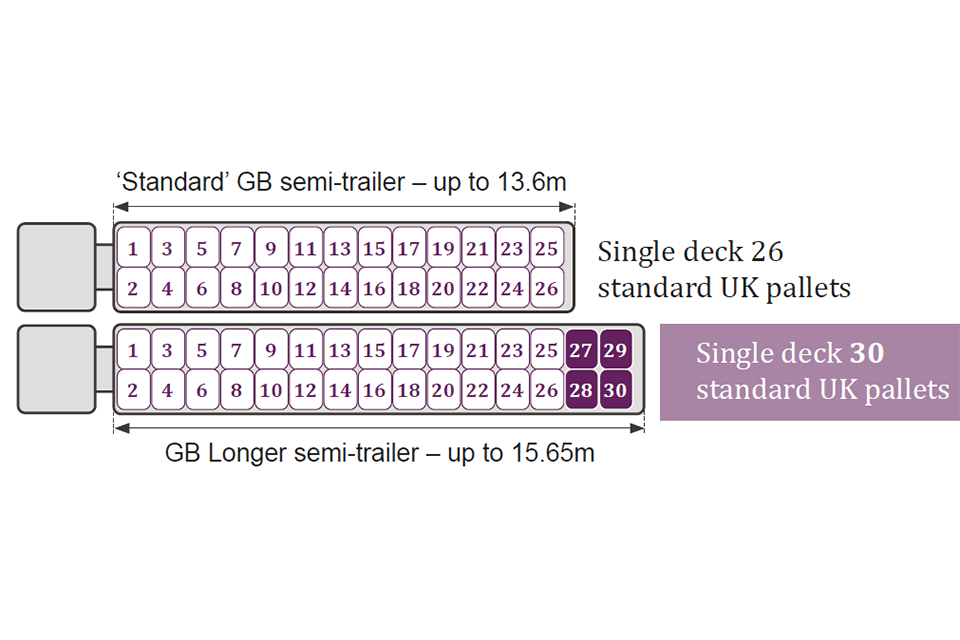
Comparison of standard vs longer semi-trailers
Why is there a trial? Why not just allow the trailers now?
The trial is seeking answers to 7 evaluation questions:
- What do operators use LSTs for, and where?
- What are the savings realised in HGV journeys?
- What are the resulting reductions in emissions?
- What about safety – will LSTs cause more injuries?
- What about damage and the associated costs – will LSTs cause more damage to the roads?
- Might any special operational requirements be appropriate for LSTs?
- What proportion of the existing Great Britain (GB) fleet of semi-trailers might be replaced by LSTs, were numbers not restricted?
DfT needs to take all these factors into account in deciding whether to allow LSTs for general use on GB roads when the trial ends.
With this latest report, we believe we now have sufficient quantitative data and other evidence to provide a robust evaluation response to these key evaluation questions.
The response to each of the above questions is summarised later in this report.
About the GB LST trial
What does the trial involve?
DfT began the trial in January 2012, when it established an initial allocation of 1,800 trailers for operators wishing to take part, with an initial trial period of 10 years.
In April 2017, the government increased the number of LSTs by an additional 1,000 and decided to extend the trial by 5 years.
All participants must submit detailed data about the journeys their LSTs make and on all incidents (not just those resulting in injury) on the public road or in public areas (such as services).
Operators participate voluntarily, at their own cost and risk. As this is a trial, there is no guarantee that LSTs will be permitted on the road beyond the end of the trial period. The trial was set to run for a long period to ensure it generated enough data to answer the 7 evaluation questions and to allow participants to recover the costs of investing in LSTs.
Who can participate in the trial?
Any licensed GB haulier is eligible to apply to join the trial and DfT’s aim has been to include a mix of large and small operators.
Companies sign an ‘operator undertaking’, which sets out the terms of the trial, including the requirement to provide data to the evaluation. They also need a vehicle special order (VSO) granted by the Vehicle Certification Authority (VCA).
VSOs can be revoked or suspended by VCA for any serious failure to comply with the operator undertaking. Operating an LST without a valid VSO is illegal.
Who is evaluating the information from the trial?
The trial evidence could not be evaluated by DfT or by the industry – there needed to be an independent party to both hold the commercially sensitive data and conduct a fair evaluation of the evidence.
Risk Solutions has fulfilled this role for the trial since it began in 2012 and we now hold data on over 5.9 million LST journeys to the end of 2019.
Although commissioned by DfT, our role is to provide independent scrutiny of the evidence. We also, on occasion, provide comment on DfT’s public statements regarding the trial, to ensure they are accurate and are supported by the evidence.
We produce a report of the latest observations and results for each calendar year of the trial.
Longer semi-trailer in Argos at a loading dock
How is the data gathered?
Detailed information on trailers operated, journeys and incidents is submitted for every trailer in Excel templates every four months. This has been a comprehensive and long-running data collection process, as it has been important for DfT to ensure that any new equipment introduced has demonstrable and evidence-based benefits.
As the trial has progressed and key quantitative questions have been answered, we have gradually reduced the level of detail required for the journey data. This has allowed time for a greater focus on other areas of evidence gathering and reduced the data collection burden on operators.
Is self-reporting by the operators reliable?
Yes, with active engagement with operators and expert support, self-reporting works extremely well and is producing good quality data.
Self-reporting is sensible here because of the duration of the trial, the number of operators involved and the complex mix of data types we need, which would make independent data collection prohibitively expensive.
In any case, operators must be closely involved to ensure that the data is of the high quality we need to answer the 7 evaluation questions listed earlier.
A robust approach to collecting self-reported data
Risk Solutions do everything practicable to maximise complete reporting. Their processes seek to create a sense of personal responsibility with each company contact collecting data and an informal community between the company data contacts.
They provide telephone and email support, share ideas and experiences in making data collection efficient, and facilitate contact between companies with similar operational challenges.
Risk Solutions carry out rigorous data checking and reflect any issues back to operators for resolution. Continuing concerns can be escalated to DfT with the most severe sanction available being removal from the trial.
Risk Solutions’ direct contact with operators shows that, in the vast majority of cases, those collating the data are very conscientious, even where it costs them some significant time and effort. In exceptional cases, the chance of losing their VSO has been used by DfT to prompt improvement.
Operators submit details of LST journeys undertaken and a detailed log of incidents
How many LSTs are there on the road now?
The trial started in 2012 to 2013 with just a few hundred trailers in the national fleet. At the time of writing, the majority of the LST allocations had been granted and, at the end of 2019, 2,473 LSTs were on the road and submitting data.
The following chart shows how the fleet has grown over time:
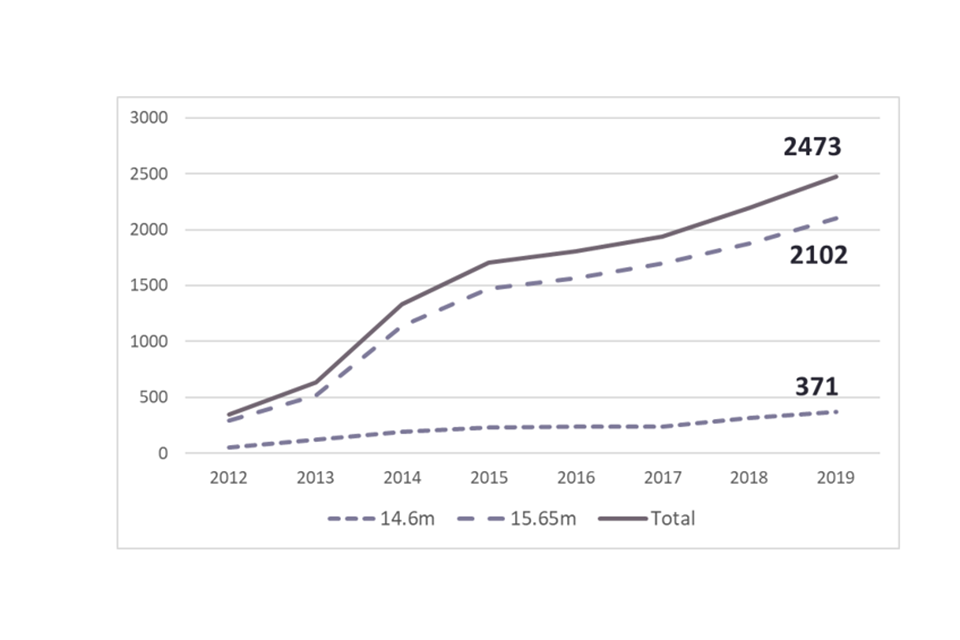
Graph showing growth curves for the 14.6m trailer fleet, the 15.65mtrailer fleet, and the total fleet over time. The shorter 14.6m designs are less popular, accounting for less than 15% of all LSTs built
In the later part of 2019 and early 2020, we have seen the gradual emergence of both fleet renewal and a second-hand market in LSTs. This is partly being driven by trailers reaching the end of their standard 7-year leasing deals with rental companies or, for wholly owned trailers, the end of their standard asset lifecycle.
In some cases, the operators involved have replaced the trailers with new units, while others have either ceased LST operations or stated that they have deferred that decision pending an indication of the future policy framework for operating these trailers.
Risk Solutions are working with the DfT, VCA and Driver and Vehicle Standards Agency (DVSA) to enhance the trial processes to properly track the movement of LSTs into the second-hand market.
LST trial results
At the end of 2019, following 8 years of data and analyses, we have confirmed all of the key evaluation results sought from the trial – in particular on how efficiently the LSTs are being used and whether they are being operated any more or less safely than the standard-length trailers they have replaced.
Since last year’s report we have completed additional work leading to:
- a document summarising industry insights into the adoption of LSTs, based on interviews and a workshop with a sub-group of operators, which covers all aspects of their experience of adopting LSTs and integrating them into their existing depots, operations and business planning
- a Scaling up model that estimates the potential impact of LSTs being introduced more widely to the GB HGV fleet, under different scenarios
More details of how Risk Solutions carried out the calculations and research can be found in the full 2019 Annual Report.
1. What do operators use LSTs for?
Nature of journeys
Our trial data provides us with a lot of information about LST journeys such as:
- where they start and end
- distances covered
- what they are carrying
- how full the trailers are
By the end of 2019, LSTs had travelled 739 million km:
- goods carried are dominated by fast-moving consumer goods (low-cost products sold quickly) and other cage or pallet loads
- at least 68% of the distance travelled was between industrial locations (depots, distribution centres, supplier sites and so on); around 13% of loaded legs are to or from retail sites – although a large proportion of these trips have a matching empty leg, so the actual total use for retail sites could be up to double this figure
- trailers ran empty around 18% of the total distance travelled – much lower than the figure of around 30% for all articulated trailers (source: Road Freight Statistics Table RFS0117 percentage empty running and loading factors by type and weight of vehicle)
Many operators restrict LSTs to operations where they can run heavily loaded on both outbound and return legs to make the most of what is a significant investment. In many cases, this is between major distribution centres, which will mainly be on trunk roads, but also includes repetitive operations from distribution centres to larger retail stores where the access permits LST use.
Nature of routes
The trial data tells us the start and end of each journey, but not the route travelled. Routing information is not available for all the LSTs.
At the start of the trial, tracking semi-trailers separately from the tractor units that pull them was not standard practice. During 2015 through to 2017, we therefore developed a method of modelling routes using the start and end postcodes provided by operators for 2017.
We validated the model route selection using a large sample of GPS data for a mix of LST and non-LST operations by trial participants (DfT judged it would be unreasonable to ask operators to fit GPS equipment as a condition of the trial, as it would limit participation to larger companies; while GPS use is now more common, research suggests fewer than 50% of the trailers are fitted with GPS tracking).
From this work, we were able to generate estimated patterns of LST movement by each of the major GB road classification systems, as show in the following chart:
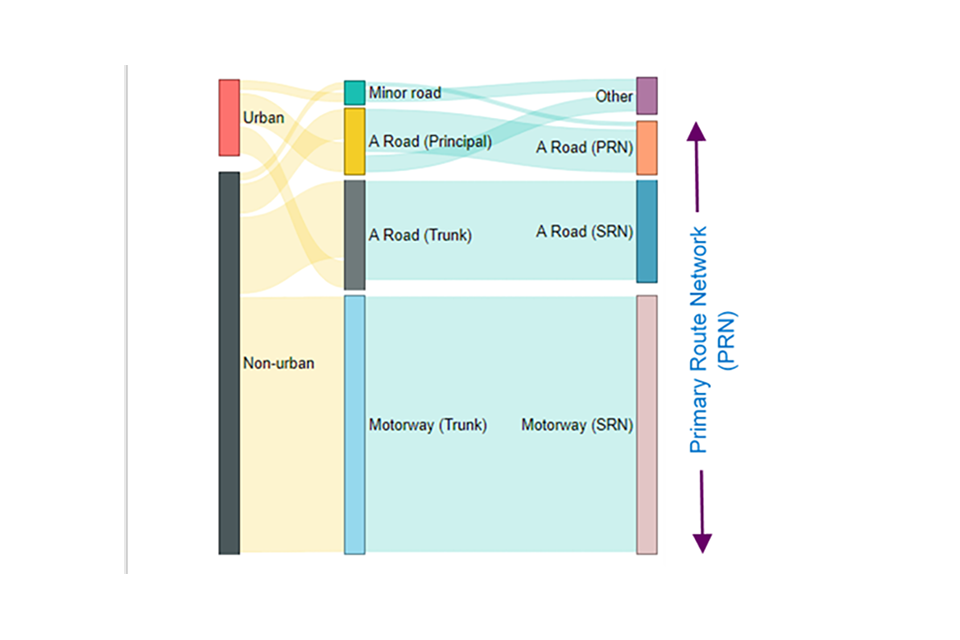
Diagram showing extent of LST usage on 3 different road classes: 1) Urban, Rural 2) Motorway, Trunk, Principal, Minor and 3) Motorway, A-Road SRN, A-Road PRN, Other. This shows limited use of LTS in urban areas or on minor roads.
A key result of this 2017 work was the comparison of the LST use of different road types with that published for the GB articulated HGV fleet as a whole. As the following chart shows, the split of road types used by LSTs is very similar to that of standard-length trailers:
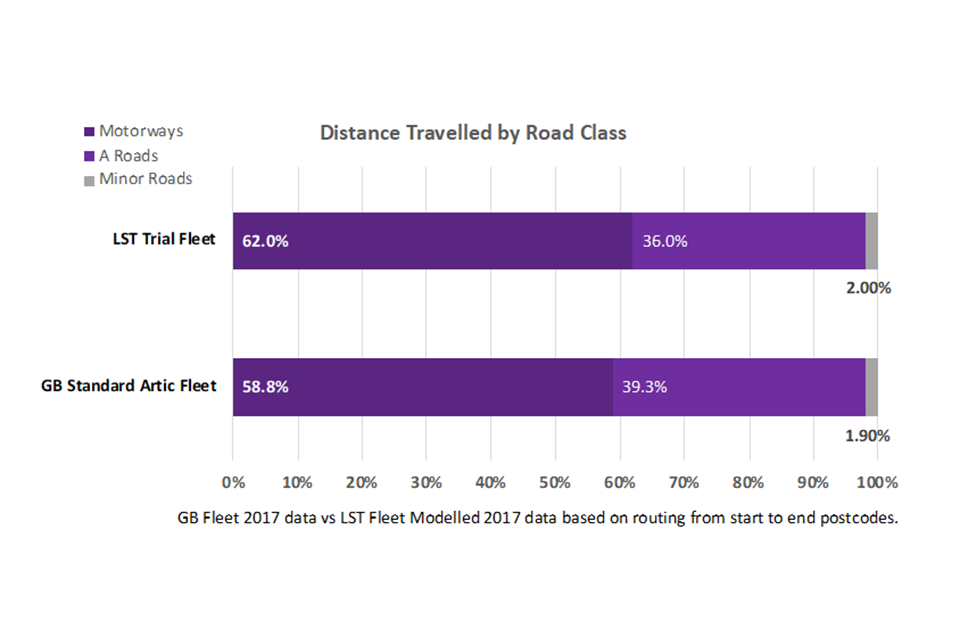
A chart comparing the road class usage of LSTs to that of the general GB articulated HGV fleet, demonstrating that they are very similar
This is an important conclusion of the trial since it shows that, contrary to some pre-trial assumptions, the LSTs operations are not any more weighted towards motorways and SRN A roads than the standard GB articulated fleet. This aligns with the major use of LSTs by the retail sector to deliver to large stores, rather than solely for trunking between national distribution centres.
Information about geographical patterns of movement by region and local authority (LA) can be found in the full 2018 Annual Report.
2. What are the savings realised in HGV journeys?
We estimate that the average percentage distance saving to the end of December 2019 is around 8%, which equates to 1 in every 12 journeys. The most efficient LST operations are saving up to 1 in every 8 journeys.
Beneath this average figure, there are considerable differences in efficiency of operation across the range of operators taking part in the trial. We can identify 3 broad groupings in the data as shown in this table:
| LST savings(1) performance summary by operator (2018) | Lowest savings group (0–5% saving) | Average savings group (>5–10% saving) | Highest savings group (>10–14% saving) |
|---|---|---|---|
| % of operators | 15% | 28% | 57% |
| % of trailers(2) | 23% | 38% | 39% |
Notes:
- (1) Based on the savings % for each operator including an estimate for empty return legs saved
- (2) Based on the number of trailers registered to the operators falling into each savings group
More than half of the operators are running their trailers at or near their maximum efficiency (10 to 14%). This highest savings group is dominated by movement of raw materials, industrial products and biomass/fuel. These goods are often shipped in full loads only, commonly as a simple ‘Full-Out – Empty-Back’ loop.
Around a third of operators are in the average savings group, where a mixture of factors are driving the savings and variable trailer fill levels. An example is some retail sector deliveries to stores, where the cargo sizes can be driven by just-in-time delivery to the store of exactly what is demanded – there being little or no stock held at stores.
The lowest performing group – about 16% of operators – includes:
- cargo such as mail and parcels, where the quantity of goods loaded is often not determined by a process designed to fill trailers to the maximum level, but by timetabled trailer departures
- cargo such as waste packaging, which may simply back-haul legs as a by-product of the main purpose of the trip
Some of the lower performing operators are cases where the trailer has been purchased for use on a specific contract, which has then ended and new work has not been found. In other cases, the trailer has simply not been usable on as wide a range of work, or at the loading levels, the operator hoped. Outside of trial conditions and with a more active open market for LSTs, these operators may not have held on to their trailers.
3. What are the resulting reductions in emissions?
In 2017, we developed an emissions model that, integrated with the route modelling system previously mentioned, allowed us to estimate savings in emissions taking account of route information, estimated vehicle weights and actual load weights.
The emissions model provides estimates for carbon dioxide, and 5 additional emissions relevant to air quality, both for the trial to date and projected forward to the nominal trial end point(s).
The following table shows results for 2 key indicators – CO2e (carbon dioxide equivalent – a term for describing different greenhouse gases in a common unit; for any quantity and type of greenhouse gas, CO2(e) signifies the amount of CO2 with an equivalent global warming impact) and NOx (oxides of nitrogen):
| Trial to date | 10-year trial | Extended trial | |
|---|---|---|---|
| Savings | 2012–19 | 2012–21 | 2012–2026 |
| CO2(e) | 48,169 | 71,495 | 132,820 |
| NOx | 241 | 358 | 666 |
Notes: All figures are in tonnes (rounded). Full results for all emissions types can be found in the 2018 Annual Report.
The key results for CO2(e) (as an emission that disperses widely) and NOx (as a localised emission) are:
The net emissions reduction from the trial to date is around 37,000 tonnes of CO2(e) and 187 tonnes NOx, as well as other emissions.
The projected net reduction if the trial were to run to the original 10-year end point is around 71,000 tonnes of CO2(e) and 358 tonnes NOx, as well as other emissions.
These emissions results are still based on the model for EURO V engine parameters, to maintain continuity with the earlier assessments and pre-trial modelling; however, in considering longer-term future projections, the model would need to be adjusted to take account of the gradual replacement of EURO V engines with the more efficient EURO VI engines.
This would primarily affect the NOx saving results as this was the main change between EURO V and VI, reducing the impact on air quality. The CO2(e) results, which contribute to climate change, would remain unchanged.
4. What about safety – will LSTs cause more injuries?
The trial results are showing that LSTs can be operated safely, even when used on routes involving some minor roads.
Numbers of safety incidents – collisions and casualties
During the 7 years from 2012 to the end of 2019, there have been 40 road traffic collisions in public locations that involved HGVs pulling an LST and resulted in an injury.
These have resulted in 2 fatal, 10 serious and 39 slight injuries. (A further 1 serious and 5 slight injuries occurred in depots or on other private land not accessible to the public.)
Fatal incidents
There had been no fatal incidents involving LSTs up to the end of 2018. In 2019 there were 2.
In May 2019, there was a fatal accident involving an LST resulting in the death of the lorry driver. Investigation by the DVSA found that this incident was unrelated to the condition or extra length of the LST.
In August 2019, there was an incident that resulted in the death of a cyclist. With the evidence the DfT currently possesses, it is not believed that this was related to the longer length of the trailer.
While there is no evidence at this stage that either of these incidents were caused by the trailer being an LST, the DfT will continue to check (when the incident inquests are completed) if there are issues related to either incident that require further consideration in the context of the trial.
Collision and casualty rates (to end 2019)
A key question for the trial is whether the LSTs cause more injury collisions than the standard 13.6m semi-trailers. There are 2 parts to this question:
- Q1. How many extra injury collisions would have occurred if the same goods had been moved using standard trailers, requiring more journeys?
There will have been a direct safety benefit of around 8% reduction in collisions – equivalent to around 8 to 9 collisions and 11 to 12 casualties – saved during the trial as a result of the reduction in the number of journeys.
- Q2. Do LSTs have a higher incident rate than the trailers they replace?
This question is about whether the LSTs are having more incidents per kilometre that they DO travel. It is independent of Q1.
At the end of 2019, we found that the trial LSTs are being operated in a way that results in a significantly lower rate of injury incidents per vehicle km (in public locations) than the average for GB articulated HGVs.
Vulnerable road users
In terms of risk to vulnerable road users, an initial analysis in the 2019 Annual Report does not indicate that the national results are masking a problem, and the vulnerable road user incident rates for LSTs are lower than that for the GB articulated fleet as a whole; however, there is as yet insufficient data to confirm that these rates are statistically different.
So LSTs are safe?
There is no reason why LSTs should be inherently safer than standard trailers, but during the trial, their incident rate per km is lower than for other trailers. There are a number of reasons why this might be the case:
- the conditions of participating in the trial require that operators provide special driver training for any staff using LSTs
- operators often report paying additional attention to route selection, route assessment, driver selection and driver familiarity with both the LST and the routes
- the LSTs represent a significant investment that operators do not want to see damaged
- the focus brought by having to submit data on every LST journey probably reinforces their ‘special’ nature, even where, for some operators, they have now been in service for 7 years
Separately to the statistical analysis, we study each injury event in detail to look for any lessons that can be learnt regarding safe operation of LSTs. This has identified important principles in driver training and route planning, and some more technical points about good maintenance.
Further work has been completed to gather industry insights into good practice in adopting and operating LSTs – see 6. Might any special operational requirements be appropriate for LSTs?.
LSTs as a cause or contributor to incidents
The statistical analysis presented on the trial treats all events in which an LST was involved as relevant. This is intentionally conservative since, for the great majority of the incidents, analysis of the events suggests that the type of trailer being pulled was not a factor.
Of the 40 injury events on the road or in another public place over the 8 years of the trial to date, there are only 4 where the incident details suggest the length or steering behaviour of the trailer was or might have been a factor in either the event occurring or the severity of the injury. In all 4 cases, the resulting injury was slight.
Summary of injury incidents involving LSTs in all public locations(1), after 587 million km travelled, compared with those for all GB articulated HGVs (>7.5 tonnes)
| Collision location | GB articulated HGVs: 1 in every…(4) | LST involved: 1 in every…(5) | Judged LST related: 1 in every…(6) |
|---|---|---|---|
| All locations where a pedestrian or cyclist was involved | 92 million km | 246 million km | N/A |
| All roads | 7.0 million km | 19 million km | 185 million km |
| Urban(2) only | 1.9 million km | 24 million km | 97 million km |
| Minor(3) roads only | 1.1 million km | 4.9 million km | 15 million km |
Notes:
- (1) ‘All public locations’ covers all public roads and also private land where there is public access
- (2) ‘Urban’ defined as all roads, excluding motorways, in ONS-defined urban areas
- (3) ‘Minor’ roads are all roads that are classified below the level of A-road
- (4) Based on DfT national data for all articulated HGVs >7.5 tonnes 2012–2018 (TRA3105) = 99 billion km of which 5.8 billion is urban non-motorway and 1.9 billion minor roads. Injury incidents from STATS19 2012–2018: Total collisions = 14,174 (3,005 urban and 1,794 minor roads)
- (5) 40 collisions (of which 4 occurred on urban and 3 on minor roads). Any injury event in which an LST was involved, even if the trailer being an LST was not relevant – data taken from 2019 Annual Report table 9. Non-injury, damage incidents are covered separately
- (6) 4 collisions. Events involving an LST where the fact that the trailer was an LST rather than a standard length was considered to be at least part of the cause. Note that the headline figures for trial injury rates use all collision and causality data
- All these figures are mean values. The latest annual report includes analysis that concludes that the comparisons between LST incident rates shown here are statistically robust at a 95% confidence level, with the exception of the rate comparison for vulnerable road users
5. What about damage and the associated costs – will LSTs cause more damage on the roads?
Damage to property or other vehicles
Since there is no national dataset for the damage events for non-LSTs, we needed to obtain data for non-LSTs within the fleets where the LSTs are operating to inform a comparison. The revised data collection framework launched from 2018 crucially included a requirement to report summary figures for incidents and total distance travelled for the non-LST trailers operating in the same fleets as the LSTs, where it could be gathered.
Results from this data were available to inform a special study of damage incidents using data from 92 operators who were able to provide both LST and non-LST damage event figures for their fleets on a comparable basis. We collated the data across these 92 operators to examine any difference between the LST and non-LST fleets.
We found that, for the operators in this sample, LST fleets have a much lower incident rate than non-LST fleets of the same group of operators. The results were found to pass tests for statistical significance. We therefore see no indication that the LSTs on the trial are causing more damage than other semi-trailers in the same fleets.
As with the injury incident results, this is not attributed to any inherent characteristic of LSTs, but is taken to indicate that the LSTs are being operated in a manner that reduces the likelihood of damage events.
We also looked at the specific issue of whether the owners of assets damaged by LSTs were commonly aware of who was responsible for the damage.
We found that in 90% of cases where a third party’s property was damaged, the owner was either present or made aware of the incident by the operator.
In only 10% of events the owner was marked as ‘unknown’ and will not have been aware of how the damage occurred, or it was unclear from the data submitted whether the owner was aware or not.
Damage to the road surface
The analysis has focused on the damage to roadside assets and other vehicles as we have not been asked to study wear and tear impact on the road surface itself.
Pre-trial work suggested that this would not be an issue since the overall weight limit and number of axles/tyres for an LST is no different from standard trailers. Indeed, the argument was made that the reduction in tyre scrub by the use of a rear steering axle would mean reduced road surface damage.
6. Might any special operational requirements be appropriate for LSTs?
From our periodic surveys of operators, we know that:
- many operators restrict LST operations to set routes, where:
- they can maximise utilisation of the extra length
- they have assessed the route to be suitable for LSTs
- the delivery points have been assessed as suitable for LSTs
- operators have adopted a range of different approaches to drivers’ LST training
- many operators seek to ensure that LSTs are operated by drivers who do so regularly, and in some cases, on repeated routes
During 2018 and 2019, we carried out conversations with 11 operators to further explore the special provisions they have adopted to ensure safe and efficient use of their LSTs.
More detail on the process used in this work and the industry partners involved can be found in the 2019 Annual Report (Annex 5).
This led to a document summarising the main issues that operators have actually implemented, or, from their trial experience, they believe will be important in future. This is intended to provide a starting point for further consultation with industry to refine the issues into an agreed document as the basis for a range of potential uses.
The document is presented in full in the 2019 Annual Report (Annex 6) and as a stand-alone industry-led summary of good practice alongside this summary report.
It addresses different stakeholder interests as follows:
- A) business decisions
- B1) training and awareness – drivers
- B2) training and awareness – other roles
- C1) operational processes – routing
- C2) operational processes – depot assessment
- C3) operational processes – warehousing/supply chain
- D) equipment and maintenance
- E) depot infrastructure
- F) specifying LSTs – design choices
Issues are marked to indicate the primary area of benefit or risk they influence as follows:
- Safety / Damage
- Efficiency (journey savings) / Emissions
- ROI (return on investment)
A difficult factor to evaluate is the effect of the additional scrutiny of being on the trial, beyond noting that this will have had some effect. From our interactions with operators, we hear an expectation that LSTs should always be treated by operators as special equipment. This is already the case for double-deckers, ISO carriers and other less common designs, which are subject to some special treatment within their fleet management.
Using these insights from operators
Introducing and managing LSTs: an industry-led summary of good practice is not a ‘finished product’ – nor at this stage has the DfT determined exactly how it will be used.
The purpose of this initial version is to provide the foundation for any of the following as the DfT and industry deems would be most valuable and effective:
- a guidance or good practice guide for potential LST operators
- the core of future training content for drivers and other staff in relation to LSTs
- awareness-raising for company owners, directors and other stakeholders
- a starting point for any policy makers, industry or government stakeholders charged with defining or executing any regulatory role in relation to LST operations
- a source for freight sector analysts and researchers interested in the issues and parameters affecting the operation of LSTs – and potentially any other high-volume ‘special designs’ as part of an overall system
While much of the evaluation work performed on the trial has necessarily focused on the quantitative assessment of the efficient and safe use of the trailers, this new summary of good practice should be seen as an equally important output from the trial.
It captures what operators, who have hands-on experience with LSTs, have told us has formed the basis of their safe and efficient adoption of the trailers.
In terms of any future operation of LSTs, we believe that this document – based on real-world operational experience of the trailers – forms one of the most important tangible outputs from the trial as a whole.
Recommendation: refinement and publication of industry insights
Risk Solutions have recommended that Introducing and managing LSTs: an industry-led summary of good practice](/government/publications/longer-semi-trailer-trial-evaluation-annual-report-2019/introducing-and-managing-lsts-an-industry-led-summary-of-good-practice) (also published as part of the Annual Report 2019 (Annex 6)) be used as the foundation for further DfT and industry-led discussion with the aim of:
- a) refining the content based on input from a wider selection of relevant stakeholders
- b) adding prioritisation of measures, where possible, based on industry experience and consensus
- c) agreeing the most appropriate format(s) for publication (where and by which body)
While policy decisions lie outside the scope of this evaluation, Risk Solutions recommend that any policy or regulatory system should include some reference to this new document, containing good operational practice to be used by operators and any other relevant industry representatives or regulatory bodies.
Tractor unit with longer semi-trailer in the livery of Malcolm logistics
7. What proportion of the existing GB fleet of semi-trailers might be replaced by LSTs, were numbers not restricted?
In 2016, we carried out a survey of operators to explore the numbers of LSTs that may be taken up by the trial operators, were LSTs to become widely available at some point in the future.
Operators were asked to make 2 take-up estimates:
- the first assuming today’s infrastructure (mainly depot and yard designs, but also manufacturing bases)
- the second, assuming some future date when some newer depots would have been designed or modified to better accommodate the longer trailers
The data gathered showed some logical patterns, with higher take-up estimates made by those with the most control over their load sizes and those involved in longer distance movements between large distribution sites, where the benefits of additional capacity are greatest.
During 2018 we continued to gather information on potential take-up as part of our conversations with selected operators. The following table shows our latest estimate of take-up (for the operators on the trial). This is based on our 2016 data, with some small adjustments resulting from the recent conversations.
This gives a broad indication of the potential take-up in different sectors of the freight industry – where the specific goods involved are sufficiently light (low density) that a full LST load can be carried within the national 44-tonne weight limit.
LST take-up projections by goods type: % of current fleet that trial participants might replace, over time, with LSTs – by goods type carried
| Goods type | With current infrastructure | With future infrastructure |
|---|---|---|
| 1) Empties/waste packing | 26% | 31% |
| 2) Fast-moving consumer goods (FMCG) (mixed products) | 23% | 33% |
| 3) FMCG (single product) | 14% | 20% |
| 4) Raw material/supplies | 28% | 35% |
| 5) Industrial products | 21% | 28% |
| 6) Biomass/fuel | 10% | 22% |
| 7) Mail/parcels | 14% | 22% |
| 8) Other – retail | 39% | 63% |
| 9) Other – non-retail | 3% | 7% |
| 10) Pallets – mixed/unknown | 21% | 35% |
Note: The take-up figures are distance-weighted averages for each operator based on the total km travelled carrying each good type.
Scaling up
During 2019 and the first half of 2020, we have completed a scaling model designed to enable the DFT to apply the trial results appropriately to the national freight statistics to estimate the potential impact of LSTs if they were made available in larger numbers.
The scaling process takes a reference year of data from the Continuing Survey of Road Goods Transport (CSRGT) and models what that same year of freight movements might have looked like, if relevant segments of the work had been carried out using LSTs in place of standard 13.6m trailers, reducing the distance travelled for the same outcome.
Savings in vehicle km, emissions and safety are estimated using scaling factors derived from a statistical analysis of the trial data.
The model generates future projections of distance, emissions and injury savings that might be made in future years, taking into account estimates of future LST take-up and overall freight demand growth. The model provides for sensitivity analysis based on variation of the savings and take-up assumptions, and exploration of different future scenarios.
The results of the modelling do not form part of this evaluation, but rather the model is designed for use by the DfT in their policy explorations and impact analysis when they reach that point in the trial process.
A full description of the model is presented in the 2019 Annual Report for readers who are interested in studying it further, with technical details of steps such as the statistical data analysis being given in report annexes.
What next for the trial?
Evaluation work led by Risk Solutions to address the 7 key evaluation questions is now substantially completed.
Work continues on:
- 2020 data collection: with a particular focus on data submissions from companies who have joined the trial in the last 12 to 18 months
- the process of digitising the ‘model reports’, which detail each new LST chassis design presented (by the manufacturer) to the VCA for testing before it can be delivered to the end user and operated on the trial. The testing covers a range of measurements and driving tests to ensure the design is fully compliant with the requirements set down for LSTs at the start of the trial. These reports are currently held in PDF format by VCA.
- adjusting the processes, alongside the DfT and VCA (with input from DSVA), for bringing new operators into the trial and for granting VSOs, to better track the passage of trailers from their original owner into the second-hand market (sometimes via a leasing company)
Risk Solutions continue to advise the DfT on appropriate application of the trial evidence in their policy discussions.
Tractor unit and longer semi-trailer in the livery of Firmin distribution
Department for Transport
The Department for Transport (DfT) is the government department responsible for the English transport network and a limited number of transport matters in Scotland, Wales and Northern Ireland that have not been devolved. DfT began the GB trial of longer semi-trailers for articulated goods vehicles in January 2012 and is responsible for the trial as a whole, including the allocation of trial places to companies applying to participate.
The evaluation of the trial is funded by DfT under the Specialist Professional and Technical Services (SPaTS) framework, but is carried out by independent consultants.
For further details on the trial, or to request a copy of the full version of the report, contact the DfT trial project manager:
Martin Placek
Policy Adviser, Freight Operator Licensing and Roadworthiness
Freight Operator Licensing and Roadworthiness,
Department for Transport
Great Minster House, 33 Horseferry Road
London, SW1P 4DR
- Email: freight@dft.gov.co.uk
- Tel: 07977 436 767
Risk Solutions
Risk Solutions is a specialist management consultancy working in the areas of risk, evaluation and decision support, with specialist expertise in industry engagement and working with complexity and high degrees of uncertainty.
Risk Solutions has been involved in policy evidence development, preparation of impact assessments and evaluations for DfT, Department for Environment, Food and Rural Affairs (Defra), Department of Business, Energy and Industrial Strategy (BEIS), and other government departments and private companies.
Risk Solutions was commissioned by DfT in 2012 to help design and implement the LST trial evaluation process and has since been reappointed twice in the role of independent evaluator.
For further details of Risk Solutions’ services, including the evaluation of the trial, follow the link below or contact:
Dr V Paul Brand
LST Trial Evaluation Manager
Dallam Court, Dallam Lane
Warrington WA2 7LT
- Email: paul.brand@risksol.co.uk
- Tel: 07968 107 141
- Web: www.risksol.co.uk
WSP
WSP is one of the world’s leading engineering and professional services consulting firms with over 43,000 talented people in more than 500 offices across 40 countries, 7,800 of which are based in the UK.
WSP supplies services to DfT and Highways England under the SPaTS Framework Contract, using a consortium of in-house skills and carefully selected partners, including Risk Solutions.
WSP has a dedicated logistics team that combines technical skills in modelling and analysis with a depth of knowledge based on real life operational experience in the logistics and supply chain sector.
For further details of WSP’s services in the Freight and Logistics Sector, follow the link below or contact:
Nasar Malik
Director
WSP House, 70 Chancery Lane
London WC2A 1AF
- Email: nasar.malik@wsp.com
- Tel: 07834 506 154
- Web: www.wsp.com/en-GB
Please note
Communication from trial participants regarding data collection issues should be directed to the trial email address: LSTTrial@risksol.co.uk. Any questions relating to the conduct of the trial should be directed to the DfT.