Local authority and children’s homes in England inspection outcomes as at 30 September 2016: key findings
Updated 16 December 2016

© Crown copyright 2016
This publication is licensed under the terms of the Open Government Licence v3.0 except where otherwise stated. To view this licence, visit nationalarchives.gov.uk/doc/open-government-licence/version/3 or write to the Information Policy Team, The National Archives, Kew, London TW9 4DU, or email: psi@nationalarchives.gov.uk.
Where we have identified any third party copyright information you will need to obtain permission from the copyright holders concerned.
This publication is available at https://www.gov.uk/government/statistics/local-authority-and-childrens-homes-in-england-inspection-outcomes-as-at-30-september-2016/local-authority-and-childrens-homes-in-england-inspection-outcomes-as-at-30-september-2016
This release covers:
- Inspection outcomes for local authority children’s services inspections from 01 November 2013 to 30 September 2016, published by 31 October 2016
- Inspection outcomes for all children’s homes between 01 April 2016 to 30 September 2016, published by 31 October 2016
- Inspection outcome of most recent inspection, for all children’s homes, as at 30 September 2016 and published by 31 October 2016
The judgement profile of local authorities (LAs) has improved.
Under the framework for inspecting services for children in need of help and protection, children looked after and care leavers (SIF), there has been an increase to 28% of LAs judged to be good or better at 30 September 2016, from 26% at 31 March 2016. There has also been a decrease in LAs judged inadequate from 24% to 23%.
There are now LAs in every region judged to be good under the SIF.
Cornwall and the Isles of Scilly achieved overall effectiveness judgements of good, meaning the South West now has LAs judged good or better for the first time.
The state of the nation picture for children’s homes continued the trend of an increasing proportion of homes judged good or better.
At 30 September 2016, 81% of homes were judged good or better. This is an increase from 79% at 31 March 2016 and 75% at 30 September 2015.
Homes inspected in the north had better inspection outcomes than homes in the midlands or south, between April and September 2016.
Inspections in the north resulted in 81% good or better judgements. The midlands had 72% and the south 66%.
A large majority of homes judged inadequate in their first full inspection between April and September 2016 improved at their subsequent re-inspection.
Of the 54 homes judged inadequate, just under three quarters (39 homes) improved, 16 of which improved to good.
1. Introduction
This release contains data on children’s homes inspections, local authority inspections and Local Safeguarding Children’s Board (LSCB) reviews. Children’s homes all receive a full and an interim inspection on an annual cycle and may receive additional concern driven inspections.
Children’s homes are made up of three different sub types of homes:
- Children’s homes: these are most of the homes in England and are defined as any home that does not fall within the other two sub types below, that is, is not a residential special school registered as a children’s home and is not a secure children’s home
- Residential special school registered as a children’s home: these are residential schools, which due to the number of days they look after children, must register as children’s homes[footnote 1]
- Secure children’s homes[footnote 2]
Ofsted also inspects the 152 local authorities (LAs) in England responsible for ensuring and overseeing the effective delivery of social care services for children.
Her Majesty’s Inspectors (HMI) conduct these inspections of local authority services for children who need help and protection, children looked after,[footnote 3] and care leavers, under the single inspection framework (SIF).[footnote 4] This inspection cycle began in November 2013 and will conclude by December 2017.
In addition to the SIF, and conducted at the same time, HMI conduct reviews of the Local Safeguarding Children Boards that are responsible for safeguarding, and promoting the welfare of, children.[footnote 5]
2. Inspection of local authority children’s services
There are approximately 11.7 million children living in England, of whom just over 3 per cent are involved with children’s services (classified as children in need). [footnote 6] At 31 March 2016, there were 394,400 children in need, of which 70,440 were children looked after and 50,310 were on a child protection plan [footnote 7]. Just over three quarters of these children lived in LAs which have been inspected under the SIF framework.
2.1 Overall effectiveness from November 2013 to September 2016
There were 109 SIF inspections published by 31 October 2016, see Chart 1.[footnote 8]
This makes up almost three quarters of the 152 LAs in England, which together are responsible for children’s social care across the country. The picture, therefore, is still only a partial one and is not necessarily completely representative of the quality of services for all LAs in the country; however, it is a fuller picture than previously given in the July 2016 publication, when only 57% of authorities (87) had been inspected.
The inspection judgements in the period led to an improved judgement profile with 28% of LAs now judged good or better for overall effectiveness (up from 26% at 31 March 2016).
The proportion of authorities judged requires improvement to be good was 50% and the percentage judged inadequate was 23% (down from 24% at 31 March 2016).
Chart 1: SIF overall effectiveness from November 2013 to September 2016
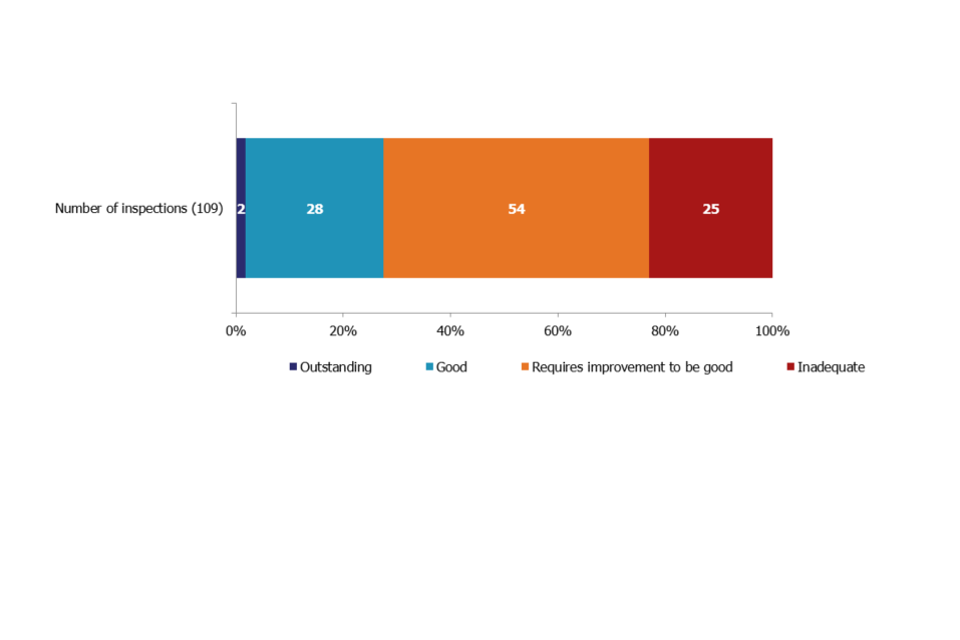
Chart 1
Whilst 72% of authorities had been inspected, they included among them some of the very largest in England. Consequently, the 109 were responsible for 77% of vulnerable groups of children in the country.[footnote 9]
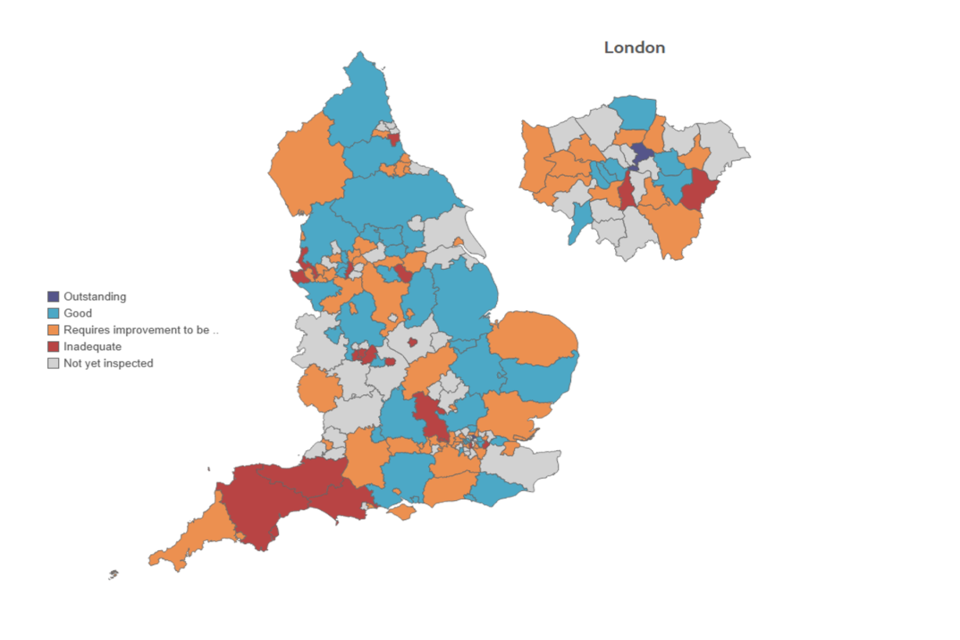
Map 1: SIF inspection overall effectiveness judgements from November 2013 to September 2016
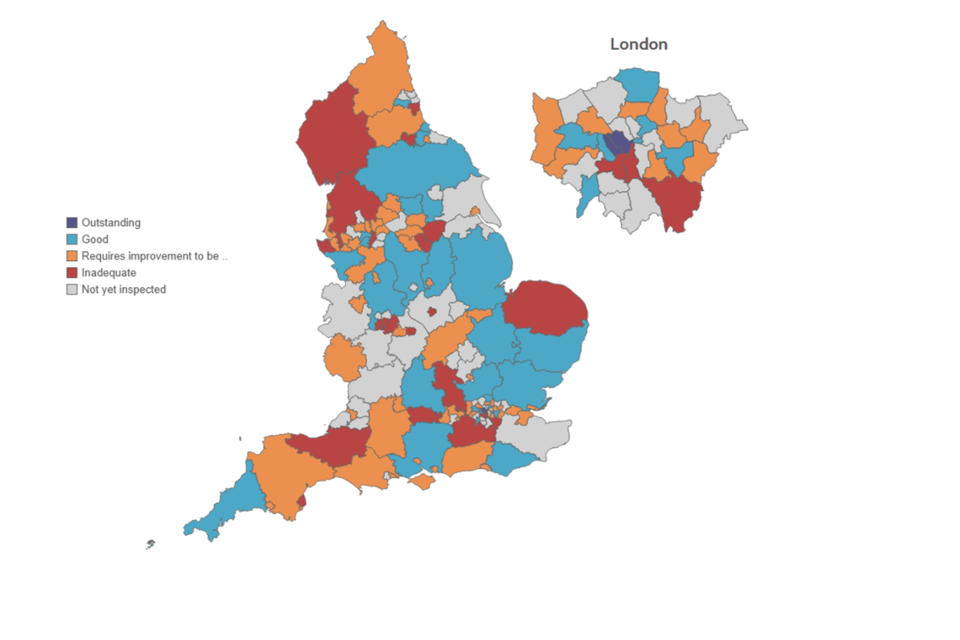
Map 1
2.2 Key judgements from November 2013 to September 2016
The overall effectiveness judgement for the SIF is derived from 3 key judgements:
- the experiences and progress of children who need help and protection
- the experiences and progress of children looked after and achieving permanence[footnote 10]
- leadership, management and governance
The most positive key judgement was leadership, management and governance, with eight authorities judged outstanding. The majority of these were in the south (four in London and one in the South East). However, whilst more authorities were judged outstanding for leadership, management and governance than for the other key judgements, 22 authorities were judged inadequate.
Children who need help and protection, which is acknowledged to be the hardest area of work for an LA to get right, was the area of weakest performance for the inspected authorities, with over half judged requires improvement to be good (60 authorities) and one fifth (22 authorities) judged inadequate.
Children looked after and achieving permanence was the only judgement of all key and sub-judgements, including overall effectiveness, for which the proportion of authorities judged good or better dropped since we reported on SIF inspection outcomes published as at 31 March 2016.
Chart 2: SIF key judgements from November 2013 to September 2016
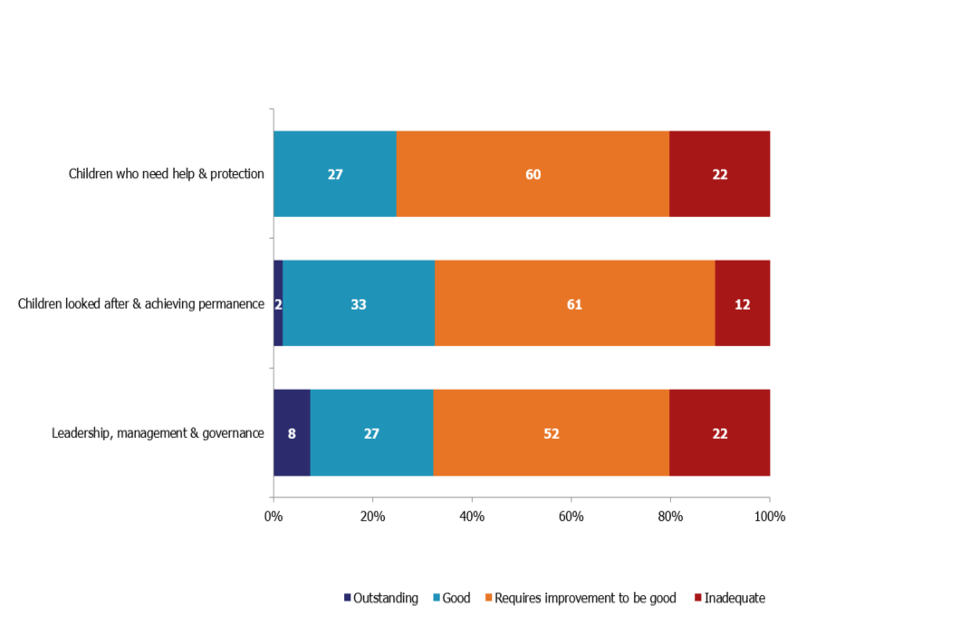
Chart 2
There were three LAs judged inadequate in all of the key and sub-judgements: Birmingham, Sunderland and – since we last reported on SIF inspection outcomes published as at 31 March 2016 – Bromley.[footnote 11],[footnote 12]
An additional 6 authorities were judged inadequate for each of the 3 key judgements: Buckinghamshire, Rotherham, Slough and Somerset plus – since we last reported on SIF inspection outcomes published as at 31 March 2016 – Dudley and Reading.
2.3 Children looked after and achieving permanence sub-judgements (adoption and care leavers) from November 2013 to September 2016
The key judgement area children looked after and achieving permanence has 2 sub-judgements: adoption performance, and experiences and progress of care leavers.
Adoption performance was by far the area of strongest performance for LAs, across all judgements, with over half (59) of all inspected authorities judged good or better.[footnote 13] (Chart 3)
A total of 7 LAs were judged outstanding for adoption performance. There were 8 authorities judged inadequate, which is 2 more than when we reported on published SIF inspection outcomes as at 31 March 2016. Of these 8, 7 were also judged inadequate for overall effectiveness, with the other authority judged requires improvement to be good.
Chart 3: SIF adoption performance sub-judgement from November 2013 to September 2016
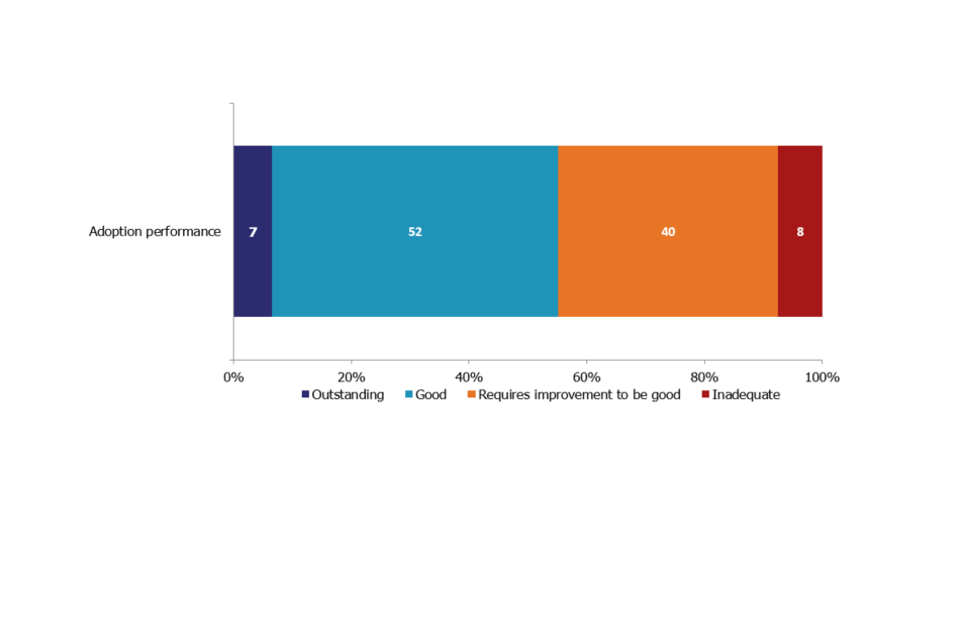
Chart 3
Experiences and progress of care leavers was also a strong area of performance for LAs, when comparing judgements across all key and sub-judgements.
There were 5 authorities judged outstanding for experiences and progress of care leavers and 37 were judged good, meaning that nearly two fifths of inspected authorities were judged good or better. (Chart 4)
Of the 14 authorities judged inadequate in this sub-judgement, 4 had a requires improvement to be good judgement for overall effectiveness with the remainder judged inadequate.
Chart 4: SIF experiences and progress of care leavers sub-judgement from November 2013 to September 2016
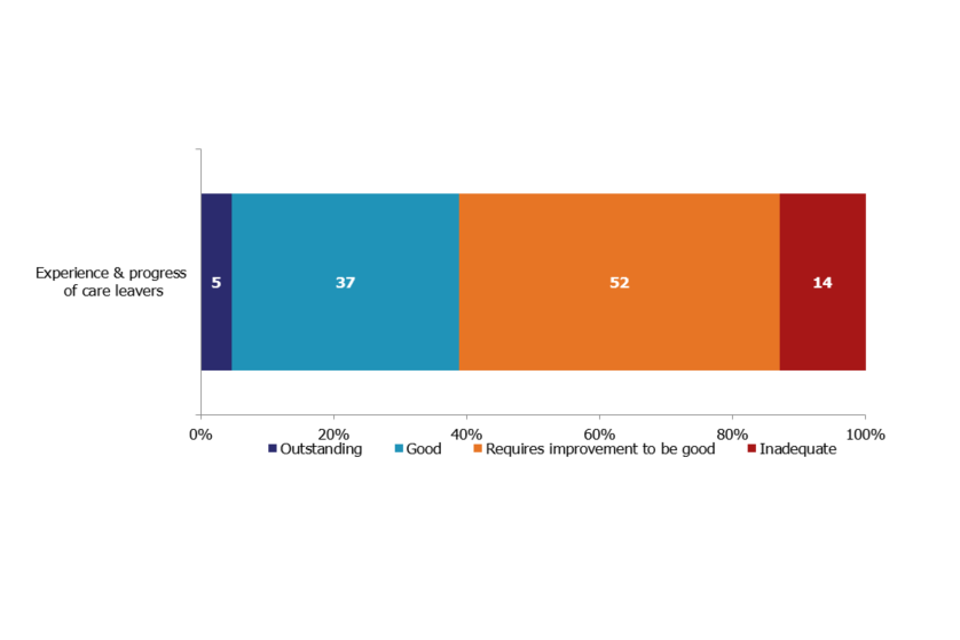
Chart 4
2.4 Outcomes by local authority type and location for overall effectiveness from November 2013 to September 2016
Each region in England varies in terms of geographical size and the number of LAs within it. Not all regions have yet been inspected proportionate to the number of authorities within them. The regional picture is, therefore, contingent on those inspections already completed and so is not necessarily yet an accurate reflection of the overall picture of the region, which may improve or worsen over time, and the current data needs to be considered in that light. There is no conclusive evidence, so far, that the region in which a LA is situated has an impact on inspection outcome.
The 30 authorities judged good or better for overall effectiveness are now spread across all 9 regions, with the first 2 good outcomes in the South West – in Cornwall and in Isles of Scilly – occurring in the first 6 months of 2016-17. The 25 authorities judged inadequate also cover all 9 regions. (Chart 5)
Of the 9 regions, only 4 so far had more than 20% of their authorities judged good or better for overall effectiveness – the East Midlands (50%), the East of England (44%), London (43%) and the North East (38%). The proportion for London had been boosted by good outcomes at 4 out of 5 inspections of London authorities in the first 6 months of 2016-17. The West Midlands had the lowest proportion, with just one of its 9 inspected authorities (11%) being judged good or better.
The region with the greatest proportion of inadequate judgements was the West Midlands (44%), while at the other end of the spectrum, the East of England only had 11% of inadequate judgements.
Chart 5: SIF overall effectiveness judgements, by region
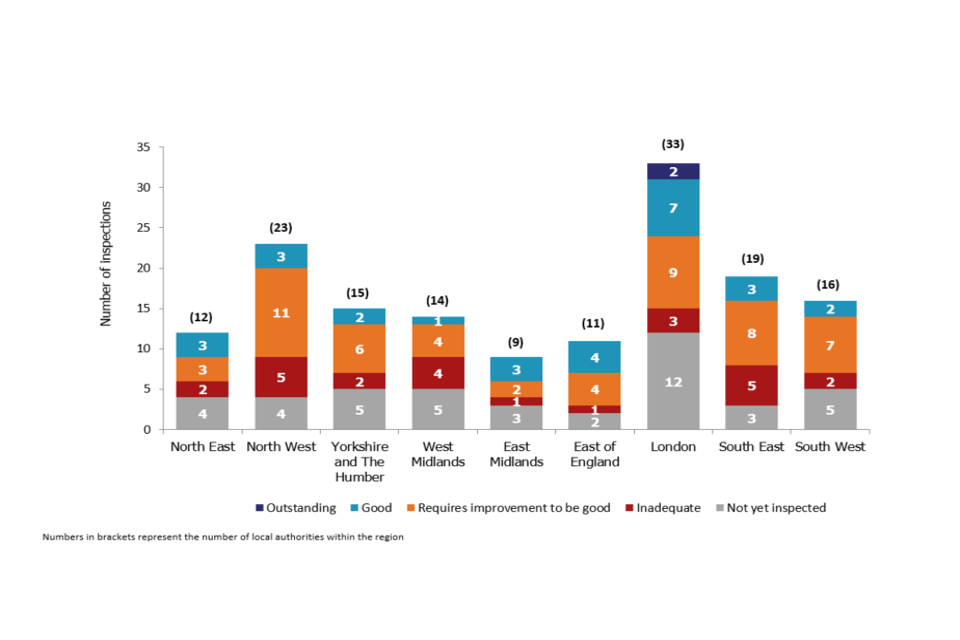
Chart 5
Two fifths (12) of those authorities judged good or better for overall effectiveness were shire counties; and nearly a third (nine) were London boroughs.[footnote 14] Five were unitary authorities and four were metropolitan districts. Both of the authorities judged outstanding were London boroughs. [footnote 15]
Of the 25 authorities judged inadequate, two fifths (10) were metropolitan districts, a quarter (six) were shire counties, a quarter (six) were unitary authorities and three were London boroughs.
Across England, 23% of children in need lived in LAs judged good or better. The East of England had the highest percentage of their children in need in good or better authorities (48%). (Chart 6)
In England, 22% of children in need lived in LAs judged inadequate. The West Midlands had the highest proportion of their children in need in inadequate authorities (41%) and the East Midlands had the lowest (9%).
While all regions had some correlation between the proportion of LAs judged a particular grade and the percentage of children looked after in those LAs, there were some anomalies. The East of England had 11% of their inspected LAs judged inadequate, but 28% of their children in need living in those inadequate LAs. Conversely the North East had 38% of their inspected LAs judged good, but only 21% of their children in need living in those good LAs.
Chart 6: Percentage of children in need by SIF overall effectiveness judgement
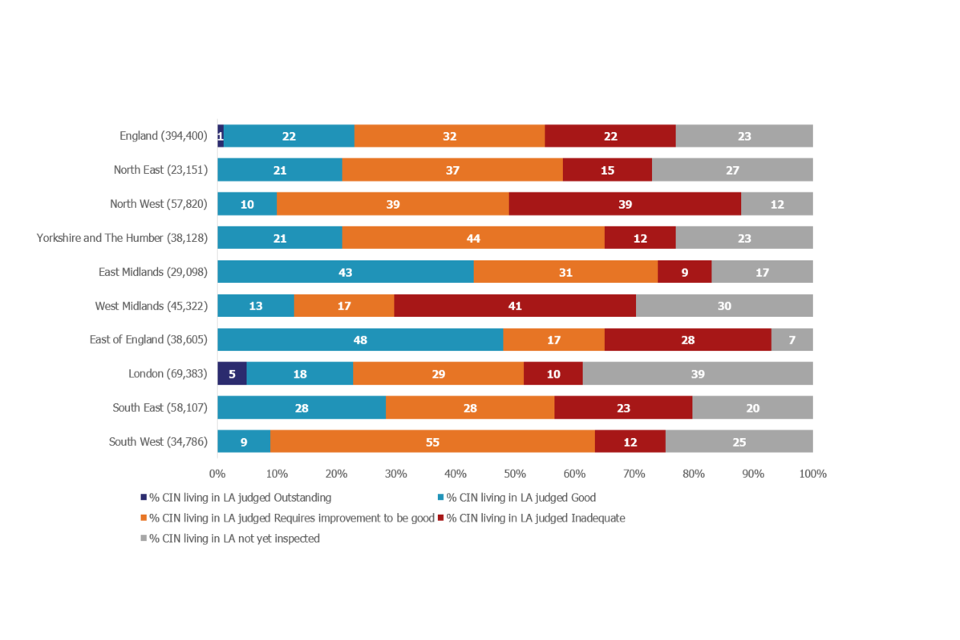
Chart 6
2.5 Inspections of local authorities: some comparisons
Because of the different frameworks used to inspect LAs since 2009, it is difficult to compare the SIF overall effectiveness judgement with those from previous inspection frameworks. The terminology changed from adequate judgements, in LA inspections prior to 2013, to requires improvement to be good judgements, from 2013 onwards, in the SIF.
There are two key judgements in the SIF inspections, though, where it is possible to draw some comparisons to a previous inspection judgement:
- children who need help and protection with the Child Protection inspection outcomes[footnote 16]
- children looked after and achieving permanence with the Looked After Children inspection outcomes[footnote 17]
It should be noted that a comparison of the children who need help and protection key judgement with the Child Protection judgement, as shown in Chart 7 below, is based on the fact that only a third of authorities (50) received a Child Protection inspection prior to the introduction of the SIF and, of those, only 39 have been inspected under the SIF. As such, it is difficult to draw really robust conclusions about change over time.
Of these 39 authorities, 18 authorities saw an improvement; just 5 declined. Sixteen authorities remained the same.
All but one of the 23 authorities that improved or declined did so by one grade: from inadequate to requires improvement to be good, for example. Only one authority (Royal Borough of Kingston upon Thames) improved by more than one grade, from inadequate to good. All 5 authorities that declined changed from adequate to inadequate.
None of the 39 authorities to receive both a Child Protection inspection and a SIF inspection were judged outstanding for either the Child Protection judgement or the children who need help and protection key judgement. However, 4 authorities were judged inadequate for these judgements at both inspections.
Chart 7: Children who need help and protection judgements, change from previous inspection judgement
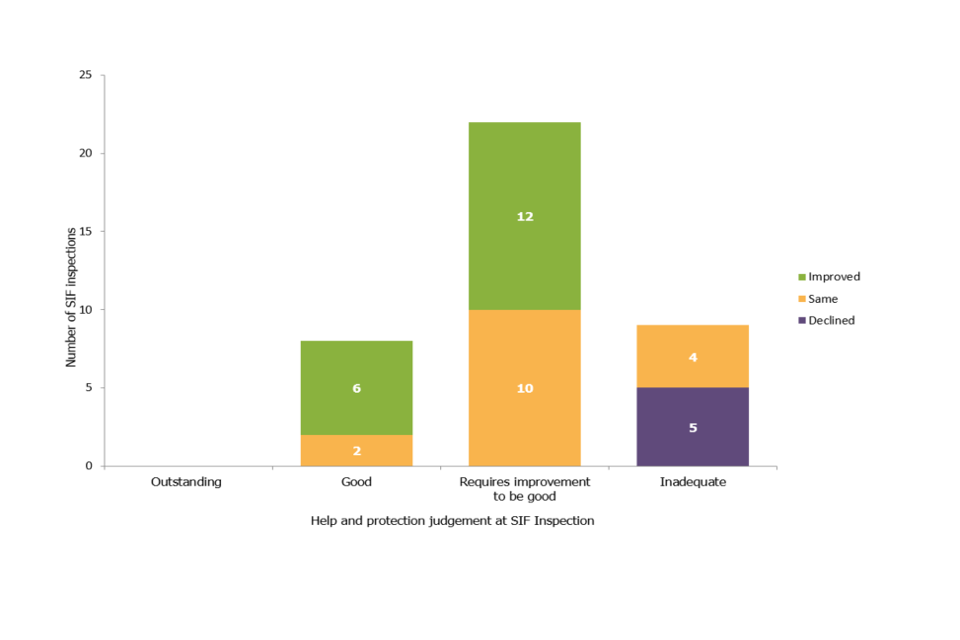
Chart 7
Chart 8 below shows a comparison of the children looked after and achieving permanence key judgement with the Looked After Children judgement.
Under the SIF, 21 authorities improved, while 40 authorities declined.
Almost three quarters of the improving authorities (15 of 21) improved to good from adequate. Four authorities improved from inadequate to requires improvement to be good, and the final 2 improved from good to outstanding (Royal Borough of Kensington and Chelsea, and Westminster).
Of the 12 authorities judged inadequate for children looked after and achieving permanence, 7 had declined from adequate, 3 from good and one (Lambeth) from outstanding. One (Norfolk) had remained inadequate. Almost half (29) of the 61 authorities judged requires improvement to be good for children looked after and achieving permanence had declined since their last inspection, all of them from good.
Of the 5 authorities judged inadequate at their last inspection, all except Norfolk improved to requires improvement to be good when inspected under the SIF.
Chart 8: Children looked after and achieving permanence judgements, change from previous inspection judgement
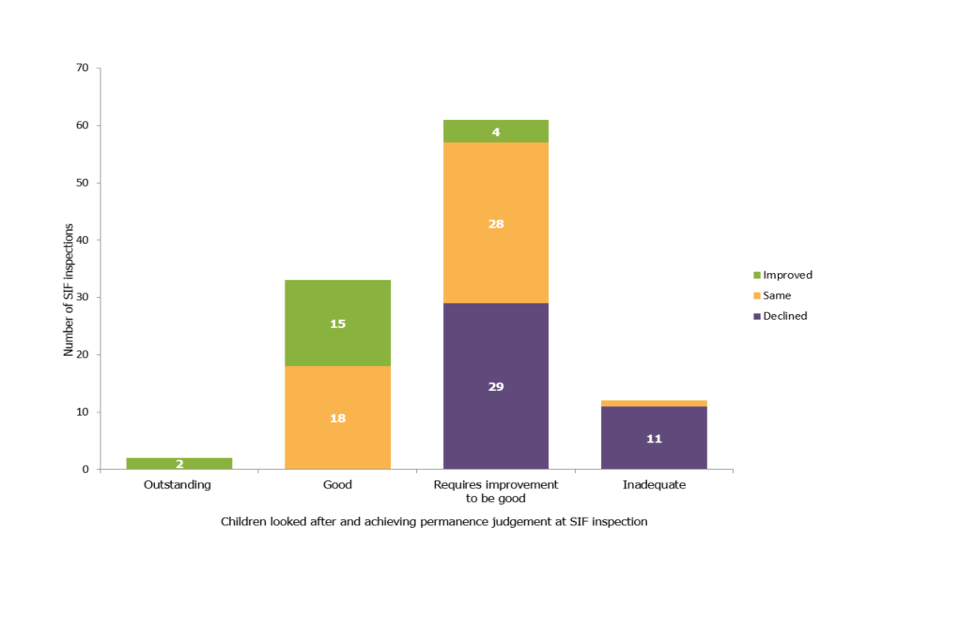
Chart 8
3. Reviews of local safeguarding children boards
Ofsted conducts reviews of Local Safeguarding Children Boards (LSCBs) alongside the SIF inspections of LA children’s services. The performance of the LSCB should influence the performance of the LA and we have found some correlation between the two. This review arrangement has been in place since November 2013.
3.1 Overall effectiveness from November 2013 to September 2016
There had been 109 reviews of LSCBs published by 31 October 2016. As with the SIF inspections, the picture is still only a partial one and is not necessarily representative of the quality of all LSCBs in England.
For the first time since the start of the LSCB review arrangement, 2 authorities (City of London and Hackney) had been judged outstanding. In both instances, children’s services were judged good under the SIF. (Map 3)
Of the 35 authorities judged good for LSCB overall effectiveness, just over half were judged good (18) or outstanding (2) under the SIF. The remainder were judged requires improvement to be good (14) or inadequate (1).
Of the 19 authorities judged inadequate for LSCB overall effectiveness, more than three quarters (15) were also judged inadequate under the SIF. The remaining 4 authorities were judged requires improvement to be good under the SIF.
Map 2: Overall effectiveness judgements for LSCB reviews from November 2013 to September 2016
Map 2
The grade profiles for LSCB reviews and SIF inspections were similar. However, it is worth noting that the SIF and LSCB overall effectiveness judgements matched in just under two thirds of inspections and reviews.
The pattern of LSCB overall effectiveness was similar to the children in need of help and protection key judgement for LAs. All LSCBs judged good were within authorities where the help and protection judgement was good or requires improvement to be good, with the exception of Lancashire, which was judged inadequate for help and protection. Almost three quarters of the LSCBs judged inadequate (14 out of 19) were in LAs with an inadequate help and protection judgement; the remaining five (Bexley, Devon, Dorset, Lambeth and Sefton) were judged requires improvement to be good for help and protection. (Chart 9)
Chart 9: LSCB overall effectiveness and SIF Children in need of help and protection judgements
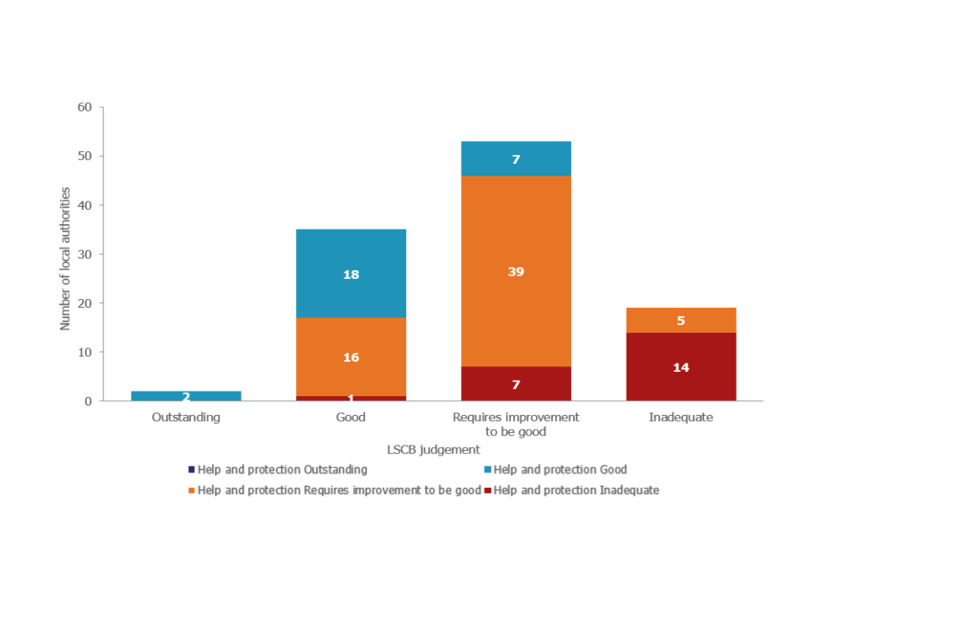
Chart 9
4. Overall effectiveness for all children’s homes
There are 2 ways to look at information about overall effectiveness[footnote 18],[footnote 19]:
- in year/period: this looks at all inspections that took place in a set period of time; in this release that period is between 1 April 2016 and 30 September 2016; this will include providers that closed before the end of the period, and for some providers will include more than one inspection;[footnote 20] some providers will be excluded, as they were not inspected in the period [footnote 21]
- state of the nation: this looks at all providers active on 30 September 2016 and what their most recent inspection judgement was at this date; for each provider, only their most recent full inspection is included; providers inspected prior to 1 April 2016, but not since, will have their previous judgement included
This section looks first at the ‘In period’ picture of all inspections within a 6 month period, and then at the ‘State of the nation’ in terms of homes as at 30 September 2016.
4.1 Children’s homes inspections in period, 1 April 2016 to 30 September 2016
Between 1 April and 30 September 2016, there were 1,196 inspections of children’s homes. This was an increase of 14% from the equivalent period in 2015, when 1,053 inspections took place. The increase was due to a new inspection framework starting in April 2015, which in turn led to a later start to the inspection cycle that year (May 2015), in order to accommodate training and other activities.[footnote 22] (Chart 10)
There had been a small increase in the percentage of good or better inspection judgements, from 71% in the equivalent period in 2015, to 73% in 2016.
The percentage of homes judged inadequate also increased, from 6% (67 homes) in 2015 to 9% (110 homes) in 2016.[footnote 23]
Chart 10: Children’s homes overall effectiveness judgements 1 April 2016 to 30 September 2016
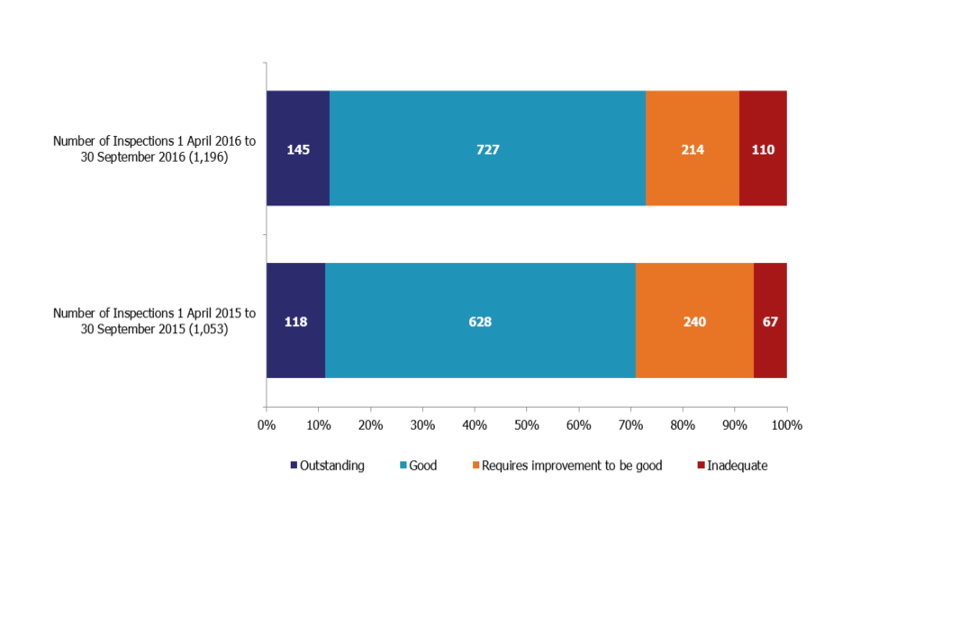
Chart 10
The majority of the inspections (1,126 or 94%) were of children’s homes; 57 (5%) were of residential special schools registered as children’s homes; and 13 (1%) of secure children’s homes. (Chart 11)
Of the 3 sub types of children’s homes, residential special schools registered as children’s homes had the poorest grade profile across the 6 month period, with only 63% of inspections resulting in a good or better inspection judgement.
Chart 11: Children’s homes overall effectiveness judgements 1 April 2016 to 30 September 2016, by sub types of homes
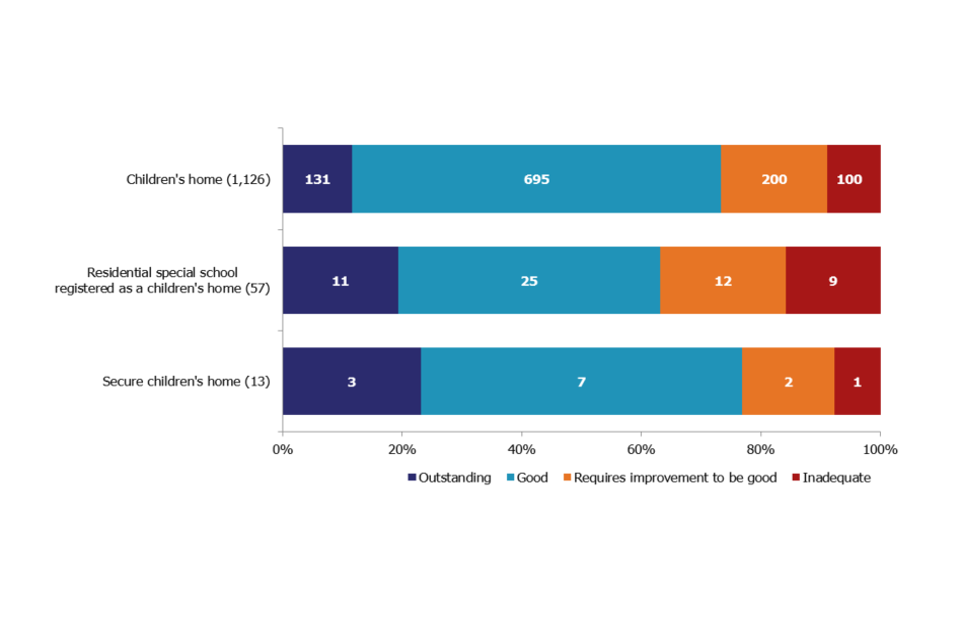
Chart 11
Fifty-four homes had 2 full inspections in the 6 months, all of which were judged to be inadequate at their first inspection in the period. Just under three quarters (39 homes) improved at their second inspection, with 16 improving to good. A little over a quarter (15 homes) remained inadequate at their second inspection; by 30 September, 3 of these had resigned their registration.
4.2 Overall effectiveness for all children’s homes inspections – change since last inspection
Of the 1,196 inspections in the period, 1,050 were of homes that had been previously inspected, and so can be compared to their last inspection outcome in the previous inspection period. [footnote 24]
The proportion of homes judged to have stayed the same was 56%, with 22% having improved and the same percentage having declined. (Chart 12)
Almost all homes judged inadequate (99%) declined to this grade, as homes judged inadequate are re-inspected within shorter timeframes. This policy towards inadequate homes gives them an opportunity within a relatively short amount of time to show improvement or, if not, Ofsted takes further steps, including the possibility of the cancellation of their registration.
Chart 12: Change to overall effectiveness judgement compared to previous inspection
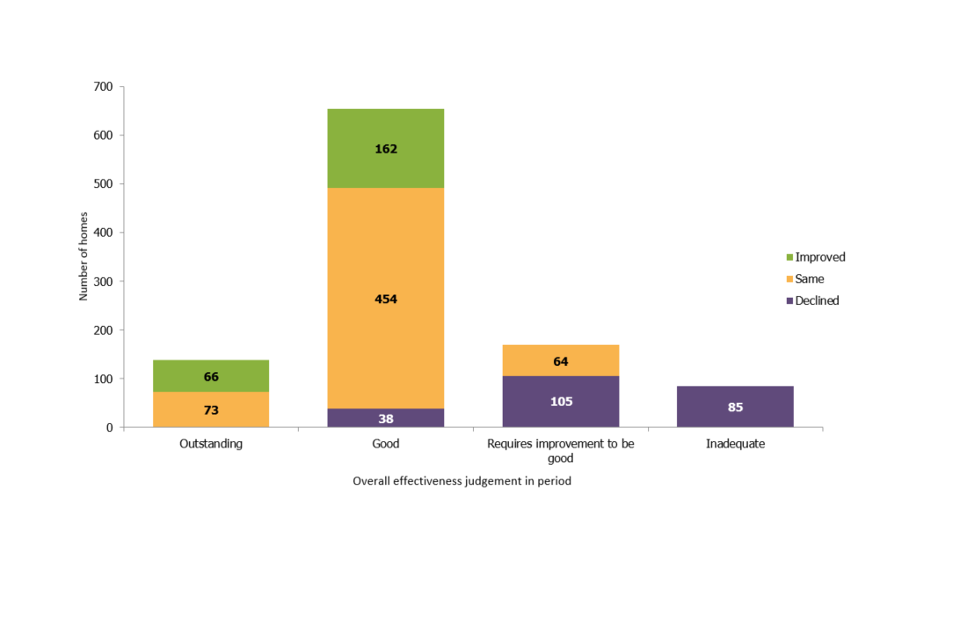
Chart 12
Of the 458 inspections which resulted in a change of overall effectiveness judgement, the majority (88%, 403) changed by only one grade. One home changed by 3 grades from outstanding to inadequate; this was predominantly as a result of a wide range of safeguarding failings.
The judgement profile of homes inspected in the period, which had not been previously inspected, was poorer than homes which had previously been inspected. For newly registered, or re-registered, homes, 69% of inspections resulted in good or better judgements, compared to 73% for all inspections in the period.
4.3 Sector data for all children’s homes in period, 1 April 2016 to 30 September 2016
Local authority-run homes had the highest percentage of good or better inspections in the period, at 76%, though there was very little difference between the 3 sectors (72% of private homes judged good or better, 75% of voluntary). (Chart 13)
Privately-run homes were least likely to be judged outstanding (10%), compared to 17% of LA-run and 18% of voluntary-run homes. Private homes were also most likely to be judged inadequate (10%) and accounted for the vast majority of the homes that were judged inadequate twice in the period (80%, 12 of 15 homes).
Chart 13: Children’s homes overall effectiveness 1 April 2016 to 30 September 2016, by sector[footnote 25]
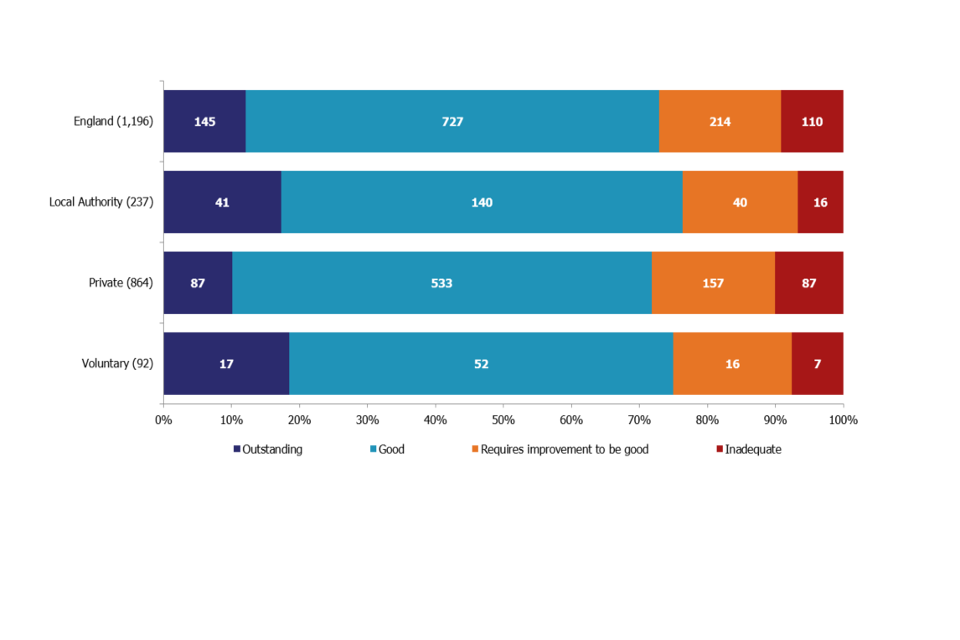
Chart 13
There were some notable changes from the equivalent 6 month period in 2015. In particular:
- the proportion of LA-run homes judged good or better increased by 4 percentage points (from 72% to 76%)
- the proportion of voluntary-run homes judged outstanding increased by 4 percentage points (from 14% to 18%)
- the proportion of privately-run homes judged inadequate increased by 4 percentage points (from 6% to 10%)
When looking at sector data in terms of regional performance, there were 2 regions where there was more than a 10 percentage point gap between the inspection judgements of LA-run homes, and private and voluntary-run homes. In London 93% of the inspections of LA homes resulted in good or better judgements, compared to 61% of private and voluntary homes, albeit with a very small number of homes. Similarly in the East of England, inspections of LA homes resulted in 76% being judged good or better, compared to 64% of private and voluntary homes. (Maps 4 and 5)
Map 3: Inspections of LA-run children’s homes resulting in a good or better overall effectiveness judgement, by region, 1 April 2016 to 30 September 2016
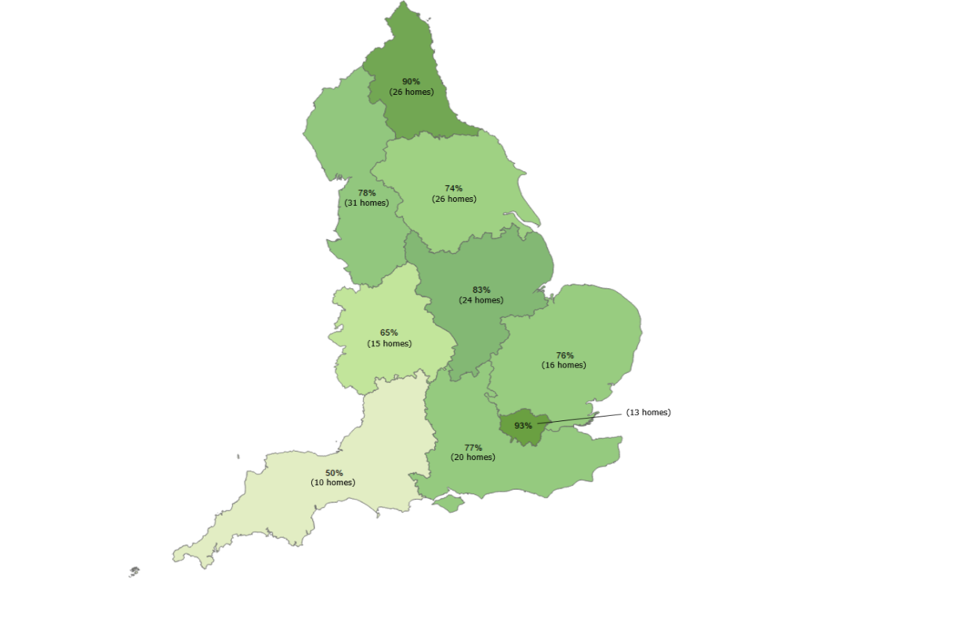
Map 3
Map 4: Inspections of private and voluntary-run children’s homes resulting in a good or better overall effectiveness judgement, by region, 1 April 2016 to 30 September 2016
Map 4
4.4 Regional outcomes for all children’s homes in period, 1 April 2016 to 30 September 2016
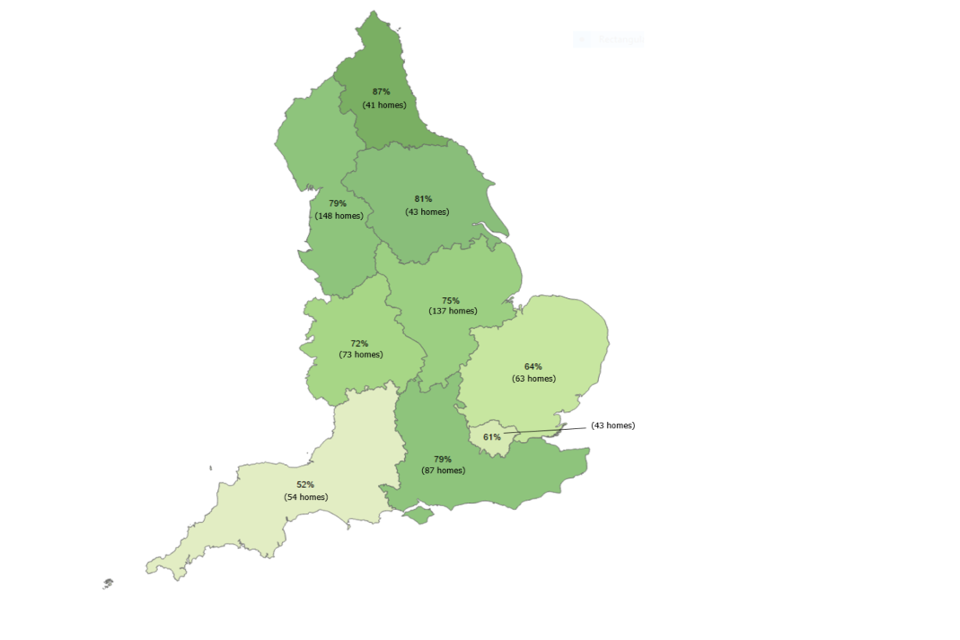
The number of inspections carried out in each region varied in the first 6 months of the inspection year. When you exclude the small number of second inspections of homes, it equated to around 54% of homes across England having been inspected, ranging from 43% of homes in Yorkshire and The Humber to 66% of those in the East Midlands.
The North East had the highest percentage of inspections resulting in a good or better overall effectiveness judgement, at 88%. This was a very small increase from 87% in the equivalent period in 2015. The South West had the lowest percentage of inspections with a good or better overall effectiveness judgement at 52%, a slight decline from 54% in 2015. (Chart 14)
The South West and London had the largest proportions of inadequate inspections in the period, 20% and 16% respectively.
Chart 14: Children’s homes overall effectiveness 1 April 2016 to 30 September 2016, by region
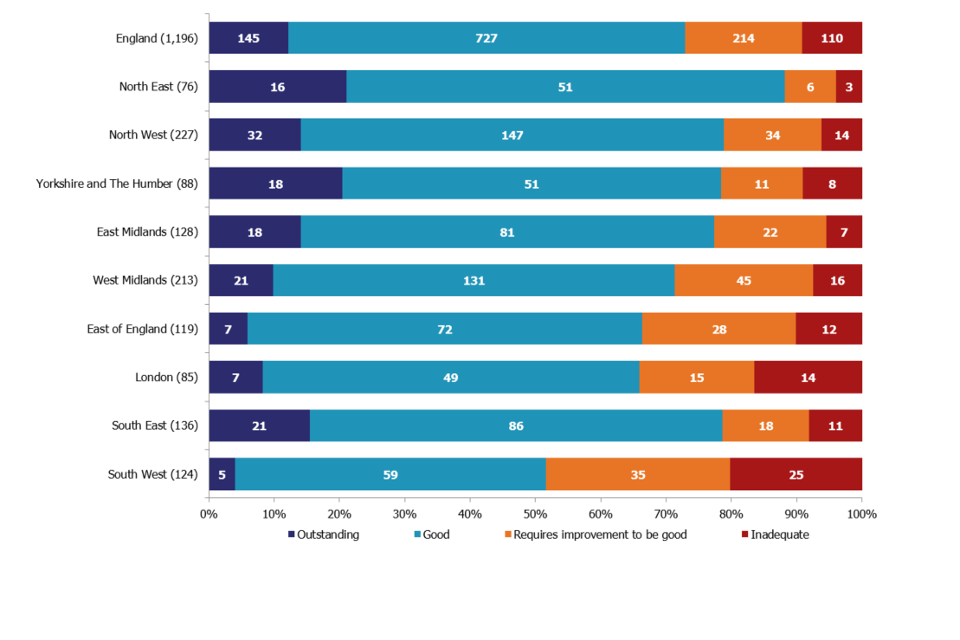
Chart 14
The South East and Yorkshire and the Humber saw the biggest increases in percentage of homes with good or better overall effectiveness judgements compared to the equivalent period in 2015. In the South East, this was an increase from 71% to 79%; in Yorkshire and The Humber from 70% to 78%.
Across all regions, the majority of homes judged to be good or better at their last inspection in 2015-16 remained at that judgement, with 81% remaining at good or better across England. The South West saw the lowest percentage of homes remaining at good or better (71%, 44 homes out of 62). The North East saw the highest percentage of homes remaining at good or better (90%, 53 homes of 59).[footnote 26] (Chart 15)
Chart 15: Change for children’s homes previously judged good or better for overall effectiveness, by region
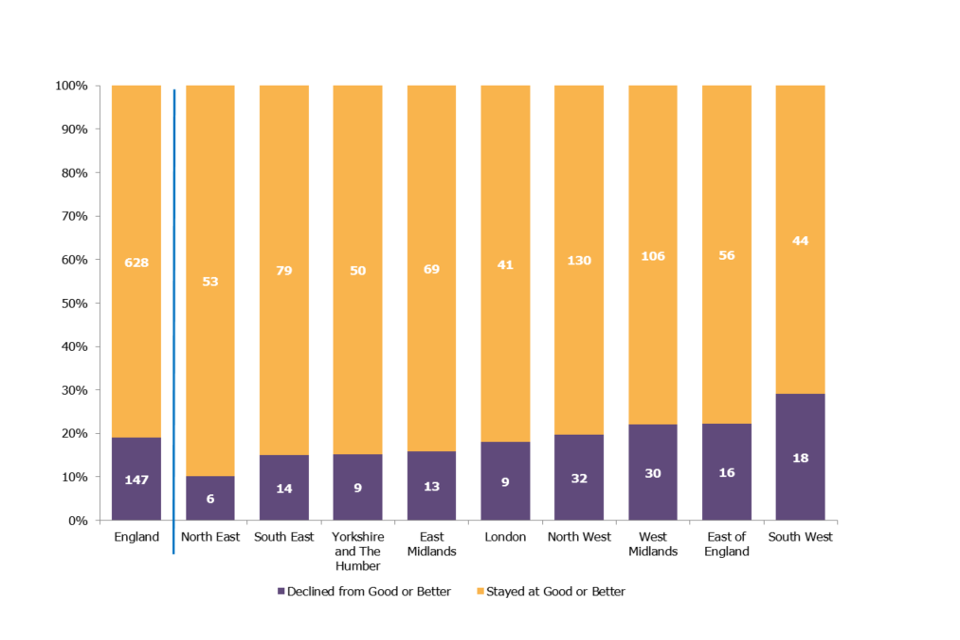
Chart 15
Similarly, a majority of homes judged requires improvement to be good or lower in 2015 improved in 2016, though this was lower at 60%. The North East saw the biggest improvement to good or outstanding, with 82% of their homes improving, though this only represented 9 homes. The South West saw the lowest improvement at 39% (15 of 38 homes), and was the only region where less than half the homes previously judged requires improvement to be good improved. (Chart 16)
Chart 16: Change for children’s homes previously judged requires improvement to be good or lower for overall effectiveness, by region
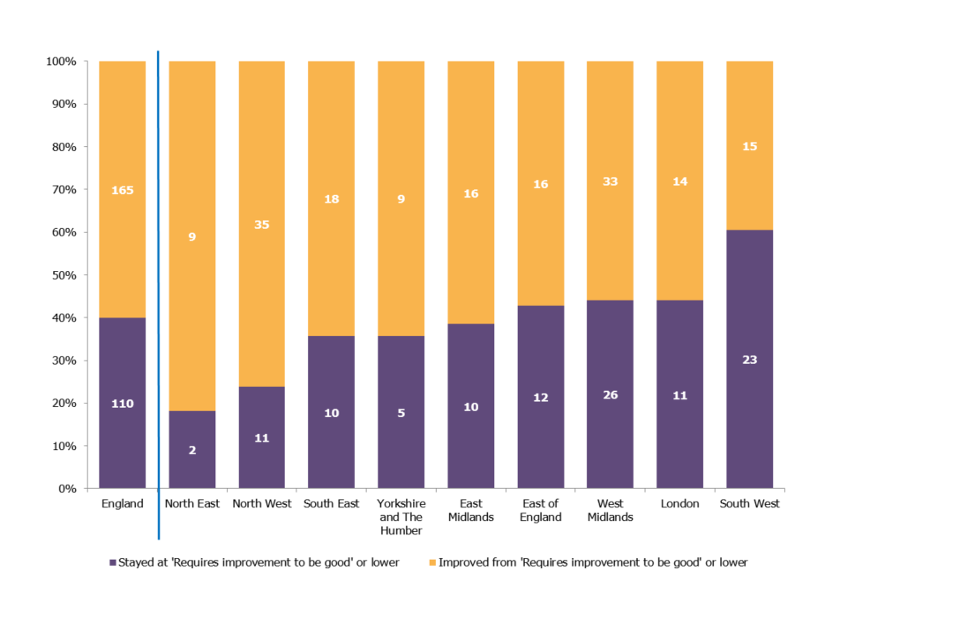
Chart 16
4.5 Interim inspections for all children’s homes in period, 1 April 2016 to 30 September 2016
Between 1 April and 30 September 2016, there were 169 interim inspections of children’s homes, 141 of which resulted in a judgement.[footnote 27]
Chart 17 below shows the judgement profile of the inspections, however it should be noted that due to the extremely small numbers of inspections, comparisons to previous years’ performances should not be drawn.
Chart 17: Children’s homes interim inspection judgements 1 April 2016 to 30 September 2016[footnote 28]
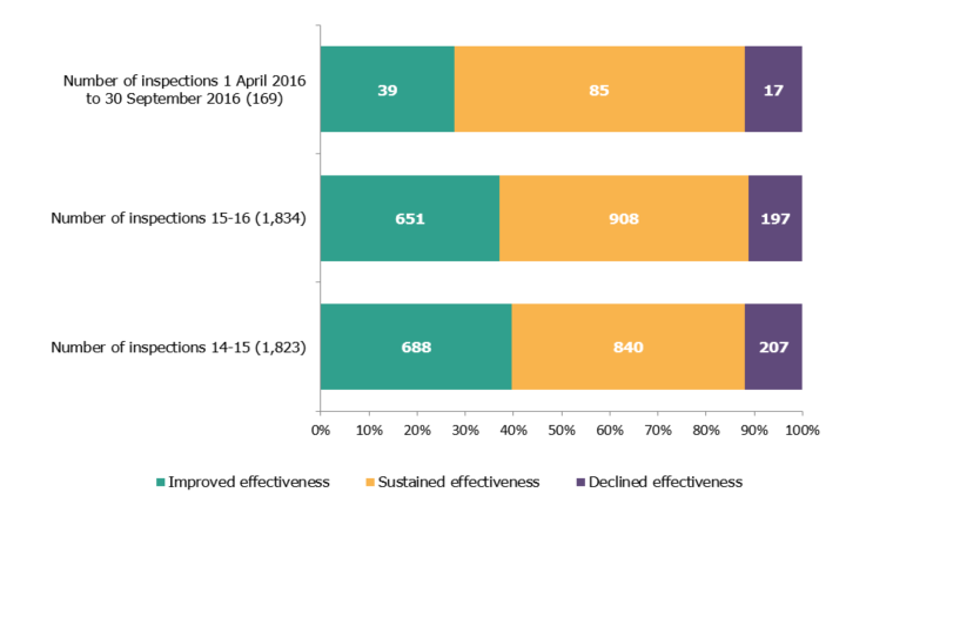
Chart 17
4.6 State of the nation for all children’s homes as at 30 September 2016[footnote 29]
On 30 September 2016, most children’s homes (81%) had an overall effectiveness judgement of good or better. This was an improvement from 75% on the same date in 2015. Only 3% (55) of homes were judged to be inadequate at this point in 2016. (Chart 18)
Chart 18: Children’s homes latest overall effectiveness judgement, as at 30 September 2016[footnote 30]
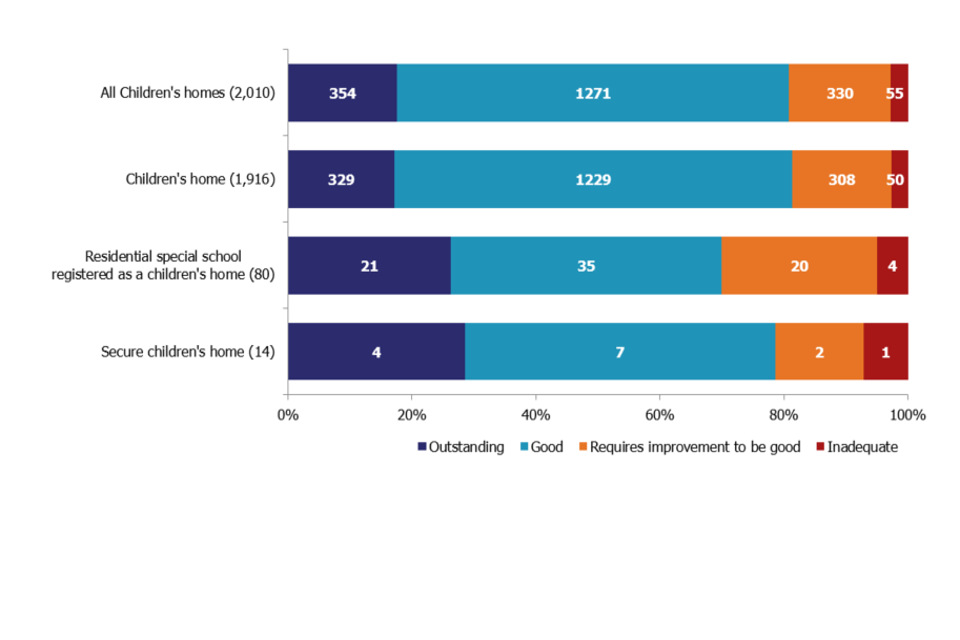
Chart 18
For all regions, at least two thirds of homes were judged to be good or better as at 30 September 2016, and for all regions, the percentage of good or better homes was higher than the same date in 2015. (Chart 19)
The South West, despite having the lowest percentage of good or better homes at 30 September 2016 (67%), saw the biggest improvement from 2015, by ten percentage points. The East Midlands saw the smallest improvement, of only one percentage point (from 81% to 82%).
The North East had the highest percentage of good or better homes at 30 September 2016 (91%), up from 82% in 2015. Yorkshire and the Humber had the second highest at 88%, after having the highest in 2015.
Chart 19: Children’s homes latest overall effectiveness inspection judgement, as at 30 September 2016, by region
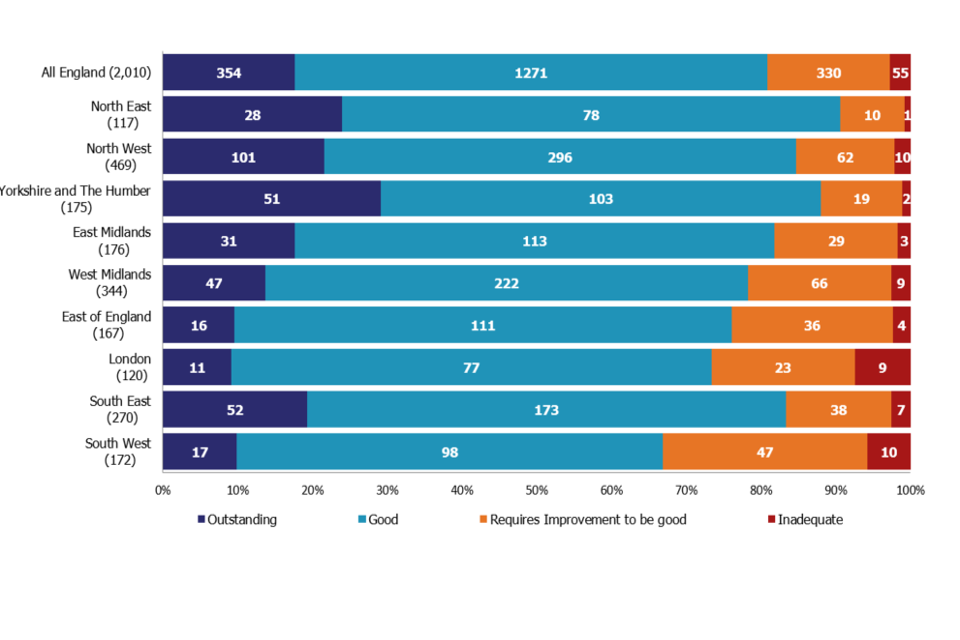
Chart 19
5. Revisions to previous release
Revised data covering the period 1 April 2015 to 31 March 2016 has been released[footnote 31].
The revision of statistics relating to 1 April 2015 to 31 March 2016 from ‘provisional’ to ‘revised’ status includes outcomes relating to a further 144 inspections. These consist of an additional 45 full inspections, 10 monitoring visits and one emergency visit of all provision types, and 88 interim inspections of children’s homes. These took place in this period and have been published since 30 April 2016.
6. Notes
An explanation about key uses of these data and further contextual information and the arrangements for quality assurance is provided in the accompanying Quality and Methodology report.
Strengths include:
- the data belongs to Ofsted: this allows for certainty around the QA carried out on all data
- robust QA of the data by Ofsted: Ofsted completes detailed QA of all tables, underlying data, and reports created from this data
- comprehensive snapshot of the children’s homes sector: due to the known quality of the data, it provides a comprehensive picture of children’s homes in England
- all required data present: due to the data being Ofsted’s internal data, there is almost no missing data
Some limitations include:
- limited comparable data: much of the data held is only held by Ofsted, and therefore cannot be verified against other sources
- incorrect reporting by providers: in a small number of cases, data supplied by providers does not appear to be accurate (for example, an incorrect postcode); this has minimal impact on this particular SFR, however, and is usually identified during QA
Further information about strengths and limitations of the statistics can be found in the quality report linked above.
Previously published data regarding LA inspections, children’s social care inspections and providers and places can be found on the (Social care statistics collection page](/government/collections/childrens-social-care-statistics) and in the National Archives.
These pages also contain data on adoption, fostering, children looked after placements and serious incident notifications which the reader may find relevant.
7. Glossary
Children’s homes
A children’s home is defined in section 1 of the Care Standards Act 2000, and is an establishment that provides care and accommodation wholly or mainly for children. Children’s homes vary in size and nature. They fulfil a range of purposes designed to meet the different needs of those children and young people who are assessed as needing a residential care placement. Some homes, for example, provide short-breaks which are needed to help support children and their family. Some residential special schools are registered as children’s homes because boarders are resident for more than 295 days per year.
Residential special schools
Residential special schools are defined in section 59 of the Safeguarding Vulnerable Groups Act 2006. They vary in size and nature. The sector ranges from large non-maintained special schools which make provision for very specific needs and take children as full boarders from all over the country, to smaller more local providers catering for children with a range of different special needs and disabilities who may be resident at the school only during the week. Some residential special schools are registered as children’s homes because boarders are resident for more than 295 days per year. There are also a small number of independent residential special schools which also tend to cater for children with very specialist needs.
Sector
Sector refers to the type of provider that owns the children’s social care provision.
Academy: These are publicly funded independent schools which are run by trusts.
Health Authority: These are NHS Trust-run.
Local Authority: These are public bodies responsible for the children’s social care provision.
Private: These are for-profit organisations mostly with limited company status. These can also be individually owned children’s social care provision and run for profit.
Voluntary: These are mostly not-for-profit organisations, mainly with charitable status. These can also be individually owned children’s social care provision and run on a not-for-profit basis.
Secure children’s homes
Secure children’s homes are defined by section 25 of the Children Act 1989. They accommodate children and young people who are remanded or have been sentenced for committing a criminal offence. They also accommodate children and young people who are placed there by a court because their behaviour is deemed to present a significant and immediate threat to their safety or the safety of others, unless they are placed in a secure environment. Ofsted inspections are conducted in accordance with the Care Standards Act 2000 and judgements in reports are made in relation to the outcomes for children set out in the Children Act 2004. The criteria are the same as those used to inspect non-secure children’s homes.
If you have any comments or feedback on this publication, please contact the Social Care Data Team on 03000 130020 or socialcaredata@ofsted.gov.uk
-
Schools that provide accommodation for pupils for more than 295 days each year, including specialist and mainstream schools, must register as a children’s home if, within any two-year period, one child or more, who boards at the school or in lodgings arranged by the school, stays for more than 295 days over any 12-month period within those two years. ↩
-
Secure children’s homes are defined by section 25 of the Children Act 1989. They accommodate children and young people who are remanded or have been sentenced for committing a criminal offence. They also accommodate children and young people who are placed there by a court because their behaviour is deemed to present a significant and immediate threat to their safety or the safety of others, unless they are placed in a secure environment. They also accommodate children who are at risk of things, such as child sexual exploitation, for their own safety. ↩
-
For more information about the social care system in England, please refer to the Department for Education (DfE) website ↩
-
Inspecting local authority children’s services: framework, June 2014 ↩
-
Department for Education (DfE) guidance, Working together to safeguard children, March 2015 ↩
-
Office for National Statistics, Population Estimates Analysis Tool (Mid-2015), June 2016 ↩
-
Department for Education National Statistics, Children looked after in England including adoption, September 2016 and DfE National Statistics, Characteristics of children in need: 2015 to 2016, November 2016. ↩
-
Although 109 inspections are talked about in this release, it is actually 110 inspections that have taken place since the SIF began. Slough has had a SIF inspection and a SIF re-inspection, and it is the re-inspection which is counted within these statistics, as each LA is only counted once for a state of the nation picture. In addition not all LAs receive a judgement in every area, with some LAs, depending on their size, make up and services offered, only being inspected against certain areas. The LAs who have not been judged in every area are; City of London and the Isles of Scilly. ↩
-
“Vulnerable groups” includes children in need, children with a child protection plan, and children looked after. ↩
-
Children looked after and achieving permanence has two further sub-judgements: adoption performance; and experiences and progress of care leavers, which are discussed in more detail below. ↩
-
Birmingham and Sunderland have since announced that they will have their children’s services provided by a voluntary Children’s Trust in the near future. In doing so they will join Doncaster and Slough who already have this set up and running. ↩
-
Birmingham has since had a SIF re-inspection, however that fell outside the periods covered in this release. ↩
-
The judgement profile for voluntary adoption agencies, which offer similar, although not identical services, was higher (95%) than LA adoption agencies inspected as part of the SIF inspection programme. ↩
-
These shire counties cover large areas and this needs to be taken into account when looking at map 1. ↩
-
Across England, 33 local authorities are London boroughs, 36 are metropolitan districts, 27 are shire counties and 56 are unitary authorities. ↩
-
The Safeguarding inspections were from July 2009 to July 2012, and the Child Protection inspections from July 2012 to July 2013. ↩
-
The Looked After Children inspections were from July 2009 to July 2012. The data also include a handful of Targeted Looked After Children which were conducted in the summer of 2013. ↩
-
All the sections of this release, on children’s homes, talk about data covering all types of children’s homes as one group, unless the paragraph or chart specifically splits the data into the three sub types of children’s homes. ↩
-
See [Inspection of children’s homes framework for inspection from 1 April] (/government/publications/inspecting-childrens-homes-framework) for further details on grading inspection findings. ↩
-
Homes found at some point to be inadequate, or homes for which concerns were raised which required additional inspections. ↩
-
Children’s homes are inspected on a 12 month cycle and this release covers the first six months of that period. Some homes will therefore not yet have been inspected. In addition homes with no children on roll and with no plans to accept children within the following three months after the inspection would have taken place, were not inspected. ↩
-
Any reference to data from the same period in 2015 relates to revised data for that period. Revised data are data taken more than one month after the inspection period, in this case they were taken at 30 April 2016. The data can be found in the Ofsted statistical release ‘Children’s social care data in England 2016’. Ofsted use a risk-based policy to inspecting children’s homes which means the like for like period of the previous year is the best comparator. ↩
-
Data relating specifically to re-inspections can be found in the paragraph following chart 11. ↩
-
If a home was inspected twice in the current period, their first inspection is the one included in any comparison data, unless otherwise stated. ↩
-
Inspection judgements for health authority homes have not been included as a separate entry as there are so few of them (3 inspections, 2 good judgements and one requires improvement to be good). They have, though, been included in the England figure. ↩
-
If a home was inspected twice in the current period, their first inspection is the one included in any comparison data, unless otherwise stated. ↩
-
See Inspection of children’s homes framework for inspection from 1 April for further details on grading interim inspection findings. ↩
-
The total number of inspections listed in the Y axis, includes inspections where no judgement was made due to no children being present at the time of the inspection. However these inspections with ‘not judged’ outcomes have been omitted from the chart, to allow the focus to be placed on inspections with outcome judgements. ↩
-
The inspection is the most recent full inspection the provision had received and is not necessarily from 2015-16. ↩
-
The number and percentage of inadequate homes at 30 September 2016 is lower than the number of inadequate inspections between 1 April 2016 and 30 September 2016. This is the result of either their registration having been resigned or cancelled or Ofsted having re-inspected the home and found they had improved which resulted in an improved overall effectiveness judgement. ↩
-
These are revisions to the Ofsted statistical release. ↩