Local Alcohol Profiles for England: short statistical commentary, February 2019
Published 5 February 2019

© Crown copyright 2019
This publication is licensed under the terms of the Open Government Licence v3.0 except where otherwise stated. To view this licence, visit nationalarchives.gov.uk/doc/open-government-licence/version/3 or write to the Information Policy Team, The National Archives, Kew, London TW9 4DU, or email: psi@nationalarchives.gov.uk.
Where we have identified any third party copyright information you will need to obtain permission from the copyright holders concerned.
This publication is available at https://www.gov.uk/government/statistics/local-alcohol-profiles-for-england-february-2019-data-update/local-alcohol-profiles-for-england-short-statistical-commentary-february-2019
New in this update
New admissions data for 2017 to 2018 has been added to the Local Alcohol Profiles for England (LAPE) tool on the Fingertips platform. The following indicators have been updated and are available at local authority level as well as for England, the regions, and various inequality groups:
- 10.01 admission episodes for alcohol-related conditions (Narrow)
- 9.01 admission episodes for alcohol-related conditions (Broad)
- 6.02 admission episodes for alcohol-specific conditions
This release includes the above indicators broken down by age group and cause where appropriate.
Main findings
- in 2017 to 2018 in England there were 1.17 million hospital admissions where the primary or any secondary reason for admission was linked to alcohol (Broad measure); increases in the rate have been observed every year since 2008 to 2009
- the rate of hospital admissions where the main reason for admission was attributed to alcohol (Narrow measure) remains broadly flat, but there has been a minor increase in the number of admissions since 2016 to 2017
- the rate of hospital admissions for alcohol-related conditions on the Narrow measure is highest in the over 65s age group
- the rate of hospital admissions for conditions solely caused by alcohol consumption in the under 18s continued to fall in 2017 to 2018
- chronic conditions which are partly but not wholly caused by alcohol account for the majority of alcohol-related hospital admissions; with cardiovascular diseases being responsible for the most admissions in this group
Key definitions used in this release
- broad definition: a measure of hospital admissions where either the primary diagnosis (main reason for admission) or one of the secondary (contributory) diagnoses is an alcohol-related condition; this represents a Broad measure of alcohol-related admissions but is sensitive to changes in coding practice over time
- narrow definition: a measure of hospital admissions where the primary diagnosis (main reason for admission) is an alcohol-related condition; this represents a narrower measure; since every hospital admission must have a primary diagnosis it is less sensitive to coding practices but may also understate the part alcohol plays in the admission
- wholly attributable: these are conditions known to be solely caused by alcohol consumption
- partially attributable: these are conditions where it is known that a proportion of the cases are caused by alcohol consumption; examples are circulatory disease and certain cancers
In general, the Broad measure gives an indication of the full impact of alcohol on hospital admissions and the burden placed on the NHS. The Narrow measure estimates the number of hospital admissions which are primarily due to alcohol consumption and provides the best indication of trends in alcohol-related hospital admissions.
Summary of updated indicators
Alcohol-related admissions (Broad)
In 2017 to 2018, there were 1.17 million alcohol-related hospital admissions on the Broad definition measure. The rate has increased from 2,185 (per 100,000) in 2016 to 2017 to 2,224 (per 100,000) in 2017 to 2018. Increases in the rate have been observed every year since 2008 to 2009.
Figure 1: Admissions for alcohol-related conditions (Broad), England
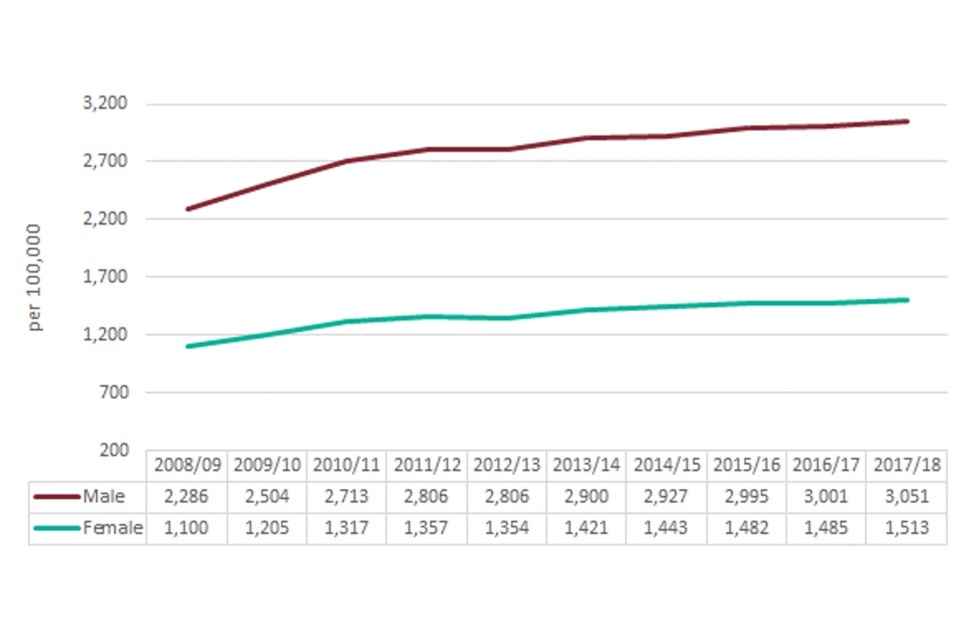
Line chart showing the trend in the number of hospital admissions in England for alcohol-related conditions, under the Broad definition, per 100,000 population for males and females between 2008 to 2009 and 2017 to 2018
Alcohol-related hospital admissions are associated with deprivation. The rate of hospital admissions on the Broad definition is almost 65% higher in the most deprived 10% of local authorities than the least deprived 10%.
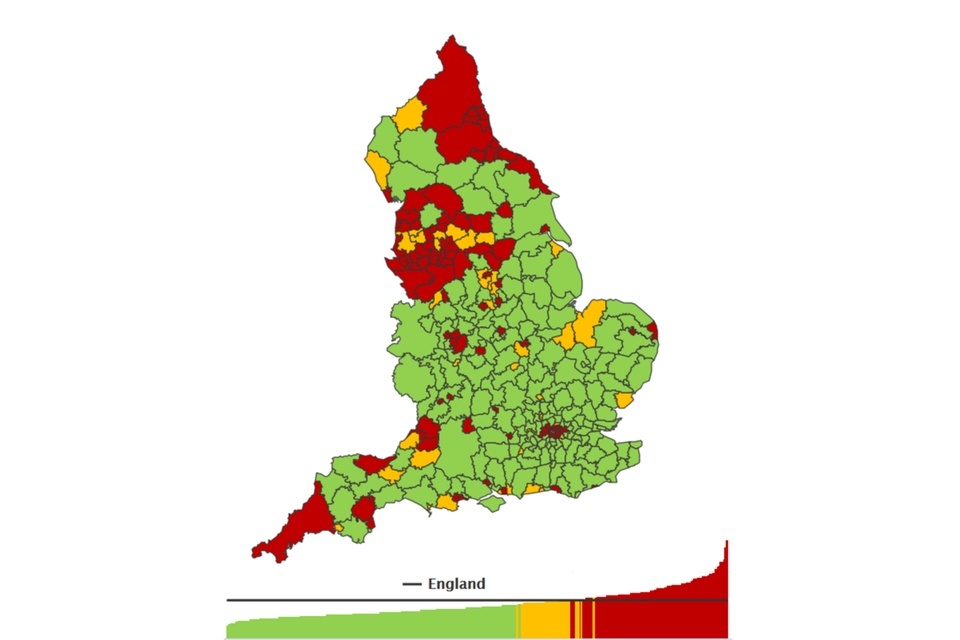
Rates of alcohol-related hospital admissions vary across the country. The South East had the lowest rate (1,827 per 100,000) and the North East the highest (2,736 per 100,000).
Variation across local authorities was even greater with the lowest rate in Wokingham (1,412 per 100,000) and the highest in Salford (3,430, per 100,000).
Figure 2: Admissions for alcohol-related conditions (Broad), District and UA
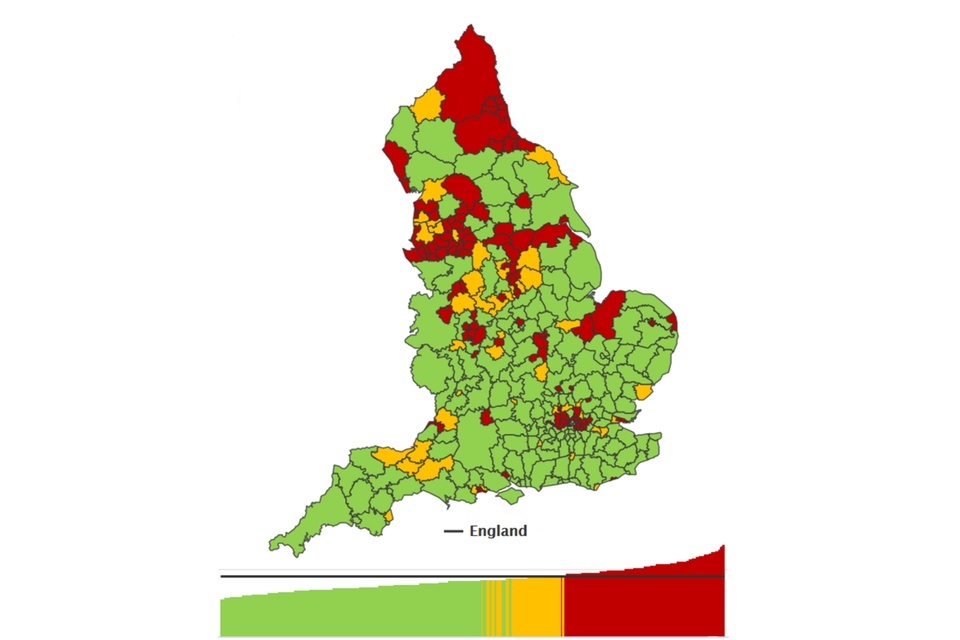
Thematic map of England districts showing the number of hospital admissions for alcohol-related conditions, under the Broad definition, per 100,000 population for persons in 2017 to 2018
Alcohol-related admissions (Narrow)
In 2017 to 2018, there were 337,900 hospital admissions for alcohol-related conditions on the Narrow measure. The rate has changed little over time but has reduced slightly from 636 (per 100,000) in 2016 to 2017 to 632 (per 100,000) in 2017 to 2018.
Figure 3: Admissions for alcohol-related conditions (Narrow), England
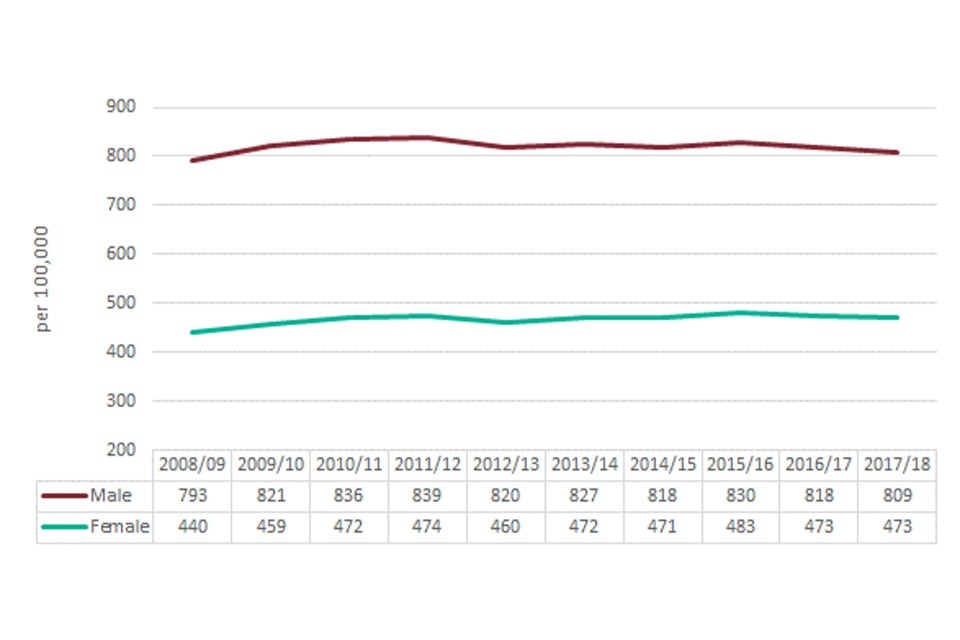
Line chart showing the trend in the number of hospital admissions in England for alcohol-related conditions, under the Narrow definition, per 100,000 population for males and females between 2008 to 2009 and 2017 to 2018
The rate of hospital admissions for alcohol-related conditions on the Narrow measure is highest in the over 65 age group (1,016 per 100,000) followed by the 40 to 64 age group (877 per 100,000). By gender, the rate is highest for males aged over 65 (1,459 per 100,000) and for females aged 40 to 64 (682 per 100,000). However, the rates in the two oldest female groups are beginning to converge.
The rate of hospital admissions on the Narrow definition is almost 49% higher in the most deprived 10% of local authorities than the least deprived 10%.
Figure 4: Admissions for alcohol-related conditions (Narrow), District and UA
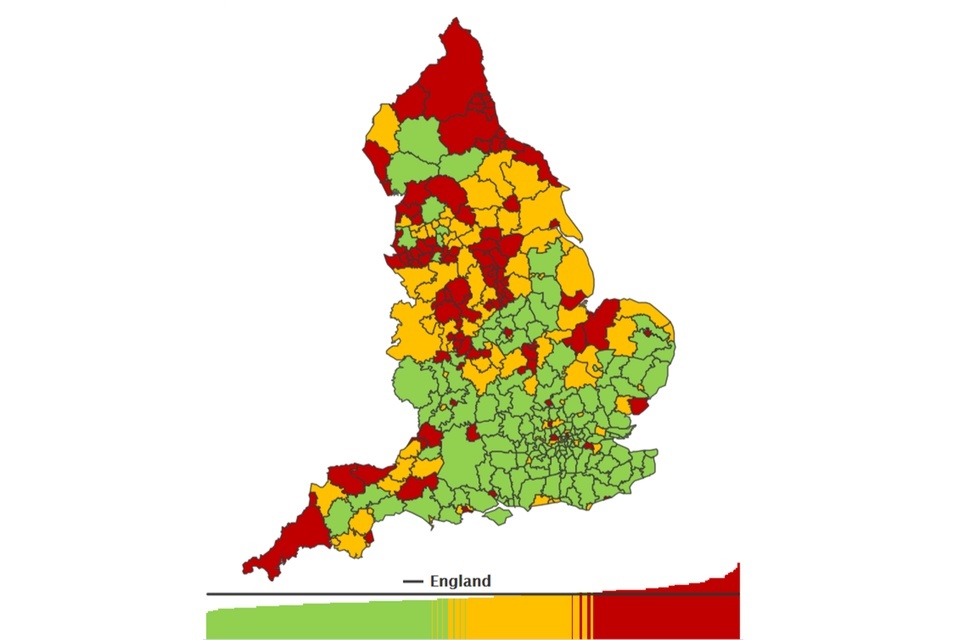
Thematic map of England districts showing the number of hospital admissions for alcohol-related conditions, under the Narrow definition, per 100,000 population for persons in 2017 to 2018
Alcohol-specific admissions
In 2017 to 2018, there were 304,100 alcohol-specific hospital admissions. The rate of admissions has increased very slightly from 563 (per 100,000) in 2016 to 2017 to 570 (per 100,000) in 2017 to 2018.
Figure 5: Admissions for alcohol-specific conditions, District and UA
Thematic map of England districts showing the number of alcohol-specific hospital admissions, per 100,000 population for persons in 2017 to 2018
The rate of alcohol-specific admissions is 110% higher in the most deprived 10% of local authorities than the least deprived 10%.
Alcohol-specific hospital admissions in the under 18s have been falling every year over the past decade. In the three-year period between 2015 and 2018 there were 11,600 admissions, with the rate again falling from 34.2 (per 100,000) in season 2015 to 2016 to 32.9 (per 100,000) in season 2017 to 2018.
Figure 6: Under 18 admissions for alcohol-specific conditions, England
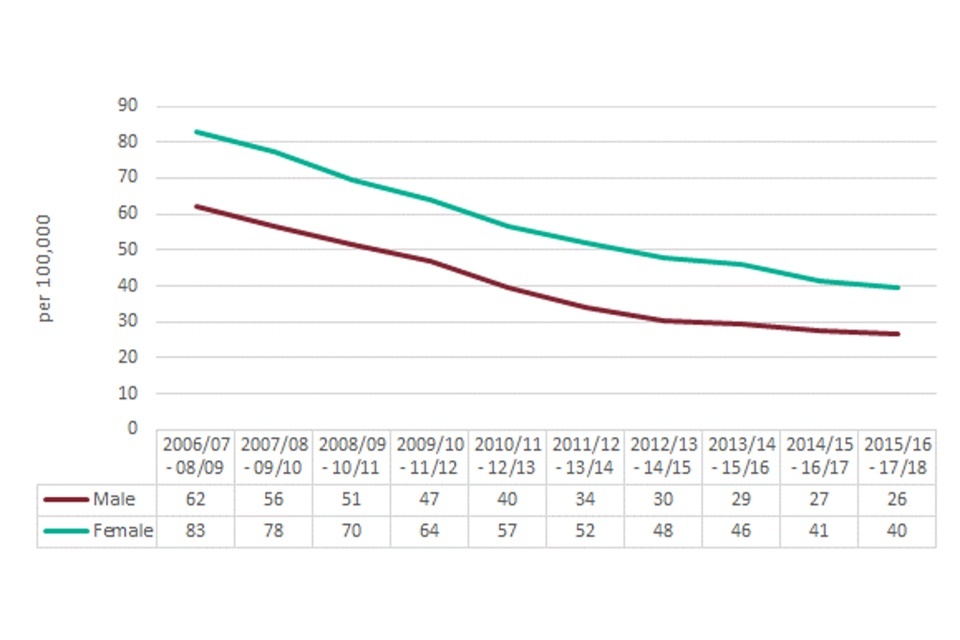
Line chart showing the trend in the number of alcohol-specific hospital admissions in England, per 100,000 population for males and females aged under 18 between 2008 to 2009 and 2017 to 2018
In the under 18 age group, more girls are admitted to hospital for alcohol-specific reasons than boys. In the most recent three-year period, the admission rate for girls was 39.6 (per 100,000) compared to 26.4 (per 100,000) for boys.
Alcohol-related chronic conditions
The rise in the number of alcohol-related hospital admissions has been driven by an increase in admissions from chronic conditions which are partially attributable to alcohol.
Figure 7: Number of alcohol-related admissions (Narrow), England
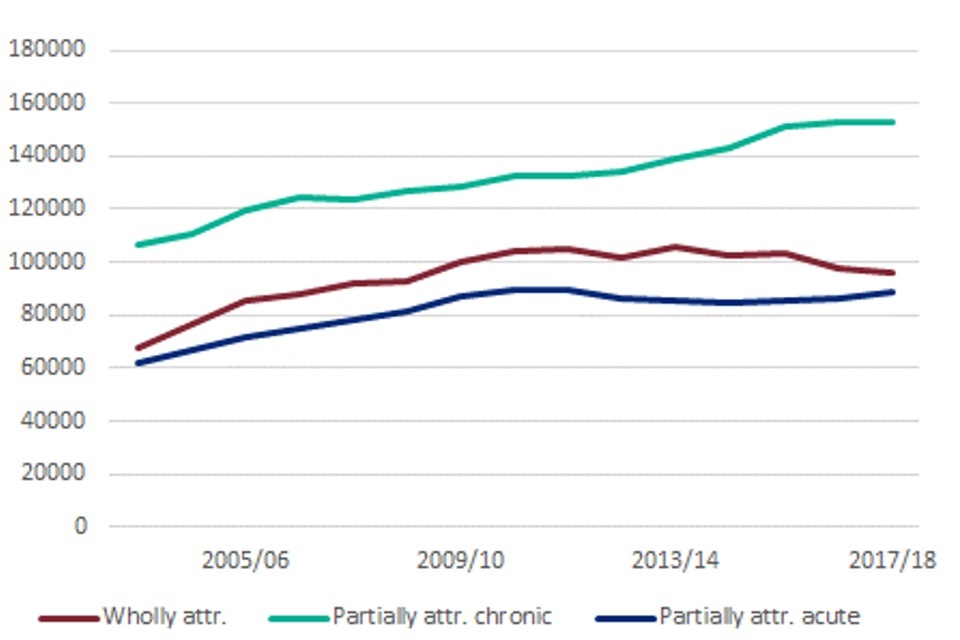
Line chart showing the trend in the number of hospital admissions in England for wholly and partially attributable alcohol-related conditions, under the Narrow definition, for persons between 2003 to 2004 and 2017 to 2018
In 2017 to 2018, the rate of partially attributable chronic conditions remained static, partially attributable acute conditions increased by 2.7% compared with 2016 to 2017, and wholly attributable conditions fell by 5.5%.
In 2017 to 2018, chronic conditions which are partially attributable to alcohol accounted for 69% of all alcohol-related hospital admissions on the Broad definition. As shown in Figure 8, cardiovascular disease dominates the chronic partially attributable condition group. In 2017 to 2018, there were an estimated 605,000 alcohol-related hospital admissions from cardiovascular disease.
Figure 8: Proportion of alcohol-related admissions (Broad) - Chronic partially attributable conditions, England
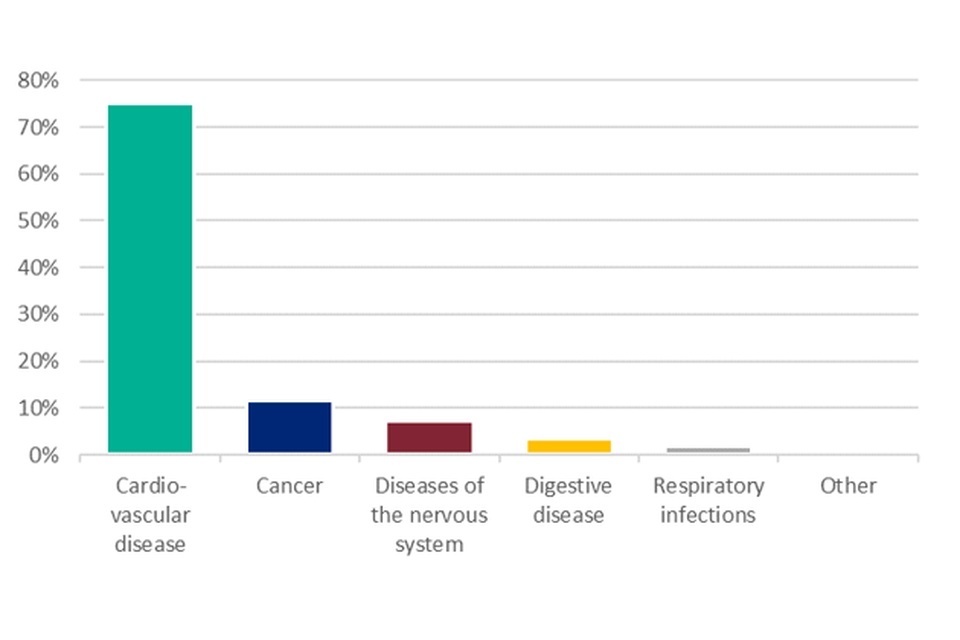
Bar chart showing the proportion of hospital admissions in England for chronic partially attributable alcohol-related conditions, under the Broad definition, by cause for persons in 2017 to 2018
Background and further information
The Local Alcohol Profiles for England (LAPE) have been published on an annual basis since 2006. These profiles have been designed to help local government and health services assess the effect of alcohol use on their local populations. They will inform commissioning and planning decisions to tackle alcohol use and improve the health of local communities.
The LAPE data tool helps local areas assess alcohol-related harm and monitor the progress of efforts to reduce this.
View the LAPE Profile
Definitions and methodology for all LAPE indicators is described in our user guide.
View the LAPE User Guide
Responsible statistician, product lead: Mark Cook
For queries relating to this publication, please contact: lape@phe.gov.uk