Local Alcohol Profiles for England: short statistical commentary, December 2018
Published 4 December 2018

© Crown copyright 2018
This publication is licensed under the terms of the Open Government Licence v3.0 except where otherwise stated. To view this licence, visit nationalarchives.gov.uk/doc/open-government-licence/version/3 or write to the Information Policy Team, The National Archives, Kew, London TW9 4DU, or email: psi@nationalarchives.gov.uk.
Where we have identified any third party copyright information you will need to obtain permission from the copyright holders concerned.
This publication is available at https://www.gov.uk/government/statistics/local-alcohol-profiles-for-england-december-2018-data-update/local-alcohol-profiles-for-england-short-statistical-commentary-december-2018
New in this update
New mortality data for 2017 has been added to the Local Alcohol Profiles for England (LAPE) tool on the Fingertips platform. The following indicators have been updated and are available at local authority level as well as for England, the regions, and various inequality groups:
- years of life lost due to alcohol-related conditions
- alcohol-specific mortality
- mortality from chronic liver disease
- alcohol-related mortality
Main findings
- in 2017 there were an estimated 24,200 deaths attributed to alcohol use in England. This is an increase of 1.5% since 2016 and the fifth consecutive annual rise
- deaths from alcohol-specific conditions increased by 2.8% to 16,660 in the period 2015-2017 compared to the previous 3-year period
- there were 18,900 deaths from chronic liver disease between 2015 and 2017, a 2.6% increase compared to the previous 3-year time period
- there were over 307,000 potential years of life lost due to alcohol consumption in 2017
- gender and inequality gaps persist across the updated measures showing that disproportionate levels of harm are impacting on men and the most deprived
Key definitions used in this release
- years of life lost due to alcohol-related conditions: The number of years of life lost up to the age of 75 for individuals who died aged under 75 of an alcohol-related cause
- alcohol-specific mortality: Deaths from conditions wholly caused by alcohol. This definition is also used by the Office for National Statistics in their annual UK data release
- mortality from chronic liver disease: Deaths from chronic liver disease, including cirrhosis, classified by an underlying cause of death with ICD10 code K70, K73 or K74
- alcohol-related mortality: Deaths from conditions which are wholly or partially caused by alcohol. For partially attributable conditions, a fraction of the deaths are included based on the latest academic evidence about the contribution alcohol makes to the condition
Summary of updated indicators
Years of life lost due to alcohol-related conditions
In 2017 there were an estimated 307,000 years of life lost in England up to the age of 75 (a rate of 626 years lost per 100,000 in the population).
The number of years of life lost increased by 0.4% in the latest year. However, the 2017 figure is almost 10% lower than the beginning of the time series (2008).
Potential years of life lost for men (219,000) are more than double the number for women (88,000).
Figure 1: Years of life lost due to alcohol-related conditions by gender, England
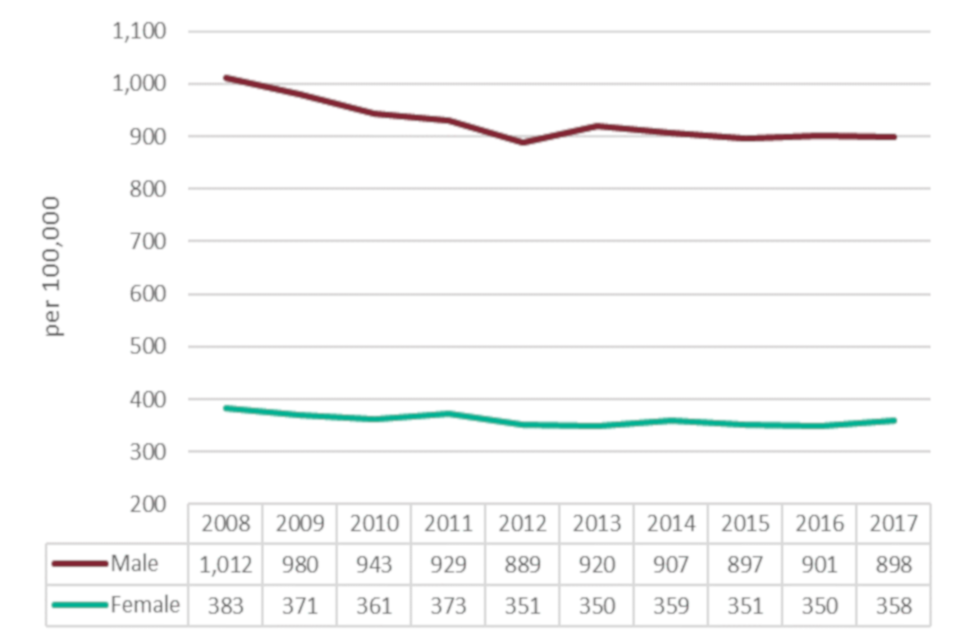
Line chart showing years of life lost due to alcohol-related conditions for males and females in England in 2008 to 2017. The y-axis for the chart starts at 200 instead of zero.
The inequality gradient is particularly steep for years of life lost due to both a higher rate of alcohol-related deaths in more deprived areas and a younger average age at death. Half of the years of life lost in 2017 were from the most deprived 30%.
Figure 2: Years of life lost due to alcohol-related conditions by deprivation decile, England
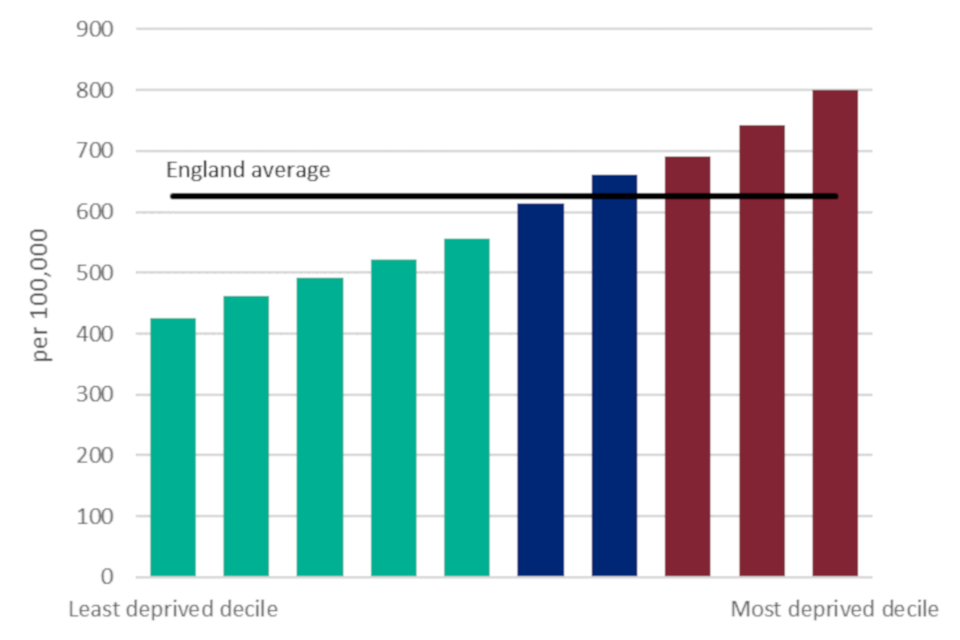
Bar chart showing years of life lost due to alcohol-related conditions by deprivation decile in England in 2017.
Alcohol-specific mortality
There were 16,656 alcohol-specific deaths in England between 2015 and 2017, a rise of 2.8% compared to the previous 3-year period. This is the largest increase since the start of the time period (2006 to 2008) and also the third successive increase.
By gender, there was an increase of 3.5% in deaths for females and 2.5% for males. However, the number of alcohol-specific deaths for men (11,048) is almost double the figure for women (5,608).
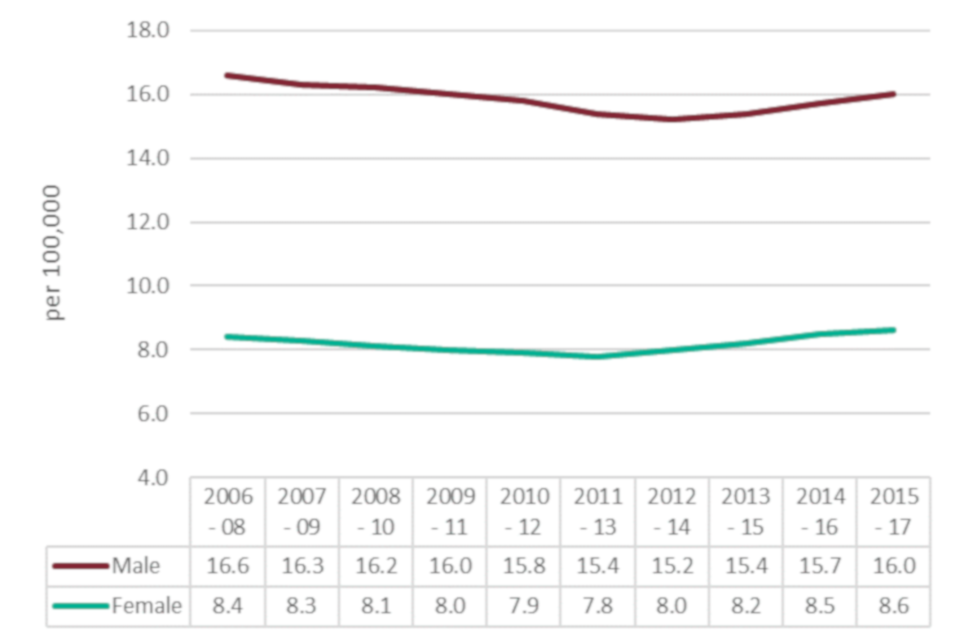
Figure 3: Alcohol-specific mortality by gender, England
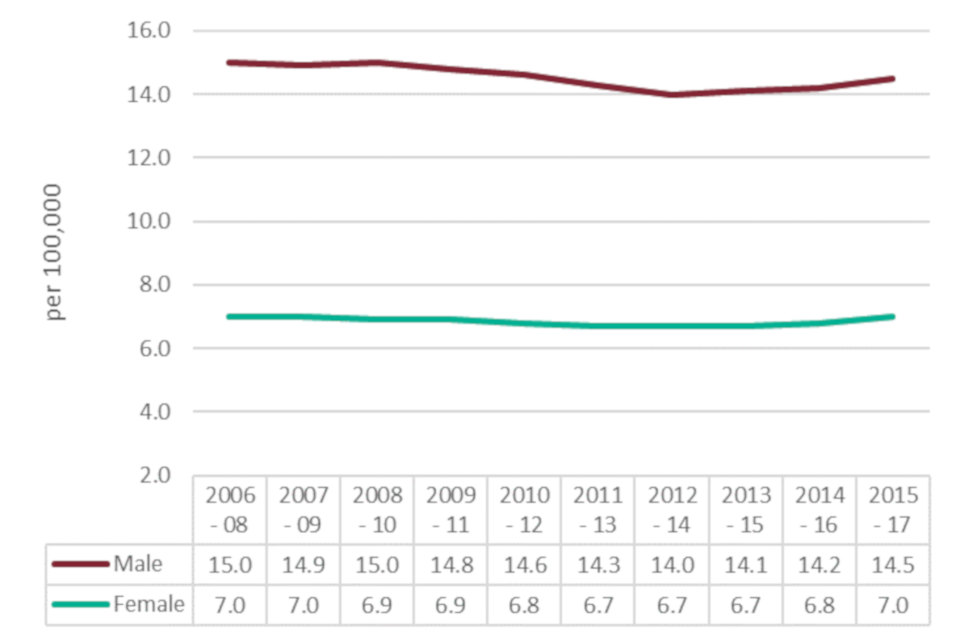
Line chart showing alcohol-specific mortality for males and females in England in 2006 to 2008 (combined) up to 2015 to 2017 (combined). The y-axis starts at 2.0 instead of zero.
Figure 4 shows the variation in alcohol-specific mortality rates across local authorities in England, ranging from 3.0 per 100,000 population in South Oxfordshire to 30.1 per 100,000 population in Blackpool.
Figure 4: Alcohol-specific mortality, District and Unitary Authority (UA)
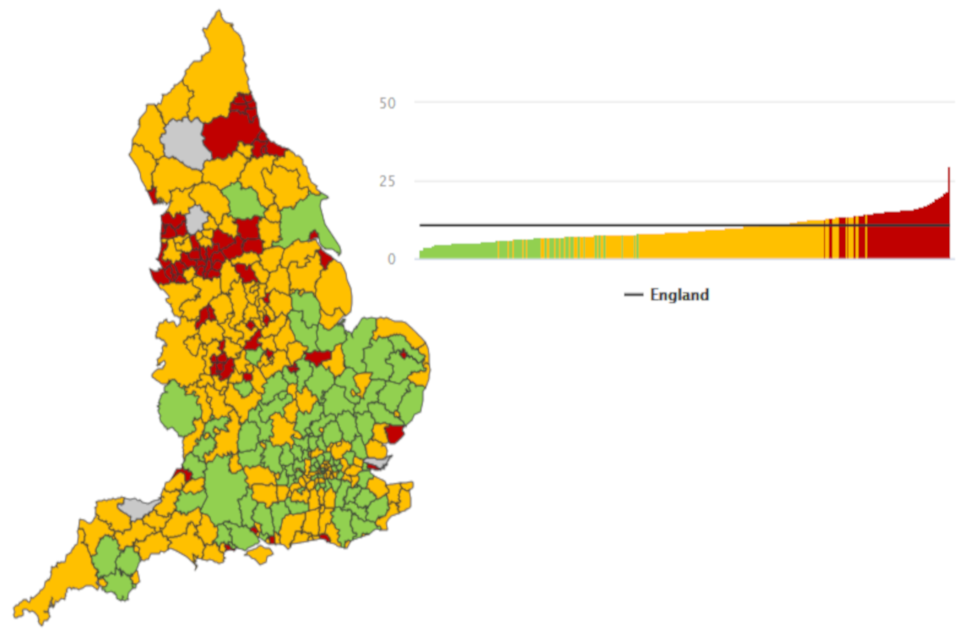
Map showing the variation in alcohol-specific mortality rates across local authorities in England for 2017.
Mortality from chronic liver disease
There were 18,907 deaths from chronic liver disease between 2015 and 2017, a 2.6% increase compared to the previous 3-year time period (18,425). This is not as significant an increase as seen between 2014 and 2016 (3.7%); which remains the largest increase since the start of the LAPE series. By gender, the increases are similar - 2.8% for men and 2.3% for women. Again, however, the number of deaths from chronic liver disease for men (12,008) was almost double the number for women (6,899).
Figure 5: Mortality from chronic liver disease by gender, England
Bar chart showing mortality from chronic liver disease for males and females in England in 2006 to 2008 (combined) up to 2015 to 2017 (combined). The y-axis starts at 4.0 instead of zero.
The rate of chronic liver disease mortality in the most deprived areas (16.9 per 100,000) is almost double the rate in the least deprived (8.9 per 100,000).
Figure 6: Mortality from chronic liver disease by deprivation decile, England
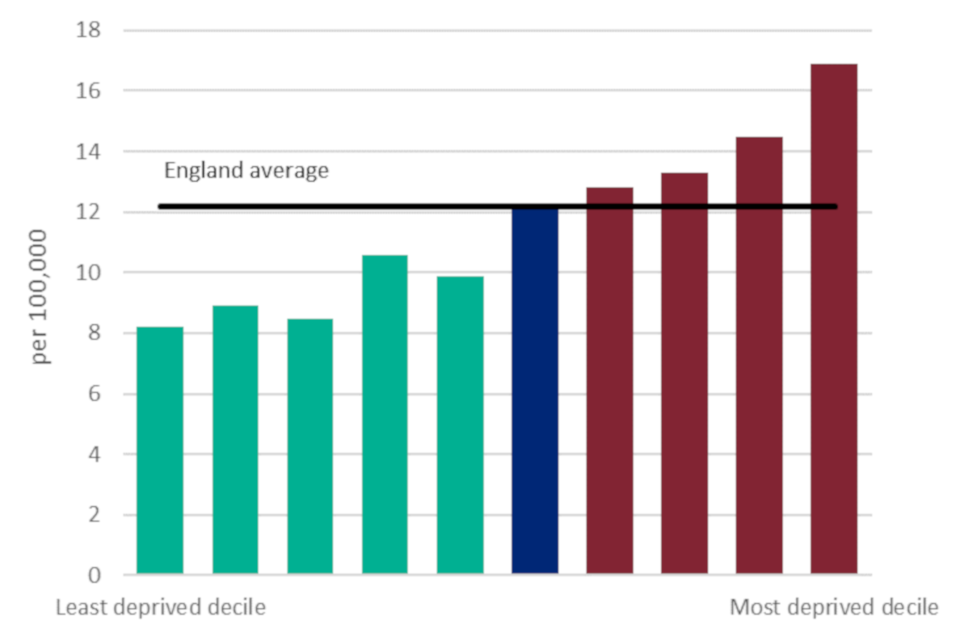
Line chart showing mortality from chronic liver disease by deprivation decile for England in 2017.
Alcohol-related mortality
In 2017 there were an estimated 24,208 deaths attributed to alcohol use in England. This is an increase of 1.5% since 2016 and the fifth consecutive annual rise. As seen in many other alcohol indicators, there is a marked and persistent gender inequality observed for alcohol-related mortality- the rate for men is currently more than double the rate for women.
Figure 7: Alcohol-related mortality by gender, England
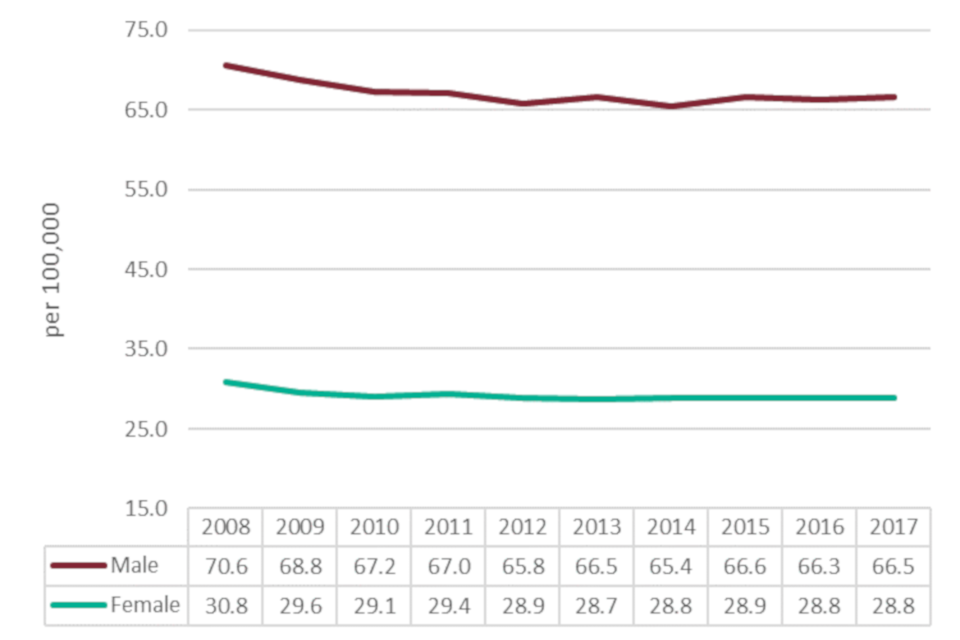
Line chart showing alcohol-related mortality for males and females in England in 2008 to 2017. The y-axis starts at 15.0 instead of zero.
The contribution that alcohol makes to mortality varies considerably by age. Whilst there are a greater number of alcohol-related deaths at older ages, as a proportion of all deaths alcohol is most significant for younger adults.
Figure 8 shows the variation in alcohol-specific mortality rates across local authorities in England, ranging from 26.2 per 100,000 population in South Oxfordshire to 84.6 per 100,000 population in Blackpool.
Figure 8: Alcohol-related mortality, District and Unitary Authority (UA)
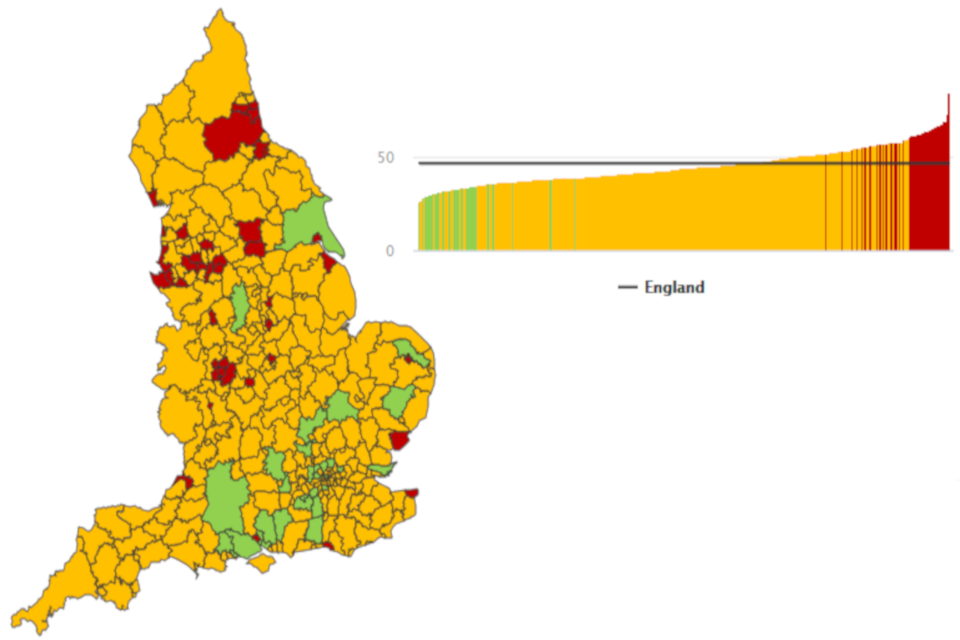
Map showing the variation in alcohol-specific mortality rates across local authorities in England in 2017.
Background and further information
LAPE have been published on an annual basis since 2006. These profiles have been designed to help local government and health services assess the effect of alcohol use on their local populations. They will inform commissioning and planning decisions to tackle alcohol use and improve the health of local communities.
The LAPE data tool helps local areas assess alcohol-related harm and monitor the progress of efforts to reduce this.
Definitions and methodology for all LAPE indicators is described in our LAPE user guide.
Hospital admissions update: February 2019
The HES-based indicators are scheduled for update in February 2019. At the same time as the LAPE indicators are updated, the ‘Alcohol-related hospital admissions - Statistical tables for England’ (formerly produced by NHS Digital) will also be updated.
View the previous February 2018 version
Responsible statistician, product lead: Mark Cook
For queries relating to this publication, please contact: lape@phe.gov.uk