Liver disease profiles: statistical commentary, February 2020
Updated 14 February 2020

© Crown copyright 2020
This publication is licensed under the terms of the Open Government Licence v3.0 except where otherwise stated. To view this licence, visit nationalarchives.gov.uk/doc/open-government-licence/version/3 or write to the Information Policy Team, The National Archives, Kew, London TW9 4DU, or email: psi@nationalarchives.gov.uk.
Where we have identified any third party copyright information you will need to obtain permission from the copyright holders concerned.
This publication is available at https://www.gov.uk/government/statistics/liver-disease-profiles-february-2020-update/liver-disease-profiles-statistical-commentary-february-2020
Liver Disease Profiles, February 2020 update
1. New in this update
New hospital admission data has been added to the Liver Disease Profiles
This update includes new data for 4 indicators in the liver disease profile:
-
Hospital admissions for liver disease in persons, males and females
-
Hospital admissions for alcoholic liver disease in persons, males and females
-
Hospital admissions episodes for alcohol specific conditions in persons, males and females
-
Hospital admissions for non-alcoholic fatty liver disease (NAFLD) in persons
Hospital admission data has been newly added for the financial year ending 2019. Three of the indicators also had data for the financial year ending 2018 added. The indicators with data prior to 2018 were refreshed to account for the new 2019 local authority configurations along with the application of the new disclosure control guidance.
2. Main findings
This update shows:
-
rates of admission to hospital where the primary diagnosis was liver disease is the highest (138.3 per 100,000 population) it has been since the financial year ending 2011
-
comparing rates of liver disease in England over time, in the financial year ending 2018 there was a small dip in rate, but the upward trend resumed and has now reached the highest level of the preceding 9 years
-
rates of hospital admission to hospital for alcoholic liver disease is the highest (41.7 per 100,000 population, a count of 22,178 admissions) it has been since the financial year ending 2011
-
rates of admission episodes to hospital for alcoholic-specific conditions are a third higher than they were 10 years ago
-
rates of hospital admissions for non-alcoholic fatty liver disease amongst those in the least deprived deprivation decile for county and UA areas are the third highest with a rate higher than those in the most deprived deprivation decile.
3. Summary
3.1 Hospital admission rate due to liver disease
This indicator has been updated with data for the financial years ending 2018 and 2019 for males, females and persons. Prior data has been refreshed to present data for the new 2019 local authority configurations.
In the financial year ending 2019, the rate of hospital admission for liver disease went up to 138.3 per 100,000 population in England. This increase is reflected in both the male and female rates of 175.1 and 104.2 respectively. The male rate is 1.68 times higher than the female rate. These are the highest rates since the financial year ending 2011, as far back as we have reported.
In the financial year ending 2018 however, there was a decrease in the rate of admissions to hospital for liver disease where the rate dipped to 121.1 per 100,000. This warrants further investigation.
Figure 1: Variation in hospital admission rate for liver disease, per 100,000 population, England, 2010/11 to 2018/19
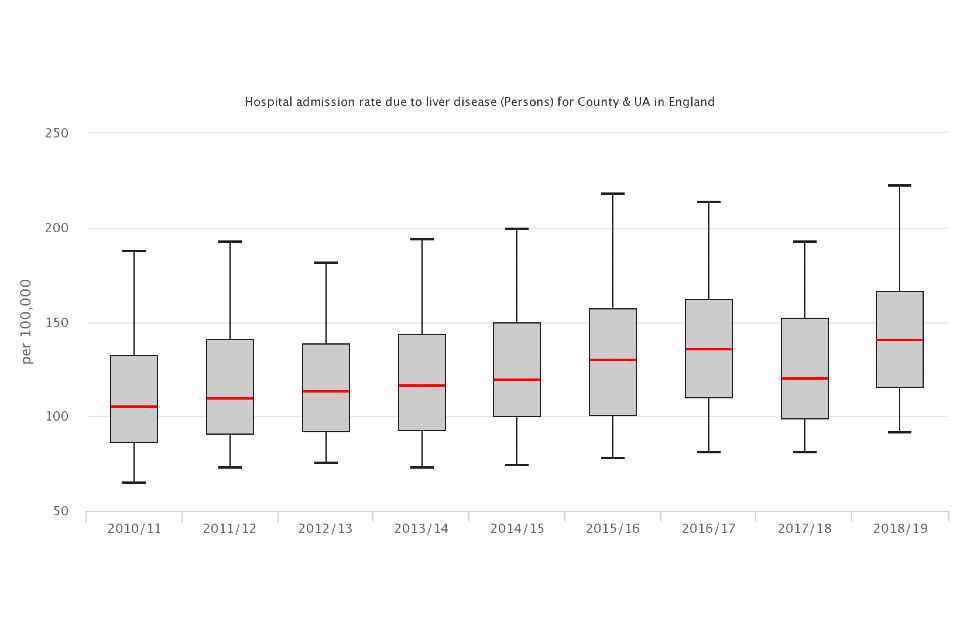
Figure 1: Variation in hospital admission rate for liver disease, per 100,000 population, England, 2010/11 to 2018/19
Liver disease continues to affect more people each year. In the financial year ending 2011 there were 53,101 admissions to hospital, in contrast, in the financial year ending 2019, there were 73,669 admissions. This equates to more than 2,571 additional admissions every year since the financial year ending 2011.
At a regional level, rates of liver disease admissions to hospital are higher in the north of England with the North East having the highest rate followed by Yorkshire and the Humber and the North West. The South West had the 4th highest rate of the 9 English regions.
Across the County and UA areas there is a 4.9-fold difference between the rate of admissions for liver disease. Nottingham UA experienced the highest rates, 320.3 per 100,000 population (735 admission), whilst the lowest rate was in Wokingham, 65.9 per 100,000 population (105 admissions).
Across the districts and UA areas there is almost a 7-fold difference in the rate of liver disease admissions. Nottingham UA remained with the highest rates, Rochford district had the lowest rate of 46.3 per 100,000 population.
Areas with high levels of deprivation experience higher rates of hospital admission for liver disease. Those in the most deprived districts have a rate (171.2 per 100,000 people) that is 1.5 times higher than that of the least deprived districts (111.8 per 100,000 people). The trend shows that the gap between the least and most deprived groups are narrowing, though progress on reducing this gap appears to have slowed down in the most recent 2 years.
Figure 2: Fold difference in between the least and most deprivation deciles for liver disease hospital admissions, per 100,000 population, England, 2010/11 to 2018/19
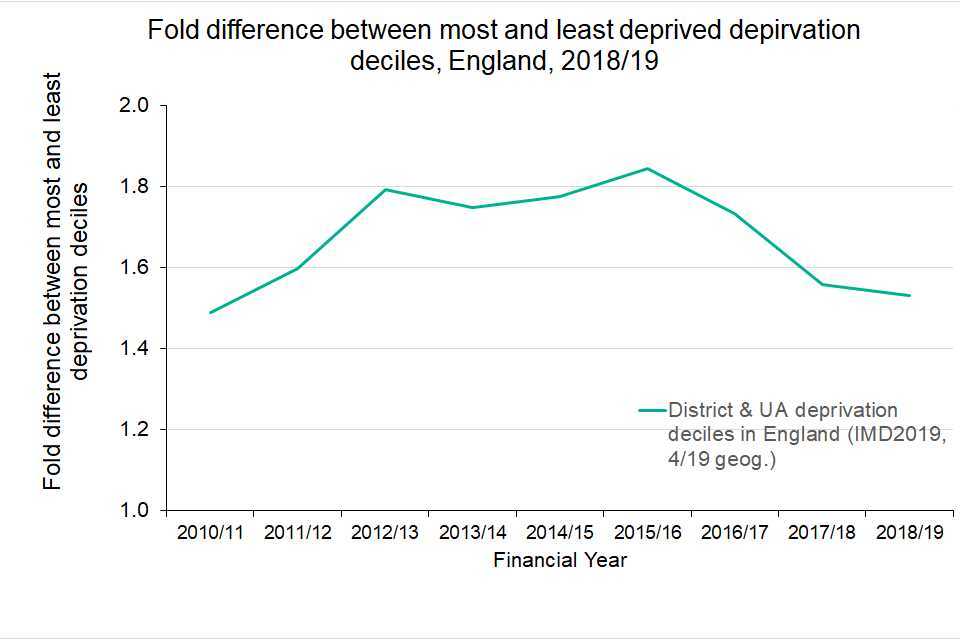
Figure 2: Fold difference in between the least and most deprivation deciles for liver disease hospital admissions, per 100,000 population, England, 2010/11 to 2018/19
3.2 Hospital admission rate for alcoholic liver disease
This indicator has been updated with data for the financial years ending 2018 and 2019, for males, females and persons. Prior data has been refreshed to present data for the new 2019 local authority configurations.
The rate of hospital admission for alcoholic liver disease has continued to increase since the financial year ending 2013. In the financial year ending 2019 the rate reached 41.7 per 100,000 population, a count of 22,178 admissions.
Figure 3: Trend in hospital admission rate for alcoholic liver disease, per 100,000 population, England, 2010/11 to 2018/19
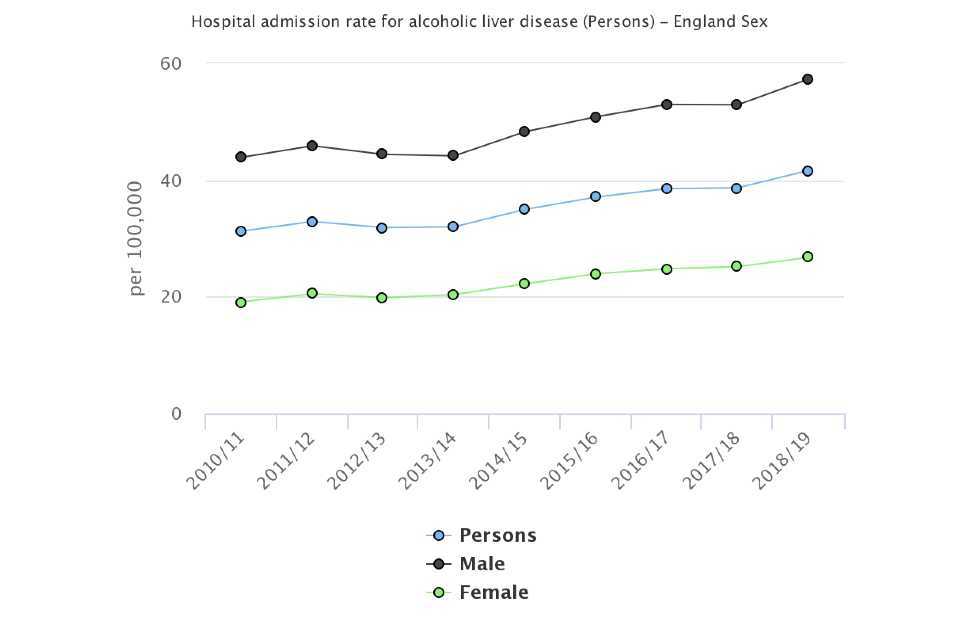
Figure 3: Trend in hospital admission rate for alcoholic liver disease, per 100,000 population, England, 2010/11 to 2018/19
The rate of hospital admissions for alcoholic liver disease is significantly higher in males (57.3 per 100,000 population) than for females (26.8 per 100,000 population). The unitary authority with the largest difference between male and female rates was the county of Cambridgeshire where there was a 5.8-fold difference (54.8 per 100,000 population in males and 9.5 females).
Across the county and unitary authority areas, rates varied from 15.8 per 100,000 population in Barnet to 116.3 in Nottingham (figure 4).
Figure 4: Hospital admission rate for alcoholic liver disease, per 100,000 population, upper tier local authorities, 2018/19
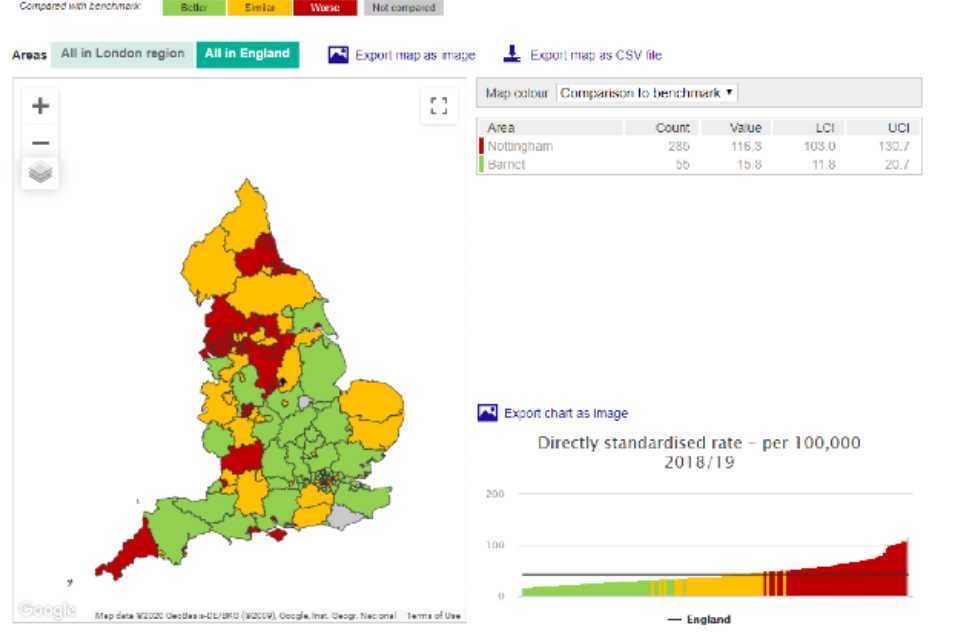
Figure 4: Hospital admission rate for alcoholic liver disease, per 100,000 population, upper tier local authorities, 2018/19
3.3 Admission episodes for alcohol-specific conditions
10 years ago, the rate of admission episodes for alcohol-specific conditions was a third lower than it is now, with rates in the financial year ending 2019 having reached 626 per 100,000 population. The rate for the financial year ending 2019 is significantly higher than the previous year.
Figure 5: Trend in admission episodes in hospital for alcohol-specific conditions, per 100,000 population, England
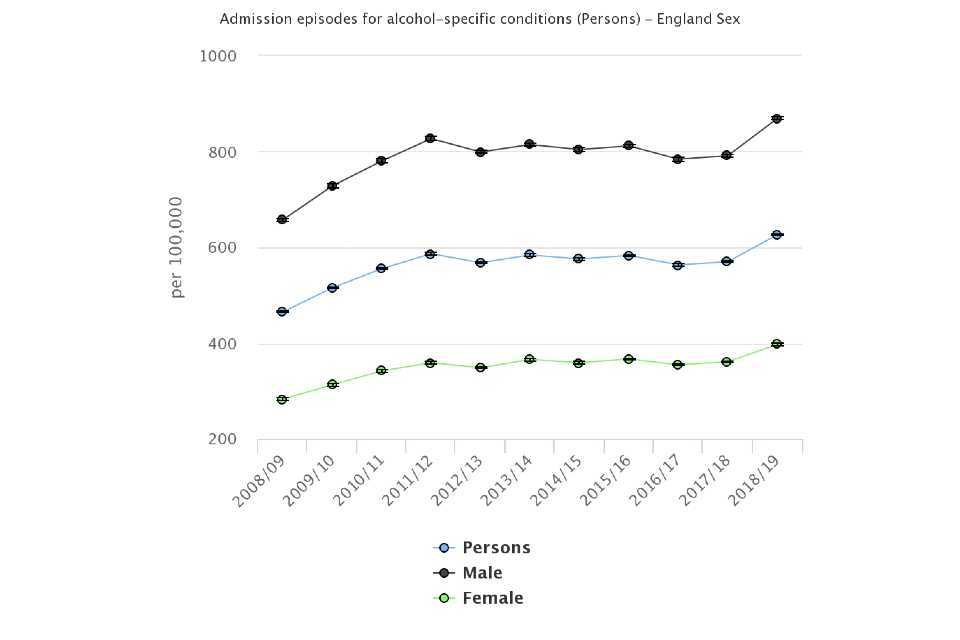
Figure 5: Trend in admission episodes in hospital for alcohol-specific conditions, per 100,000 population, England
Regionally, rates experienced in the North East (908.5 per 100,000 population) and North West 883.4 per 100,000 population) are the highest in the country.
At a county and UA level, in the financial year ending 2019, the highest rate was experienced by Southampton with a rate of 2,073.7 per 100,000 population. Rutland had the lowest rate of 291 per 100,000 population. There is a 7.1-fold difference between the rates in these two areas.
The rate in Southampton is significantly higher than the next highest’s rates which were in Salford at 1,629 per 100,000 population and Blackpool 1,309 per 100,000 population.
Rates in males are significantly higher than females. In general areas with the highest rates for males are also the areas with highest rates for females.
Figure 6: Admission episodes in hospital for alcohol-specific conditions, per 100,000 population, England, males and females
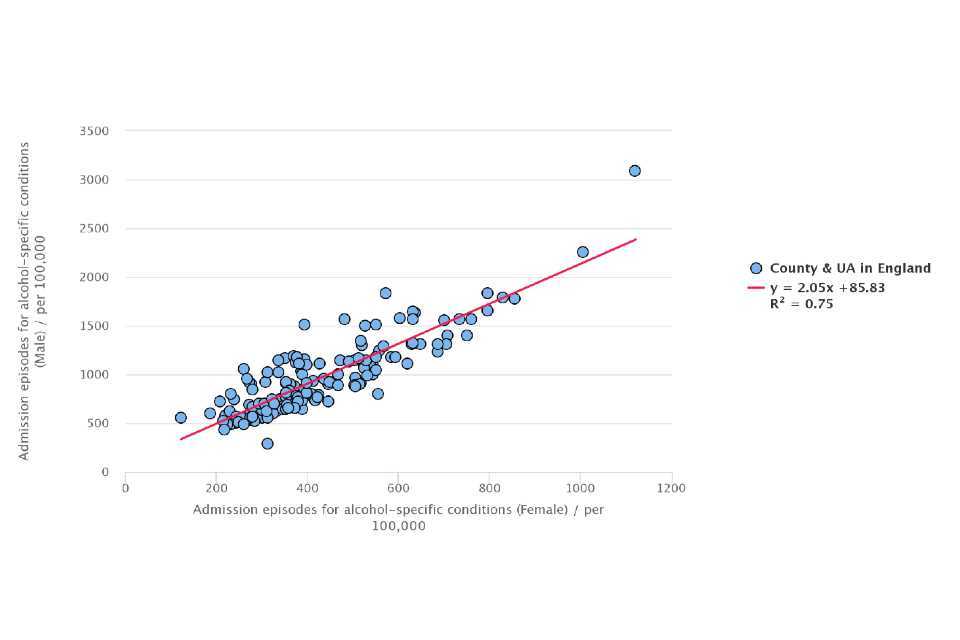
Figure 6: Admission episodes in hospital for alcohol-specific conditions, per 100,000 population, England, males and females
Across the county and UA deprivation deciles for 2019, the most deprived areas experience significantly higher rates of admission episodes for alcohol-specific conditions than the least deprived areas.
3.4 Hospital admission rate due to non-alcoholic fatty liver disease
In England over the 3-financial years ending 2019, 7,425 people were admitted to hospital due to non-alcoholic fatty liver disease, at a rate of 4.5 per 100,000 population. This rate has been increasing over time.
Rates were twice as higher in the North East region (6.7 per 100,000 population) than the West Midlands (2.7 per 100,000 population) who regionally had the lowest rate.
Across the county and UA areas, Nottingham had the highest rate of admissions for non-alcoholic fatty liver disease at 18.3 per 100,000 population, Leeds had the highest number of admissions with 285 people.
When considering deprivation, the rates of admission for non-alcoholic fatty liver disease amongst the county and UA areas classed in the least deprived areas are the third highest at 5.4 per 100,000 population. The most deprived decile had a rate of 5.0 per 100,000 population. The second and third more deprived deciles had the highest rates at 5.6 and 5.9 per 100,000 population, respectively.
Figure 7: Hospital admission rates for non- alcoholic fatty liver disease, per 100,000 population, England, 2016/17 – 2018/19, by deprivation deciles in 2019
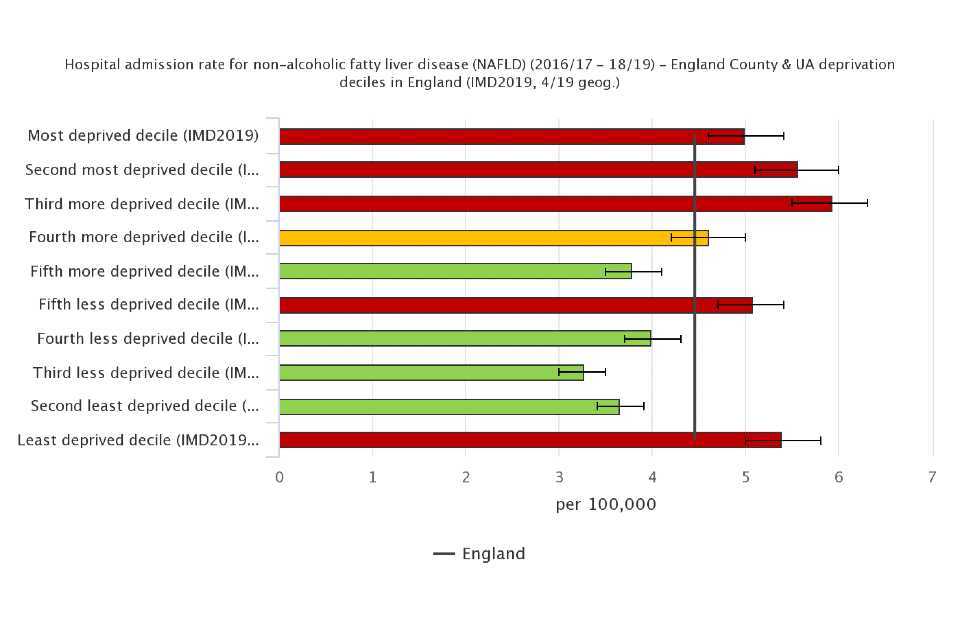
Figure 7: Hospital admission rates for non- alcoholic fatty liver disease, per 100,000 population, England, 2016/17 – 2018/19, by deprivation deciles in 2019
4. Background and further information
Liver disease is almost entirely preventable with the major risk factors: alcohol, obesity and hepatitis B and C accounting for up to 90% of cases.
The liver disease profiles provide an invaluable resource relating to one of the main causes of premature mortality nationally; a disease whose mortality rates are increasing in England, while decreasing in most EU countries. The local authority profiles will support the development of Joint Strategic Needs Assessments and work of health and wellbeing boards presenting local key statistics and highlighting questions to ask locally about current action to prevent liver disease.
The website contains data for upper tier local authorities, former Government Office regions, England and where available lower tier local authorities.
The profiles, aimed at primarily LAPH were developed following recommendations in March 2014 from the All-Party Parliamentary Hepatology Group (APPHG) inquiry into improving outcomes in liver disease. Recommendations the LA profiles aim to address were:
- PHE should address the worrying lack of data on all aspects of liver disease by developing a dataset to allow performance management of liver disease across CCGs, local authorities and health and wellbeing boards
- health and wellbeing boards should monitor early detection, treatment and mortality rates from liver disease; assessing progress on tackling liver disease should be made a mandatory part of the joint strategic planning process for CCGs and local authorities
Note: This bulletin has been reissued due to an error was identified in hospital episode statistics (HES) data which gave misleading results for areas within the South East region and East Sussex. Full details can be found in the caveats section of the descriptive metadata for each affected indicator.
Further details about the profile methodology are available within the definitions section of the online version of the liver disease profile.
Responsible statistician, product lead: Liz Rolfe, Julia Verne
For queries relating to this document, please contact: liverdisease@phe.gov.uk