Life Chances Fund intermediate evaluation: data release
Published 31 August 2023
Applies to England

© Crown copyright 2023
This publication is licensed under the terms of the Open Government Licence v3.0 except where otherwise stated. To view this licence, visit nationalarchives.gov.uk/doc/open-government-licence/version/3 or write to the Information Policy Team, The National Archives, Kew, London TW9 4DU, or email: psi@nationalarchives.gov.uk.
Where we have identified any third party copyright information you will need to obtain permission from the copyright holders concerned.
This publication is available at https://www.gov.uk/government/publications/life-chances-fund-interim-evaluation-data-set/life-chances-fund-intermediate-evaluation-data-release
1. Introduction
The Life Chances Fund (LCF) is a £70 million fund managed by the Civil Society and Youth Team in the Department for Culture, Media and Sport, designed to help people in society who face the most significant barriers to leading happy and productive lives.[footnote 1] It is dedicated to supporting the growth and development of outcomes-based commissioning through the use of social impact bonds (SIBs), also known as social outcomes partnerships (SOPs). The LCF catalyses the adoption of outcomes-based contracts by providing a minority contribution to ‘top-up’ the payment for outcomes alongside local government commissioners in England. By increasing the number and scale of SIBs in England, the LCF aspires to make it easier and quicker to set up future SIBs, and to build evidence on what works.
The Government Outcomes Lab, hosted at the Blavatnik School of Government, University of Oxford is the learning and evaluation partner for the LCF. Further case studies and project details are available via the GO Lab website.
Further information on SIBs and the LCF (including the interim evaluation reports) can be found at Social Outcomes Partnerships and the Life Chances Fund.
Data sources
This data release presents analysis from a longitudinal survey of SIB stakeholders and is based on two main sources of data:
- management data based on applicant-supplied information to offer descriptive impact bond project information
- data from a voluntary longitudinal survey conducted with unique SIB stakeholders including local commissioners and service provider organisations involved in the delivery of LCF impact bond projects
Wave 1 of the survey was conducted during mobilisation and early implementation, and was administered from August 2018 to December 2019. It includes 87 respondents, of whom 82 completed the survey.
Wave 2 of the survey was conducted during implementation in June - August 2021. It includes 142 respondents, of whom 95 completed the full survey. Further details are provided in Figure 1.
The survey analysis presented below explores four aspects of the LCF’s development and delivery:
-
Project development
-
Implementation and delivery
-
Trust and collaboration
-
Performance management
Figure 1: Survey respondent roles in SIB projects
| Survey | Commissioner | Provider | Investor | Intermediary | Total |
|---|---|---|---|---|---|
| Wave 1 | 32 | 46 | 0 | 4 | 82 |
| Wave 2 | 33 | 58 | 2 | 2 | 95 |
Base count: 82 respondents in Wave 1; 95 respondents in Wave 2
2. Project development
This section summarises the key characteristics of the LCF in order to provide an understanding of the diversity across projects; the factors influencing the decision to get involved; and the objectives that participants are seeking to accomplish.
There is a diverse range of SIBs being implemented across the LCF, covering a number of policy areas and beneficiaries across England:
- total of 29 SIBs
- total capital raised is approximately £20 million
- total number of beneficiaries is 53,000+ users
- the most common policy areas are child and family welfare (33%) and employment and training (27%) (Figure 2)
- in all SIBs, local governments have committed to paying for the majority of total outcomes (67% of maximum potential outcome payments) compared to central government (33%) across all policy areas (Figure 3)
Figure 2: Policy areas
| Policy area | percentage of LCF projects |
|---|---|
| Child and family welfare | 33% |
| Employment and training | 27% |
| Health | 13% |
| Homelessness | 13% |
| Education | 10% |
| Criminal justice | 3% |
Base count: 29 LCF projects
Figure 3: Commitment of total outcomes payment (%) – by policy area
| Policy area | Central government % | Local government % | Total |
|---|---|---|---|
| Overall mean | 34 | 66 | |
| Child and family welfare | 27 | 73 | |
| Education | 27 | 73 | |
| Homelessness | 32 | 68 | |
| Health | 32 | 68 | |
| Employment and training | 41 | 59 | |
| Criminal justice | 44 | 56 |
Base count: 29 LCF projects
Further details on LCF projects can be accessed at this interactive map [footnote 2]
In order to understand the major factors influencing the decision to engage in a SIB, respondents were asked how strongly the availability of top-up funding through the LCF influenced this. Respondents indicated this factor was ‘very influential’.
The key objective that respondents hoped to accomplish is scaling up successful interventions and securing additional funding (Figure 4). These objectives may be a reflection of the stakeholder’s role in the SIB; providers seeking to scale up successful interventions compared to local government commissioners who are seeking to shift focus to outcomes, with both seeking to secure additional funding (Figure 5).
Figure 4: Rationales for SIB engagement[footnote 3]
| Rationale | average rank |
|---|---|
| Scale up successful interventions | 6.1 |
| Secure additional funding | 5.7 |
| Shift focus to outcomes | 5.4 |
| Sustain collaborative efforts | 5.0 |
| Shift spending to prevention | 4.4 |
| Increase flexibility | 4.0 |
| Transfer risk away | 3.1 |
| Introduce market discipline | 2.3 |
Base count: 124 respondents
Figure 5: SIB goals by organisational role[footnote 4]
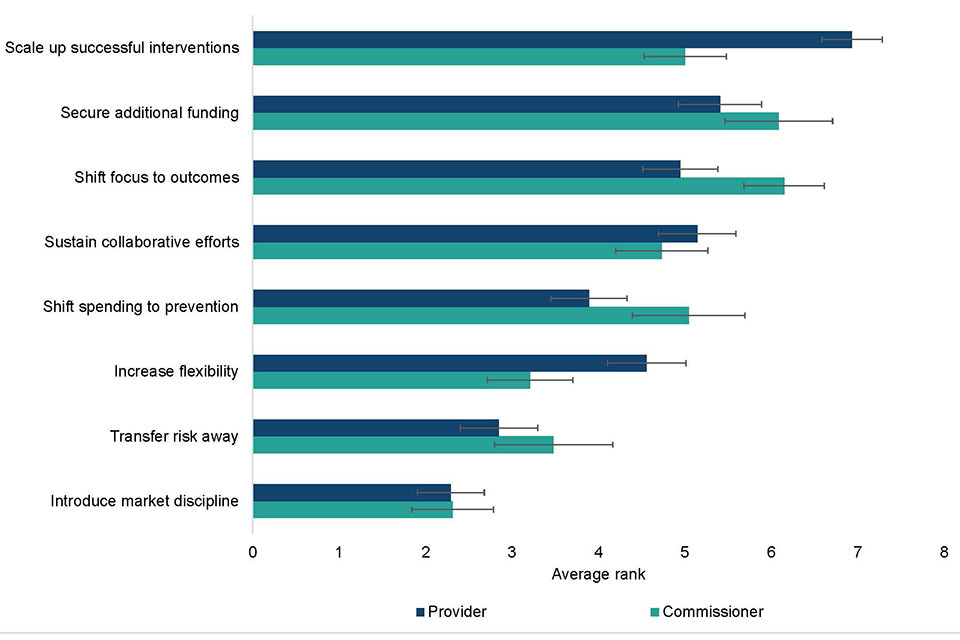
Description of figure 5: a bar chart with confidence intervals showing that providers seeking to scale up successful interventions is higher (6.9, 95% CI [6.6, 7.3]) than commissioners (5.0, 95% CI [4.5, 5.5]). Also, commissioners seeking to shift focus to outcomes (6.1, 95% CI [5.7, 6.6]) is higher than providers (4.9, 95% CI [4.5, 5.4]). Base count: 120 respondents (72 providers; 48 commissioners).
3. Implementation and delivery
Collaboration is at the centrepiece of the SIB contractual relationship, through the shared focus on outcomes across stakeholders. This section outlines the perceived benefits and drawbacks associated with collaboration during implementation. This will enable measurement on whether attitudes towards collaboration evolve over the course of the SIB.
Benefits
Overall, all listed benefits were reported to have already occurred or were expected to occur.
The main benefits occurring during implementation were the development of new, valuable relationships and enhanced ability to serve service users (Figure 6), which was consistently reported regardless of the organisation’s role in the SIB. Respondents from SIBs with a Special Purpose Vehicle (SPV) generally expected more benefits to occur than those without a SPV.[footnote 5] This demonstrates the potential of SIBs to foster cross-sectoral collaboration through new relationships.
Benefits not expected to occur were considerably smaller in magnitude than those that had already occurred, or were expected to occur. Notwithstanding, they include the increased ability to shift resources (30%) and enhanced influence in the community (26%), which may be a reflection of the longer-term nature of these benefits.[footnote 6]
Figure 6. Potential Perceived Benefits[footnote 7]
| Benefit | Already occurred % | Expected to occur % | Are not expected to occur % | Total |
|---|---|---|---|---|
| Development of new, valuable relationships | 81 | 16 | 4 | |
| Enhanced ability to serve service users | 74 | 24 | 2 | |
| Acquisition of new knowledge and skills | 71 | 23 | 6 | |
| Enhanced ability to serve the community | 65 | 27 | 7 | |
| Increased utilisation of organisation’s service | 57 | 32 | 11 | |
| Acquisition of additional funding | 54 | 26 | 20 | |
| Increased ability to shift resources | 39 | 31 | 30 | |
| Heightened public profile of organisation | 39 | 37 | 23 | |
| Enhanced influence in the community | 32 | 42 | 26 |
Base count: 107 respondents
Drawbacks
The main drawback occurring during implementation is diversion of time and resources (Figure 7), which was reported across all organisation types and roles. In particular, providers reported that a larger number of drawbacks had already occurred compared to commissioners from local government (Figure 8). [footnote 8] This may stem from the technical complexity and increased reporting and monitoring requirements associated with SIBs.
Around 30% of respondents experienced frustration in dealing with partners, but the majority did not expect this to occur in future (Figure 7). This finding supports the hypothesis that SIB projects may potentially facilitate trust and mission alignment between partners (Millner and Meyer, 2022), but it is not always a given.
Respondents with prior outcomes-based contracting experience had a lower expectation that drawbacks would occur, indicating that prior experience can facilitate implementation and delivery.
Figure 7: The potential perceived drawbacks of SIBs[footnote 9]
| Drawback | Already occurred % | Expected to occur % | Are not expected to occur % | Total |
|---|---|---|---|---|
| Insufficient credit given to organisations | 12 | 6 | 82 | |
| Strained relations within organisation | 19 | 3 | 78 | |
| Loss of control or autonomy | 22 | 2 | 76 | |
| Frustration in dealing with partners | 30 | 12 | 58 | |
| Diversion of time and resources | 54 | 3 | 44 |
Base count: 108 respondents
Figure 8: Drawbacks by organisational role[footnote 10]
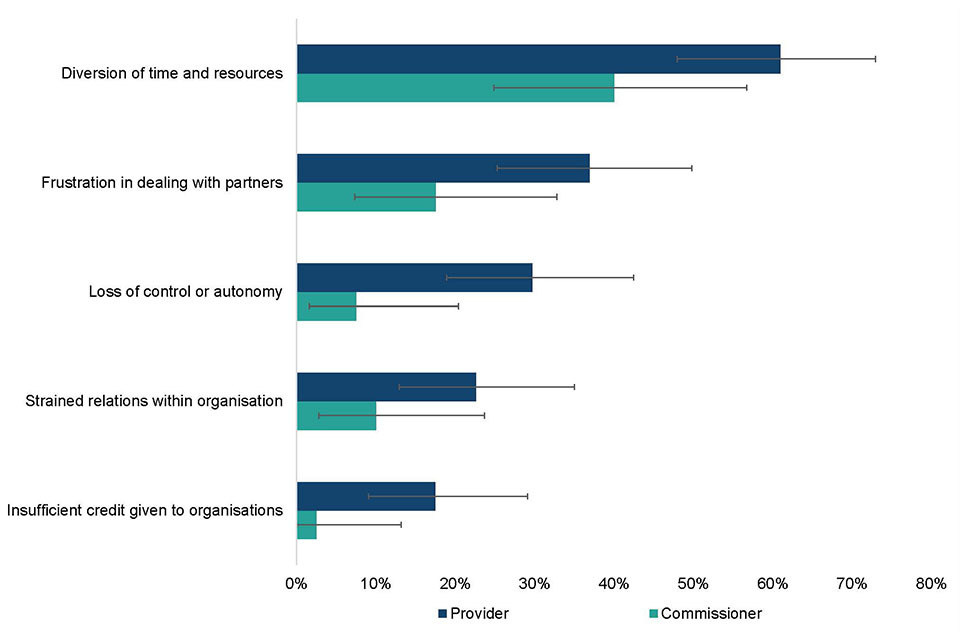
Description of figure 8: a bar chart with confidence intervals showing that more providers reported that drawbacks have already occurred across all the five measures, compared to commissioners. For example, more providers reported that the diversion of time and resources had already occurred (0.6, 95% CI [0.5, 0.7]) compared to commissioners (0.4, 95% CI [0.2, 0.6]). Base count: 105 respondents (65 providers; 40 commissioners).
4. Trust and collaboration
Trust is an important component of collaboration and is critical for successful network integration. This section analyses reported levels of trust between SIB stakeholders and goal alignment between network partners.
Trust between SIB stakeholders is considered along five dimensions:[footnote 11]
-
Agreement trust: partners generally live up to the agreements made with each other
-
Benefit of the doubt: partners give one another the benefit of the doubt
-
Reliability: partners keep in mind the intentions of the other partners
-
Absence of opportunistic behaviour: partners do not use the contributions of other actors for their own advantage
-
Goodwill trust: partners can assume that the intentions of others are good in principle.
Overall, there was general agreement amongst respondents that stakeholders are trustworthy along all five dimensions (Figure 9).
Social enterprises / charities reported statistically significant lower levels of trust on all dimensions relative to other organisation types (Figure 10)[footnote 12], and results indicate that prior experience with outcomes-based contracting (OBC) is associated with higher levels of trust.[footnote 13]
Figure 9: Integration across SIB stakeholders
| Integration across SIB stakeholders | Average trust score (strongly disagree = 1 to strongly agree = 5) |
|---|---|
| Live up to agreements | 4.19 |
| Give one another the benefit of the doubt | 3.99 |
| Keep in mind the intentions of other parties | 4.06 |
| Do not act for their own advantage | 3.81 |
| Assume partner intentions are good | 4.26 |
Base count: 105 respondents (65 providers; 40 commissioners)
Figure 10: Overall perception of trust – by organisation type[footnote 14]

Description of figure 10: Bar chart with confidence intervals showing that the overall trust score reported by social enterprises/charities is lower (3.7, 95% CI [3.4, 4.1]) than for other stakeholders such as local government (4.1, 95% CI [4.0, 4.3]). Base count: 117 respondents.
Stakeholders were asked about the extent of differences in the goals of their organisation in comparison to other SIB stakeholders:
In Wave 2, there is significantly enhanced goal alignment between local governments and investors relative to Wave 1 (Figure 11). There was also a small increase in the goal alignment between local governments and providers across waves, but no significant differences in alignment over time between providers and investors.[footnote 15] This indicates that shared objectives through the SIB’s outcomes framework may work to align interests over time.
Figure 11: Local governments’ assessment of the alignment of their goals with investors (waves 1 and 2)[footnote 16]
| Alignment of goals | Wave 1 | Wave 2 |
|---|---|---|
| No differences | 0.08 | 0.36 |
| Few differences | 0.46 | 0.46 |
| Some differences | 0.41 | 0.29 |
| Moderate differences | 0.08 | 0.11 |
| Significant differences | 0.11 | 0.04 |
| Large differences | 0.05 | 0 |
Base count: 79 local government respondents
5. Performance management
Outcome indicators are the key criterion by which payments from the commissioner are unlocked, so performance management is a central part of a SIB. It can be used to monitor performance, and adapt implementation and delivery to ensure that outcomes will be achieved.
Systematically collected performance information about how well an organisation is delivering against its goals is most frequently used to make day-to-day decisions, with 79% of respondents using it for this purpose on a weekly or less basis (Figure 12). Performance information is also used to make services more efficient, advocate to stakeholders, make strategic decisions and make personnel decisions on a monthly to weekly or less basis. This is consistent regardless of organisation type or SIB role.
Figure 12: Frequency of performance information use (Wave 1 and 2)[footnote 17]
| Performance information use | Weekly or less % | Monthly % | Yearly % | Never % | Total |
|---|---|---|---|---|---|
| Learn how to make services more efficient | 35 | 54 | 11 | 1 | |
| Allocate resources | 43 | 39 | 17 | 1 | |
| Advocate to stakeholders | 38 | 51 | 9 | 2 | |
| Make day-to-day decisions | 79 | 16 | 2 | 3 | |
| Make strategic decisions | 35 | 53 | 11 | 0 | |
| Make personnel decisions | 43 | 44 | 9 | 4 |
Base count: 186 respondents
However, collecting performance information can be viewed as ‘red tape’, entailing a compliance burden that does not advance legitimate purposes.[footnote 18] This section therefore considers the perceived extent of red tape associated with the SIB by asking respondents how unnecessary, ineffective and burdensome the SIB’s policies and procedures are relative to their own organisation’s policies and procedures:[footnote 19]
Providers consider SIB-related red tape to be significantly more burdensome than local governments (Figure 13), most likely due to the resource-intensive reporting requirements.[footnote 20]
However, the findings suggest that the presence of an SPV can lower this administrative burden, although this difference is not statistically significant which may be due to the small sample sizes.
Figure 13: How unnecessary, ineffective and burdensome are the SIB’s policies and procedures relative to your own organisation’s?[footnote 21]
| Perception of the SIB’s policies and procedures | Providers (VCSE sector ) | Local governments |
|---|---|---|
| Unnecessary | 0.25 | 0.05 |
| Ineffective | 0.14 | 0.10 |
| Burdensome | 1.00 | 0.12 |
Base count: 111 respondents
6. Conclusions
Project development: the key objectives that respondents hoped to accomplish through the SIB include scaling up successful interventions, securing additional funding and shifting focus to outcomes.
Implementation and delivery: there are a wide range of benefits viewed to have occurred by all stakeholders; however, providers reported more drawbacks than others.
Trust and collaboration: trust is generally high, but social enterprises and charities express lower levels of trust. Prior experience with outcomes-based contracting is associated with higher levels of trust.
Performance management: providers view SIB contracts to be more burdensome than commissioners, but the presence of a Special Purpose Vehicle can help to reduce this.
7. Next steps
This analysis forms part of the multi-strand Life Chances Fund evaluation. This involves detailed longitudinal studies of the Kirklees Better Outcomes Partnership and Mental Health and Employment Partnership. The primary evaluation will continue to explore the implementation of all SIBs supported by the Life Chances Fund. The next step will involve two key domains of data collection and analysis:
-
The final wave of the primary evaluation survey (wave 3) will be used to collect reflections from all local commissioners and service providers involved in LCF projects. We will continue to explore the themes raised in this data release and will ask additional questions related to sustainability.
-
The achievement of social outcomes and other dimensions of performance will be compiled from fund administration data. We will investigate features associated with SIB project success.
8. References
Borry, E. L. (2016), A New Measure of Red Tape: Introducing the Three-Item Red Tape (TIRT) Scale. International Public Management Journal, 19, 4, pp. 573-593.
Klijn E-H., Edelenbos, J. & Steijn, B. (2010), Trust in Governance Networks: Its Impacts on Outcomes. Administration and Society, 42, 2, pp. 193-221.
Lasker, R. D., Weiss, E. S. & Miller, R. (2001), Partnership Synergy: A Practical Framework for Studying and Strengthening the Collaborative Advantage. The Milbank Quarterly, 79, 2, pp. 179-205.
Millner, R. & Meyer, M. (2022), Collaborative governance in Social Impact Bonds: aligning interests within divergent accountabilities? Public Management Review, 24, 5, pp. 729-751.
Provan, K., Nakama, L., Veazie, M., Teufel-Shone, N. & Huddleston, C. (2003), Building community capacity around chronic disease services through a collaborative interorganizational network. Health Educ Behav, 30, 6, pp. 646-62.
-
The LCF was originally launched as an £80m fund but was reduced to £70m in 2020. This does not affect individual projects’ budgets or delivery. ↩
-
This lists the total number of SIBs as 30, due to the inclusion of one project which has been discontinued. ↩
-
All respondents were asked to rank their priorities in terms of what they hoped to accomplish by using a SIB, from 1 (lowest) to 8 (highest), n=124. ↩
-
All respondents were asked to rank their priorities in terms of what they hoped to accomplish by using a SIB, from 1 (lowest) to 8 (highest). Sample comprises providers (n=72) and commissioners (n=48). Error bars are 95% confidence intervals. ↩
-
A legal entity (usually a limited company) that is created solely for a financial transaction or to fulfil a specific contractual objective. ↩
-
The ability of partners to pool resources (e.g. money, skills, information) is considered an important benefit of collaboration (Lasker et al., 2001, Provan et al., 2003). ↩
-
Figure 6 considers 107 respondents (n=35 missing, 25% of wave 2). All respondents were asked to ‘indicate whether the following possible benefits of your SIB have, in your opinion, already occurred, are expected to occur, or are not expected to occur.’ This follows an attitudinal measure of network involvement for perceived benefits (Provan et al., 2003). The figure plots the frequencies per category in each choice. Available choices are ordered according to the selection with higher frequency of ‘already occurred’ (the highest with 80% for ‘development of new, valuable relationships’). ↩
-
When all drawbacks are consolidated into a single measure, providers reported that a larger number of drawbacks had already occurred or were expected to occur compared to commissioners, which is statistically significant (p=0.002). ↩
-
Figure 7 shows responses from 108 respondents (n=34 missing, 24% of wave 2). All respondents were asked to ‘indicate whether the following possible drawbacks of your SIB have, in your opinion, already occurred, are expected to occur, or are not expected to occur. This follows an attitudinal measure of network involvement for perceived drawbacks (Provan et al., 2003). The figure plots the frequencies per category in each choice. Available choices are ordered according to the selection, with higher frequency of ‘already occurred’ (the highest with ‘diversion of time and resources’ at around 56%). ↩
-
All respondents were asked to ‘indicate whether the following possible drawbacks of your SIB have, in your opinion, already occurred, are expected to occur, or are not expected to occur’. This figure plots the frequency of those reporting that drawbacks have already occurred. Sample comprises commissioners (n=40) and providers (n=65). Error bars are 95% confidence intervals. ↩
-
Klijn E-H. et al. (2010). ↩
-
When all five trust measures are consolidated into a single measure, social enterprises / charities had a significantly lower mean rating of trust by -0.434 (p=0.002) compared to all other organisation types. ↩
-
Respondents with prior OBC experience (n=27) had a higher mean rating of trust by 0.335 compared to those with no prior OBC experience (n=20), although this was significant at the 10% level (p=0.095) and these results are based on small samples. ↩
-
All respondents were asked to indicate the extent to which they agree or disagree with five different 5-scale Likert statements related to network involvement and trust (Klijn et al., 2010). This figure consolidates the five trust measures in Figure 3 into a single measure and plots the mean across all five measures. Error bars are 95% confidence intervals. The sample includes 117 respondents (n=25 missing, 18% of wave 2), including social enterprise, charity and not-for-profit (n=22), private enterprise (n=6), local government (n=41) and other (n=48). ↩
-
This is significant at the 10% level (p=0.056). ↩
-
This considers 79 respondents (all from local governments, n=44 for wave 1, and n=35 for wave 2, total missing of n=63, 44% of the subsample). In wave 1 (set up), respondents were asked: ‘During the planning phase of your SIB, to what extent did you feel there were differences in philosophy and goals between your organisation and the following list of stakeholders [investors for this plot] that hindered collaboration?’. In wave 2 (implementation), the question was: ‘Since the start of service delivery, to what extent are there differences in organisational philosophies and goals between your organisation and listed stakeholders [investors for this plot] that have hindered collaboration?’. The difference is statistically significant considering both parametric (t-tests) and non-parametric (Chi-square) tests. ↩
-
All respondents were asked ‘Performance information is systematically collected information about how well an organisation is delivering against its goals, capturing more than just its inputs. Across all its activities, to what extent does your organisation currently use performance information to: learn how to make services more efficient (181 respondents, n=188 missing); allocate resources (173 respondents; n=194 missing); advocate to stakeholders (171 respondents, n=198 missing); make day-to-day decisions (179 respondents, n=190 missing); make strategic decisions (186 respondents, n=183 missing); and make personnel decisions (167 respondents, n=202 missing).’ ↩
-
Refer to Borry (2016) for further discussion of red tape. ↩
-
These three items of red tape are based on the Three-Item Red Tape scale in Borry (2016). ↩
-
Providers reported the SIB to be significantly more burdensome than local government by 0.976 (p=0.001). ↩
-
All respondents were asked how burdensome, unnecessary or ineffective the policies and procedures are in both their own organisation and in procedures and policies related to the SIB (111 respondents, n=31 missing, 22% of the wave 2) based on a 5-point Likert scale where: 1= not burdensome to 5= highly burdensome; 1= highly necessary to 5=highly unnecessary; 1=highly effective to 5= highly ineffective. This is adapted from a three-item red tape scale (Borry, 2016). This graph shows the difference between the mean rating of the SIB and the respondent’s own organisation; a larger difference indicates that the SIB’s policies and procedures are more unnecessary / ineffective / burdensome (i.e. 0 indicates no difference between the SIB and the respondent’s organisation and a value greater than 0 indicates that the SIB has a higher level of red tape than the respondent’s organisation). Sample comprises providers from the Voluntary, Community and Social Enterprise (VCSE) sector (n=22) and local governments (n=41). ↩