Learning during the pandemic: the context for assessments in summer 2021
Published 12 July 2021
Applies to England

© Crown copyright 2021
This publication is licensed under the terms of the Open Government Licence v3.0 except where otherwise stated. To view this licence, visit nationalarchives.gov.uk/doc/open-government-licence/version/3 or write to the Information Policy Team, The National Archives, Kew, London TW9 4DU, or email: psi@nationalarchives.gov.uk.
Where we have identified any third party copyright information you will need to obtain permission from the copyright holders concerned.
This publication is available at https://www.gov.uk/government/publications/learning-during-the-pandemic/learning-during-the-pandemic-the-context-for-assessments-in-summer-2021
Authors
Paul E. Newton, from Ofqual’s Strategy, Risk, and Research Directorate.
With thanks to colleagues from
- Department for Education
- Education Endowment Foundation
- Education Policy Institute
- FFT Education Datalab
- GL Assessment
- ImpactEd
- Institute for Fiscal Studies
- Juniper Education
- National Foundation for Educational Research
- No More Marking
- Ofsted
- Open Data Institute
- Renaissance
- RS Assessment from Hodder Education
- SchoolDash
- University College London
- University of Exeter
Thanks also to those who have very kindly provided feedback on report drafts, including colleagues from Ofqual, and the Department for Education, and Tina Isaacs.
Executive summary
Since schools across the nation terminated whole-class in-school tuition, back in March 2020, a body of research and analysis devoted to learning during the pandemic has emerged. To support effective policy making in the run up to summer 2021 (and beyond) we have closely monitored this work, to provide an evidence base for the many decisions that needed to be taken.
We have now drawn this work together as a series of literature reviews. Alongside the present report – which provides an overview of the project and its conclusions – we are publishing 4 additional reports in our ‘Learning During the Pandemic’ series:
- Quantifying lost time (report 2).
- Quantifying lost learning (report 3).
- Review of research from England (report 4).
- Review of international research (report 5).
Our overarching objective was to understand the impact of the pandemic on levels of learning that were likely to be achieved by summer 2021, with a particular focus upon students in England from years 11 to 13. Our reports provide a context for understanding qualification results in summer 2021. In compiling these reports, we have drawn upon a wide range of research and analysis. This includes evidence from England, and from overseas, spanning both primary and secondary schooling.
Over the past year or so, media headlines have repeatedly expressed concerns over the weeks and months that students have lost since COVID-19 struck. Unfortunately, this idea of ‘lost time’ is a slippery one in the context of teaching and learning, because it can be interpreted in a variety of different ways. Report 2 helps to make sense of this idea. It begins by explaining the chronology of the pandemic in terms of its impacts on schooling, having broken down the two most recent academic years into five distinct phases:
- Phase 0 – September 2019 to late March 2020 (pre-pandemic)
- Phase 1 – late March 2020 to end summer term 2020 (mainly remote learning)
- Phase 2 – autumn term 2020 (mainly ‘new normal’ learning)
- Phase 3 – January 2021 to early March 2021 (mainly remote learning)
- Phase 4 – early March 2021 to mid May 2021 (mainly ‘new normal’ learning)
It then unpacks alternative meanings of ‘lost time’ before estimating how much students in different circumstances might actually have lost.
Report 3 attempts to quantify ‘lost learning’ directly, by reviewing research and analyses based upon large-scale attainment datasets collected during the pandemic. In theory, this represents an ideal source of evidence for the purpose of the present project. Unfortunately, in practice, these data are limited in a variety of ways, and can only tell a partial story.
Report 4 reviews the broader landscape of research and analysis into learning during the pandemic, providing a comprehensive overview of reports published in England since March 2020. We restricted our review to reports that focused upon impacts on learning, and factors that were likely to influence levels of learning. We did not focus upon longer term consequences of the pandemic, nor upon how those consequences might be addressed.
Finally, report 5 provides a more selective overview of insights from research and analysis conducted internationally since March 2020. We focused upon reports that appeared to be particularly important and influential, as it would not have been feasible to attempt a comprehensive review.
On the basis of the research and analysis that we reviewed, it seems safe to conclude that:
- during each of the phases of the pandemic, students in England have had to study under abnormal circumstances, typically less than ideal circumstances, and sometimes very unfavourable ones
- • by summer 2021, the most widespread concern will have been less effective learning during periods that students were studying, rather than less time spent studying, because most students will have been studying for much of the time that was available to them, albeit under abnormal circumstances – this questions the relevance of the ‘summer holiday learning loss’ phenomenon to understanding learning during the pandemic
- as the pandemic progressed through a number of quite distinct phases, learners seem likely to have lost relatively less learning, as teachers, students, and parent or carers became more adept at managing circumstances
- by summer 2021, most students are likely to have experienced a net learning loss as a result of the pandemic
- the amount of learning loss that students will typically have experienced is hard to gauge, although it may not be as extreme as some of the earliest projections
- by summer 2021, a minority of students may have achieved a certain amount of learning gain, although how large a group this might be is unclear
- socioeconomically disadvantaged students are likely, on average, to have lost relatively more learning than their more advantaged peers – however, there will be many exceptions to this general conclusion, as many advantaged students will also have been extremely seriously affected, and many disadvantaged students will not have been
- students from certain areas are likely, on average, to have lost relatively more learning than students from other areas, although this is best understood locally rather than regionally, and not all students from even the worst affected areas will have been disproportionately affected
- learning loss is a phenomenon that needs to be understood from the perspective of each and every student, individually – impacts from the pandemic are too complex and nuanced to be described simply (or even primarily) in terms of group effects
- even students from very similar backgrounds, registered in the same class at the same school, might have experienced quite different levels of learning loss, depending on the particular circumstances of their learning during the pandemic
Beyond these general conclusions, little can be said with confidence, especially concerning the details of how students in particular circumstances might have been affected.
These conclusions provide a backdrop against which patterns of results from summer 2021 can be interpreted. This context is very important, because it enables us to develop hypotheses concerning underlying attainment patterns, which in turn will help us to make sense of the patterns that we will see in results this year. We always need to make assumptions concerning underlying attainment patterns when judging the validity and fairness of national result patterns. For instance, we typically assume that national subject cohorts are unlikely to change radically from one year to the next, in terms of their (average) overall attainment levels, and if national subject grade distributions were to change radically then serious questions would be raised. This year, in the wake of the pandemic, we could not assume consistency of this sort, and we turned to the literature on learning during the pandemic to help gauge the lay of the land. Our reviews have shed light on patterns of attainment that are likely to have occurred by the end of the 2020 to 2021 academic year, which provides a backdrop against which patterns of results from summer 2021 can be interpreted.
Attainment is shorthand for the learning that has occurred in a particular subject area, that is, the knowledge and skills that have been acquired. Roughly speaking, students with the same overall level of attainment in a subject area will have mastered the same body of knowledge and skills to the same extent. The function of a grade, during normal times, is to represent the overall level of attainment achieved by a student in a subject area: higher grades indicating higher overall levels of attainment. So, when we talk about results rising or falling over time at the national level, for instance, we are actually talking about (average) overall attainment levels rising or falling over time. In other words, during normal times, result trends directly mirror attainment trends – that is their job. However, this year, we have permitted a content coverage concession, which means that students were only assessed on course content that they had been taught. As such, we would not expect result trends to mirror attainment trends directly.
This is an important point of principle for assessment in summer 2021, which is worth reiterating before unpacking its implications, because of how significantly it differs from grading policy during normal times. During normal times, if teachers were to teach substantially less, and students were to learn substantially less, then we would expect results to fall substantially too. This is because – during normal times – results represent student learning directly, and result patterns mirror attainment patterns. This year, because the pandemic led to some students being taught less than others, students were only assessed on content that they had been taught. Because this breaks the direct link between attainment (that is, learning) and results, result patterns will not map straightforwardly onto attainment patterns this year. Therefore, to understand likely result patterns for summer 2021, we needed to interpret the best available evidence of attainment patterns – which is set out in our review of learning during the pandemic – in the context of the exceptional grading policy this year.
In terms of attainment trends by the end of the 2020 to 2021 academic year, we developed the following hypotheses. First, if most students in years 11 to 13 are likely to have been affected by a certain amount of learning loss, then (average) overall attainment levels are likely to be down, nationally, by the end of the 2020 to 2021 academic year, across subjects and across qualification types.
Second, if socioeconomically disadvantaged students are likely, on average, to have been worse affected by learning loss, then (average) overall attainment levels are likely to be correspondingly lower for disadvantaged students. Again, many disadvantaged students will not have been among the worst affected, so this only refers to the hypothesis that attainment will be disproportionately lower on average.
Third, if the previous hypotheses are correct, then we might also hypothesise that group membership categories that correlate with socioeconomic disadvantage – which might include ethnicity or qualification type – may also be associated with disproportionate drops in (average) overall attainment levels. However, we have no strong basis for estimating the likely size of any such effect.
Fourth, if (average) overall attainment levels are disproportionately lower for students from socioeconomically disadvantaged backgrounds, then it stands to reason that longstanding attainment differentials – known as disadvantage gaps – will also have widened, however the extent to which gaps might widen is unclear.
In terms of result trends in summer 2021, we developed the following hypotheses. First, although attainment levels may fall, nationally, the content coverage concession should help to compensate for this, meaning that we should not expect to see an equivalent drop in results at the national level.
Second, although Ofqual’s guidance permits a small amount of compensation for individual students who have lost more study time than their classmates, this does not extend to compensating students for having learned less effectively as a result of unfavourable home learning circumstances. If so, then we might hypothesise that students who studied under extremely unfavourable circumstances would be more likely than their classmates who studied under extremely favourable circumstances to achieve grades that were lower than they might have achieved if the pandemic had not struck.
Third, extending this line of reasoning, if socioeconomically disadvantaged students are more likely, on average, to have experienced relatively more learning loss, even just among their classmates, then these effects will also be seen in aggregated results. The implication is that disadvantage gaps in results are likely to widen in summer 2021. However, the content coverage concession was introduced specifically to help mitigate differential impacts on learning. Consequently, any widening of disadvantage gaps in results should be less pronounced than any widening of disadvantage gaps in underlying attainment.
Introduction
When the potential scale and severity of the developing pandemic became apparent, in March 2020, the government decided that the impending exams season would have to be cancelled. This raised the thorny question of whether it might still be possible to award grades for high stakes assessments – such as GCSEs, A levels, BTECs, and so on – in summer 2020; and, if so, then exactly what those grades should represent. It was decided that a grade should represent the level of learning achieved by a student in the period running up to March 2020, projected forward as a prediction of the grade that they were on target to achieve in the summer.
With processes established for summer 2020, attention began to turn to the even thornier question of how to award grades for the same high stakes assessments in summer 2021. It was clear, even then, that the situation would be very different for this cohort of students. Although, at the time, we hoped that it would be possible to run an exam season, it was not at all clear that it would be appropriate to run exams in exactly the same way as normal. After all, this cohort of students had already experienced serious disruption to their learning by summer 2020, and this looked likely to continue for the foreseeable future. Bearing in mind the likely impact of the pandemic on teaching and learning in the run up to summer 2021, the fairness of assessing students in exactly the same way as normal seemed to be in doubt.
The policy position that was agreed during autumn of 2020 assumed that exams would be run in summer 2021. Specifications for teaching would remain largely unchanged, but various steps would be taken to ensure that exams could run fairly.,[footnote 1][footnote 2] These steps included: delaying the start of the exam season, to allow for additional teaching and learning; freeing up teaching time via approaches intended to ease the assessment burden (for example, increased choice in GCSE English Literature and GCSE History); and modifying assessments to allow for more focused teaching and revision, as well as to make them a less daunting experience (for example, advance notice of topics, focuses and content areas that would be covered).
On 4 January 2021, the Prime Minister announced that it was no longer possible or fair for all exams to go ahead in the summer. A new approach to grading students was required, which would be based on teacher assessment. It was decided that a grade should represent the learning achieved by a student in the period running up to summer 2021.[footnote 3] However, recognising that teaching and learning had been seriously affected by the pandemic – and that some schools and colleges[footnote 4] seemed unlikely to cover the entire curriculum by the summer – it was decided that students should only be assessed on content that they had been taught.
Learning during the pandemic
To support effective policy making in the run up to summer 2021, Ofqual closely monitored the emerging body of research and analysis into learning during the pandemic. We attempted to keep track of all relevant reports published in England, from March 2020 onwards, as well as key reports from overseas. Our goal was to ensure that we understood as fully as possible the context for high stakes assessments in summer 2021 (and subsequent years).
We have now drawn this work together as a series of literature reviews. Alongside the present report – which provides an overview of the project and its conclusions – we are publishing four additional reports in our ‘Learning During the Pandemic’ series:
- Quantifying lost time (report 2).
- Quantifying lost learning (report 3).
- Review of research from England (report 4).
- Review of international research (report 5).
Our overarching objective was to understand the impact of the pandemic on levels of learning that were likely to be achieved by summer 2021, with a particular focus upon students in England from years 11 to 13.
The information that we gathered was not used to establish expectations for grade distributions in summer 2021. From the outset, we recognised that it would be impossible to derive plausible quantitative estimates of learning (or learning loss) based upon fragments of information produced in the year following the outbreak of the pandemic. Limitations of this evidence base are considered in more detail below. More importantly, the decision that students should only be assessed on content that that had been taught significantly changed the rules of the assessment game for summer 2021, making implications for results far more challenging to unpick. These implications are also considered in more detail below.
Because results from summer 2021 cannot be interpreted in exactly the same way as they would be during normal times – for a variety of reasons, including the fact that students are only being assessed on content that they have been taught – information from our reviews has an important role to play in helping to contextualise the interpretation of results from summer 2021. Our reviews help to shed light on patterns of attainment that are likely to have occurred by summer 2021, which provides a backdrop against which patterns of results from summer 2021 can be interpreted.
Over the past year or so, the anticipated impact of the pandemic on learning has often been discussed in terms of ‘lost time’ and media coverage along the following lines has become commonplace: ‘GCSE and A-level students have lost more than half of their teaching time over the course.’ Unfortunately, the idea of ‘lost time’ is a slippery one, because it can be interpreted in a variety of different ways. Report 2, ‘Learning during the pandemic: quantifying lost time’, helps to make sense of this idea. It begins by explaining the chronology of the pandemic in terms of its impacts on schooling. It then unpacks possible meanings of ‘lost time’ before estimating how much students in different circumstances might actually have lost. Our intention for this report, as for all of our reports, was to tell a more nuanced story than has sometimes been told.
Report 3, ‘Learning during the pandemic: quantifying lost learning’, attempts to quantify ‘lost learning’ directly, by reviewing research and analysis based upon large-scale attainment datasets collected during the pandemic. In theory, this represents an ideal source of evidence for the purpose of the present project. Unfortunately, in practice, these data are limited in a variety of ways, and can only tell a partial story.
Report 4, ‘Learning during the pandemic: review of research from England’, reviews the broader landscape of research and analysis into learning during the pandemic, providing a comprehensive overview of reports published in England since March 2020. We restricted our review to reports that focused upon impacts on learning, and factors that were likely to influence levels of learning. We did not focus upon longer term consequences of the pandemic, nor upon how those consequences might be addressed. Similarly, although we did consider a number of more distant factors that seemed likely to influence levels of learning – including mental health, for instance – we tended to touch upon them only occasionally, rather than reviewing them comprehensively.
Finally, report 5, ‘Learning during the pandemic: review of international research’, provides a more selective overview of insights from research and analysis conducted internationally since March 2020. We focused upon reports that appeared to be particularly important and influential, as it would not have been feasible to attempt a comprehensive review. We assumed that this international review might usefully complement our national one – either by supporting apparent trends, or by challenging them, or simply by providing different kinds of insights from types of research or analysis that had not been conducted in England.
The impact of the pandemic on learning
The normal function of a qualification is to certify that a specified level of learning has been achieved, and Ofqual has a statutory objective to ensure that the organisations that we regulate uphold this function effectively. This is why we focused our research specifically upon understanding the impact of the pandemic on likely levels of learning. We assumed (in line with the general zeitgeist) that the pandemic would typically result in lower levels of learning, whilst acknowledging that there might be some students for whom the reverse was true.
The concept of learning loss
The body of research and analysis that has emerged over the past year or so has come to be known as the ‘learning loss’ literature. Although there is no universally agreed definition of learning loss, we defined it like this:
Learning loss refers to a reduction in the overall level of attainment that a student achieves by the end of their course of study, for example, lower attainment in GCSE maths, which is attributable to both direct and indirect impacts from COVID-19.
Although the pandemic has affected attainment in a variety of different ways – including breadth of learning, depth of learning, gaps in learning, consolidation of learning, and so on – our operational interest in the certification of overall attainment levels led us to this generic, cumulative, holistic conception of learning loss, referenced to a specific point in time (the end of a course of study).
It is important to recognise that learning loss is a counterfactual concept, in the sense that it can only be defined relative to the level of attainment that a learner would have achieved if the pandemic had never occurred. The degree of learning loss experienced by any particular learner is therefore unknowable. Having said that, evidence from patterns of attainment across learners in different circumstances can certainly help to establish its nature and prevalence in a more general sense.
The concept of learning loss attributable to the pandemic is not well theorised. Where researchers have attempted to model it, this has typically involved extrapolating from the summer (holiday) learning loss literature, as the following example illustrates. Figure 1 is an adaptation of Figure 2 from Azevedo et al (2020), which used a framework derived from summer learning loss literature to model learning loss in the context of the COVID-19 pandemic. It represents:
- the normal trajectory of learning across the duration of a course (blue line)
- the anticipated impact on attainment when learning stops, at time 1 (black line)
- the anticipated additional impact on attainment during the period that learning remains stopped, from time 1 to time 2 (purple line)
The difference between the projection of the blue line at time 2 (top arrow) and the projection of the purple line at time 2 (bottom arrow) represents the anticipated amount of learning loss. This is judged in relation to the level of learning that could have been achieved by time 2, had the learning not stopped (at time 1).
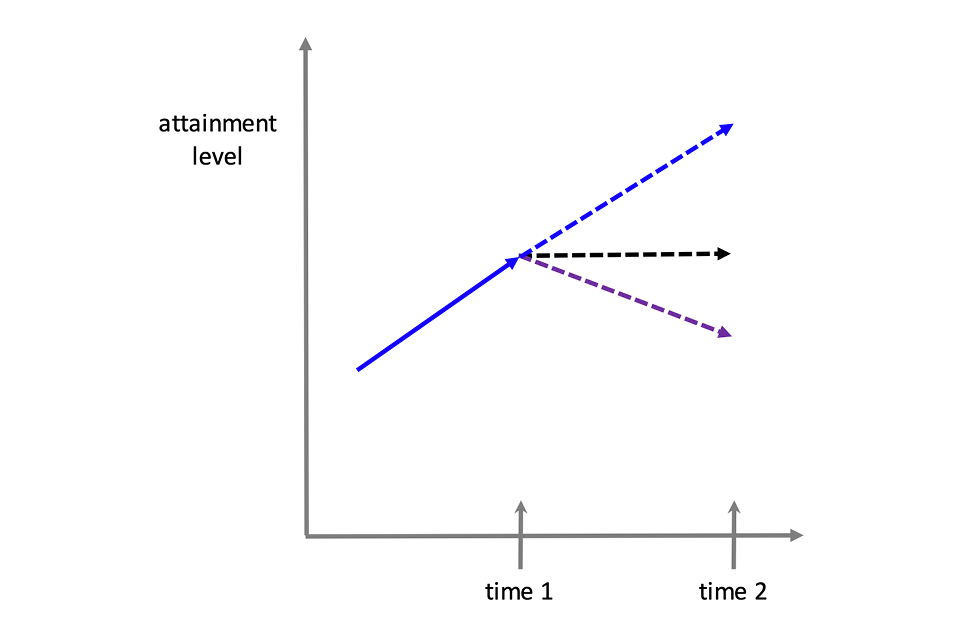
Lines indicate level of attainment if learning does not stop, compared with level of attainment if learning simply stops with no new learning, compared with level of attainment if learning stops and learning lost.
In this model, the extrapolation of thinking from the summer learning loss context to the pandemic context is clear:
- time 1 – the onset of the pandemic – is analogous to the end of the summer term (beginning of the vacation)
- time 2 – the end of the period of disruption – is analogous to the beginning of the autumn term (the new school year)
In the summer learning loss context, the model assumes that students are not spending any time studying during the vacation. The implication is that we would not expect their attainment to increase (black line), but we might expect their attainment to decrease due to forgetting (purple line).
Needless to say, this is a very simple model, and it may not even represent the situation for summer learning loss very well. For instance, Wiliam (2020) noted a distinction that cognitive psychologists have drawn between retrieval strength and storage strength (Bjork & Bjork, 1992). He suggested that summer learning loss research may misrepresent students’ actual levels of learning, at the beginning of the autumn term, by tapping into retrieval strength (which will have declined over the summer) but not into storage strength (which will not have declined). In other words, the learning in question is not lost (no longer stored in memory), it is just harder to retrieve, and only temporarily so. This may help to explain conflicting evidence from the summer learning loss literature, which raises the question of whether summer learning loss is even really a thing (von Hippel, 2019).
Following Bjork & Bjork (1992), we will assume that prior learning is not simply lost during a period of disuse, although it will become harder to retrieve. However, what might genuinely be lost during a pandemic is the opportunity to acquire new learning. This invites us to think of learning loss as the difference between the learning that actually happened in the wake of the pandemic and the learning that could have happened if the pandemic had never struck.
In theory, learning loss (of this sort) could arise via two quite different routes:
- not studying at all for an extended period of time
- studying continuously yet learning less effectively
This distinction is important because it marks a key difference between the summer learning loss context and the pandemic learning loss context. During the summer holidays, we might expect students simply to ‘down tools’ and not to study at all. During the pandemic, however, it was generally assumed that students ought to continue studying, to the best of their ability. In fact, as we shall soon see, many students ended up spending somewhat less time studying than if the pandemic had never struck, and were also likely to have learnt somewhat less effectively when they did attempt to study.
Time spent ‘not studying at all’ is fairly straightforward to conceptualise. It is simply the difference between the total amount of time that a student would normally have committed to learning (if the pandemic had not struck) and the total amount of time that they actually committed to learning (in the wake of the pandemic). It would therefore be possible to quantify ‘lost study time’ as a proportion of the total amount of time that a student would normally have committed to learning throughout a particular course of study, for example, X weeks as opposed to Y weeks over a 2-year course (so the time lost is Y minus X weeks). For example, a Swiss research group asked a panel of students how much time they spent in normal learning activities each week (school time, online lessons, homework, and so on) both before the pandemic and during a period of closure due to the pandemic (Gratz & Lipps, 2021). They found that students reduced their studying time, on average, from 35 to 23 hours per week. Clearly, if students were spending one third less time studying, then we might expect this to translate into substantial learning loss.
Learning effectiveness is harder to conceptualise, let alone to measure. Presumably, a key determinant would be the amount and quality of teaching that students received. Where this suffered as a consequence of the pandemic, it would contribute to learning loss. The extent to which a teacher was able to tailor their teaching to abnormalities in learning trajectories that resulted from the disruption would therefore also be likely to contribute to learning loss. The less effectively a teacher adapted their instruction (for example, for a class of students with idiosyncratic gaps in their learning) the more likely those learning losses would be compounded. This underscores the importance of formative assessment in identifying learning gaps and instructional needs, as a foundation for effective teaching and learning during the pandemic.
Another key determinant would be the circumstances that students found themselves in whilst attempting to study. During normal times, a large amount of studying occurs in school, where all students have access to the same resources. During the pandemic, however, a large amount of learning happened remotely, at home. It was clear that students did not have access to identical resources for remote learning when the pandemic struck. Many therefore assumed that students in the most socioeconomically disadvantaged of circumstances were likely to lose the most learning.
The distinction between spending less time studying and learning less effectively helps us to tell a more nuanced story of learning during the pandemic. However, it may also be important for interpreting attempts to measure learning loss. For instance, periods spent not studying at all might have different implications for the retrieval of prior learning than periods spent learning less effectively. We explore this possibility below, when considering how to interpret results from quantitative research into learning loss based upon large-scale attainment datasets.
Although this report is mainly concerned with learning loss, we should not overlook the possibility of learning gain. For some students, the net impact of the pandemic on their level of learning by summer 2021 might be positive. Presumably, this would be most likely for students who were able to commit more time to studying or who were able to learn more effectively. Admittedly, it seems unlikely that many students will have learned more in the wake of the pandemic than if it had never struck. Yet, the pandemic may have caused some students to knuckle down, and to engage with their learning far more assiduously than would otherwise have been the case, especially if closely supervised and supported by newly furloughed parents.[footnote 6]
Likely causes of learning loss
It is helpful to unpack the two principal causal determinants of learning loss – less time spent studying, and learning less effectively – by considering what might cause each of them to occur, and by considering how each of these subsidiary causes might be mediated by student-level, family-level, and school-level factors. Table 1 illustrates a variety of subsidiary causes and mediating factors, which cluster as follows:
- 1. amount of time spent studying
- a. less compulsion to work
- b. less opportunity to work
- c. less inclination to work
- 2. effectiveness of learning
- a. less ability to concentrate on learning tasks
- b. less ability to engage with learning tasks
The suggestion, here, is that students might spend less time studying during the pandemic for a variety of reasons, which include: feeling less compelled, or obliged, to work; being unable to work; or simply feeling less inclined to work. Each of these subsidiary causes might be mediated by student-level factors, family-level factors, or school-level factors. School-level factors might differ depending upon whether the school is effectively closed (and has switched to ‘remote’ learning), or whether it has returned to whole-class in-school tuition (that is, to a ‘new normal’).
For instance, the act of closing a school, or sending a class home, frustrates a key mechanism by which students are compelled to learn. If a parent or carer is unable to facilitate studying effectively, then the general lack of compulsion might translate into a lack of commitment on behalf of their child. Having said that, even when a parent or carer does attempt to facilitate engagement somehow, their child might still decide that they are simply not inclined to work, perhaps believing that the pandemic has somehow licensed them to skip schooling.
Some students, of course, will be very keen to commit the necessary time to their studying, even when learning remotely. However, they may find themselves unable to do so, because they lack something that is critical to their engagement. For example, their teacher might have failed to have told them what they needed to be studying, or failed to have provided them with necessary resources for studying. And this may have prevented them from making any meaningful progress, at least in the short term. Or, they may simply have been unable to access resources that had been provided, for example, if they lacked an internet connection, or associated technology.
Table 1. Factors that might be associated with lower attainment (learning loss)
| Mechanism | Individual factors | Family factors (remote) | School factors (remote) | School factors (new normal) |
|---|---|---|---|---|
| Amount of time spent studying: Less compulsion to work | [Cell left blank] | Weak enforcement by parents or carers. | Termination of in-school education (national school closure). | Termination of in-school education (school or class closures, or self-isolation). |
| Amount of time spent studying: Less opportunity to work | Consequence of being ill with COVID-19. | Problems accessing critical study tools (laptop, internet, books, etc.). Having to take on caring responsibilities due to COVID-19. | School or teacher failure to provide critical home- learning materials. Reduced access to critical support services (teaching assistants, SEND support, etc.). | New burden of COVID-19-related activities (eg, sanitising, one-way systems, staggered starts). School emphasising wellbeing activities, and sacrificing curriculum coverage. |
| Amount of time spent studying: Less inclination to work | Consequence of COVID-19-related impacts (abuse, depression, bereavement, etc.). Use of COVID-19 as an excuse to slack off. | Parents or carers not appearing to care about learning loss. | School having limited engagement with students during lockdown. | [Cell left blank] |
| Effectiveness of learning: Less ability to concentrate on learning tasks | Consequence of COVID-19-related impacts (eg, depression, anxiety, abuse, eating disorders). Response to illness or death of close family member due to COVID-19. Response to fear of falling behind peers. | Home-learning distractions – family (eg, younger siblings, furloughed parents, working parents). Home-learning distractions – conditions (eg, cold, hunger, noise). Non-conducive home-learning workspace (eg, access to desk). | School grappling with online learning for the first time and not having adequate systems in place. | Heightened anxiety due to new regime of COVID-19-related practices (eg, distancing, masks). |
| Effectiveness of learning: Less ability to engage with learning tasks | Insufficient rehearsal of foundational knowledge and skills. | Home-learning disadvantages – technology (eg, slower internet speeds, no printer). | Instructional breakdown (failure to spot learning gaps, mis-sequenced teaching). Poorer quality of interaction with teachers or assistants (online). Poorer feedback on work (online). Poorer quality lessons or materials (online). Lack of direct access to own teacher due to COVID-19 absence (eg, ill, or isolating). Having to re-structure course content coverage to accommodate remote learning. | Instructional breakdown (failure to spot learning gaps, mis-sequenced teaching). Poorer quality interaction with teachers or assistants (eg, distancing, forward-facing rows, less group work or practicals). Poorer feedback on work (eg, less marking, less one-to-one interaction). Poorer quality lessons or materials (eg, competing demands on teacher time). Lack of direct access to own teacher due to COVID-19 absence (eg, ill, or isolating). |
Table 2. Factors that might be associated with higher attainment (learning gain)
| Mechanism | Individual factors | Family factors (remote) | School factors (remote) | School factors (new normal) |
|---|---|---|---|---|
| Amount of time spent studying: More compulsion to work | More opportunity to be independent and self-motivated. | Strong enforcement by parents or carers. | Strong oversight by teachers. | [Cell left blank] |
| Amount of time spent studying: More opportunity to work | Fewer social activities during evenings or weekends. Less time spent with friends. | Procurement of additional home-tutoring. | [Cell left blank] | Additional evening or weekend schooling. Fewer extra-curriculum activities. Fewer non-essential curriculum activities. |
| Amount of time spent studying: More inclination to work | Desire to make the most of a bad situation. Response to fear of falling behind peers. | Strong encouragement to keep on top of learning from parents or carers. | Strong encouragement to keep on top of learning from teachers or assistants. | Strong encouragement to keep on top of learning from teachers or assistants. |
| Effectiveness of learning: More ability to concentrate on learning tasks | Response to fear of falling behind peers. | Provision of new home-learning tools and resources. | Lack of distractions from classmates. | [Cell left blank] |
| Effectiveness of learning: More ability to engage with learning tasks | [Cell left blank] | High level of supervision and support from parents or carers (eg, furloughed parents). | School establishing highly effective systems for online learning (or honing effective systems already in place). | [Cell left blank] |
Table 1 is not intended to provide a definitive deconstruction of the potential mechanisms of learning loss, and some of these factors may well interact. It is simply intended to illustrate the variety of subsidiary causes of learning loss, even if we assume that they all (ultimately) operate either via less learning or via less effective learning. It is also useful for illustrating how different schools, different families, and different students will mediate impacts from the pandemic in a variety of different ways. Table 2 develops essentially the same idea, to illustrate a variety of subsidiary causes and mediating factors associated with higher attainment as a result of the pandemic, that is, learning gain.
Likely correlates of learning loss
The variety of subsidiary causes and mediating factors illustrated in Tables 1 and 2 helps to explain why learners in different circumstances may have been affected quite differently by the pandemic. However, where certain groups of learners are affected in similar ways (and differently from other groups) this will lead to correlated effects: where certain kinds of impact, or a certain level of severity of impact, affects one group of students more than another. For example, if boys disengaged more from their learning than girls, even if just on average, then this might lead to disproportionately more learning loss overall for boys. Observations of differential impact have been a widespread feature of research and analysis into learning loss. Unfortunately, when we move beyond proximal causes to distal correlates, the story of learning loss becomes much more complicated, and often far more ambiguous.
As the autumn 2020 term progressed it became increasingly clear that some regions of England were being affected by the pandemic more seriously than others, leading to greater disruption for schools in those regions. The severity of this disruption, particularly in the north-west, led to a call for students in this region to be given special treatment when their exams were graded in summer 2021:
[He] said that some institutions had been turned into ‘zombie schools’ that were ‘minding teenagers rather than educating them.’ He said that exams must go ahead next summer but that Ofqual should vary its grading by geographical area.
(Hamid Patel, chief executive of Star Academies, quoted in The Times, 2020)
Had the government not decided to cancel exams in summer 2021, this proposal could, in theory, have been implemented. Students would have been examined in the normal way, but then split into separate groups for the purpose of grading. Lower grade boundaries could have been set for students in schools from the north-west of England, with higher grade boundaries set for students from all other regions.
Although superficially attractive, this proposal would not have been acceptable, in practice, because it would have glossed over huge amounts of variation in impact, both across regions and within them. In other words, just because one region is affected far more seriously than another on average, this does not mean that the same will be true for each and every school within that region, let alone each and every student.[footnote 7]
An FFT Education Datalab blog from October 2020 presented outcomes from analyses of attendance data, which focused upon regional effects such as these (Burgess et al, 2020). It concluded that students in the poorest areas of the country were missing out on the most schooling: including the north-west, the north-east, and Yorkshire and the Humber. It was clear that attendance was substantially lower in regions with substantially higher infection rates, at least, on average.
Critically, though, there were many exceptions. For instance, in line with the general conclusion, the East Midlands had a far lower test positivity rate than the north-east, and a higher attendance rate. Yet, attendance rates varied hugely across local authorities within both regions. Indeed, the worst affected authority in the north-east of England was not as badly affected as the worst affected authority in the East Midlands, and the least badly affected authority in the north-east of England was less badly affected than the least badly affected authority in the East Midlands. In other words, the trend that seemed clear on the average, was reversed for authorities at the extremes.
The problem that this example lays bare is fairly obvious, but important. Although disruption to schooling was genuinely correlated with region, this was merely a correlation, and there were many exceptions to be found. Indeed, just 2 months later, the correlation was quite different, with schools in the south-east of England now being particularly badly affected (Nye et al, 2020). Furthermore, this shift affected other conclusions from the FFT Education Datalab October analysis. The fairly strong negative correlation between attendance in secondary schools and disadvantage at the local authority level was very much weaker in the December analysis.
As we shall soon see, one of the most important conclusions from the research and analysis into learning loss in England is that some students appear to have been far more seriously affected than others. And, in a similar fashion, some groups of students appear to have been far more seriously affected than others. However, the reasons why this seems to be true are many and varied, which makes it hard to tell a straightforward story. Even when impact is strongly correlated with one or another group membership category – be that region, socioeconomic status, ethnicity, school type, and so on – there will still be many exceptions to ‘prove’ the rule, and multiple interactions to complicate any conclusion.
Researching impacts on learning
The body of work that we have reviewed comprises a new literature, produced by researchers who (in the main) have not previously worked in the area of learning loss. Their research and analysis has been produced rapidly, particularly in order to support policy making. Before considering what this new evidence seems to be telling us, it is important to consider the circumstances under which it has been produced, in order to properly contextualise our interpretation of emerging findings.
Some of the earliest reports that were published in England considered lessons that might be learned from previously published research into the impacts of school closures on learning – including holiday closures, volcano closures, snow closures, hurricane closures, as well as a small body of research on pandemic closures (see report 5). Subsequently, a variety of research teams began to produce empirical evidence on learning during the current pandemic, based largely upon surveys which targeted teachers, students, and their parents or carers (see report 4). Only more recently has it been possible to generate empirical evidence on attainment during the pandemic, based mainly upon results collated by commercial test publishers (see report 3).
Just as in many other fields, a tremendous amount has been learnt over the past year or so, from a fairly shallow baseline of knowledge and understanding. Yet, in many ways, we are still just scratching the surface as far as learning during the pandemic is concerned. We have assembled fragments of information, which do seem to be telling a plausible story. But there are many gaps in our knowledge and understanding, and it is hard to be absolutely certain about many of the claims that have been made.
Chronological challenges
Perhaps the biggest challenge in telling a coherent story about learning during the pandemic is that it is already clear that it is best presented as a collection of short stories. In other words, the pandemic can be broken down into distinct phases, and experiences of both teaching and learning will have differed radically across these phases (see report 2).
Because we are particularly interested in understanding how students from current year 11 to year 13 cohorts have learnt in the lead up to their assessments in summer 2021 – that is, across the full duration of a standard two-year course – we introduced the idea of a pre-pandemic phase. This spanned the period from early September 2019 until COVID-19 brought teaching and learning to a crisis point in late March 2020.
Whole-class in-school tuition was brought to an abrupt end from 23 March 2020 onwards. Schools in England were forced to implement what report 2 called a ‘remote instructional delivery mode’ with the vast majority of students having to study from home. This period tested the capacity, resilience and resourcefulness of schools, families and students. Much of the early survey research began to differentiate between relative ‘winners’ and ‘losers’ in this respect, with disadvantaged students appearing to be disproportionately negatively affected.
This first phase of the pandemic ran until the end of the summer term. A small number of students were allowed to attend school during this period, including vulnerable children, and children of critical workers. However, most students who fell into these categories ended up studying remotely. Schools began to reopen to certain groups of students during June 2020. Yet, even then, this was not on a fulltime basis, so this was very much an extended period of remote learning for almost all students.
The second phase spanned the autumn term, from September to December 2020. This was meant to represent a return to a ‘new normal instructional delivery mode’ as far as schooling was concerned, with a return to whole-class in-school tuition. This initially felt closer to the truth in rural areas, in regions such as the south-west of England, where the pandemic remained most in abeyance. However, for certain schools in certain parts of the north of England, and later on in the south-east of England, the autumn term felt like a period of extended disruption. The research and analysis narrative shifted somewhat, with students from certain regions appearing to be disproportionately negatively affected. This focused attention on challenging interaction effects, whereby problems seemed to be greatest in regions where both infection rates and levels of disadvantage were highest – although some of these interaction effects became less evident towards the end of the year. This felt like a turbulent phase, where schools in different parts of the country found themselves in quite different circumstances. This was generally not true during the other phases, when national policies rolled out more consistently across regions. During this phase, even students within the same class sometimes found themselves in quite different circumstances, when year groups, bubbles, or individuals were forced to self-isolate at short notice.
The third phase included the majority of the spring term, from the beginning of January until early March 2021. Again, this was meant to represent a return to a ‘new normal’ for all schools, meaning a return to whole-class in-school tuition for all students. However, another national lockdown scuppered these plans, and schools were forced to teach the majority of their students remotely. We do not yet have a great deal of evidence concerning how schools and students have fared during this period. However, it does seem as though, on the whole, students fared considerably better during the second school lockdown than during the first.
At the time of writing this report, we have just entered the fourth phase, which has represented a more authentic return to a ‘new normal’ for the vast majority of students in England (except for occasional groups of students being sent home to isolate from time to time). Early signs suggest that things may remain fairly stable, for the vast majority of schools, until the end of the summer 2021 term.
Interpretational challenges
Beyond the chronological challenge of the pandemic, which has developed through quite different phases, we also need to consider interpretational challenges associated with the circumstances under which this new body of work has been produced.
One potential problem is that almost none of the research or analysis that we identified over the past year or so has been published in an academic journal, perhaps inevitably so, given the timespan in question. Instead, reports have tended to be published by the organisations responsible for producing them (or that sponsored their production) meaning that these reports may not always have gone through a rigorous external review process. The academic review process is far from perfect, but it is useful for helping authors to identify potential flaws in their research design, or potential limitations to the conclusions that have been drawn. It provides a degree of reassurance for the reader that tricky methodological questions have already been asked and answered satisfactorily. This makes it safer to take findings at face value. While many of the organisations that have published reports over the past year or so are likely to have implemented rigorous internal review processes, this may not always have been true, and questionable conclusions may occasionally have slipped through the net. In some cases, the ‘need for speed’ has resulted in minimally detailed reporting, so we found it useful to contact research teams directly to explore outstanding questions.
Much of the published research has been survey based, and there is always a risk with this approach that those who respond may not be representative of the population for whom conclusions are to be drawn. During the pandemic, a particular risk is that those who were the worst affected at the time of the research may have been least able to contribute, so the results might underestimate the severity of the situation. On the other hand, surveys are also susceptible to a bias that might work in the opposite direction, for example, if the general sense of fear, if not panic, induced by the pandemic led respondents to overestimate the severity of the situation. This is an important risk to bear in mind in relation to some of the more ‘ambitious’ questions that were posed in some of the surveys, for instance, where teachers were asked to judge how many months behind in their learning they believed students to be.
Questions of this sort were better answered by using attainment data, for example, where schools had administered progress monitoring tests during the autumn term (2020). Even for these studies, though, the data were largely opportunistic, and few research teams were able to exercise optimal levels of control over the samples that were being compared. These studies also faced the risk of under-representing results from the worst affected schools and students, who might have been amongst the least able to engage with the testing process.
A particular problem for this overview report was the relative lack of evidence related specifically to those students who are its main focus (current years 11 to 13). Almost all of the conclusions based upon attainment data, for example, concerned students in primary schools, which are the largest consumers of commercially published tests. What these studies reveal is that conclusions concerning younger primary students cannot necessarily be generalised to older primary students. Extrapolating results from primary school students to upper secondary school students would be equally precarious, if not far more so. Similar caveats would apply when attempting to extrapolate from schools and students overseas to schools and students in England.
A year or so into the pandemic, it seems fair to say that the research and analysis that has been produced so far is indicative of effects, yet often not definitive, and the following section should therefore be read with this caveat in mind.
Insights from the literature
Since schools across the nation terminated whole-class in-school tuition, back in March 2020, a body of research and analysis devoted to learning during the pandemic has emerged. To support effective policy making, we have closely monitored this work, providing an evidence base for the many decisions that needed to be taken.
We have now brought this review of research together in advance of the publication of results in summer 2021, to provide critical contextual information for understanding the patterns of results that will emerge. Our set of five reports – including the present one which provides an overview – is not intended to represent the last word on learning loss attributable to the pandemic. It is simply an account of what appears to be known at this particular point in time. We have drawn upon a wide range of research, including research from England and from overseas, and from across both primary and secondary schooling.
The following subsections integrate insights from the literature that we discuss in more detail in the other 4 reports (Reports 2 to 5). Rather than straightforwardly summarising these reports, they are drawn upon selectively to construct an account of the context for assessments in summer 2021. The analysis that follows makes considerable use of the distinction that was drawn in report 2 (and introduced earlier) between the various phases of the pandemic:
- Phase 0 – September 2019 to late March 2020 (pre-pandemic)
- Phase 1 – late March 2020 to end summer term 2020 (mainly remote #1)
- Phase 2 – autumn term 2020 (mainly new normal #1)
- Phase 3 – January 2021 to early March 2021 (mainly remote #2)
- Phase 4 – early March 2021 to mid May 2021 (mainly new normal #2) ### Gauging the challenge
As soon as it became clear how seriously the pandemic would affect teaching and learning, work began to gauge the challenge that England would have to face. With no prior experience of this kind of disruption to draw upon, attention turned to what we might learn from parallel contexts (see report 5). This included disruptions and closures in the wake of hurricanes, volcanoes, strikes, and so on, including lessons from the summer learning loss literature (for example, Edge Foundation, 2020; Education Endowment Foundation, 2020; Eyles et al, 2020; Müller & Goldenberg, 2020).
This was closely followed by studies that attempted to estimate the potential scale of learning losses attributable to the pandemic, conducted both in England and overseas (for example, RS DELVE Initiative, 2020; Kuhfeld et al, 2020). Similar modelling exercises continued well into the autumn term, typically offering sobering warnings, such as:
The findings on learning losses support four general inferences. First, the findings are chilling – if .31 std roughly equals a full year of learning, then recovery of the 2019-2020 losses could take years.
(CREDO, 2020, p.6)[footnote 8]
There are limits to what can be achieved via modelling, especially when questions are raised about the research that underpins the assumptions that are used to build the models. Because there has been a lot of debate over the summer learning loss phenomenon (for example, Kuhfeld et al, 2020; von Hippel, 2019) – and because this research base has featured prominently in much of the pandemic impact modelling – this recommends a certain amount of caution when interpreting outcomes. Indeed, subsequent sections will cast further doubt upon the relevance of summer learning loss to understanding learning during the pandemic.
Painting a picture
Researchers soon turned to investigating teaching and learning impacts directly. During the first phase of the pandemic – following the termination of whole-class in-school tuition and the switch to remote learning for most students – evidence was gathered predominantly via questionnaire surveys (see report 4). These were typically conducted with teachers and parent or carers, generally online. This was very much research in the ‘rapid response’ mode, intended to characterise the state of education in England shortly after entering largely uncharted waters.
The earliest reports tended to paint a fairly negative picture, for example:
[This report] finds that the average amount of schoolwork being done at home, according to parents and family members, has been very low: Children locked down at home in the UK spent an average of only 2.5 hours each day doing schoolwork. This figure is about half that suggested by a previous survey, suggesting that learning losses are much greater than feared.
(Green, 2020, p.2)
The same report – based on a survey that was conducted after a month or so of remote learning – also emphasised a theme that was to characterise research conducted during this phase and subsequently: the wide variation in students’ experiences of learning remotely.
Remote learning #1: Phase 1 – late March 2020 to end summer term 2020
For the reasons identified in Table 1 it was fairly obvious that learning was likely to suffer during Phase 1 of the pandemic. Inevitably, the vast majority of schools were not prepared to deliver remote learning at the drop of a hat, the vast majority of parents or carers struggled to work out how to accommodate and support home learning, and students likewise struggled to make sense of their own role at the centre of this confusing scene. It soon became clear that it would be harder for those from disadvantaged backgrounds to respond optimally to this unanticipated educational challenge, and this became a key focus for research.
A survey by Andrew et al (2020) concluded that the amount of home learning was considerably lower than average hours spent on educational activities prior to lockdown. According to their study, primary and secondary students were spending an average of 4-and-a-half hours a day on home learning – including online classes, other school work, private tutoring and other educational activities – which represented a 30% reduction in pre-pandemic learning time for secondary school students, and a 25% reduction for primary.
More importantly, there was plenty of evidence that students and parent or carers from more disadvantaged backgrounds often found themselves in less favourable remote learning circumstances. Findings included:
All studies report a significant gap in the amount of home learning by socio-economic background. Graduate parents were more likely to provide home-schooling at least 4 days per week (80 per cent) compared with non-graduates (60 per cent). Children eligible for free school meals were less likely to receive 4 hours per day (11 per cent) than other children (19 per cent).
(Sibieta & Cottell, 2020, p.34)
Around half of primary schools, and nearly 60% of secondary schools, offered some active learning materials, such as online classes or online chats. But these resources were 37% (24%) more likely to be provided to the richest third of primary (secondary) school children than to the poorest third.
(Andrew et al, 2020, p.10)
On average, disadvantaged pupils gave their home learning environment a score which was over 6% poorer compared to their peers. Students eligible for Pupil Premium were less likely to have developed a routine for learning, less likely to be able get help from their family, and less likely to understand the schoolwork that they had been set.
The availability of internet-enabled devices is clearly a factor here. But access to a workspace and the opportunity for regular exercise are also significant. Students eligible for Pupil Premium were likely to live in a household with access to a device (and only 2% less likely than their wealthier peers). However, the availability of a device was far more limited. It seems likely that this is due to wealthier households having multiple devices.
(ImpactEd, 2021, p.16)
By far the largest differences that emerge are between private school pupils and their state school counterparts. In the raw data alone, nearly three quarters (74 percent) of private school pupils were benefitting from full school days – nearly twice the proportion of state school pupils (39 percent). Descriptive data confirms that many elite schools effectively insulated themselves from learning losses during lockdown.
(Elliot Major et al, 2020, p.6)
Parents in the highest quintile of incomes were over four times as likely to pay for private tutoring during lockdown than those in the lowest quartile of incomes (15.7 percent compared with 3.8 percent). On average, 9.2 percent of parents report[ed] paying for private tutoring during lockdown.
(Elliot Major et al, 2020, p.7)
Even under the traditional instructional delivery mode – which normally involves compulsory whole-class in-school tuition – opportunities to learn are not evenly distributed. Students in some schools have better teachers than others or better resources for studying. And, even when considering students within the same school, some parents or carers are more proactive in providing support and encouragement than others. Yet, compulsory education does play an important role in helping to distribute opportunities more equally, and when this scaffolding is removed, the likelihood of opportunities being less equally distributed increases. Evidence from questionnaire surveys, such as those cited above, suggests that opportunities to learn were, indeed, less evenly distributed under the remote learning model of spring and summer 2020.
Having said that, we should bear in mind three important, interrelated observations. First, although differences were often observed when results were broken down by traditional indices and correlates of disadvantage – family income, Pupil Premium status, school type, and so on – these differences were not always major. Furthermore, overall differences in averages concealed considerable overlap between students across the groups being compared. In other words, it was not the case that all disadvantaged students fared worse under lockdown than all advantaged ones – they fared worse on average, with some disadvantaged students faring better than more advantaged peers, and vice versa.
Second, although it was obviously predictable that students from disadvantaged backgrounds would (on average) find it disproportionately more challenging to learn effectively at home, plenty of effects were observed that were far less obvious. For instance, when discussing outcomes from Ofsted’s interim visits in October, the Chief Inspector explained that learners could be divided into 3 broad groups:
There are those who have been, and still are, coping well in the face of restrictions; there is a group who have been hardest hit, largely because of the interplay between their circumstances and the impact of the pandemic; and there is the majority – a group who have slipped back in their learning to varying degrees since schools were closed to most children and movement restricted.
(Spielman, 2020)
Although she associated coping well with having good support structures during lockdown and having benefitted from quality time spent with families and carers, she was also quick to emphasise that this was not a simple message concerning privilege versus deprivation. Instead, the students who were coping well came from all backgrounds, including those within the care system who saw relationships with carers improve at the same time as the lockdown meant they were not dealing with wider pressures and challenges that might exist outside of the home.
Research from the National Foundation for Educational Research (NFER) added another layer of complexity related to the potential benefits for vulnerable students and children of critical workers who were studying in school, rather than remotely, during Phase 1. These students were “in many cases better supported and supervised” than their classmates who were studying at home (Julius & Sims, 2020, p.3).
Other research teams explored wider causes or correlates of more or less effective learning during lockdown. For instance, ImpactEd (2021) found that students who exercised regularly were more likely to say that they had developed a positive learning routine (58% compared to 33%).
Third, although this rapid response questionnaire survey research has been invaluable in characterising the state of education during Phase 1 of the pandemic, it is also important to acknowledge that research outcomes have not always been entirely consistent. For example, estimates of how much time students were spending on learning activities during lockdown varied substantially between Green (2020) and Andrew et al (2020). When we attempted to work out why such differences might have arisen, we began to unpick additional layers of complexity. We can illustrate this by interrogating a ‘lost time’ estimate from Green (2020), which was based upon a dataset that ended up being analysed by a variety of research teams.[footnote 9]
Green concluded that one-fifth of students was doing either no schoolwork or less than 1 hour of schoolwork a day during the first lockdown (late April 2020). This figure was widely quoted at the time (and subsequently) and spawned numerous national media headlines.[footnote 10] Subsequently, Eivers et al (2020) published an analysis of responses to the same question, which was broken down by primary and secondary school students (see page 5 of their report). These results, however, seemed to suggest that only around 13% of primary school students, and 7% of secondary school students, were spending less than 1 hour studying – both substantially less than the 19.6% reported by Green.[footnote 11]
In fact, scrutiny of the underlying questionnaire revealed that results from Eivers et al actually related to a follow-on question. In other words, it was only answered by parents whose child had actually been set work to do at home by their school. So, to understand what proportion of students did either no schoolwork or less than 1 hour of schoolwork a day, we would need to combine responses to the ‘routing’ question and to the main one, which is the approach that Green took.[footnote 12] Adopting an approach of this sort takes us back towards Green’s overall figure of 19.6%.
The more interesting point, however, concerns the context that the Eivers et al analysis provides for understanding Green’s overall figure. Green’s analysis included results for children from all phases of schooling, from Reception to key stage 5. Yet, data from Eivers et al (see page 2) indicated that students from year 11 and year 13 were outliers in the sense that about half of teachers had set these year groups no work at all – perhaps not surprisingly, as they no longer had any exams to revise for. In contrast, only 2% of students in years 7 to 9 had been set no schoolwork, and almost all year 10 students (now in year 11) had been set schoolwork. In other words, the percentage of secondary school students in years 7 to 10 who were doing either no schoolwork or less than 1 hour of schoolwork a day during the first lockdown was probably closer to the figure of 7% after all.[footnote 13]
Ambiguities and inconsistencies aside, we should certainly not dismiss estimates of disengagement during this phase of the pandemic. We may not be able to say exactly how many students completely disengaged from their learning during the first period of remote learning, but a small minority probably did. More importantly, it is clear from both Green and Eivers et al that some students were studying far less than others. The data (on page 5) from Eivers et al are particularly informative on this point. They revealed that:
- 15% of the highest income bracket students were studying for less than 2 hours a day, while 65% of students from this bracket were studying for more than 3 hours a day
- 30% of the lowest income bracket students were studying for less than 2 hours a day, while 43% of students from this bracket were studying for more than 3 hours a day
There are three important points to draw from this analysis. First, many secondary school students were spending quite a lot of time studying, a month or so into this period of remote learning (even though study time was down, on average, when compared with a normal school day). This is the ‘good news’. Second, on average, students from lower income brackets were reported to be studying less. This is the ‘bad news’. Third, even within the same income bracket, students were reported to be spending very different amounts of time studying. This is the ‘challenging news’ which reminds us that there will be many exceptions to the dominant finding from research into learning during the pandemic – that disadvantaged students are likely, on average, to have lost disproportionately more learning.
New normal #1: Phase 2 – autumn term 2020
The first point to note about the autumn return to a ‘new normal’ instructional delivery mode was that it was still a long way from business as usual, and a substantial proportion of students returned to a somewhat shorter school day. Only 59% of respondents to a survey conducted between mid-September and mid-October reported that students were attending for a full day (Elliot Major et al, 2020). Having said that, students in this study were reported to be studying far longer each day than during Phase 1. The length of the school day may have been affected by COVID-19-related policies, such as staggered starts, or related social distancing measures.
It is also important to note that a sizeable proportion of students did not return to schooling during Phase 2, and attendance rates fluctuated across the autumn term. Sibieta & Cottell (2021) described the situation like this:
In secondary schools in England, attendance fell from over 85 per cent through most of September to 82 per cent by the end of October. Secondary school attendance rose back up to 87 per cent after half-term, before falling over the rest of term. A further dramatic fall in the last week of term led to a low of 72 per cent at the end of the autumn term.
(Sibieta & Cottell, 2021, p.25)
They also noted that, in previous years, secondary school attendance would normally be in the range of 95%, meaning that attendance rates were down by around 10% from the outset. This would have been for a variety of reasons: some students were withdrawn from school and home educated, including for reasons of shielding; other students would have been self-isolating; some would have been ill; and so on. Sibieta (2020) suggested that about 4 to 5% of students in England were absent from school for COVID-19-related reasons during October, rising to 6 to 7% in the week before half-term. Roberts & Danechi (2020) noted that, as at 3 December 2020, around 7 to 8% of state-funded school students did not attend for COVID-19-related reasons, including:
- 0.2% with a confirmed case of COVID-19
- 0.3% with a suspected case of COVID-19
- 6.4 to 7.0% self-isolating due to potential contact with a case of COVID-19
- 0.5% in schools closed for COVID-19 related reasons
It is clear that many students were absent from school during any particular day during the autumn term. Equally, though, it is clear that on any particular day the vast majority of students were attending school, even at the very end of term when secondary school attendance rates were at their lowest (72%).
Bibby et al (2021) demonstrated that absence rates throughout the autumn term increased with each year group: from around 10% for year 7 students to around 16% for students in years 10 and 11. This reflected higher infection rates in older age groups.[footnote 14] Consistent with a dominant theme of this report, they also noted substantial variation: almost 40 schools had year 11 absence rates over 32%; and around 150 schools had year 11 absence rates of 8% or lower. Furthermore, consistent with another theme, they noted that disadvantaged students missed the most sessions: 21% of sessions for disadvantaged year 11 students, compared to 14% amongst other year 11 students.
Although the autumn term was clearly a period of extended disruption, it is quite hard to work out how the ‘typical class in the typical school’ might have experienced this disruption, and therefore the extent to which the ‘typical class in the typical school’ managed to return to the new normal of whole-class in-school tuition during this term. If we were to assume that 7% of students in any particular school were forced to study at home for COVID-19-related reasons on any particular day during the autumn term – and it was a different 7% of students each week – then that would amount to each student having to spend just 1 teaching week at home. However, students were required to self-isolate for 2 weeks at a time, so perhaps this is better characterised as the typical student self-isolating for either 0 weeks or 2 weeks? Either sounds like a fairly plausible new normal, with the vast majority of the term spent in school.
In a briefing on school attendance during the autumn term, the Children’s Commissioner commented on the widespread negative narrative that characterised this period, which seems far less consistent with the idea of a new normal:
Some have called for all schools to be closed on the basis that the virus is ‘running riot’ through schools and posing an unacceptable risk to staff.
[…] Others have argued that school attendance has ‘collapsed’ to such a point that the continued opening of schools to all children was not viable.
[…] The evidence we have analysed for this briefing does not support these conclusions. Instead, we find the reopening of schools to have been highly successful and that, given the increasing prevalence of Covid-19 in the community, schools have done a remarkable job in limiting transmission.
(Children’s Commissioner, 2020, p.4)
This report also suggested that students had missed about a week of whole-class in-school tuition this term, at least, on average. Of course, even within a school, the average is going to conceal a considerable amount of variation. There were no doubt plenty of schools in which certain year groups, or certain class bubbles, had to self-isolate repeatedly, while others did not self-isolate at all. Unfortunately, at the time of writing this report, we did not have the data with which to explore this in detail.
An equally tricky narrative concerned the idea – which came to dominate media coverage as the term progressed – that schools in the north of England were in a far worse state than in the rest of England. By the middle of October, it was certainly true that many areas in the north of England were seriously affected. Burgess et al (2020) demonstrated how attendance tended to be lower in regions with higher infection rates. The north-east, north-west, and Yorkshire and the Humber appeared to be particularly badly affected. However, as noted earlier, there were many exceptions to this rule, and attendance rates varied hugely across local authorities, both within and across regions.
Roberts & Danechi (2021a) illustrated this variation graphically using a map of England – which cycled through each week of the autumn term – to classify local authorities in terms of proportions of students absent for COVID-19-related reasons, with categories ranging from light pink (0 to 5%) to dark red (more than 20%).[footnote 15] Most of the time, most local authorities were in the lowest prevalence categories. What is more interesting, though, is how the highest prevalence categories swept diagonally downwards, like a weather front, from the north-west down to the south-east as the term progressed. Indeed, attendance rates fell consistently in London, the south-east, and the east of England throughout the whole of the second half of the autumn term. Again, though, we should not forget that attendance rates were substantially down across all regions of England throughout this term, even in the least affected regions.
Finally, related to the challenges faced by disadvantaged students, evidence from a Teacher Tapp survey conducted 18 November 2020 suggested that students in private schools suffered less disruption than students in state schools. Amongst private schools, 51% were able to claim that they had remained fully open to year 11 students from September to mid-November, compared to 33% amongst state schools (Montacute & Cullinane, 2021).
Remote learning #2: Phase 3 – January 2021 to early March 2021
At the time of writing this report, very little research had been published on learning during the second remote learning phase. However, a report by Montacute & Cullinane (2021) – based upon surveys of teachers and parents, conducted by Teacher Tapp and YouGov, during early January 2021 – provided some very important insights. It demonstrated that the circumstances of learning improved substantially during the second lockdown, compared with the first, although disadvantaged students still tended to be studying under comparatively less favourable circumstances. An NFER survey of teachers, conducted in March at the end of Phase 3, reached similar conclusions (Nelson, Andrade & Donkin, 2021).
Findings from Montacute & Cullinane indicated that school provision for online learning had changed radically since the first lockdown: with 54% of teachers now using online live lessons in January 2021, compared with just 4% in March 2020. Only 10% of parents reported that their children were receiving no live or recorded lessons, compared with two thirds in the first weeks of the first lockdown. Findings from Nelson et al also reported 54% of schools delivering live teaching by March 2021, although their baseline figure from 2020 was 22%. The NFER analysis also revealed that figures were lower in primary schools, which brought the overall average down. They noted that 78% of secondary schools provided live teaching during Phase 3 (versus 45% in Phase 1).
Parents from the Montacute & Cullinane study reported that students were spending more time studying during Phase 3. For example, the proportion of secondary school students studying for more than 5 hours a day increased from 19% in the first lockdown to 45% in the second. Teachers also reported that students were returning more work, with half of survey respondents saying that the quality of work received so far was at least as good as they would normally expect from their students, with just under a half saying that it was lower. Overall, findings from this report paint a far more positive picture of learning during Phase 3 of the pandemic than during Phase 1.
Results from a number of Parent Ping surveys from January to March 2021 supported this more positive conclusion. Over the first few weeks of remote learning, more than 50% of Ping parents of secondary school children reported that they were learning for more than 5 hours a day, although this did tail off during the last few weeks, to just over 30%.[footnote 16] The vast majority of Ping parents felt that their child was being set about the right amount (or slightly too much) home-schooling each week.[footnote 17] Also worthy of note was the finding that 37% of Ping parents of secondary school children reported that they did weekend schoolwork, and 5% thought that their child was learning more at home than they would have learned at school.[footnote 18]
In addition: 75% of Ping parents of secondary school children reported that they had live lessons during the first week of home-schooling, with 46% having 3-4 hours per day; 88% of children received work via an online learning platform; and 80% had video calls with their teacher.[footnote 19]
Challenges remained, however, and Montacute & Cullinane identified numerous examples of disparities in teaching and learning during Phase 3. For example, although substantially more state schools were now using online live lessons (54%), disproportionately more private schools were now doing so (86%), so the gap between state and private had widened. Similarly, whereas 40% of children in middle-class homes were reported to be doing over 5 hours a day, only 26% of those in working-class households were reported to be doing so. Despite the distribution of laptops continuing, 47% of state school senior leaders reported that their school had only been able to supply half of their students or fewer with the laptops they needed (56% at the most deprived schools versus 39% at the most affluent). Indeed, 20% of respondents to a YouGov survey of adults from Great Britain who were home schooling their children during the first week in February reported not having adequate technology for all of their children to consistently access online lessons or learning resources.[footnote 20] As secondary schools were now legally obliged to deliver at least 5 hours of remote education each day, this would have increased the pressure on students, at home, who were sharing devices with siblings or parents.
The NFER report also indicated that challenges remained during Phase 3 (Nelson et al, 2021). Teachers reported covering only 70% of the curriculum content that they would normally expect to cover during this period (averaged across all primary and secondary school respondents). Although the vast majority of secondary schools offered live teaching, senior leaders suggested that around a quarter of students did not attend most of their live lessons (on any particular day). Furthermore, although the most deprived schools were just as likely as the most affluent schools to be offering live learning, their estimates of how many students attended most of those lessons were far lower: 59%, on average, for the most deprived schools versus 78% for the most affluent.
Finally, it is worth mentioning that far more vulnerable children, and children of critical workers, attended school during the second lockdown. As at 11 January 2021: around 14% of state school students were attending, compared to around 1% on 28 May 2020 (just prior to the partial school reopening); 34% of students with an Education, Health and Care plan were attending; and 40% of students with a social worker were attending.
New normal #2: Phase 4 – early March 2021 to mid-May 2021
The present report was written soon after the beginning of Phase 4. The signs are that it will prove to have been a very different return to a new normal than occurred during Phase 2. Routines for teaching and learning under new normal arrangements are well established now. The overall national attendance rate has been higher than in the autumn term, exceeding 90% on 10 consecutive days at the end of March (Roberts & Danechi, 2021b).
Having said that, there are still issues worthy of comment, for example, attendance rates still differed somewhat across regions: end of March attendance was highest in the south-east and south-west, at around 92%, and lowest in Yorkshire and the Humber, at around 86% (see report 2). As such, individual classes, or bubbles, were still occasionally being sent home to self-isolate, with some areas being worse affected than others. On the whole, though, the experience of learning during Phase 4 of the pandemic seems to be a long way removed from the turbulent narrative that characterised Phase 2.
Quantifying lost time
Children’s Commissioner for England, Anne Longfield, recently delivered her outgoing speech, which focused on ‘building back better’ after the pandemic.[footnote 21] In it, she quoted the following statistic:
Even if schools open as planned [in March], England’s children will have missed, since the start of the pandemic, 850 million days of in-person schooling
Quoting even bigger numbers, OECD Director Andreas Schleicher noted that:
Last year, 1.5 billion students in 188 countries were locked out of their schools.
(OECD, 2021, p.3)
Headline figures such as these are great for capturing the imagination, but what do they actually mean, and how much do they actually tell us about learning loss? The situation would be clearer if students had simply stopped learning during the pandemic, and had made no attempt to catch up. One day of national closure would then straightforwardly equate to one day of lost learning for every student in the country.
Yet, that has not been the story of the pandemic – not during any of its phases. During the pandemic, a student should only have been expected to stop learning entirely if they were to have become incapacitated, perhaps having caught a serious bout of COVID-19. Yet, as we know, children and young people tended not to have been seriously affected by the virus itself. The story of the pandemic – during each of its phases – has been one of having to study under abnormal circumstances, typically less than ideal circumstances, and sometimes extremely unfavourable ones. Within this story, the idea of ‘lost time’ is challenging to unpick, and there is certainly no straightforward conversion from lost time into lost learning.
Report 2 attempted to make sense of this story by trying to figure out what proportion of the traditional 2-year GCSE or A level course (leading up to summer 2021) might have been spent learning under different circumstances. This was informed by a variety of different approaches to researching lost time during the pandemic: from studies that investigated days lost from the school week on the basis of school attendance data (for example, Sibieta & Cottell, 2021) to studies that investigated hours lost from the school day on the basis of survey response data (for example, Cattan et al, 2021).
Table 3, below, uses a scenario modelling approach (explained and illustrated in greater detail in report 2) to begin to unpick the idea of lost time. The scenario in question considers the amount of time that students from the same GCSE class might have ended up spending in different instructional delivery modes, across the period from the beginning of their GCSE course (early September 2019) to its end (mid May 2021). This is a hypothetical scenario, but it is certainly a plausible one.[footnote 22]
We have identified 4 students for the sake of this analysis:
- coping – a student with a good family support structure and optimal home learning resources
- critical – a child of a critical worker, who attended school even when their class was in the ‘remote’ instructional mode
- shielding – a student who (on the advice of a clinician) was shielding, who did not attend school even when their class was in the ‘new normal’ instructional mode
- disengaged – a student with a poor family support structure and suboptimal home learning resources
This scenario is designed to illustrate how even students from exactly the same class may have experienced learning during the pandemic quite differently.
The first point to note is that none of these students could have been said to have ‘lost’ more than two thirds of their ‘time’ during year 10 and 11 under any interpretation of lost time. This is because more than one-third of teaching weeks had elapsed before Phase 1 of the pandemic had kicked in. Although we can assume that all 4 students were learning under the same circumstances until this happened (whole-class in-school tuition), it is clear that their circumstances departed radically from that point onwards.
One of the starkest contrasts within Table 3 is between critical worker and shielding. The critical worker student ended up studying in school for 97% of their year 10 and 11 teaching weeks, whereas the shielding student ended up studying in school for just 36%. Both the coping and disengaged students fell in between these figures, studying in school for around two-thirds of their total teaching weeks.
The 2 weeks during which the critical worker student was studying remotely corresponds to a period during Phase 2 (new normal) when the entire class had to self-isolate, following a confirmed infection. The coping student also studied remotely during this 2-week period, as well as for another 2-week period during Phase 4 (also new normal), when they were forced to self-isolate again, following contact with a friend of the family who tested positive. Bear in mind, however, that these two 2-week remote learning experiences would have been quite different for the coping student. In the first, all students in their class would have been taught online; whereas, in the second, only the coping student would have been studying remotely, while the rest of their class was being taught in school.
The image of the coping student that we have in mind, here, is of someone who worked hard to keep up with their studies throughout the pandemic. They did their best to continue studying and learning despite sometimes having to do so from home rather than at school. Incidentally, Table 3 also indicates that the coping student returned to school on a limited basis towards the end of the summer term, notching up a week in total at school during Phase 1.
Earlier, we identified two principal causal determinants of learning loss – less time spent studying, and learning less effectively. It is clear from Table 3 that, for this particular coping student, the story of learning loss during the pandemic does not actually involve less time spent studying, and is purely a matter of learning less effectively. Even during Phase 4 (new normal) it is quite likely that they were learning less effectively than during Phase 0 (before the pandemic kicked in). And during Phase 2 (new normal) and Phase 3 (remote learning) they would probably also have been learning less effectively. Yet, they would still have been studying throughout.
Table 3. Number (percentage) of teaching weeks spent in different circumstances from early September 2019 to mid-May 2021 (hypothetical scenario). [Accessibility note: blank spaces left in table to emphasise lack of time spent studying.]
| Place of study | Coping | Critical | Shielding | Disengaged |
|---|---|---|---|---|
| P0 (traditional): At home | ||||
| P0 (traditional): At school | 25 (36%) | 25 (36%) | 25 (36%) | 25 (36%) |
| P1 (remote): At home | 13 (19%) | 14 (20%) | 7 (10%) | |
| P1 (remote): At school | 1 (1%) | 14 (20%) | ||
| P1 (remote): Not studying | 7 (10%) | |||
| P2 (new normal): At home | 2 (3%) | 2 (3%) | 14 (20%) | 2 (3%) |
| P2 (new normal): At school | 12 (17%) | 12 (17%) | 12 (17%) | |
| P2 (new normal): Not studying | ||||
| P3 (remote): At home | 8 (12%) | 8 (12%) | 6 (9%) | |
| P3 (remote): At school | 8 (12%) | |||
| P3 (remote): Not studying | 2 (3%) | |||
| P4 (new normal): At home | 2 (3%) | 8 (12%) | ||
| P4 (new normal): At school | 6 (9%) | 8 (12%) | 8 (12%) | |
| P4 (new normal): Not studying | ||||
| Entire period: At home | 25 (36%) | 2 (3%) | 44 (64%) | 15 (22%) |
| Entire period: At school | 44 (64%) | 67 (97%) | 25 (36%) | 45 (65%) |
| Entire period: Not studying | 0 (0%) | 0 (0%) | 0 (0%) | 9 (13%) |
Table 3 characterises the critical worker student and the shielding student similarly. There is no reason to assume that they spent fewer days (per week) learning during the pandemic than if the pandemic had never struck. And, in this hypothetical scenario, none of these students was ill with COVID-19. However, it is still possible that they may have spent fewer hours (per day) learning for at least some of the 14 week period of remote learning during Phase 1.
Our hypothetical scenario indicates something different for the disengaged student. Table 3 models them as having spent 7 weeks of Phase 1 not learning at all, and the same for 2 weeks of Phase 3. This is a student who, for one reason or another, found themself unable to keep up with their studies throughout the pandemic – at least, during those phases when they were required to study remotely. Some days they committed substantially fewer hours to learning than their less disengaged classmates. Other days they simply dropped out. Only once they returned to the new normal of whole-class in-school tuition were they able to begin reengaging properly. Ultimately, their learning would have been compromised both by less time spent studying, and by learning less effectively.
The bottom rows of Table 3 summarise the amount of time spent studying at home versus in school throughout the period of the pandemic. However, to understand the likely impact of studying under different circumstances, we need to consider the particular circumstance of each learner during each phase. As noted above, the critical worker student who was forced to study remotely during Phase 4 might well have found this more challenging than when they were studying remotely during Phase 3 – assuming that their teacher would have been focused primarily upon delivering high quality face-to-face lessons during Phase 4, as opposed to focusing primarily upon delivering high quality online lessons during Phase 3.
Table 4. Risks of general versus differential learning loss
| Phase | General learning loss risk | Differential learning loss risk |
|---|---|---|
| Phase 0 (traditional) | [Not applicable] | [Not applicable] |
| Phase 1 (remote) | Highest | Highest |
| Phase 2 (new normal) | Middling | Middling |
| Phase 3 (remote) | Middling | Middling |
| Phase 4 (new normal) | Lowest | Lowest |
More generally, different phases of the pandemic are likely to have been associated with higher or lower levels of risk of both general learning loss (affecting all students) and of differential learning loss (affecting some more than others). Table 4 attempts to quantify this degree of risk, albeit very roughly. The first substantive column suggests that the risk of general learning loss was present throughout all 4 phases of the pandemic, although it tailed off from one phase to the next, as teachers, students, and parents or carers became more adept at coping.
The second column suggests that the risk of differential learning loss was also present throughout all phases, and also tailed off from one phase to the next, but perhaps for different reasons. The return to whole-class in-school tuition, during Phase 2, meant that all students within the same class were studying under the same circumstances, reducing the risk of differential learning loss due to students having to study under different circumstances at home. However, during this phase, differential infection rates across regions, local authorities, and districts led to greater disruption to teaching and learning for students in different locations, including sometimes having to revert to remote learning. This would have increased the risk of disproportionate learning loss for students in the worst affected areas. Subsequently, the return to remote learning, during Phase 3, increased the risk of differential learning loss due to students having to study under different circumstances at home. However, as certain of the obstacles to remote learning had been overcome by Phase 3 for a significant proportion of disadvantaged students – including wider distribution of laptops, tablets, and connectivity support, for example – the risk of differential learning loss was less in Phase 3 than in Phase 1.
If we think about the risks of differential learning loss in relation to the different circumstances of learning outlined in Table 3, the story becomes even more complex. Imagine, for instance, that the critical worker student and the shielding student were both similar to the disengaged student in having a poor family support structure and suboptimal home learning resources. The fact that the critical worker student spent 97% of their year 10 and 11 teaching weeks in school would mitigate the risk of disproportionate learning loss, at least to some extent. However, the fact that the shielding student spent the entire duration of the pandemic at home would exacerbate it. In other words, two very similar students, from exactly the same class, might end up experiencing quite different levels of learning loss, depending on the particular circumstances of their learning during the pandemic.
Headline figures such as ‘850 million days’ of in-person schooling lost have a very important role to play in focusing hearts and minds on the critical task of responding to impacts arising from the pandemic. However, to truly understand those impacts, we need to refocus our attention from the nation to the individual student. Even when considering average impacts for different groups of students – in different regions, or in different school types, or suchlike – we will fail to see the ways in which students from different groups are similar, and students from the same group are different. Learning loss is a phenomenon that needs to be understood from the perspective of each and every student, individually. This is not to deny that impacts arising from the pandemic will, on average, be more serious for students from certain groups. In particular, it seems likely that disadvantaged students will, on average, have been more seriously affected. The point is simply that stories of learning during the pandemic are too complex and nuanced to be told simply (or even primarily) in terms of group effects.
One final point worthy of mention concerns the relevance of the summer learning loss phenomenon to understanding learning loss during the pandemic. In retrospect, the comparison is not actually very instructive. Summer learning loss is about what happens when learning stops for a certain amount of time, whereas pandemic learning loss is primarily about what happens when students learn less effectively during the time that is available to them. We should be wary of extrapolating from one context to the other.
Quantifying lost learning
The final, concluding, insight that we need to draw from the literature concerns how far students in England may have fallen behind (or forged ahead) in their learning as a direct or indirect result of the pandemic. This has been quantified in a variety of ways since March 2020.
The earliest attempts to quantify learning loss were based upon statistical models, using assumptions derived from extant research (see report 5). Conclusions from these models were sobering. As the pandemic progressed, attempts to quantify learning loss switched from modelling to measuring, and became increasingly sophisticated.
Teacher estimates
In September 2020, the NFER published outcomes from a survey of primary and secondary school teachers, which was weighted to be representative of mainstream schools in England (Sharp et al, 2020). It was effectively a learning loss ‘stock take’ at the end of the 2019 to 2020 academic year, carried out in July 2020, in advance of the return to schooling in the following academic year. The NFER asked teachers to estimate how far behind their students were in their curriculum learning compared to where they would normally expect them to be. On average, primary school teachers estimated their students to be 3 months behind, while secondary school teachers estimated their students to be 2-and-a-half months behind.
Perhaps more interesting was the variation in teachers’ estimates, from 2% of teachers reporting that their students were not behind at all to 4% of teachers reporting that their students were 6 months behind or more. This is in the context of the number of cases of COVID-19 in the UK only having risen above 100 in early March, around 4 months earlier, which suggests an element of regression for some students (going backward in learning, rather than simply not going forward). As very few teachers reported covering more than 90% of the curriculum, it seems likely that most students really were behind in their learning. Yet, whether the large variation in estimates across schools reflected genuinely large differences in learning loss, as opposed to the difficulty of the estimation task itself, and therefore the prevalence of estimation error, is hard to say, although it seems fair to assume that this was a fairly error-prone approach (see report 4).
Once students returned to school at the beginning of the autumn term, Ofsted began a series of interim visits, to understand the state of teaching and learning during the pandemic, across a full range of providers. By the November visits, schools were in a much better position to be able to judge the extent of learning loss. The Chief Inspector’s commentary on the November visits (dated 15 December 2020) stated that many students were thought to be at least 6 months behind in their learning. Although the summer holiday makes it hard to interpret exactly what this estimate means, it clearly suggests a very substantial amount of loss.
Attainment data studies
Towards the end of the autumn term, and into the spring term, we began to see evidence from analyses of large-scale attainment datasets. Studies from England mainly involved data from primary schools, which were almost exclusively derived from assessments carried out towards the beginning or end of the autumn term. These studies indicated that, when assessed during the autumn term of 2020: primary school students were generally a month or so behind expectations, and disadvantaged primary school students were disproportionately behind (see report 3). Beyond these general conclusions, however, the evidence was a little mixed. There was some indication that maths was more seriously affected than reading – and that younger students were further behind expectations than older ones – although these patterns were not always consistent. There were also some anomalous findings (for example, for writing).
Evidence from analyses of large-scale attainment datasets also began to emerge from overseas during autumn 2020, particularly research from the USA (see report 5). Education in the USA suffered from school closures from March through to July, just as in England, although many states continued their school closures into the autumn term. Research from the USA has provided considerable evidence of learning loss in both reading and maths, although losses for reading (around 1-and-a-half months) were typically smaller than losses for maths (around 3 months). These general conclusions from the USA are in the same ballpark as those from England.
However, there was also plenty of inconsistency in findings across studies from the USA. For instance, two studies based on the same assessment instrument appeared to reach different conclusions concerning learning loss in reading: one indicating fairly small losses in lower grades, and evidence of gains in higher grades (Curriculum Associates, 2020); the other indicating significant losses across grades K to 5 (Dorn et al, 2020).[footnote 23] Studies also differed in terms of whether they found evidence of disproportionately large losses for groups of students characterised in terms of ethnicity or disadvantage: some found substantial effects on both counts (for example, Kogan & Lavertu, 2021); others found only small effects (for example, Renaissance, 2020); while others found no clear evidence (for example, Bielinsky et al, 2021). Again, there is a lot that remains unclear concerning the extent of learning losses (or gains) since the pandemic began.
A number of studies have demonstrated that learning progresses differently in different terms, including the Renaissance Learning & Education Policy Institute (2021) study from England, which indicated that rates of progress appeared highest during the autumn term, tailing off subsequently throughout the academic year. This, coupled with the recognition that the beginning of the 2020 to 2021 academic year followed an extended period of absence, suggests that we should be wary of over-interpreting conclusions from assessments conducted during autumn 2020.
We have not yet seen many studies from spring assessments. A second study from Renaissance, in the USA, examined progress in learning from fall to winter, alongside absolute performance levels in the winter (Renaissance, 2021). They found that students had generally made good progress in reading and maths throughout the new academic year – from fall to winter – with growth indicators just below normal for that period. Absolute attainment levels were still down on previous years, although there was some evidence of catch-up in maths.[footnote 24] Interestingly, the only spring attainment data study from England, to date, suggested the opposite trend: that students had generally fallen further behind whilst learning remotely during Phase 3 of the pandemic (Blainey & Hannay, 2021).
One interesting observation from England and overseas is that the scale of learning loss typically observed seems – at least on average – to be somewhat less extreme than some of the earlier modelling suggested. As noted by EmpowerK12, a North American non-for-profit organisation, which was responsible for some of the early modelling:
On the positive side, the dire predictions of learning loss from this spring, counted in half to full numbers of years, did not pan out. Students gained knowledge this spring and summer. However, those gains significantly lagged typical gains during traditional in-person school.
(EmpowerK12, 2020, p.1)
Admittedly, the occasional study has concluded that students failed to learn anything at all during lockdown, including an analysis of data from the Netherlands during their March to May closures (Engzell et al, 2021). Yet, other studies have reached exactly the opposite conclusion – that students have learned just as much as they would normally have learned – including an analysis of data from New South Wales during their March to May closures (Gore et al, 2021). Most international studies have reported evidence of some learning losses – although not as much as the dire predictions suggested – while a few have identified some evidence of learning gain, especially for older primary and secondary school students in reading.
Beyond these general impacts, it is important to note that studies of attainment data from the autumn term have largely confirmed predictions that students from disadvantaged backgrounds would be likely to lose disproportionately more learning. However, hypotheses concerning regional differences in learning loss – including expectations that regions in the north of England would be likely to lose disproportionately more learning – were not supported to quite the same extent.
The attainment data studies also included certain indicative results that are worthy of further comment. For instance, the Renaissance study from the USA reported that Asian students had achieved a learning gain in reading – the only ethnic group to have done so. The point, here, is simply to raise awareness that certain groups of students might well have bucked the general trend in terms of learning during the pandemic – in England, just as in the USA.
Equally, though, the attainment data studies give us pause for thought concerning students at the other end of the distribution. Numerous studies from both England and the USA have noted differential attrition rates amongst the lowest attaining students. It seems possible that there may be numerous serious casualties in this group – as far as learning during the pandemic was concerned – although the number of students who effectively withdrew themselves from education for large chunks of time from March 2020 onwards is unknown.
At the beginning of the pandemic, education researcher John Hattie reassured us that we should “not panic if our kids miss 10 or so weeks” of teaching (Hattie, 2020). He based this on his experience of learning during the Christchurch earthquakes of 2011, which seriously disrupted access to schools. At the time, he had argued – on the basis of research into teacher strike impacts – that there might well be no learning losses at all for upper secondary school students, and possibly even learning gains. In fact, student performance ultimately went up.
Subsequent modelling exercises began to tell a different story, however, along the lines of: missing “twelve weeks of school is likely to have a very significant impact” (RS DELVE Initiative, 2020), explicitly casting doubt upon Hattie’s sanguine conclusions.
Now, with some of the data already in, we are beginning to get a clearer picture. There does seem to be evidence of significant learning loss, although not quite as extreme as some of the less optimistic modelling predicted. Importantly, though, and in agreement with the modelling, there does seem to be evidence of disproportionate learning losses for the most disadvantaged students.
Generalising conclusions
It is important to consider the extent to which it might be legitimate to generalise conclusions from studies, like these, which focus primarily upon attainment in primary school reading and maths. We have already noted that we should be cautious in generalising from primary school impacts to secondary school ones, especially to impacts upon upper secondary school students. A more challenging question, though, is whether we can be confident in generalising to other subject areas within the curriculum. Observations from Ofsted’s interim visits during the autumn term help to shed some light on this (Ofsted, 2020a; 2020b; 2020c).
Reporting on the second round of visits, in October, Ofsted noted that many primary schools had returned to teaching the full range of foundation subjects. In November, they observed that almost all primary schools had returned to teaching their usual range of subjects. However, all three reports explained that maths and English were being prioritised. Reporting on the third round of visits, Ofsted noted that most primary school leaders had restructured their timetables to prioritise English and maths, giving more teaching time to these subjects. The same report explained that English and maths were receiving considerably more attention than science, and that primary leaders were not always clear about how (or whether) the foundation subject curriculum content that was therefore being lost during the autumn term would eventually be covered.
These findings suggest that it may not be safe to generalise conclusions from primary school maths and reading to other areas of the curriculum. Indeed, it is possible that the other subject areas might fall further behind whilst English and maths begin to catch up. If so, then evidence of catch-up in maths and reading, going forward, should not necessarily be interpreted as evidence of catch-up across the wider curriculum.
The meaning of ‘months behind’
Evidence from No More Marking (2020) concerning performances in writing also provides food for thought here (see report 3 for further details). This study concluded that, in September 2020, year 7 students were “22 months behind where we would expect them to be” in writing, which suggests that students must have seriously regressed, that is, gone backward in their learning.[footnote 25] A finding of this sort raises all sorts of questions, not the least of which is whether the finding is genuine, as opposed to some artifact of the method. Having said that, particular problems with primary writing were noted during Ofsted’s autumn visits. And, in the following spring, nearly a quarter of Parent Ping parents singled out primary writing as a subject in which they believed students had got much worse (more than twice as many parents claimed this for writing as for the other subjects).[footnote 26]
Technically, it is more correct to say that the No More Marking study indicated that year 7 students’ performances in writing, in September 2020, were indistinguishable from performances that had previously been elicited from students 22 months younger. Now, for the sake of argument, what if we were to assume that (say) 4 months of this effect was an artifact of the method, and the rest was genuine?[footnote 27] Even then – assuming that these year 7 students were performing at a level similar to students 18 months younger – a huge question would remain concerning how to interpret this stark conclusion. Would it mean, for instance, that, in September 2020, these students had no more knowledge or skill in writing than they had in March 2019 when they were in year 5? Bearing in mind that they obviously had been learning how to write throughout the period from March 2019 (year 5) through to March 2020 (year 6), this interpretation seems at least a little implausible. It would amount to saying that they had literally lost all of that knowledge and skill, and that any subsequent learning would need to be built upon this far lower foundation, and that it would therefore take at least a year just to catch up to where they ought to have been in September 2020.
Perhaps, instead, we may need to draw a distinction between how many ‘months behind’ students appear to be, on the basis of attainment data studies, and how many ‘months it will take’ before they catch up again? After all, this is the figure that we are most interested in: not how many months behind performances appear to be, but how many months it will take before performances match expectations once again. This is a subtle difference, but potentially an important one. It seems unclear, at the moment, how to draw inferences about the latter from the evidence that we currently have of the former – not just for this study but for the others too.
Performance regained
Earlier, we noted the distinction drawn by Bjork & Bjork (1992) between storage strength and retrieval strength, which was central to their new theory of what happened to prior learning when it was no longer being used. A much older theory, which had been thoroughly debunked by then, proposed that memory traces simply decayed. Conversely, their new theory proposed that stored learning simply remains stored. More importantly (for the purpose of the present report) although prior learning may become harder to retrieve if it has not been used for a while, it can be made accessible again at ‘an accelerated rate’ (Bjork & Bjork, 1992, p.49), by increasing its retrieval strength.
If this is right, then, to interpret evidence from attainment data studies during the pandemic, we may need to distinguish between deep learning deficits and superficial performance ones (see also Soderstrom & Bjork, 2015). The Education Endowment Foundation made a similar point in their rapid evidence assessment:
The distinction has implications for the remedy. If learning has been truly lost, it must be regained, which may be slow and painful. On the other hand, if it is merely rusty, it may be quickly regained with a small amount of practice. If students have not used a particular technique or procedure for a few months they are unlikely to perform it fluently if tested on arrival back in school. But if they had previously learnt it well, they might well regain that state quickly.
(Education Endowment Foundation, 2020, p.7)
Table 5 overlays this distinction between deep learning deficit and superficial performance deficit on the two quite different routes to learning loss identified earlier. The intention behind Table 5 is not to propose a new theory of learning and assessment for pandemic contexts. It is simply to suggest that there might be different kinds of story to tell regarding different contexts for learning during the pandemic, particularly, where certain subjects may have been prioritised for teaching.
Table 5. Learning deficit versus performance deficit.
| Route to learning loss | Deep learning deficit | Superficial performance deficit |
|---|---|---|
| Not studying at all for an extended period of time | New learning is not created or stored. | Prior learning becomes harder to retrieve. |
| Studying continuously yet learning less effectively | New learning is created or stored less effectively. | May depend on nature of learning deficit. |
Imagine, for instance, that students simply stopped writing during Phase 1 of the pandemic. If so, then, to interpret assessment outcomes from September 2020, we would only need to consider the first substantive row of Table 5. As such, part of any underperformance in September 2020:
- would represent genuine learning deficit, owing to not having committed the normal X weeks to studying writing during the spring and summer terms
- might simply represent a temporary performance deficit, owing to a lowering of retrieval strength in relation to knowledge and skill that had been acquired prior to March 2020
In terms of catch-up, the (new learning) learning deficit would presumably take just as long to be caught up as would be required if it were to be learned under normal circumstances. Whereas, the (prior learning) performance deficit would be caught up far more quickly. This is akin to the situation for summer learning loss.
More interestingly, though, it might be possible to tell a quite different story for another subject, such as maths. For instance, if students had generally continued studying maths throughout the pandemic – albeit sometimes under suboptimal learning conditions – then the first substantive row of Table 5 would not apply. To interpret assessment outcomes from September 2020, we would need to consider the second substantive row.
How long would it take these students to catch up in maths? Well, that might depend upon exactly how their learning had been compromised, for example: whether they ended up covering less breadth of content (to the same depth); or whether they ended up covering the same breadth of content (in less depth, or with more gaps). If, they covered the same breadth of content but in less depth, then there might be negligible performance deficit owing to prior learning becoming harder to retrieve – assuming that its retrieval strength had been maintained at a fairly high level owing to continued use. However, there might be a significant learning deficit related to the new learning – assuming that the challenging circumstances of the pandemic had made it far harder to achieve high levels of storage strength (or, more simply, far harder to achieve effective learning).
For the sake of this illustration, we have just compared a subject that was not studied at all for an extended period of time during the pandemic with a subject that was learnt less effectively despite continuous study. Although we used writing and maths for illustrative purposes – to bring this hypothetical comparison to life – neither subject would actually have fallen neatly into either of these two extreme categories. In other words, the truth would have been even more complicated for both subjects. However, as hypothetical and simplistic as this analysis clearly is, it still helps to provide some grounds for caution when interpreting outcomes from attainment data studies. On the one hand, it is very helpful that they tend to report in straightforward metrics, such as X months behind. On the other hand, it remains far from obvious how such metrics ought to be interpreted, and different interpretations might be required for different circumstances, and perhaps even for different students in essentially the same circumstances.
The context for assessments in summer 2021
We end this report by considering the context for assessments in summer 2021 in the light of the foregoing discussion of research and analysis into learning during the pandemic. As noted earlier, the evidence base is indicative of effects, yet often not definitive, and there are still significant gaps in our knowledge and understanding.
What is it safe to conclude?
On the basis of the foregoing discussion, it does seem safe to conclude that:
- during each of the phases of the pandemic, students in England have had to study under abnormal circumstances, typically less than ideal circumstances, and sometimes very unfavourable ones
- by summer 2021, the most widespread concern will have been less effective learning during periods that students were studying, rather than less time spent studying, because most students will have been studying for much of the time that was available to them, albeit under abnormal circumstances – this questions the relevance of the ‘summer holiday learning loss’ phenomenon to understanding learning during the pandemic
- as the pandemic progressed through a number of quite distinct phases, learners seem likely to have lost relatively less learning, as teachers, students, and parent or carers became more adept at managing circumstances
- by summer 2021, most students are likely to have experienced a net learning loss as a result of the pandemic
- the amount of learning loss that students will typically have experienced is hard to gauge, although it may not be as extreme as some of the earliest projections
- by summer 2021, a minority of students may have achieved a certain amount of learning gain, although how large a group this might be is unclear
- socioeconomically disadvantaged students are likely, on average, to have lost relatively more learning than their more advantaged peers – however, there will be many exceptions to this general conclusion, as many advantaged students will also have been extremely seriously affected, and many disadvantaged students will not have been
- students from certain areas are likely, on average, to have lost relatively more learning, although this is best understood locally rather than regionally, and not all students from even the worst affected areas will have been disproportionately affected
- learning loss is a phenomenon that needs to be understood from the perspective of each and every student, individually – impacts from the pandemic are too complex and nuanced to be described simply (or even primarily) in terms of group effects
- even students from very similar backgrounds, registered in the same class at the same school, might have experienced quite different levels of learning loss, depending on the particular circumstances of their learning during the pandemic
Beyond these general conclusions, little can be said with confidence, especially concerning the details of how students in particular circumstances might have been affected.
What seems less clear?
The following subsections identify a number of important issues for which the evidence is far from conclusive. These issues merely illustrate gaps in our understanding of learning during the pandemic, and are in no way exhaustive.
Quantification
Although it seems safe to conclude that most students are likely to have been affected by a certain amount of learning loss, and that some students are likely to have been disproportionately affected by learning loss, it is not possible to say (with any degree of confidence) how much learning may have been lost as a result of the pandemic, even on average.
Although the evidence that has emerged from attainment data studies is important and useful, it is still limited in what it can tell us. We currently rely mainly upon primary school assessments conducted during the autumn term of 2020, which is methodologically problematic for a variety of reasons (see report 3). Furthermore, the various studies do not always agree over the presence of effects, let alone over the size of effects. Moreover, all of the studies attempt to quantify how far students appear to be behind in their learning – often estimated in terms of months lost – yet this is not necessarily the same as how much learning has actually been lost, nor how long students might take to catch up, which is ultimately what we need to know.
Virtually withdrawn students
Although it seems safe to conclude that the most prominent cause of lost learning during the pandemic was having learnt less effectively, rather than having spent less time studying, it is still possible that some students may have spent very substantially less time studying than they would have done had the pandemic not struck. The risk of spending less time studying would seem to have been highest when students were expected to be learning from home. Hence the idea of the virtually withdrawn student – the student who failed to engage with remote learning, for shorter or longer periods of time. It seems likely that disengaging may have been much easier to do without being noticed whilst working (or not working) remotely. We do not know how many virtually withdrawn students there might have been in England during Phase 1 or Phase 3 of the pandemic. However, there is evidence to suggest that some students were not engaging with learning (see report 2) so we need to take seriously the possibility that significant numbers of students might fall into this category.
Localised disruption
One of the major themes of the pandemic has been that certain regions were worse affected than others. This began during October 2020, when tiering arrangements were introduced to help stop the spread of the pandemic. During Phase 2 of the pandemic, the dominant learning loss narrative concerned students from certain regions of England – particularly in the north – whose teaching and learning was being seriously disrupted. These regions experienced higher rates of infection, and higher rates of absence, and this prevented schools from returning to the new normal instructional delivery mode involving regular whole-class in-school tuition.
However, the idea of disruption being clustered by region was too simple, as there was far more variation across local authorities within each region than across regions. Moreover, some local authorities with high infection rates were also able to maintain high attendance rates.
We do know quite a lot about average attendance rates. We know that attendance rates were significantly down across all regions of England during the autumn term, and not just in the north. We also know that, on any particular day during the autumn term, the vast majority of students across England were in attendance. However, we do not have a great deal of evidence concerning how badly affected the worst affected schools were – let alone the worst affected classes in the worst affected schools – including what proportion of the autumn term such schools might have remained in this worst affected category (and therefore far removed from the anticipated new normal).
Differential disruption by region was only a particularly significant issue for teaching and learning during the autumn term. Schooling was obviously disrupted for all students during the two remote learning phases – before and after the autumn term – and differential infection rates caused far less disturbance during the second new normal phase.
None of this is intended to trivialise the serious disruption that some schools really did experience. It is simply to note that disruption of this sort seems to have been far more localised in both space and time than one might assume. [footnote 28]
Gender
It is unclear whether the pandemic has had significantly different effects on boys versus girls. Some reports identified gender effects in how students reacted to the pandemic, including different habits whilst studying remotely (Bayrakdar & Guveli, 2020; Pensiero et al, 2020), and different levels of anxiety at having to adjust to the new normal of schooling under the pandemic (for example, ImpactEd, 2021). Other studies identified mixed views over whether girls and boys had experienced different levels of learning loss. For example, almost two-fifths of respondents to a survey of teachers conducted by the NFER believed that boys had fallen further behind, compared with the majority who saw no difference (Sharp et al, 2020). Studies based on attainment data rarely commented on differences between girls and boys (see report 3).
Years 11 to 13
A particular problem for the present report was the relative lack of research and analysis focused specifically upon years 11 to 13. We do know that upper secondary school students missed significantly more sessions than lower secondary school students, as a consequence of greater susceptibility to the virus (for example, Bibby et al, 2021). But it is not clear whether or not this would have translated directly into greater learning loss. On the one hand, we might expect upper secondary school students to have superior meta-learning skills, and to be better equipped to study effectively when forced to study at home. On the other hand, a study by ImpactEd (2021) concluded that key stage 4 students were the most likely of all key stages to say that they were unable to get sufficient support with their work from their parents or carers whilst at home (support that they would normally have been able to get from their teachers). Indeed, this study suggested that key stage 4 students reported experiencing learning during the pandemic as particularly challenging – more so than students in all other key stages including key stage 5 – and that this was true during both Phase 1 (remote learning) and Phase 2 (new normal). This study alerts us to the possibility that year 11 students might have been affected quite differently, on average, from year 13 students.
Colleges
As noted earlier, with the exception of reports on Ofsted interim visits during the autumn term, we located very little research or analysis focused specifically upon colleges’ or college students’ experiences of learning during the pandemic. Although studies occasionally reported feedback from FE college students alongside other students (for example, Yeeles, et al, 2020) we have relatively little insight into whether circumstances for these students may have differed significantly. The same can be said for students on vocational courses, more generally, as well as for apprentices (although see Doherty & Cullinane, 2020, for an important exception). Having said that, two surveys conducted with members of the Association of Colleges – during April 2020 and April 2021 respectively – do provide important insights (see Association of Colleges, 2020; Association of Colleges, 2021).
The first report painted a relatively positive picture of how colleges were able to respond to the challenges of remote learning during Phase 1 of the pandemic. For instance: 70% of colleges had scheduled online lessons for the majority of subjects; 85% were setting work with marking and feedback for the majority of subjects; and 91% were making materials available via a website or email for the majority of subjects. Likewise, 63% of colleges reported that the majority, or all, timetabled lessons or activities were being undertaken remotely by students aged under 19.
On the other hand, 10% of colleges reported that less than half of all planned learning hours were being undertaken remotely by students aged under 19. Engagement was particularly challenging for practical subjects such as catering, sciences and trades, as well as for creative subjects like performing arts.
The second report also painted a relatively positive picture of how colleges continued to respond, this time with a focus on Phase 3 of the pandemic. Now: 85% of colleges reported delivering at least three-fifths of lessons live and online; 100% reported setting work with marking and feedback; and 96% reported making materials available via a website or email.
This survey also explored perceived impacts on learning. Almost all colleges responded that ‘lost learning’ was having at least a ‘medium’ impact on 16-18 students, and 47% reported that it was having either a ‘large’ or a ‘very large’ impact. 77% of colleges reported that 16-18 students were performing below expectations, on average, in comparison to the same point in a normal academic year. Of these colleges, 75% said that 16-18 students were between 1 month and 4 months behind.
Again, students were reported to have experienced greater challenges in certain subject areas. Engineering, construction, hair and beauty, English, and maths were identified as being in greatest need of catch-up support. The survey also noted that ESOL and SEND students had found it harder to engage remotely.
Attainment by the end of the 2020 to 2021 academic year
We will now consider implications of the foregoing discussion for likely patterns of attainment by the end of the 2020 to 2021 academic year. Attainment is shorthand for the learning that has occurred in a particular subject area, that is, the knowledge and skills that have been acquired. Roughly speaking, students with the same overall level of attainment in a subject area will have mastered the same body of knowledge and skills to the same extent.[footnote 29] The function of a grade, during normal times, is to represent the overall level of attainment achieved by a student in a subject area: higher grades indicating higher overall levels of attainment. So, when we talk about results rising or falling over time at the national level, for instance, we are actually talking about (average) overall attainment levels rising or falling over time. In other words, during normal times, result trends directly mirror attainment trends – that is their job.
However, because of the way that the assessment process is configured this year – which is explained in detail in the following section – we would not expect result trends to mirror attainment trends directly. So, we need to consider attainment patterns and result patterns separately. The following section considers result patterns in summer 2021, whilst the remainder of the present section focuses upon attainment patterns.
We have concluded that most students are likely already to have been affected by a certain amount of learning loss, including students in years 11 to 13. Given the scale of disruption that students will have experienced by summer 2021, it seems likely that the majority will end up having suffered a net learning loss by then, even allowing for a certain amount of catch-up. Having said that, a March 2021 survey of NASUWT members in England suggested that this assumption may not be universally shared (Open Data Institute, 2021). Responding to a prompt that asked ‘how many of the pupils you teach have lost ground academically in the subject(s) you teach over the last 12 months?’ only 59% of respondents agreed that ‘about half the class’ or more had lost ground, which implies that the remainder believed that less than half the class had lost ground.[footnote 30]
Nation
On balance, the evidence seems to suggest that most students are likely to have been affected by a certain amount of learning loss, including students in years 11 to 13 in the lead up to their assessments. If so, then (average) overall attainment levels will be down, nationally, by the end of the 2020 to 2021 academic year, across subjects and across qualification types.
Of course, this deduction could be wrong. It might, for instance, be the case that the national cohort of A level students really knuckled down during the pandemic, meaning that overall levels of attainment were actually up, on average, by summer 2021. Unfortunately, we do not have sufficient evidence to be certain either way. However, given the scale of disruption that all students have experienced over the past year or so, a net average learning loss does seem to be the most likely outcome, even at key stage 5.
Groups
The evidence suggests that socioeconomically disadvantaged students are likely to have been disproportionately affected by learning loss – at least on average. If so, then (average) overall attainment levels will be down, disproportionately, for disadvantaged students. Again, not all disadvantaged students will have been disproportionately affected, so we should not overclaim this conclusion.
It also stands to reason that group membership categories that correlate with disadvantage – which might include ethnicity or qualification type – are also likely to be associated with disproportionate drops in (average) overall attainment levels. We might, for instance, hypothesise that attainment levels will be disproportionately lower for students from certain ethnic groups by the end of the 2020 to 2021 academic year. However, there is no strong basis for estimating the likely size of any such effect.
Because highly advantaged students are substantially overrepresented within certain school types, for example, independent schools, it is likely that students from these schools will have been less seriously affected by the pandemic, on average. We might therefore hypothesise that (average) overall attainment levels will be disproportionately higher for independent school students by the end of the 2020 to 2021 academic year, compared with state school students.
It is also possible that (average) overall attainment levels might be disproportionately lower for lower-attaining students. Indeed, for A level at least, it is conceivable that attainment levels might simultaneously rise for A* grade students (who managed to knuckle down during the pandemic in an attempt to secure their futures), whilst falling for E grade students (who found themselves struggling more frequently). We do not have a great deal of evidence on learning during the pandemic for students in key stage 5, so this is merely an illustration of a possible scenario that could, in theory, arise.
Finally, there is evidence to suggest that students from certain areas are likely to have been disproportionately affected by learning loss. Although we have explained that this is best understood locally rather than regionally, the evidence suggests there might well be regional effects – on average – if the frequency of local disruptions proved to be higher in certain regions than in others. As there does seem to be evidence of this, it may be the case that overall levels of attainment will be disproportionately lower for certain regions, particularly where there may have been interactions between infection rates and disadvantage levels.
If attainment levels turn out to be disproportionately lower by the end of the 2020 to 2021 academic year for students from disadvantaged backgrounds, then it stands to reason that longstanding disadvantage gaps will also have widened. In this context, what we mean by a disadvantage gap is a difference in (average) overall attainment levels between students who are more advantaged and students who are less advantaged.[footnote 31] There is evidence of disproportionate learning loss for FSM-eligible year 2 students, in both reading and maths, which has been interpreted explicitly in terms of widening disadvantage gaps (Rose et al, 2021). Indeed, Weidmann et al (2021) investigated disadvantage gap widening directly, and found evidence of substantial widening for primary school students in maths, although not in reading.
Evidence is also beginning to emerge of gaps that are widening because of an interaction between generic disadvantage-related factors and specific group-membership-related factors. For example, Feyisa Demie has reported evidence of gaps widening for English as an Additional Language (EAL) students. These students have had to deal with both generic challenges such as lack of access to technology, and specific challenges such as lack of access to one-to-one support in improving English proficiency.[footnote 32]
Although it stands to reason that disadvantage gaps will widen if students from disadvantaged backgrounds lose relatively more learning in the wake of the pandemic, one contrary finding is worthy of mention. This comes from the first Renaissance study from the USA, which reported small differential impacts for students of certain ethnic backgrounds, without a commensurate widening of attainment gaps. Commenting on the paradox this seemed to raise, Vice President Gene Kerns reflected:[footnote 33]
This is primarily a matter of scale. Experiencing a drop of 1–2 additional percentile ranks isn’t definitively significant when we acknowledge the much larger scale of the gaps that already existed. In essence, the COVID-19 Slide is, so far, a comparatively small addition to a much larger problem.
In other words, the gap widening seemed too small, at that point in time, to be considered significant, particularly given how wide the gaps were prior to the pandemic. In fact, the second Renaissance study, reported in April 2021, identified much larger differential impacts, which did seem to indicate a significant widening of attainment gaps. However, an important point remains: although attainment gaps are likely to widen as a consequence of the pandemic to an extent that might be statistically significant, the critical issue is how far they end up widening, and this is not at all clear yet.
Individuals
Table 3 demonstrated that even students from very similar backgrounds, registered in the same class at the same school, might end up experiencing quite different levels of learning loss, depending on the particular circumstances of their learning during the pandemic. This reminds us that the pandemic will have affected students in all sorts of idiosyncratic ways, and we cannot be confident in predicting the degree of impact that they will have experienced on the basis of their membership of any particular group or groups. We should be especially aware of students whose motivation to learn might have taken a serious hit for one reason or another, causing them to lose a serious amount of learning, for example, virtually withdrawn students.
Results in summer 2021
If exams were to have run exactly as normal in 2021 – given what we have safely concluded about learning loss (and gain) in the wake of the pandemic – we would have deduced from the evidence reviewed that:
- many students would be awarded grades that were lower than they would have achieved had COVID-19 never occurred (owing to general learning loss)
- many students would rank within each subject exam cohort quite differently than they would have ranked had COVID-19 never occurred (owing to differential learning loss)
- attainment gaps between aggregated results for various groups of students (based on socioeconomic status, school type, ethnicity, and so on) would widen
This is essentially a summary of the attainment patterns that were identified in the preceding section.
However, exams were cancelled, and because of the way that the assessment process was reconfigured for this year, to help mitigate the impact of the pandemic on learning, there will be no direct mapping between attainment and results. In the following subsections, we explain why, and then tease out implications.[footnote 34]
Attainment versus results
Following the cancellation of exams, it was decided that grades would be awarded on the basis of teacher assessment judgements in summer 2021. Students would be assessed on the basis of what they had learned, rather than on the more ambiguous notion of the potential that they might have shown prior to the pandemic.[footnote 35] This meant that teachers were required to assess students on the basis of their demonstrated knowledge and skills, just as in normal times. Indeed, it was decided that they should be judged according to essentially the same qualification standard as they would normally be judged against.
However, one important exception was specified, which was that students should only be assessed on content that they had been taught, whether in the classroom or via remote learning. This was intended to mitigate the impact of the pandemic on learning for schools in areas that had been badly affected, those which appeared not to be on target to cover all of the content for the qualifications that were being studied.
This content coverage concession embodied the idea that the expected quality of performance for any grade, in any subject, would not change. However, students would only need to demonstrate that quality of performance on content that they had been taught. Therefore, their grade would not be dragged down by not being able to demonstrate the same quality of performance on content that had not been taught.
During normal times, the grade that a student is awarded tells us the overall level of attainment that they have achieved. In other words, we can broadly assume that students who have been awarded the same grade (in a particular qualification) will have mastered the same body of knowledge and skills to the same extent. This year, however, for each of the available grades, some students will be awarded their grade despite not having learned as much as would normally be required for that grade, owing to the content coverage concession. This means that, for 2021, there is a distinction between the overall level of attainment achieved by a student and the result that they are awarded. Some students will be awarded a grade that corresponds to a higher overall level of attainment than they will actually have achieved, so as not to penalise them for not being able to cover a certain amount of content.
During normal times, the grade that a student is awarded tells us the overall level of attainment that they have achieved. In other words, we can assume that students who have been awarded the same grade (in a particular qualification) will have mastered the same body of knowledge and skills to the same extent. This year, however, some students will be awarded each grade despite not having learned as much as would normally be required for that grade, owing to the content coverage concession. This means that, for 2021, we need to draw a distinction between the overall level of attainment achieved by a student and the result that they are awarded. In summer 2021, some students will be awarded a grade that corresponds to a higher overall level of attainment than they will actually have achieved, having not been penalised for failure to cover a certain amount of content.
Nation
To the extent that schools across England were unable to teach all of the content that would normally be taught in advance of the summer exams season, overall attainment levels will fall, nationally, in 2021. Yet, the content coverage concession helps to compensate for this, meaning that we should not expect to see an equivalent drop in results at the national level.
Schools
Two classes of students with essentially the same profile of ability – who were studying for the same qualification in different areas of England – might end up with the same distribution of grades in summer 2021, despite one having lower (average) overall attainment levels as a result of not having been taught all of the qualification content. This is the content coverage concession in action. It means that students who demonstrate the same quality of performance (either on the reduced content or on the full content) will be awarded the same grade.
Individuals
The content coverage concession helps to level the playing field between schools that have experienced different circumstances during the pandemic, which prevented them from being able to teach the same amount of qualification content. However, it does not directly help to level the playing field between students from the same class who have experienced different circumstances during the pandemic, which prevented them from being able to learn the taught content as effectively as each other. Teachers have been asked to assess all students within each class on the same basis, as far as possible, including using consistent sources of evidence. They should only depart from this principle in exceptional circumstances.[footnote 36]
We noted earlier that most students were studying under less than ideal circumstances during the pandemic, although some studied under extremely unfavourable ones. Presumably, students who studied under extremely unfavourable home learning circumstances would have learned less effectively than students who studied under more favourable circumstances, particularly during periods of remote learning in Phase 1 and Phase 3.
Although the official guidance provides some flexibility for individual students within a class, in exceptional circumstances, on the basis that they have lost additional study time, it does not permit compensation for less effective learning. Therefore, students studying under extremely unfavourable circumstances are likely to receive grades that reflect this differential learning loss. It seems reasonable to assume that they would end up being located lower in their ‘class ranking’ in summer 2021 than they would have been located if the pandemic had never occurred. Although the correlation that we normally see between attainment and socioeconomic disadvantage might mitigate (or conceal) this to some extent, we might still expect the results gap between higher and lower attaining students to widen somewhat.
To have completely counteracted effects such as these – attributable to differential learning loss within classes – we would have had to have asked teachers to award each of their students the grade that they would have achieved if the pandemic had never occurred. Apart from this approach being somewhat contestable on ethical grounds, it was not possible to identify a method for estimating grades that would have been sufficiently rigorous to be judged credible. As noted at the outset, a judgement of this sort represents a counterfactual, which is ultimately unknowable.
Groups
We concluded on the basis of our literature reviews that socioeconomically disadvantaged students were likely to have been disproportionately affected by learning loss. If disadvantaged students are likely to experience relatively more learning loss – even amongst their classmates – then these effects will also be seen in aggregated results. The implication is that result (disadvantage) gaps are likely to widen in summer 2021, although not to the same extent as attainment (disadvantage) gaps widen, and less than if the content coverage concession had not been introduced.
References
Andrew, A., Cattan, S., Costa-Dias, M., Farquharson, C., Kraftman, L., Krutikova, S., Phimister, A. & Sevilla, A. (2020). Family Time Use and Home Learning During the COVID-19 Lockdown. IFS Report R178. London: lnstitute for Fiscal Studies.
Association of Colleges (2020). Covid-19 and Colleges: AoC’s early summer survey. London: Association of Colleges.
Association of Colleges (2021). College Catch-Up Funding and Remote Education: AoC survey and policy proposal. London: Association of Colleges.
Azevedo, J.P., Hasan, A., Goldemberg, D., Iqbal, S.A. & Geven, K. (2020). Simulating the Potential Impacts of Covid-19 School Closures on Schooling and Learning Outcomes: A set of global estimates. June 2020 Conference Edition. Washington, DC: World Bank Group.
Bayrakdar, S. & Guveli, A. (2020). Inequalities in Home Learning and Schools’ Provision of Distance Teaching During School Closure of COVID-19 Lockdown in the UK. Essex: University of Essex Institute for Social and Economic Research.
Benzeval, M., Borkowska, M., Burton, J., Crossley, T.F., Fumagalli, L., Jäckle, A., Rabe, B. & Read, B. (2020). Understanding Society COVID-19 Survey April Briefing Note: Home schooling. Essex: University of Essex Institute for Social and Economic Research.
Bibby, D., Plaister, N., & Thomson, D. (2021). How Much School Did Year 11 Miss in the Autumn Term? FFT Education Datalab Blog, 23 March.
Bielinski, J., Brown, R., & Wagner, K. (2021). No Longer a Prediction: What new data tell us about the effects of 2020 learning disruptions. Irvine, CA: Illuminate Education.
Bjork, R.A. & Bjork, E.L. (1992). A new theory of disuse and an old theory of stimulus fluctuation. In A. Healy, S. Kosslyn, & R. Shiffrin (Eds.). From Learning Processes to Cognitive Processes: Essays in honor of William K. Estes (Vol. 2, pp.35-67). Hillsdale, N.J.: Erlbaum.
Blainey, K. & Hannay, T. (2021). The impact of school closures on spring 2021 attainment – interim paper. London: RS Assessment from Hodder Education.
Burgess, S., Thomson, T., Plaister, N. & Nye, P. Pupils in the Poorest Areas of the Country are Missing the Most Schooling. FFT Education Datalab Blog, 30 October.
Cattan, S., Farquharson, C., Krutikova, S., Phimister, A., Salisbury, A. & Sevilla, A. (2021). Inequalities in Responses to School Closures Over the Course of the First COVID-19 Lockdown. London: Institute for Fiscal Studies.
Children’s Commissioner (2020). School Attendance Since September: Briefing December 2020. London: Children’s Commissioner for England.
CREDO (2020). Estimates of Learning Loss in the 2019-2020 School Year. Stanford, CA: The Center for Research on Education Outcomes Stanford University.
Crenna-Jennings, W. (2018). Education in England: Annual Report 2018. Key drivers of the disadvantage gap: Literature review. London: Education Policy Institute.
Curriculum Associates (2020). Understanding Student Needs. North Billerica, MA: Curriculum Associates.
Doherty, K. & Cullinane, C. (2020). COVID-19 and Social Mobility Impact Brief #3: Apprenticeships. London: The Sutton Trust.
Dorn, E., Hancock, B., Sarakatsannis, J., & Viruleg, E. (2020). COVID-19 and Learning Loss—Disparities Grow and Students Need Help. McKinsey & Company Blog, 8 December.
Edge Foundation (2020).The Impact of Covid-19 on Education A summary of evidence on the early impacts of lockdown. London: The Edge Foundation.
Education Endowment Foundation (2020). Impact of School Closures on the Attainment Gap: Rapid evidence assessment. London: Education Endowment Foundation.
Eivers, E., Worth, J. & Ghosh, A. (2020). Home Learning During Covid-19: Findings from the Understanding Society Longitudinal Study. Slough: National Foundation for Educational Research.
Elliot Major, L. Eyles, A. & Machin, S. (2020). Generation COVID: emerging work and education inequalities. A CEP Covid-19 analysis. London: LSE Centre for Economic Performance.
EmpowerK12 (2020). COVID-19’s Impact on Student Achievement and Academic Growth in DC. Washington, DC: EmpowerK12.
Engzell, P., Frey, A., & Verhagen, M. (2021). Learning Loss Due to School Closures During the COVID-19 Pandemic. Working Paper.
Eyles, A., Gibbons, S. & Montebruno, P. (2020). Covid-19 School Shutdowns: What will they do to our children’s education? A CEP Covid-19 analysis. London: LSE Centre for Economic Performance.
Gore, J., Fray, L., Miller, A., Harris, J. & Taggart, W. (2021). The impact of COVID‑19 on student learning in New South Wales primary schools: an empirical study. The Australian Educational Researcher. Online first.
Gratz, M. & Lipps, O. (2021). Large loss in studying time during the closure of schools in Switzerland in 2020. Research in Social Stratification and Mobility, 71.
Green, F. (2020). Schoolwork in Lockdown: new evidence on the epidemic of educational poverty. London: UCL Institute of Education Centre for Learning and Life Chances in Knowledge Economies and Societies.
Hattie, J. (2020). Visible Learning Effect Sizes When Schools Are Closed: What matters and what does not. Distance Learning, Visible Learning, 14 April.
ImpactEd (2021). Lockdown Lessons: Pupil learning and wellbeing during the Covid-19 pandemic. London: ImpactEd.
JCQ (2021). JCQ Guidance on the determination of grades for A/AS Levels and GCSEs for Summer 2021: processes to be adopted by exam centres and support available from awarding organisations. Updated: 19/04/2021. London: Joint Council for Qualifications.
Julius, J. & Sims, D. (2020). Schools’ Response to Covid-19: Support for vulnerable pupils and the children of keyworkers. Slough: National Foundation for Educational Research.
Kogan, V., & Lavertu, S. (2021). The COVID-19 Pandemic and Student Achievement on Ohio’s Third-Grade English Language Arts Assessment*. Columbus, OH: Ohio Department of Education, 3–11.
Kuhfeld, M., Soland, J., Tarasawa, B., Johnson, A., Ruzek, E., & Liu, J. (2020). Projecting the Potential Impacts of COVID-19 School Closures on Academic Achievement. EdWorkingPaper No. 20-22. Providence, RI: Annenberg Institute at Brown University.
Montacute, R. & Cullinane, C. (2021). Learning in Lockdown. London: The Sutton Trust.
Müller, L. & Goldenberg, G. (2020). Education in Times of Crisis: The potential implications of school closures for teachers and students. London: Chartered College of Teaching.
Nelson, J., Andrade, J. & Donkin, A, (2021). The impact of Covid-19 on schools in England: experiences of the third period of partial school closures and plans for learning recovery. Slough: National Foundation for Educational Research.
No More Marking (2020). Assessing Secondary Writing. Writing attainment in year 7, September 2020. Impact Analysis. Summary Report. Durham: No More Marking Ltd.
Nye, P., Thomson, D., Plaister, N. & Burgess, S. (2020). New Attendance Figures Paint a Worrying Picture of Mass Absences. FFT Education Datalab Blog, 15 December.
OECD (2021). The state of School Education: One year into the COVID pandemic. Paris: Organisation for Economic Co-operation and Development.
Ofqual (2021). Information for heads of centre, heads of department and teachers on the submission of teacher assessed grades: summer 2021. Ofqual/21/6778/1. April 2021. Coventry: Office of Qualifications and Examinations Regulation.
Ofsted (2020a). COVID-19 series: briefing on schools, September 2020. London: Office for Standards in Education.
Ofsted (2020b). COVID-19 series: briefing on schools, October 2020. London: Office for Standards in Education.
Ofsted (2020c). COVID-19 series: briefing on schools, November 2020. London: Office for Standards in Education.
Open Data Institute (2021). Data on Teachers’ Lives During the Pandemic. London: Open Data Institute.
Pallan, M., Adab, P., Clarke, J., Duff, R., Ema Frew, E., Lancashire, E., Mason, F., Murphy, M. (2021). Impacts of the first COVID-19 lockdown on learning, health behaviours and mental wellbeing in young people aged 11-15 years. Birmingham: University of Birmingham Institute of Applied Health Research.
Penington, E. (2020). The numbers behind homeschooling during lockdown. News Item, 11 June.
Pensiero, N., Kelly, A. & Bokhove, C. (2020). Learning Inequalities During the Covid-19 Pandemic: how families cope with home-schooling. Southampton: University of Southampton.
Renaissance (2020). How Kids Are Performing: Tracking the impact of COVID-19 on reading and mathematics achievement. Wisconsin Rapids, WI: Renaissance.
Renaissance (2021). How Kids Are Performing: Tracking the midyear impact of COVID-19 on reading and mathematics achievement. Wisconsin Rapids, WI: Renaissance.
Renaissance Learning & Education Policy Institute (2021). Understanding progress in the 2020/21 academic year. Interim findings. London: Department for Education.
Roberts, N. & Danechi, S. (2020). Coronavirus and Schools: FAQs. House of Commons Library Briefing Paper, 14 December.
Roberts, N. & Danechi, S. (2021a). Autumn Term 2020: How Covid-19 affected England’s state-funded schools. House of Commons Library Insight, 8 March.
Roberts, N. & Danechi, S. (2021b). Spring Term 2021: How Covid-19 affected England’s state-funded schools. House of Commons Library Insight, 13 April.
Rose, S., Twist, L., Lord, P., Rutt, S., Badr, K., Hope, C. & Styles, B. (2021). Impact of school closures and subsequent support strategies on attainment and socio-emotional wellbeing in Key Stage 1: Interim Paper 1. London: Education Endowment Foundation.
RS DELVE Initiative (2020). Balancing the Risks of Pupils Returning to Schools. Working Paper, 24 July.
Sharp, C., Nelson, J., Lucas, M., Julius, J., McCrone, T. & Sims, D. (2020). The Challenges Facing Schools and Pupils in September 2020. Slough: National Foundation for Educational Research.
Sibieta, L. & Cottell, J. (2020). Education and Policy Responses Across the UK to the pandemic. London: Education Policy Institute.
Sibieta, L. & Cottell, J. (2021). Education Reopening and Catch-up Support Across the UK. London: Education Policy Institute.
Sibieta, L. (2020). School Attendance Rates Across The UK Since Full Reopening. London: Education Policy Institute.
Soderstrom, N.C. & Bjork, R.A. (2015). Learning versus performance: an integrative review. Perspectives on Psychological Science, 10(2), 176–199.
Spielman (2020). HMCI Commentary: findings from visits in November. Ofsted Authored Article, 15 December.
The Times (2020). GCSE pupils ‘need help’. The Times, 5 November.
von Hippel, P.T. (2019). Is Summer Learning Loss Real? How I lost faith in one of education research’s classic results. Education Next, 19 (4).
Weidmann, B., Allen, R., Bibby, D., Coe, R., James, L., Plaister, N. & Thomson, D. (2021). Covid-19 Disruptions: Attainment gaps and primary school responses. London: Education Endowment Foundation.
Wiliam, D. (2020). COVID-19 Learning Loss: What We Know and How to Move Forward. Education Week, 31 August.
Yeeles, P., Baars, S., Mulcahy, E., Shield, W. & Mountford-Zimdars, A. (2020). Assessing the early impact of school and college closures on students in England. London: The Centre for Education & Youth.
Endnotes
-
See ‘Letter from Rt Hon Gavin Williamson to Dame Glenys Stacey’ (12 October 2020). ↩
-
See ‘Letter from Rt Hon Gavin Williamson to Dame Glenys Stacey’ (2 December 2020). ↩
-
See announcement ‘How qualifications will be awarded in 2021’ (25 February 2021). ↩
-
The present report will generally use the term ‘school’ rather than repeating ‘school and college’ throughout, except where important distinctions need to be drawn. Unfortunately, we did not locate a great deal of research or analysis focused specifically upon colleges’ or college students’ experiences of learning during the pandemic. Important insights into the experiences of Further Education and Skills providers during the autumn term can be found in Ofsted’s reports on interim visits conducted during October and interim visits conducted during November. ↩
-
See “Lockdown learning ‘made me feel a lot more confident’” on the BBC website (14 April 2021). ↩
-
Imagine that three-fifths of all students in the north-west experienced substantially more learning loss than the average student in England. On this basis, it might be entirely correct to say that the north-west was the worst affected region. However, grading all students from the north-west more leniently would not necessarily represent a fair solution. For instance, it might also be true that one-fifth of all students in the north-west experienced substantially less learning loss than the average student in England, while one-fifth of all students in the south-west experienced substantially more. As such, even if a large proportion of students in the north-west really were amongst the worst affected in the country (and would therefore deserve to be compensated) there would still be a substantial proportion who were not (and would not). At the same time, the substantial proportion of students in the south-west who really were amongst the worst affected in the country would receive no compensation. ↩
-
CREDO used standard deviations (std) to measure differences between students in terms of how much they had learned. Based upon evidence that .10 of a std equates to about 58 days of learning across a 180 day school year, 0.31 of a std would equate to being almost a year behind. ↩
-
This was the Understanding Society COVID-19 survey of adults that was administered in late April. ↩
-
See, for example, BBC Newsround coverage, ‘Homeschooling: Fifth of pupils doing an hour or less of work every day’ (16 June 2020). ↩
-
These figures were consistent with analyses of the same question by Benzeval et al (2020), and Penington (2020). ↩
-
Even this is not entirely straightforward. For instance, it requires us to assume that those students who were set no work by their school were therefore doing no schoolwork, which is not necessarily true. ↩
-
Francis Green (personal communication) very kindly conducted a new analysis, restricted to students aged 11 to 14, which returned a figure of 8.4%. A recently published survey of 11- to 15-year-olds, conducted June to July 2020, also supports a figure in this range. According to Pallan et al (2021), approximately 10% of students reported spending less than an hour on schoolwork (set by their school) during an average weekday in lockdown, while more than half were spending at least 4 hours. ↩
-
See ‘Weekly Influenza and COVID-19 Surveillance graphs’, page 31 (30 December 2020). ↩
-
See ‘The end of home learning’ (5 March 2021). ↩
-
See ‘Looking back on the lockdown term’ (19 February 2021). ↩
-
See ‘Survival mode’ (5 February 2021). ↩
-
See ‘Home-school… is it working?’ (15 January 2021). ↩
-
See ‘YouGov Results – Homeschooling’ (3 March 2021). ↩
-
See ‘Building Back Better’ on the Commission website (17 February 2021). ↩
-
We have assumed that there are roughly 69 traditional teaching weeks across years 10 and 11. Technically, there are 78 weeks of schooling across 2 years of compulsory education (2 x 39). However, we have subtracted 9 weeks from this total, bearing in mind that the GCSE exam period typically begins during the middle of May. We have overlooked INSET days and any additional exam leave prior to mid-May. So, this is probably a slight overestimate of the total number of teaching weeks across a two-year period. However, this overestimate may be slightly offset by the fact that some students might be studying for another 2 weeks at the end of May because, this year, students’ work completed up until the end of May could potentially count towards their teacher assessed grades. This may vary across schools though, depending on when they finalise their teacher assessed grades for submission. For example, DfE’s ‘Schools coronavirus (COVID-19) operational guidance’ states that, ‘The 2021 exams approach requires schools to submit grades by 18 June 2021. This process requires considerable staff resource and we recognise that in practice, for many pupils, work done after the May half term will not contribute towards their grades.’ ↩
-
In the USA, a grade is a year group. Fifth grade equates to Year 6 in England, tenth grade to Year 11. K refers to Kindergarten. ↩
-
More worrying messages emerged from this research when they broke their overall analyses down by subgroup. This revealed that certain groups were substantially below pre-pandemic Fall to Winter growth expectations in both reading and maths, including Black or African American, and Students with Disabilities. This meant that they were now further behind expectations than they had been in the Fall, compared with other groups including White students (who were now less far behind). ↩
-
See ‘Baseline Secondary Writing: have Year 7 pupils gone backwards?’ (20 October 2020). ↩
-
See ‘The end of home learning’ (5 March 2021). ↩
-
In reality, it is not at all clear how much of this effect was spurious and how much was genuine, as discussed in more detail in report 3. However, making this assumption helps us to illustrate a more general point concerning the interpretation of evidence from large-scale attainment datasets. ↩
-
Equally, though, this localisation argument in no way rules out the possibility that regions may still differ, on average, in terms of the overall impact of the pandemic on teaching and learning. ↩
-
They might well demonstrate a different profile of strengths and weaknesses across the various content elements. But, on average, they will have mastered the subject area to the same extent. ↩
-
Responses to this prompt differed across independent and state school respondents (35% versus 61%), and across secondary and primary school respondents (57% versus 63%), and there were interesting differences between respondents across regions (eg, 52% south-east versus 76% north-east). See ‘Data on teachers’ lives during the pandemic’ survey analysis tool. ↩
-
This distinction is often operationalised by comparing groups of students who are eligible for Free School Meals (FSM) with groups of students who are not, although FSM is merely a proxy for a far more complex and nuanced distinction (Crenna-Jennings, 2018). ↩
-
See BERA blog by Feyisa Demie, ‘The impact of school closures on pupils with English as an additional language’ (16 April 2021). ↩
-
See ‘What most people don’t realize about the COVID-19 Slide’ (22 January 2021). ↩
-
The following subsections set out expectations concerning results in summer 2021. They are essentially plausible hypotheses at this stage. However, it is important to stress that these scenarios are based on the assumption that results are awarded exactly in line with high level policy decisions concerning the approach to assessment in 2021. Considering the extremely challenging circumstances under which this new and untested approach is being rolled out, it is not unreasonable to expect the prevalence of assessment error to be somewhat higher in 2021 than in normal times, even with quality assurance procedures in place. ↩
-
The approach to grading students in summer 2021 is set out in guidance from Ofqual (eg, Ofqual, 2021) and the Joint Council for Qualifications (eg, JCQ, 2021). ↩
-
The JCQ guidance put it like this: “For most students, consistency in the use of evidence is expected, and a differentiated approach is not warranted. In cases where students have experienced significant disruption, however, some flexibility may be required.” (JCQ, 2021, p.21). ↩