Learning during the pandemic: quantifying lost learning
Published 12 July 2021
Applies to England

© Crown copyright 2021
This publication is licensed under the terms of the Open Government Licence v3.0 except where otherwise stated. To view this licence, visit nationalarchives.gov.uk/doc/open-government-licence/version/3 or write to the Information Policy Team, The National Archives, Kew, London TW9 4DU, or email: psi@nationalarchives.gov.uk.
Where we have identified any third party copyright information you will need to obtain permission from the copyright holders concerned.
This publication is available at https://www.gov.uk/government/publications/learning-during-the-pandemic/learning-during-the-pandemic-quantifying-lost-time--2
Authors
Paul E. Newton, from Ofqual’s Strategy, Risk, and Research Directorate
With thanks to colleagues from
- Education Endowment Foundation
- Education Policy Institute
- GL Assessment
- Juniper Education
- National Foundation for Educational Research
- No More Marking
- Renaissance Learning
- RS Assessment from Hodder Education
- SchoolDash
Executive summary
This report reviews research and analysis that has attempted to quantify learning loss in England since the beginning of the pandemic, on the basis of attainment data from commercially developed assessment instruments or systems. We identified 10 such studies, all but 1 of which analysed data from the autumn term. Only 3 studies provided data for secondary school students; none presented results for students from year 10 or above.
Evidence from these 10 studies suggested that, when assessed during the autumn term of 2020:
- primary school students were generally a month or so behind expectations
- disadvantaged primary school students were disproportionately behind expectations
Beyond this, the evidence was somewhat mixed, although there was also some indication that:
- primary school students were further behind expectations in maths than in reading
- younger primary school students were further behind expectations than older ones
- some older primary school students were actually ahead of expectations in reading
- the extent of learning loss differed by region, although it was not the case that certain regions consistently appeared to be worse affected than others
The extent to which any of these conclusions can inform expectations concerning likely levels of learning loss for students from years 11 to 13 in summer 2021 is unclear. Evidence that outcomes for younger primary school students differed somewhat from outcomes for older primary school students should immediately alert us to risks of extrapolating from primary to secondary, let alone to upper secondary. In addition, we only have detailed insights from the autumn term, which is only a part of the story of learning during the pandemic in the run up to summer 2021.
On the other hand, primary and secondary school students have experienced similar kinds of disruptions over the past year or so, and it would not be unreasonable to expect them to have been affected in similar ways. It would therefore not be surprising if students from year 11 to 13 were also some way behind expectations, with disadvantaged students having experienced disproportionate learning losses.
Introduction
This report reviews research and analysis that has attempted to quantify learning loss in England since the beginning of the pandemic, on the basis of attainment data from commercially developed assessment instruments or systems. Studies of this sort have attempted to quantify learning loss directly, by comparing how well students were actually performing during the pandemic with expectations concerning how well they would have been performing if the pandemic had not struck.
For the purpose of this project, we defined learning loss (and gain) counterfactually, as the difference between the overall level of attainment that a student would have achieved by the end of their course of study – if they had not been affected by the pandemic – and the overall level of attainment that they actually achieved in its wake. Although the degree of learning loss experienced by any particular learner is therefore technically unknowable, it is still possible to estimate degree of impact, in a more general sense, by considering patterns in performances across attainment data. At least in theory, this is the best way to quantify learning loss.
At the time of writing the present report, only a small number of studies of this sort had been published in England. The studies that we identified are listed below, with a data collection period specified for each one:
- Renaissance Learning with Education Policy Institute (2021) – data from September or October 2020
- RS Assessment from Hodder Education with SchoolDash (2020) – data from September or October 2020
- RS Assessment from Hodder Education with SchoolDash (2021) – data from November or December 2020
- RS Assessment from Hodder Education with SchoolDash (2021) – data from March 2021
- National Foundation for Educational Research (2021) – data from November 2020
- GL Assessment (2021) – data from September or October 2020
- Education Endowment Foundation (2021) – data from September or October 2020, and November or December 2020
- Juniper Education (2021) – data from December 2020
- No More Marking (2020) – data from September 2020
- No More Marking (2020) – data from October and November 2020
All but one of these studies (study 4) analysed data from assessments that were conducted during the autumn term 2020.
At the beginning of the autumn term 2020, schools across England returned to whole-class in-school tuition, following an extended period of closure during the spring and summer terms. With many new coronavirus (COVID-19)-related restrictions in place, this was not a return to business as normal, as far as teaching and learning were concerned, but a return to a ‘new normal’ phase, especially as students would not necessarily be hitting the ground running, given the prior disruption.
In fact, many schools across England continued to experience considerable disruption during the autumn term, as infection rates began to rise – differentially across regions – and as both students and teachers were occasionally forced to self-isolate. Disruptions of this sort would clearly have affected student assessment during the autumn term, as well as teaching and learning. In particular, because different regions experienced their periods of greatest disruption at different times during the autumn term, this might have affected participation in the attainment data studies differentially too.
All of the studies listed above attempted to compare levels of attainment during autumn 2020 (or spring 2021 in the case of study 4) with benchmark data of one sort or another to provide an estimate of how much learning students appeared to have lost. For instance, schools that contributed to study 2 administered tests at the beginning of the autumn term, which were supposed to have been administered at the end of the summer term (had schools not been closed due to lockdown). In other words, year 6 students sat their end of year 5 test in September or October 2020. How well they performed on this test was compared to how well the previous cohort of students had performed. For example, their performance was compared with the performance of year 5 students from the 2018 to 2019 academic year, who had sat the test in summer 2019, prior to the pandemic.
Methodological challenges
Each of the studies took a slightly different approach to generating and comparing attainment data. These approaches are summarised below in Table 1. Before considering results from studies 1 to 10, we need to bear in mind certain key methodological challenges, as they significantly affect the confidence with which we can interpret results.
Comparability of samples
A particular problem for many of the studies was a lack of clarity concerning the comparability of the student samples that were being compared. For example, whether or not the groups being compared were basically the same, except for how they might have been affected by the pandemic. We will continue to use study 2 for illustrative purposes, here, to highlight challenges of this sort. Study 2 compared:
- test performances for students from the 2018 to 2019 year 5 cohort (tested in summer 2019, prior to the pandemic), and
- test performances for students from the 2019 to 2020 year 5 cohort (tested in early autumn 2020, when they were actually in year 6)[footnote 1]
Because large numbers of schools in England use these tests year-in-year-out, it was possible to analyse data from very many thousands of students. This provides some justification for believing that the two groups might be at least roughly comparable.
Although comparability of the student samples across years was not discussed in detail in the study 2 report, personal communication with its authors clarified that they had considered this potential threat. This threat was not a trivial, bearing in mind that many schools decided not to run these tests at the beginning of the autumn term. If, for instance, the schools that had decided not to participate tended to differ in certain ways from schools that had decided to participate, then this might have compromised the comparison. In particular, if the schools that failed to participate tended to be the ones that had been most severely affected by the pandemic (which might even help to explain their non-participation) then this might undermine the comparison; potentially underestimating how much learning had been lost. In fact, when the authors re-ran their analysis – restricting it only to schools that had contributed results for both the 2018 to 2019 cohort and the 2019 to 2020 cohort – they observed essentially the same results. So, this helps to boost confidence in the comparison.
In terms of quantifying learning loss, the bigger problem for this particular study concerned the 4-month time lag between when the 2019 to 2020 year 5 cohort should have been tested (at the end of year 5) and when they were actually tested (at the beginning of year 6). The aim of the analysis was to provide some insight into the nature and prevalence of learning loss that had occurred in year 5 owing to having studied during the spring and summer terms under lockdown conditions, including the possibility of differential effects across subjects or subgroups. However, as explained in the study 2 report, the additional gap before testing meant that there might also be an additional ‘learning loss’ effect due to forgetting during the summer holiday.[footnote 2] If this were true – and it seems likely to have been at least somewhat true – then the comparison might overestimate how much learning had actually been lost.
The authors of study 2 were able to overcome this comparability challenge in their follow up report. Study 3 involved a far more controlled comparison, between:
- test performances for students from the 2019 to 2020 year 5 cohort (tested in late autumn 2019, under normal conditions)
- test performances for students from the 2020 to 2021 year 5 cohort (tested in late autumn 2020, under ‘new normal’ conditions)
This comparison was direct, in the sense that the ‘pandemic cohort’ was tested at exactly the right time, meaning at the same time as the ‘pre-pandemic cohort’ (at the end of the term that the test had been designed to be used in). The authors were also able to confirm that this comparison was not seriously compromised by school dropout either; although there did appear to be some evidence of disproportionate attrition amongst the lowest attaining students.
As summarised in Table 1, each of the studies tackled its particular comparability challenges in its own way. Study 1 exerted the strongest control over comparability by comparing results over time for individual students. Study 7 also compared results over time for a common sample of students, although its analyses were narrower in scope.
Table 1. Summary of approaches to generating and comparing attainment data.
| Study | How were the data generated? | When were the data generated? | What were the data compared against? | How was the comparison controlled? |
|---|---|---|---|---|
| 1. Renaissance Learning with Education Policy Institute January 2021 Y3 to Y9 | Star Reading Assessment, Star Maths Assessment (both computer adaptive tests, taken in school). Often used as autumn baseline tests; also used throughout the year. | Test results from the first half of autumn term 2020 (September or October). | Predicted test results for the first half of autumn term 2020. They were predicted from students’ autumn term 2019 results, based on the general relationship between autumn term 2018 results and autumn term 2019 results (ie, for the previous cohort). | Analysis was restricted to a single group of students who had an actual result from autumn 2019 (from which a prediction was generated) and an actual result from autumn 2020. Comparison = actual progress vs. predicted progress (for each student). |
| 2. RS Assessment from Hodder Education with SchoolDash November 2020 Y1 to Y6 | Progress in Understanding Mathematics Assessment, Progress in Reading Assessment, Progress in Grammar, Punctuation and Spelling Assessment (all non-adaptive tests, generally paper based). Used at the end of each term. | Test results from the first half of autumn term 2020 (September or October). Treated as though they were the end of summer term 2020 tests (ie, taken about 4 months late). | Test results from the end of summer term 2019. | It was assumed that the group of students with results in autumn 2020 was broadly similar to the group of students with results in summer 2019; accepting that (i) the students were around 4 months older in the autumn term 2020, and (ii) they had just returned from their holidays. |
| 3. RS Assessment from Hodder Education with SchoolDash February 2021 Y1 to Y6 | [As above.] Progress in Understanding Mathematics Assessment, Progress in Reading Assessment, Progress in Grammar, Punctuation and Spelling Assessment (all non-adaptive tests, generally paper based). Used at the end of each term. | Test results from the second half of autumn term 2020 (November or December). | Test results from the second half of autumn term 2019 (November or December). | It was assumed that the group of students with results in 2020 was roughly equivalent, on average, to the group of students with results in 2019. |
| 4. RS Assessment from Hodder Education with SchoolDash May 2021 Y1 to Y6 | [As above.] Progress in Understanding Mathematics Assessment, Progress in Reading Assessment, Progress in Grammar, Punctuation and Spelling Assessment (all non-adaptive tests, generally paper based). Used at the end of each term. | Test results from the end of spring term 2021 (March), following the return to whole-class in-school tuition. | Test results from the end of spring term 2020 (March), preceding the switch to remote learning. | It was assumed that the group of students with results in 2021 was roughly equivalent, on average, to the group of students with results in 2020. |
| 5. National Foundation for Educational Research January 2021 Y2 | Autumn year 2 test papers from the NFER key stage 1 suite of assessments in reading and maths (2 papers for each subject). | Test results from the second half of autumn term 2020 (November). | NFER tests were nationally standardised in 2017, so results from 2020 could be compared directly with results from this nationally representative sample. | Results from 2020 were re-weighted to better approximate the nationally representative sample. |
| 6. GL Assessment February 2021 Primary and Secondary | Progress Test Series in maths, science and English (online or paper based tests). New Group Reading Test (computer adaptive test). NGRT for use termly. Progress Tests can used as autumn baseline tests, but typically used as end of year tests. | Test results from the first half of autumn term 2020 (September or October). Treated as though they were the end of summer term 2020 tests (ie, taken about 4 months late). | Test results from the end of summer term 2019 (May to July). | Differences in overall results between 2019 and 2020 were compared against differences in overall results between 2018 and 2019 (ie, using this as a kind of baseline). Schools were matched within each cohort to ensure comparability (although details of this process are not clear). |
| 7. Education Endowment Foundation May 2021 Y2 to Y6 | Progress in Understanding Mathematics Assessment, Progress in Reading Assessment, NTS Assessments (national test style) reading and maths papers (all non-adaptive tests, generally paper based). Used at end of each term. | Test results from the first half of autumn term 2020 (September or October). Test results from the second half of autumn term 2020 (November or December). | Test results from the second half of autumn term 2019 (November or December). | Data compared across three time points for the same sample of students; comparing standardised (standardised) test scores; computing attainment gaps between subgroups defined by FSM eligibility. |
| 8. Juniper Education February 2021 Y1 to Y6 | Progress tracking software. At the end of each term, teachers record whether each student is working at or above age related expectations (in relation to the national curriculum, generally). | Teacher assessment data from the end of autumn term 2020. | Teacher assessment data from the end of autumn term 2019. | Results aggregated for the same year group, as it moved from autumn 2019 (through summer 2020) to autumn 2020. It was assumed that the group of students with results in autumn 2020 was roughly equivalent, on average, to the group of students with results in autumn 2019. |
| 9. No More Marking October 2020 Y7 | A one hour open-ended writing assessment task on the topic of their future career. | Y7 test scores from the beginning of autumn term 2020 (September). | Data from the same task taken by Y5 students in November 2019. | Y7 results generated for a nationally representative sample of schools and students. Results for the Y7 scripts were scaled via comparative judgement, alongside a representative sample of Y5 scripts written in response to the same task. |
| 10. No More Marking December 2020 Y3 and Y5 | Written assessment tasks. | Y3 test scores from the middle of autumn term 2020 (October), and Y5 test scores from the middle of autumn term 2020 (November). | Data from the same tasks taken by Y3 students in October 2019, and by Y5 students in November 2019. | Results scaled via comparative judgement. |
Generalisability of conclusions
Although it is great to have any results at all, there are limits to the conclusions that can legitimately be drawn from these 10 studies, owing to the limited scope of the attainment data. To some extent, this is an inevitable consequence of piggy-backing on results from commercially developed assessment instruments or systems.
First, we only have limited data on outcomes for secondary school students. Most of the large-scale datasets come from primary schools, where data is available for most year groups. The use of commercial tests seems to be far less prevalent in secondary schools in England, particularly for older year groups. We would therefore need to be cautious in generalising conclusions from primary to secondary.
Second, we only have data from a small number of subject areas: typically just maths and English, and with results for reading more common than results for grammar, punctuation, and spelling (GPS) or writing. Because maths and English are so important in primary schools, it is good that we have evidence on how they have been affected. However, their prominence will also have affected their teaching during the pandemic, and there is evidence that teachers committed more time during the autumn term to covering maths and English than to covering other foundation subjects (Ofsted, 2020). As such, we should be wary of generalising results from maths and English to other subject areas.
Finally, with one exception, these studies focus primarily upon data from the first term of the 2020 to 2021 academic year. Clearly, this can only tell part of the story of learning during the pandemic; particularly as we have defined learning loss in terms of attainment at the end of a course.[footnote 3]
Buyer beware
It is important to have discussed these issues in advance of presenting outcomes from the analysis of attainment data, to emphasise that they are far from straightforward to interpret. In addition to these issues, it is worth mentioning that:
- none of the reports has been independently peer reviewed, and none of the analyses has been independently replicated
- most of the reports lack information on technical details concerning their analyses, which can make them tricky to evaluate in places
In short, these were written as interim reports, based upon early findings, and reported primarily to support practical decision making. Only time will tell how definitive their early indications will prove to be.
Results
The following subsections discuss headline results for the autumn term, followed by conclusions from subgroup comparisons. We then compare results across autumn and spring, before identifying outstanding questions.
Study 1 represented a collaboration between Renaissance Learning and the Education Policy Institute. For each student in their dataset, this study compared:
- an estimate of the level of attainment that they would have achieved by autumn 2020 had the pandemic not struck (estimated on the basis of an earlier test result), against
- their actual level of attainment in the wake of the pandemic (according to their autumn 2020 test result)
Because this study was broad in scope, and particularly well controlled, and because its headline results were in the same ballpark as headline results from most of the other studies, it made sense to use this as our primary point of reference.
Headline results
Figure 1 reproduces headline results from study 1. Roughly speaking, they indicate that primary school students were 2 months behind in reading, and 3 months behind in maths, at the beginning of the autumn term (September or October testing).[footnote 4]
Two other studies quantified learning loss for reading and maths in terms of months.[footnote 5] Study 5 (November testing) estimated that year 2 students were behind by 2 months in both reading and maths. Study 3 (November or December testing) estimated that students from years 1 to 6 were behind by 1 month in maths; that students from years 1 to 3 were behind in reading by a similar amount; but that students from years 4 to 6 were not behind at all in reading.
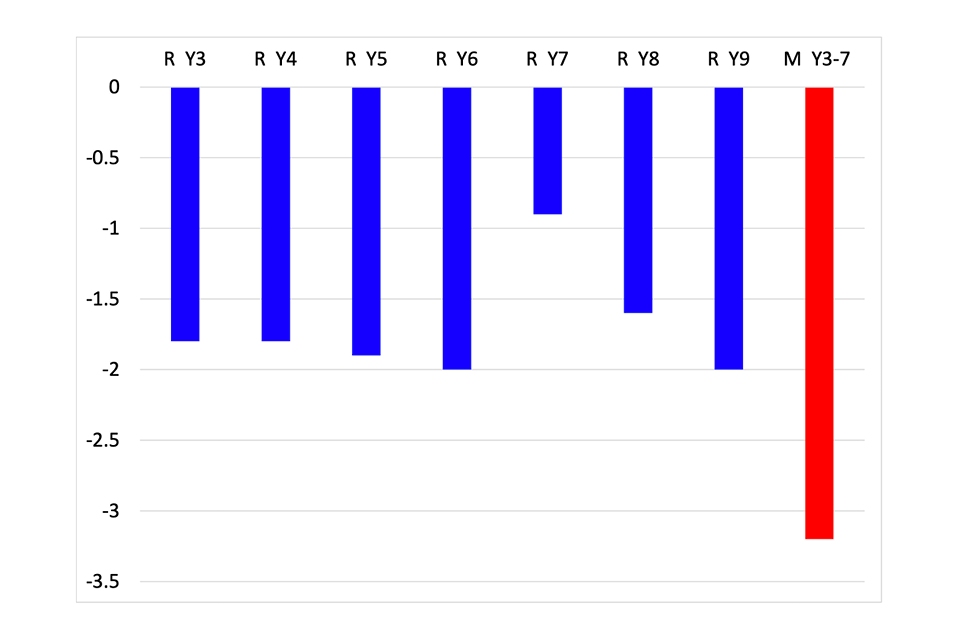
Bar graph indicates that primary and early secondary school students tended to be just under 2 months behind in reading, and just over 3 months behind in maths.
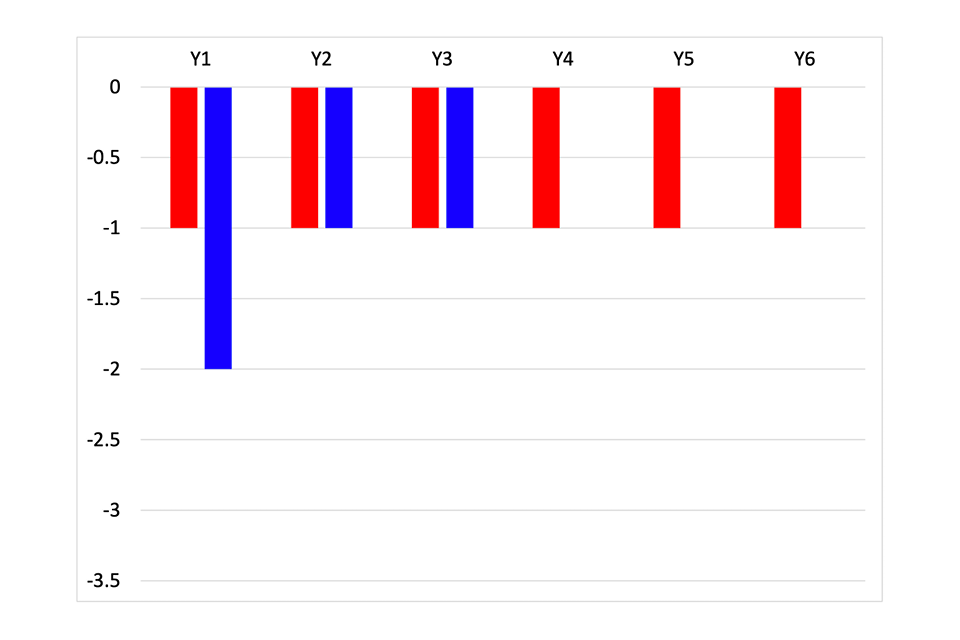
Bar graph indicates that younger primary school students were a month or so behind in reading, older primary school students were not behind in reading, and that all primary school students were around a month behind in maths.
Figure 2 (study 3) is presented above, alongside Figure 1 (study 1), to illustrate how different studies have reached somewhat different conclusions concerning the potential scale of learning loss impacts. It is unclear the extent to which differences between effect sizes for reading and maths across these figures were a consequence of study 3 having been undertaken later in the autumn term.
The other 3 studies that investigated attainment in both reading and maths agreed that results were down in the autumn term for both subjects. There was some evidence of results being down more for maths than for reading, although this was not true across all 3 studies.
Although it seems reasonable to conclude that attainment was generally down in autumn 2020, the precise quantification of this learning loss is more debateable. There were also mixed findings in relation to differences in the degree of learning loss across year groups. For example, study 1 presented very similar estimates of learning loss for reading across years 3 to 6. In contrast, studies 2, 3, and 8 indicated that younger year groups suffered greater learning loss in reading.[footnote 6]
The published studies provided only a small amount of evidence related to other subject areas. Studies 2 and 3 provided evidence related to grammar, punctuation, and spelling (GPS): study 2 (early autumn testing) suggested that losses were greater for maths than for GPS; while study 3 (late autumn testing) suggested the opposite. Study 6 suggested that losses were similar for science and maths.
The most confusing results arose from the 3 reports that contained evidence concerning writing. Studies 9 and 10 focused specifically on writing, using a comparative judgement technique to link standards over time back to previous testing occasions. Study 9 reached the startling conclusion that year 7 students (in September) appeared to be 22 months behind the standard of performance that might be expected of them. Study 10 reported a similar analysis for year 3 (October) and year 5 (November). The year 5 analysis also reported extreme results, with the cohort scoring lower, on average, than it had scored when assessed in January 2020, 9 months earlier. However, the year 3 analysis reported results that were on a par with the previous cohort (tested at the same time point one year earlier) which suggested that students in this year group had not experienced learning loss in writing.
Study 8 was based on teacher assessment judgements rather than test results, using tracking software that requires teachers to decide whether students are working at or above age-related expectations. The interesting finding from this study was that teacher judgements showed no indication of students having been far more seriously affected in writing (by the end of the autumn term) than in either maths or reading. This begs an important question concerning the extreme outcomes from studies 9 and 10: if learning really had been far more seriously affected in writing, then why were teachers not picking this up in the autumn term?
As already noted, we only have limited data on outcomes for secondary school students. Study 1 presented results from early autumn term testing of reading, which suggested that students from years 8 and 9 had fallen as far behind as primary school students (sampling concerns reduced confidence in the estimate for year 7 students). On the other hand, study 6 suggested that primary school students were more seriously affected than secondary school students across all subject areas; while studies 9 and 10 suggested that year 7 students were more seriously affected than both year 5 and year 3 students in writing.
Subgroup comparisons
A major concern since the outbreak of the pandemic has been the possibility that students in different circumstances might be differentially affected. Studies 1 to 9 investigated the possibility of differential learning loss, by breaking down their headline results using a variety of grouping factors.
Regions
Because infection rates were becoming increasingly divergent across the regions of England during autumn 2020, it made sense to break results down by region, which studies 1 to 3 did. Although these studies found different results across the regions, these differences were not always consistent. For example, in study 1, the region in which reading seemed to be least affected by learning loss for primary school students, the West Midlands, was amongst the worst affected regions for secondary school students (-1.6 months for primary vs. -2.1 months for secondary).
Study 2 (early autumn testing) split results down by 3 regions, presenting a graph for maths, which indicated that students in the north were further behind than students in the Midlands, who were further behind than students in the south. However, results from study 3 (late autumn testing) were quite different, with the graph for maths indicating that students in the Midlands were far further behind than students in either the north or the south.[footnote 7]
Disadvantage
Studies 1 to 9 used either Pupil Premium (PP) status, Free School Meals (FSM) status, or the Income Deprivation Affecting Children Index (IDACI) score as an indicator of disadvantage to investigate the possibility of differential learning loss.
Study 1 demonstrated that low FSM schools appeared to be less far behind in reading than medium FSM schools, which appeared to be less far behind in reading than high FSM schools. The same finding emerged from study 2, for reading, maths, and GPS, and this was replicated in study 3, using IDACI scores. Study 5 also noted that results were disproportionately down for FSM students, across both reading and maths, by about an additional month.
Study 8 indicated that results were disproportionately down for PP students, in comparison with non-PP students, across reading, writing, and maths. Study 3 concluded that results were disproportionately down for PP students across reading, GPS, and maths, although the effects were not perfectly consistent across subjects or year groups.
The only unexpected result came from study 6, where schools with high levels of FSM appeared to have been affected less than those with low levels of FSM. It is unclear why this pattern might have occurred, and it looks a little anomalous in the context of the other studies.
Study 7 was distinctive in focusing specifically on the impact of the pandemic upon disadvantage gaps; that is, attainment gaps between disadvantaged (FSM-eligible) students and non-disadvantaged students. Its most interesting analyses compared attainment gaps calculated from late autumn 2019 test results with attainment gaps calculated from late autumn 2020 test results, for a common sample of students from years 2 to 6. The authors concluded that the disadvantage gap for primary maths had widened substantially over this period – by 17%, or 1 month’s worth of progress using the Education Endowment Foundation conversion technique (see Allen et al, 2021) – although the gap for reading had remained similar to pre-pandemic levels. They also noted that maths gaps appeared to have widened most for the youngest year groups (year 2 and year 3) although these observed differences were not large enough to be judged significant.
Time of testing
Bearing in mind that we defined learning loss in relation to attainment at the end of a course (or academic year) the fact that most of our attainment data studies focused on assessments conducted during the autumn term presents a major challenge. Not only is the autumn term located at the beginning of a new academic year – as well as being located the length of a summer holiday away from the end of an old academic year – we also have evidence from study 1 that students make different amounts of progress from one term to the next: making most progress during the first term, and less with each subsequent term (see also Kuhfeld & Soland, 2020). Clearly, this should make us wary of generalising conclusions from outcomes obtained almost exclusively during the autumn term to outcomes that might be obtained subsequently.
Results from RS Assessment from Hodder Education with SchoolDash – relating to three separate assessment periods – helpfully illustrate this interpretational challenge:
- data from early autumn 2020 indicated that primary school students were a long way behind expectations (although those expectations were defined in relation to late summer 2020, so the comparison was not direct)
- data from late autumn 2020 indicated that primary school students were not such a long way behind expectations, after all
- data from late spring 2021 indicated that primary school students were now further behind expectations, although not as far behind as in the early autumn
In contrast to the story told by Figure 2, on the basis of the late autumn data, the late spring data suggested that students were now around 3 months behind in GPS and maths, and around 2 months behind in reading. It is hard to know how to interpret these findings. For instance, in relation to reading, they indicate that students from years 4 to 6 – who had managed to avoid a net negative impact by the end of the autumn term 2020 – were now substantially behind expectations at the end of the spring term 2021. Does that imply that students somehow lost out on acquiring a large amount of knowledge and skill in reading during the period of remote learning from January to the first week in March? Perhaps. Although, it is not clear why this might have happened.[footnote 8]
Hot off the press in early June – and therefore too late to be reviewed in detail in the present report – were two new studies from Renaissance Learning & Education Policy Institute (2021b; 2021c). The second was particularly relevant to the present section, as it also reported attainment trends across early autumn, late autumn, and late spring. Just as in the research reported above, students appeared to have lost least learning when assessed during late autumn, giving the impression that primary students had fallen substantially further behind expectations – in both maths and reading – during the period of remote learning from January to the first week in March. Again, it is not clear why this might have happened.
Outstanding questions
Although it would be unwise to over-interpret findings that were observed only occasionally, a few are worthy of comment, and might benefit from further research and analysis. An important question concerns the extent to which students of differing attainment levels might have been affectedly differently. For instance, there was evidence from study 3 that students in lower attainment bands may have fallen further behind. Study 3 also noted that there appeared to be greater dropout from students in lower attainment bands: that is, students in these bands were most likely not to have data from the autumn 2020 assessments. This seems to chime with evidence from study 5 that unexpectedly large numbers of students were unable to engage with the tests at all in autumn 2020. To the extent that attainment and disadvantage are correlated in normal times, it seems quite likely that lower attaining students will (on average) be disproportionately affected by learning loss. It will be particularly important to understand the ways in which, and the extent to which, the worst affected students have been affected by learning loss.
Only 2 of the studies reported a gender effect. Study 6 stated that girls had been more affected than boys in maths and reading or English. Unfortunately, limited details were provided, and it is hard to know what to make of this observation. Study 9 suggested that boys might have fallen further behind in writing. The other studies did not mention gender effects. Whether this was because they had investigated them and not found any differences, or whether they had simply not investigated them at all, was unclear (although the authors of study 8 mentioned to us that they had investigated gender effects and not found any).
Finally, there was some evidence of learning gain from certain of the subgroup comparisons. For example, study 3 suggested that students from years 4 to 6, in low FSM schools, were actually ahead of expectations in reading, when compared with similar students from the autumn 2019 cohort.
Conclusions
Evidence from these 10 studies suggests that, when assessed during the autumn term of 2020:
- primary school students were generally a month or so behind expectations
- disadvantaged primary school students were disproportionately behind expectations
Beyond this, the evidence was somewhat mixed, although there was also some indication that:
- primary school students were further behind expectations in maths than in reading
- younger primary school students were further behind expectations than older ones
- some older primary school students were actually ahead of expectations in reading
- the extent of learning loss differed by region, although it was not the case that certain regions consistently appeared to be worse affected than others
We need to hedge these conclusions with number of observations, which revisit some of the methodological challenges discussed earlier.
First, these findings were mainly based on data from the autumn term 2020, and we should be cautious in extrapolating their conclusions to the end of the 2020 to 2021 academic year. Given its proximity to the summer holidays, the autumn term is not necessarily a good baseline for extrapolation.
Second, these findings were based largely on data for reading and maths, and conclusions may not generalise well to other subjects. Reading may be particularly problematic to generalise from, to the extent that students may be able to make considerable progress in reading with limited instructional support from their teachers; even younger children, with support from their parents. This situation seems less likely for maths, GPS, science, and other subjects, which require more specialist guidance and support. Results from studies 9 and 10 ring a warning bell concerning the possibility of far more extreme effects across other subjects. Yet, it is not entirely clear what to make of these results, for example, whether the extreme effects that were observed were genuine, or methodological artefacts, or perhaps a bit of both.
Third, the findings mainly concerned primary school students. Particularly bearing in mind that conclusions were not necessarily consistent across primary year groups, we should be wary in generalising conclusions to secondary year groups, especially to upper secondary school students. Ultimately, though, both primary and secondary school students have experienced similar kinds of disruptions over the past year or so, and it would not be unreasonable to expect them to have been affected in similar ways. It would therefore not be surprising if students from year 11 to 13 were also some way behind expectations, with disadvantaged students having experienced disproportionate learning losses.
References
The 10 studies
Study 1: Renaissance Learning with Education Policy Institute (2021a)
Renaissance Learning & Education Policy Institute (2021a). Understanding progress in the 2020/21 academic year. Interim findings. London: Department for Education.
Study 2: RS Assessment from Hodder Education with SchoolDash (2020)
Blainey, K., Hiorns, C. & Hannay, T. (2020). The impact of lockdown on children’s education: a nationwide analysis. London: RS Assessment from Hodder Education.
Study 3: RS Assessment from Hodder Education with SchoolDash (2021)
Blainey, K. & Hannay, T. (2021). The impact of school closures on autumn 2020 attainment. London: RS Assessment from Hodder Education.
Study 4: RS Assessment from Hodder Education with SchoolDash (2021)
Blainey, K. & Hannay, T. (2021). The impact of school closures on spring 2021 attainment – interim paper. London: RS Assessment from Hodder Education.
Study 5: National Foundation for Educational Research (2021)
Rose, S., Twist, L., Lord, P., Rutt, S., Badr, K., Hope, C. & Styles, B. (2021). Impact of school closures and subsequent support strategies on attainment and socio-emotional wellbeing in Key Stage 1: Interim Paper 1. London: Education Endowment Foundation.
Study 6: GL Assessment (2021)
Brzyska, B., Fernandes, C. & Gallacher, T. (2021). Impact of Covid-19 on attainment: initial analysis. Brentford: GL Assessment.
Study 7: Education Endowment Foundation (2021)
Weidmann, B., Allen, R., Bibby, D., Coe, R., James, L., Plaister, N. & Thomson, D. (2021). Covid-19 Disruptions: Attainment gaps and primary school responses. London: Education Endowment Foundation.
Study 8: Juniper Education (2021)
Juniper Education (2021). Juniper Education National Dataset Report. February 2021. The impact of the Covid-19 pandemic on primary school children’s learning. Essex: Juniper Education.
Study 9: No More Marking (2020)
No More Marking (2020). Assessing Secondary Writing. Writing attainment in year 7, September 2020. Impact Analysis. Summary Report. Durham: No More Marking Ltd.
Study 10: No More Marking (2020)
Christodoulou, D. (2020). Writing attainment in 2020–21 (No More Marking blog entry). December 14.
Additional references
Allen, R., Bibby, D., Coe, R., James, L., Plaister, N., Thomson, D. & Weidmann, B. (2021). Have disadvantaged pupils fallen further behind during the pandemic? FFT Education Datalab Blog, 7 May.
Kuhfeld, M. & Soland, J. (2020). The Learning Curve: Revisiting the assumption of linear growth across the school year. EdWorkingPaper: 20-214. Providence, RI: Annenberg Institute at Brown University.
Ofsted (2020). COVID-19 series: briefing on schools, November 2020. London: Office for Standards in Education.
Renaissance Learning & Education Policy Institute (2021b). Understanding Progress in the 2020/21 Academic Year. Complete findings from the autumn term. June 2021. London: Department for Education.
Renaissance Learning & Education Policy Institute (2021c). Understanding Progress in the 2020/21 Academic Year. Initial findings from the spring term. June 2021. London: Department for Education.
Endnotes
-
In fact, study 2 investigated learning loss for all year groups from year 1 to year 5. We are focusing exclusively upon the year 5 comparison, here, purely for illustration. ↩
-
Report 5 in our ‘Learning During the Pandemic’ series discusses this summer (holiday) learning loss phenomenon in more detail. ↩
-
For the purpose of the present report, we might define this more generally in relation to attainment at the end of an academic year. In fact, we tend to use the term ‘learning loss’ more fluidly throughout this report, as shorthand for how far behind expectations students appeared to be at the point at which they were assessed. ↩
-
For maths, results were aggregated across years 3 to 7, owing to smaller year group sample sizes. ↩
-
Both adopted a conversion technique devised by the Education Endowment Foundation. Study 3 noted: “We must advise caution with this indicative measure as the conversion process is only a rough guide.” (Blainey & Hannay, 2021, p.5). It is worth noting that study 1 adopted a more direct approach to estimating months behind, based upon the relationship between actual and expected progress, which helps to enhance the credibility of its conversion process. ↩
-
The inference related to study 8 is drawn from data on page 10 of the report, comparing results for non-disadvantaged students (only) between autumn 2019 and autumn 2020. ↩
-
Report 2 in our ‘Learning During the Pandemic’ series explains how the pandemic affected schooling in different regions in different ways at different points during the autumn term. However, these complex differential effects do not appear to parallel findings from the attainment data studies in any straightforward way. ↩
-
We could speculate over alternative explanations. Maybe, for instance, performances were at least somewhat artificially deflated as a consequence of students being tested soon after a return to ‘new normal’ arrangements in late spring – just as they may have been at least somewhat artificially deflated as a consequence of being tested soon after a return to ‘new normal’ arrangements in early autumn. In other words, perhaps the late autumn tests – which marked the end of an extended period of whole-class in-school tuition – provided better assessments of learning. We offer this speculation merely to suggest that we may need to distinguish between (superficial) performance deficits and (deeper) learning deficits, when interpreting results from attainment data studies during the pandemic. We explore this possibility in more detail in Report 1 from our ‘Learning During the Pandemic’ series. ↩