Learning during the pandemic: quantifying lost time
Published 12 July 2021
Applies to England

© Crown copyright 2021
This publication is licensed under the terms of the Open Government Licence v3.0 except where otherwise stated. To view this licence, visit nationalarchives.gov.uk/doc/open-government-licence/version/3 or write to the Information Policy Team, The National Archives, Kew, London TW9 4DU, or email: psi@nationalarchives.gov.uk.
Where we have identified any third party copyright information you will need to obtain permission from the copyright holders concerned.
This publication is available at https://www.gov.uk/government/publications/learning-during-the-pandemic/learning-during-the-pandemic-quantifying-lost-time
Authors
- Fiona Leahy
- Paul Newton
- Aneesa Khan
With thanks to colleagues from
- Department for Education
- Education Endowment Foundation
- Education Policy Institute
- FFT Education Datalab
- GL Assessment
- ImpactEd
- Institute for Fiscal Studies
- Juniper Education
- National Foundation for Educational Research
- No More Marking
- Ofsted
- Renaissance
- RS Assessment from Hodder Education
- SchoolDash
- University College London
- University of Exeter
Executive Summary
This is part of a series of Ofqual reports on Learning During the Pandemic. The aim of this particular report was to quantify how much time students in different circumstances have spent studying, or not studying, across the course of the pandemic. This will help us understand the narrative around ‘lost time’. That is, how much time students have lost compared to what they would usually spend studying in a normal year. We were specifically interested in the amount of time students who were due to take their assessments in 2021 would have lost, assuming they were studying a traditional 2-year course.
We begin by creating a chronology of the pandemic. The 5 main phases characterised by different predominant modes of learning are:
- Phase 0 – Pre-pandemic (‘traditional’ mode)
- Phase 1 – First wave of school closures (mainly ‘remote’ mode)
- Phase 2 – Schools reopen in autumn term (mainly ‘new normal’ mode)
- Phase 3 – Second wave of school closures (mainly ‘remote’ mode)
- Phase 4 – Schools reopen mid-spring term (mainly ‘new normal’ mode)
Across these phases there were different issues, resulting in changing narratives of lost time. One major narrative was focused on the amount of lost face-to-face teaching time and how this differed between students. This was a particular issue during periods when schools were reopened following periods of closures, as although we might have expected the return to whole-class-in-school tuition (in other words ‘new normal’ mode) to result in a more even learning experience, factors such as the local infection rate resulted in some students receiving more face-to-face teaching time than others. We investigated this narrative by reviewing the relevant literature in the ‘Macro-level lost time analysis’ section. The other main narrative focused on how much time students were spending studying per day at home, during periods when schools were closed to most students. The switch to a remote mode of learning introduced differences in time spent studying per day between groups of students based on a variety of factors, which we investigated in the ‘Micro-level lost time analysis’ section.
Macro-level findings
To summarise the macro-level analyses, most studies we reviewed described differences in attendance rates between students according to their age, what region they lived in, socio-economic status or other circumstances. Attendance in the autumn term (phase 2) in particular presented a turbulent picture of lost time, with more students missing in-person schooling in areas with higher infection rates, such as the north-west early on in the term, or London at the end of term when the ‘Kent variant’ took hold (although this was not the case in all local authorities within these regions). Students in years 10 and 11 were also missing more school than younger year groups. Furthermore, the most socio-economically deprived areas had lower attendance rates than the least deprived areas, although there are exceptions to this relationship. Data on the different reasons for COVID-19-related absence started being collected by the DfE in October. Analysis of this data revealed that these absences were largely driven by increased numbers of self-isolations, rather than students contracting COVID-19 themselves. Being absent for X weeks is therefore not necessarily the same thing as having lost X weeks of learning, and only a small proportion of students were likely unable to continue studying at home due to being ill.
There were also macro-level issues when remote learning was the predominant mode, with those who were given the opportunity to attend school or who chose to attend potentially receiving more face-to-face schooling. However, of the children who were eligible to attend (those who were vulnerable or the child of a critical worker) only a small proportion did actually attend during the first school closures in phase 1, although more attended in the second closures in phase 3. The most common reason for choosing not to return when given the opportunity was the perceived health risk. Within those who attended, disadvantaged children (those eligible for free school meals) may have been slightly overrepresented during the first school closures. However, during the second school closures in January 2021, more students from middle-class families attended school than those from working-class families, likely due to an increase in the numbers of critical workers’ children being sent back to school.
Micro-level findings
To summarise the micro-level analyses, survey studies highlighted differences between groups of students in terms of how many hours per day they were reportedly studying during periods when remote learning was the predominant mode (phases 1 and 3). Overall, estimates of the average amount of time students were studying at home during the first lockdown range from between 2 to 4.5 hours per day, which is a significant drop from an average 6 hours per day before the pandemic. During the second wave of school closures in phase 3, the government made it a legal requirement for secondary schools to provide 5 hours of remote learning provision per day. Findings suggest the proportion of students studying more than 5 hours per day increased during this period compared to phase 1 (from 19% to 45%).
A number of factors were found to differentiate groups of students in terms of the number of hours they spent studying at home, such as school type, age, and parent characteristics. However, the most frequently reported finding in this literature was that socio-economically disadvantaged children were spending less time studying at home than their less disadvantaged peers during the first lockdown. For example, estimates suggested a gap of 1.2 hours per day between the richest and poorest secondary school students (an increase from 0.9 hours before the pandemic), and a gap of 1 hour in primary school students in phase 1 (compared to no gap before the pandemic). Although learning time at home had increased overall during the second school closures in phase 3, there was still a difference between the richest and poorest, with students from middle-class families nearly 1.5 times more likely to be spending more than 5 hours per day learning than students from working-class families.
Even when schools were open there were some micro-level issues, such as changes to school timetables, which potentially affected total time per day spent learning. Although a higher proportion of students were receiving a ‘full school day’ (more than 5 hours) during the autumn compared to during lockdown, social distancing measures such as staggered start times likely affected time spent studying in school, and there was still a substantial proportion (4 in 10) who were not receiving a full school day. The impact of social distancing measures might have also varied by school, depending on what resources they had. There was very little research on the number of hours per day spent studying by students self-isolating during phases 2 and 4, although Report 4 in our series highlighted that children isolating as part of a bubble appeared to receive better provisions than those isolating individually.
Time gained
Finally, we briefly discuss the time students may have gained back, in terms of strategies to help students ‘catch up’. Detailed research into the quantifications of this time and how it might vary by students in different circumstances is yet to be undertaken. One early finding was that students who had private tutors, who were more likely to be from richer families, were likely to have spent more additional hours studying than those from poorer families without a private tutor. There are strategies aiming to help students catch up that target the most disadvantaged students, such as the national tutoring programme, but concerns have been raised about the extent to which these plans will reach the most disadvantaged students.
Variation between and within groups
One of the most significant findings of this review was the wide variation between individual students in terms of their experience of lost time. In the scenario modelling section we created a set of hypothetical scenarios with students in a variety of contexts, and estimated how many weeks each of these students would have likely spent studying at home, at school, or not at all, based on what we learned from the literature. This illustrated that the overall amount of lost in-person teaching time experienced by students taking a 2-year course could range from as little as a few weeks to around 44 weeks (equating to around two-thirds of their course), with many students falling somewhere in between these 2 extremes. The extent of the variation in these estimates demonstrates that it is very difficult to generalise quantities of lost time for any particular group of students who share one characteristic, because within that group, students will differ based on some other characteristic or factor that also affects quantities of lost time.
Conclusions
When schools closed and learning switched to being predominantly remote at the outset of the pandemic, differences between groups of students based on a variety of factors were introduced, and existing disparities deepened. Probably the most prominent of these factors was socio-economic status, with the poorest students’ learning time being reduced to a greater extent than the richest. However, even when schools reopened, disparities remained as attendance varied between the most and least deprived areas. There was extensive variation behind the averages reported in the literature about lost time though, at regional, local authority, school and student level. Therefore, it is difficult to generalise across any particular group, as lost time is unique to each individual student.
Introduction
Researchers have attempted to quantify amounts of learning loss using a range of data sources, such as attendance data, number of school closures, the scale of remote learning provision, and the number of hours students have spent studying at home. Differential learning loss between different groups of students has been a particular interest. For example, in October, Halterbeck, Conlon, Patrignani, and Pritchard (2020) estimated an average 21% loss in learning in students from the highest socio-economic groups, and 34% in the lowest socio-economic groups. This was based on a combination of information about the duration of school closures, estimates of the declines in the number of hours per day students spent studying, as well as estimates of the effectiveness of remote learning. There have also been many statements made in the media about the amount of learning time students have lost due to the coronavirus (COVID-19) pandemic, for example ‘The pandemic has meant many pupils have lost around half a school year of face-to-face learning’.[footnote 1]
The pandemic has undoubtedly had a significant detrimental effect on many students’ learning, and one of the key markers of this effect is the amount of ‘lost time’. That is, the amount of time students did not spend learning, that they would have usually spent learning prior to the pandemic. This report focuses specifically on this concept of lost time, by reviewing evidence from research that has attempted to quantify it. A review of the research examining the quality of teaching and learning during the time that students were studying is reserved for Report 4 in this series.
The first important determinant of the quantity of lost time is the amount of time students did or did not spend in traditional face-to-face schooling. To start to understand this, we can begin by examining the amount of time most schools were closed to most students, and average attendance rates across the course of the pandemic. However, a multitude of factors have influenced the total amount of time individual students have spent learning in school, such as whether their parents were critical workers, what year group they were in, or how local infection rates affected the number of times they had to self-isolate. Furthermore, the relationships between these factors and students’ learning time has fluctuated throughout the course of the pandemic. For example, at the beginning of the autumn 2020 term attendance rates were lowest in the north-west of England and were correlated with socio-economic disadvantage, while at the end of the autumn term, London and the south-east had the lowest attendance rates and the relationship with disadvantage had disappeared (Burgess, Thomson, Plaister, & Nye, 2020). Even at local authority level, different schools within the same local area will likely have experienced differences in the numbers of students that were sent home to self-isolate. The result of this is that there has been huge variability in the amount of face-to-face learning time students in different circumstances have experienced, and the question of how much time students have lost does not have a simple answer.
In addition, when considering the concept of lost learning time we must also take into account the time that students were studying at home when they were not in school, both when schools were closed to most students or when students were sent home to self-isolate. We can do this by investigating various self-report measures of how many hours per day students were spending studying. However, these estimates also differ between students in different circumstances, depending on a range of factors including which phase of education they were in, socio-economic status, their school’s provision of remote teaching, or parental characteristics. Therefore, as with the attendance data, there is substantial variation between individual students underlying the reported average hours spent learning. The quality of this learning time is also a significant factor to be considered, for example, whether they were studying mostly online or offline, and this is discussed further in Report 4 in this series.
The main aim of this report was to understand the meaning of ‘lost time’ by unpicking these complex layers, and to use the findings from existing literature to provide meaningful quantifications of how much learning time students in different circumstances have likely lost. In particular, we were interested in understanding the proportion of time lost from a traditional 2-year exam course (starting in September 2019 and finishing in May 2021). In order to do this, we reviewed over 50 sources containing information about the quantities of time students in England spent learning during the pandemic. This included primary sources such as Department for Education (DfE) attendance statistics, as well as research reports containing primary and secondary analyses of survey responses and attendance data. For contextual information we also included policy documents, government guidance, media sources, blogs, and wider commentary on the situation. Although our main interest was on the amount of time students in exam years might have lost, much of the evidence available included all year groups, from both primary and secondary schools. We therefore aimed to gain an understanding of the wider picture of lost learning time across a broad age range, but focussing on older year groups where possible.
Chronology of the pandemic
Before we investigate the complexities of lost time, it is useful to understand the key phases of the pandemic in terms of education policy. We therefore present the chronology of the pandemic, from the perspective of students studying a conventional 2-year course starting in September 2019. We compare the impacts of different policy arrangements on schooling, and describe which issues characterised each phase. Figure 1 presents this chronology, with shading highlighting the weeks that most schools were open, partially open, open but with conditions depending on tiers, closed due to the pandemic, and closed for school holidays.[footnote 2]
The conditions depending on tiers refer to the tiering system put in place in October 2020 by the government in order to reduce the spread of COVID-19. Each region of England was placed either in tier 1, 2, or 3 (and later tier 4 was added) depending on local case rates and pressure on the NHS. Tier 1 had the least restrictions and tier 4 had the most restrictions in terms of conditions for schools. In regions under tier 1 restrictions, schools could open as normal, whereas in tier 4 attendance was restricted to priority groups only. Initially, most of the country was placed in tier 1, with many regions moving into higher tiers later on. By the end of December, 75% of the country were in tier 4 (Brown & Kirk Wade, 2021).
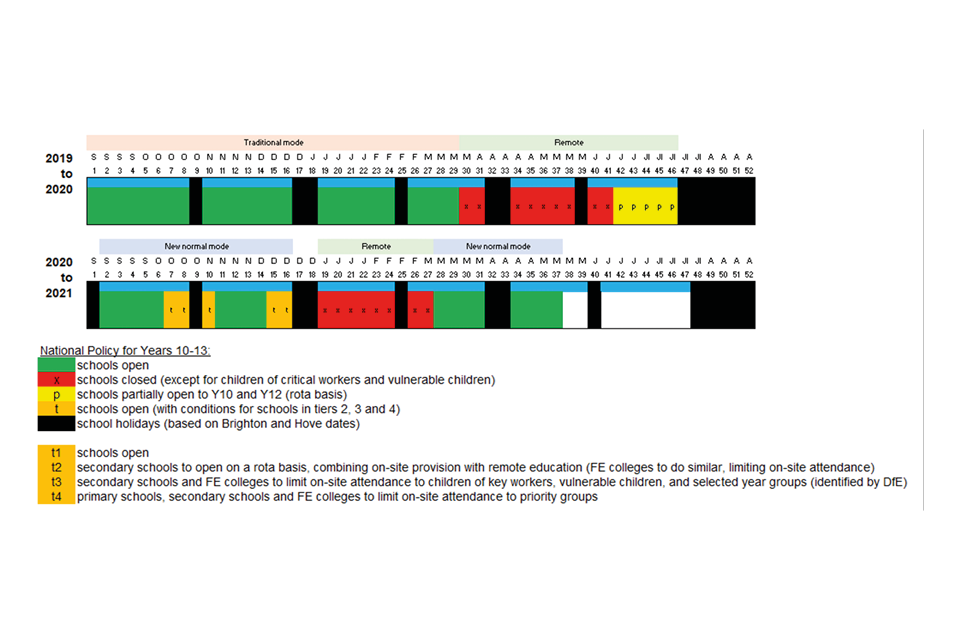
Figure 1: Calendar to present the chronology of schooling arrangements for a typical 2-year course starting in September 2019. Note. Independent schools set their own dates and may differ to those presented in this example. The shading ends at week 37, when the final draft of present report was completed.
Phase 0 – Autumn 2019 and early spring term 2020
Schools and education institutions remained open as normal in this phase. The overall absence rate in schools in England during the autumn 2019 term was approximately 4.93%, but ranged between 2.9 to 6.5% at local authority level.[footnote 3] Fourteen schools had closed by the 28 February, some of which because students had returned from Italy (where COVID-19 was taking hold) with flu-like symptoms.[footnote 4]
Phase 1 – 23 March to end of the summer term 2020
On 18 March, the Secretary of State announced that schools, colleges and early years settings in England would close after 20 March,[footnote 5] except to children in priority groups (as detailed below). Following the announcement, schools and education institutions were closed to most students by the start of the week commencing Monday 23 March 2020 across all of the UK.
On 19 March, the DfE published guidance on which children were eligible to continue attending school in England. Approximately 80% of schools remained open for these priority groups,[footnote 6] which included the children of critical workers (for example NHS staff, police and supermarket delivery drivers), and vulnerable children including: those with a social worker; looked-after children; and those with an education, health and care plan (EHCP) due to their complex special educational needs (Roberts & Danechi, 2021). Children who did not fall into the above categories were expected to stay at home with suitable care. Although priority groups were able to continue attending school, this does not mean that there was full attendance among students that fell into the categories above.
The overall attendance of students who normally attend school in England between March and May 2020 was around 3 to 4% for primary school children, and 1% for secondary school children (see Figure 2). Some of the first attendance datasets published following school closures indicated that, of the students that were attending school on 17 April, around 24,000 were classed as vulnerable, which represents around 5% of all children and young people classified as ‘children in Need’ or who have an EHCP.[footnote 7] This percentage gradually increased to 15% in the week before May half-term. The number of students classed by schools as children of critical workers attending school was 62,000 on 17 April, which is estimated to be around 2% of all children of critical workers. This also gradually increased to 6% in the week before May half-term.
In June and July when infection rates were lower, schools began to reopen more widely to key year groups, in addition to the provision already in place for priority groups. As outlined in DfE guidance,[footnote 8] from the week commencing 1 June primary schools were able to reopen for transition year groups including: nursery, reception, year 1 and year 6, although, many schools delayed reopening until after this date.[footnote 9] From 15 June, secondary schools, sixth forms and further education colleges were able to offer face-to-face support for the year groups that were due to take exams the following year (years 10 and 12), although DfE guidance instructed schools to continue to primarily educate these year groups at home, and to keep face-to-face lessons to a minimum8. Schools were therefore often only open on a part-time basis.[footnote 10] A number of schools did not open during this period, for example, by 25 June 89% of primary schools were actually open to the above year groups, and 74% of secondary schools were open to year 10s and year 12s.[footnote 11] In addition, attendance was not compulsory during this time and even in schools that were open, not all parents with children in these year groups sent their children back to school. Overall attendance of students who normally attend school in England increased from around 15% in June to 27% in July for primary school children, and from 1% in June to 5% in July for secondary school children[footnote 12] (see Figure 2).
During this period there were also occasional regional differences in restrictions in areas where infection rates were high. For example, when there was a spike in COVID-19 cases in the city of Leicester, there was a lockdown imposed in the city which meant schools closed from 2 July up until a fall in cases meant they could reopen again on the 24 July.[footnote 13]
To summarise phase 1, policy was reactive to the changing circumstances in response to the pandemic. Broadly speaking, most students were not receiving face-to-face schooling throughout phase 1, except for a small proportion of students who were in priority groups, and some from key year groups in June and July.
Phase 2 – Autumn term 2020
Schools remained closed to most students until the end of the summer 2020 term, not reopening until the beginning of the autumn 2020 term. Attendance became mandatory again at this time, although DfE guidance stated that absence of children because they were following clinical or public health advice would not be penalised (Roberts & Danechi, 2020). DfE guidance for students who were clinically vulnerable or had underlying health conditions was for them to continue to attend school, but students who were clinically extremely vulnerable on the advice of clinicians were to remain at home. Therefore schools reopened with the expectation of near full attendance for the new 2020 to 2021 school year in the first week of September.
As of the 10 September, 88% of students had returned to the classroom.[footnote 14] Attendance increased slightly throughout September, and remained fairly steady throughout October (Children’s Commissioner for England, 2020a; also see Figure 2). Total student absences in secondary schools due to COVID-19 were around 4-5% in October, and around 11-13% by the end of term (Sibieta, 2021a). As case rates were rising, on 14 October a COVID-19 three-tier system of regulations were put in place in England, with tier restrictions varying according to region. In addition to the tier restrictions, on 31 October a four-week lockdown was announced which lasted up until 2 December. Schools were expected to remain open during the lockdown, as keeping students in education remained a priority.[footnote 15] Following this lockdown the tiering system was reintroduced. An additional fourth tier was introduced on 19 December.[footnote 16]
Although all schools were expected to remain open irrespective of tier regulations, there were some differences between tiers in terms of the way schools operated.[footnote 17][footnote 18] Government guidance stated that in tier 1, schools were expected to remain fully open but students in year 7 and above were to wear face coverings in communal areas. In tier 2, secondary schools were asked to adopt a rota system, and further education (FE) colleges were to limit on-site attendance. This meant that most students experienced a combination of remote and on-site schooling, while vulnerable children and children of critical workers were allowed to attend on-site full-time. In tier 3, secondary schools and FE colleges were required to limit on-site attendance to just children who were vulnerable, those of critical workers, and selected year groups. On 19 December, tier 4 was introduced in large areas in the south-east of England.[footnote 19] In tier 4, on-site attendance was limited to just vulnerable children and the children of critical workers at all primary and secondary schools. Alternate provision settings and special schools were allowed to remain open to all students (as they also were in tiers 1 to 3), although that does not necessarily mean they were able to offer a place to all students who would normally be in attendance, as this was likely to have depended on staffing levels, the space available due to social distancing measures, and the unique health risks to individual students.
Average attendance rates were between 80 to 90% in this phase (Sibieta & Robinson, 2020), but this term is particularly challenging to characterise due to the sporadic impacts of the pandemic on different groups and in different regions. For example, some of the worst affected tier 3 regions were in the north-west at the beginning of the autumn term, with Liverpool being the first assigned to tier 3, followed by Lancashire. Burgess et al. (2020) demonstrated that state-funded secondary school attendance was lower in regions with higher infection rates. Attendance rates were therefore lowest in areas such as the north-west at the start of term. But different regions were assigned to tiers 2 and 3 at different points in time throughout this period, leading to differences in on-site attendance across these regions.
By December, the ‘Kent variant’ of COVID-19 had caused a spike in infection rates in London and the south-east of England, leading these areas to have some of the lowest attendance rates. In addition to regional differences, there was also considerable variation in attendance between local authorities, a topic which will be discussed in more detail later. Some local authorities wished to close schools and transition to remote learning for the last week of term before the Christmas break, amid these rising infection rates in their areas. However, the government’s position was that schools should remain open due to the “national priority to keep schools open full time and avoid further disruption to education” (Roberts & Danechi, 2020, p.9), therefore they remained open, but attendance fell sharply in these areas ( for exampleGreenwich and Islington). Some local authorities chose to close schools for this week against government advice, and therefore also saw sharp decreases in attendance, for example Waltham Forest and Redbridge (Sibieta, 2021b).
Average attendance rates dropped in November and reached a low of around 80% in the last week of term (Sibieta & Cottell, 2020). This is likely because more schools were sending pupils home to self-isolate after coming into contact with a confirmed case, rather than due to students being absent after contracting the virus themselves. DfE guidance stated that “groups are likely to need to be the size of a year group to enable schools to deliver the full range of curriculum subjects and students to receive specialist teaching”,[footnote 20] therefore large numbers of students could be sent home. For example, in mid-November, 36% of schools had sent at least 1 student home to self-isolate,[footnote 21] which is an increase from 21% in mid-October.[footnote 22] The Children’s Commissioner for England’s (2020a) secondary analysis of DfE attendance data from September to December found that confirmed cases accounted for only 2.4% of all COVID-19-related absence, and only 0.2% of a school population of 8 million. In contrast, a much larger proportion of children are absent from school due to self-isolation (86%). Ofsted (2020a) also found that one third of the 121 schools they visited in September reported parents had removed children from school to home school them. Many parents seem to have made this choice because of their anxiety about COVID-19, and these decisions are discussed in more detail later.
Another factor influencing student attendance during this phase was teacher absence. Government guidance during the lockdown was that individuals who were clinically extremely vulnerable should work from home, therefore some teachers would not have been able to teach in-person. Furthermore, around 4-5% of both primary and secondary teachers were absent for COVID-19-related reasons in the autumn (Sibieta, 2021a). In secondary schools, although students were more likely to be absent because they were self-isolating after coming into contact with a confirmed case, teachers were about 2 to 3 times more likely than students to be absent due to testing positive themselves, and therefore may not have been able to teach even remotely.
To summarise phase 2, policy was that schools were to remain open throughout the whole term, but there were differences between regions depending on what tier they were placed in. With different regions moving into different tiers across the period, this presented a more turbulent picture of face-to-face schooling, with some regions being more affected than others at different points in time.
Phase 3 – Spring term 2021 to 8 March
During his address to the nation on 4 January 2021,[footnote 23] the Prime Minister announced that schools and colleges in England would close to most students again, with provision moving to remote learning from 5 January until after February half-term, subject to review. The children of critical workers and vulnerable students could continue to attend in-person. The DfE indicated that special schools and alternative provision would remain open, and updated guidance on children who could access school places was published.[footnote 24] The government’s list of critical workers now included more than 40 different roles across 8sectors, with families told that their child would be eligible to attend school if one parent is on the list.[footnote 25] In addition, the definition for vulnerable children was expanded to include “those who may have difficulty engaging with remote education at home (for example due to a lack of devices or quiet space to study)”.[footnote 26] However, there were still inconsistencies across schools in how the above guidance was implemented. Media outlets highlighted that the demand for school places meant that some schools stated both parents needed to fall under the critical worker category.[footnote 27]
The above changes could explain why overall attendance was around 5times higher in primary and secondary schools than it was during phase 1. As of 13 January, over 99% of schools were open[footnote 28] (compared to 80% in May), and attendance was 21% in primary schools and 5% in secondary schools (see Figure 2). Across the period from January to 8 March, attendance in primaries gradually increased from 21% to 28%, and remained at around 5 to 6% in secondaries.[footnote 29] In comparison, from March to May 2020 on-site attendance was approximately 3 to4% in primaries and 1% in secondaries[footnote 12].
The attendance of children of critical workers increased throughout the spring term, from 820,000 on 13 January to 1,013,000 on 4 March.[footnote 30] The proportion of all children with an EHCP in attendance increased from 34% in January to 47% in March, and the proportion of all those with a social worker in attendance increased from 40% to 51%[footnote 29]. The numbers of teaching staff who could not work due to COVID-19-related reasons (either on-site or remotely) decreased throughout this period, with the proportion of teachers and school leaders working on-site increasing from 37% at the end of January, to 47% on 4 March, while the proportion of teaching assistants and other staff increased from 51 to 61%[footnote 29].
In terms of remote learning provision during this period, the government specified in January that schools were legally obliged to provide 3 hours of remote education a day for key stage 1, 4 hours a day for key stage 2, and 5 hours a day for key stages 3 and 4.[footnote 31] This explains why the amount of time students spent studying per day was higher in this phase compared to in phase 1, as is discussed later.
To summarise phase 3, policy remained the same throughout this period and schools were closed to most students. Many more students of critical workers or those who were vulnerable were in attendance compared to phase 1, and remote learning provision was likely to have been more extensive given the new legal requirement.
Phase 4 – 8 March to mid May
On 8 March schools reopened and attendance became mandatory again for all students. For the first week, secondary schools were given flexibility to allow testing and a phased return of students. Students who consented to testing were to return to school upon their first negative result. However, if a parent or their child did not consent, this did not prevent them from returning to school.[footnote 32] DfE guidance stated that from 1 April, all clinically extremely vulnerable children should attend school or college, unless they were under paediatric or other specialist care and had been advised by a clinician not to attend.[footnote 33] During this phase, 99.9% of settings were open.
Overall attendance rates were around 90% by the beginning of April. Compared to phase 0, when overall absence rates were around 4.6%, it appeared there was still more absence than during normal periods, although differences in the way absence and attendance rates were calculated affect comparability.[footnote 34] The phased returns in secondary schools meant that attendance steadily rose from 31% to 89% during the first week of this period. In primary schools during the first week back, attendance was the highest it had been since the start of the pandemic, at between 94 to 96%.[footnote 35] Following this, attendance in primary and secondary schools decreased slightly, but remained high at 92-93%, and 87% in early April, respectively (see Figure 2). By 20 May, attendance had continued to stay high at 94% in primaries and 87% in secondaries.[footnote 36] COVID-19-related absence rates in students increased from 1% in early March to 3.3% at the end of March, reducing slightly to 2.4% on 1 April[footnote 37][footnote 38]. These figures are lower than the COVID-19-related absence figures seen during phase 2 (4-13%).
Teacher COVID-19-related absence followed a similar pattern, with 1% of teachers and school leaders absent in early March, rising to 1.6% at the end of March, and reducing to 1.2% on 1 April[footnote 37], and 0.5% on 20 May[footnote 36]. Again, these are lower than that seen in phase 2 (4 to 5%), suggesting that overall fewer students and teachers were absent due to COVID-19 in this phase.
Regional and local authority level data from mid-February to early April published by DfE highlighted that while national attendance was around 90%, attendance was highest in the south-east and south-west (at around 92%) and lowest in Yorkshire and the Humber (around 86%)[footnote 37]. Areas with the lowest attendance generally had higher infection rates. There was also variation at local authority level, as will be discussed later.
To summarise phase 4, policy remained the same throughout this period and schools were open again with mandatory attendance. More students appeared to be attending school compared to in phase 2, however, there were still some regional variations in COVID-19-related absences depending on infection rates.
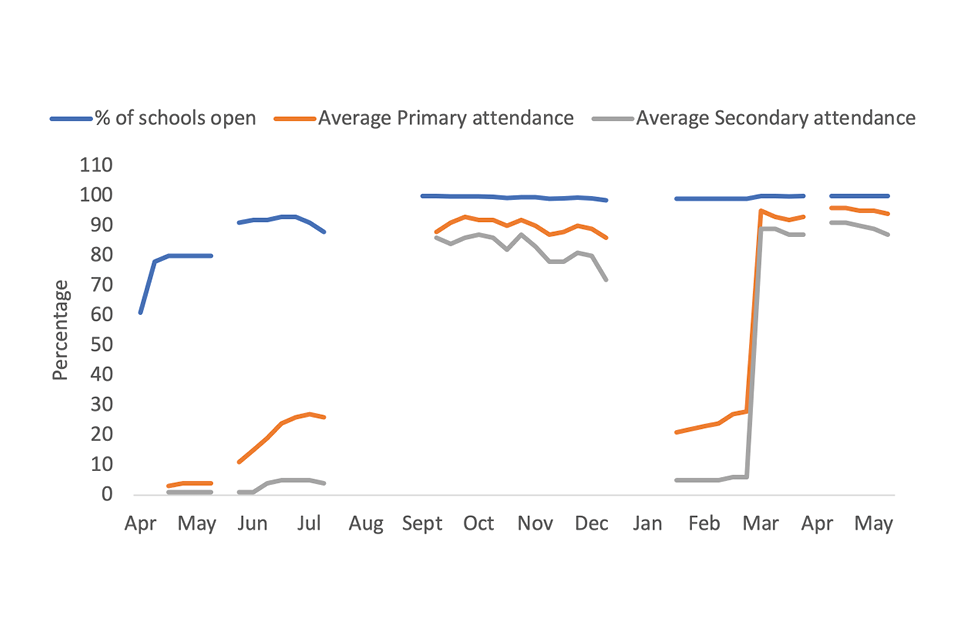
From Apr to July 2020 most schools were open, but attendance under 30%. Sept to Dec mostly all schools open, attendance above 70%. Jan to May 2021, most all schools open, attendance jumped from under 30% to more than 80% in March.
Instructional delivery modes
The aim of this report is to quantify how much time students in different circumstances have spent studying, or not studying, since the outbreak of the pandemic. Furthermore, because we are specifically interested in understanding the proportion of a traditional two year exam course that students may have spent learning, or not learning, we need to extend this analysis back to the beginning of the autumn term 2019.
Our biggest challenge, here, is to find an effective way of characterising the different circumstances under which students have learnt since autumn 2019; because these circumstances have varied from one phase to the next, and from one student to the next even within the same phase. As such, the very idea of ‘lost time’ will have different implications for students in different circumstances. For example, a big issue during phase 1 was how much face-to-face teaching time students in England were losing out on, while still ostensibly studying at home; whereas the big issue during phase 2 was how many days or weeks students in different regions of England were absent from school, potentially not studying at all. Because the significance of the ‘lost time’ narrative varies according to circumstance, we need to begin by distinguishing between a variety of different circumstances.
The most fundamental distinction of this sort concerns what might be described as the ‘instructional delivery mode’ that was in operation for any particular class of students, during any particular phase of the pandemic. We will define this as either traditional, remote, or new normal.
The traditional instructional delivery mode corresponds directly to phase 0 (autumn 2019 to early spring term 2020). This was business as usual as far as teaching and learning was concerned; as we understood these practices prior to the pandemic. For the vast majority of students in England, this would have meant whole-class-in-school tuition, with teaching provided by their regular class teacher. However, for home educated students, this would have meant tuition at home, with teaching provided by a parent or carer, private tutor, or both.
The remote instructional delivery mode was thrust upon schools during phase 1 of the pandemic. Classes were disbanded and the vast majority of students (from each class) were required to study at home. However, unlike the traditional mode, where students and their teachers worked alongside each other, so wereunder the same circumstances, students and teachers experienced quite different circumstances under the remote mode. On the whole, teachers were in school, and students were at home. However, some teachers delivered remote instruction from home, as they were self-isolating, or shielding. They may also have had to look after or home school their own children. And a certain number of students experienced ‘remote instruction’ in school, as children of critical workers, or as vulnerable children, who were permitted to attend during the school ‘closure’ period.
Finally, the new normal instructional delivery mode was engaged when schools returned to whole-class-in-school tuition during the course of the pandemic; for instance, during phase 2, from autumn 2020. Like the traditional mode, most students and their teachers worked alongside each other, and so were the same circumstances.[footnote 39] However, this was not necessarily so for all teachers or for all students. Some teachers would have continued to shield, continuing to deliver instruction remotely to classes of students in school. Others would have had to self-isolate intermittently. Equally, some students would have continued to shield, continuing to receive instruction remotely. Yet, this would have been a quite different kind of remote learning experience under this mode, with the majority of their classmates being taught in school. Likewise, some students would have had to self-isolate intermittently, again switching back to a different kind of remote learning experience.
To complicate the matter further, every now and again, a class that had returned to the new normal would have been sent home, if a class member had tested positive. This would have flipped the class back to the remote instructional delivery mode.
On the basis of this analysis, it should be clear that there is no universal mapping between pandemic phases and instructional modes. Even during phase 0, some schools were forced into the remote mode, before this was thrust upon all schools at the beginning of phase 1. However, it is fair to say that:
- during phase 1 (23 March to end summer 2020) and phase 3 (spring term 2021 to early March) all classes in all schools were required to implement the remote mode for most (if not all) of each phase
- during phase 2 (autumn term 2020) the vast majority of classes in the vast majority of schools implemented the new normal mode; although some classes in some schools were occasionally forced to flip back to the remote mode
- during phase 4 (early March onwards) almost all classes in almost all schools implemented the new normal mode
Consequently, we will simplify matters by characterising the:
- traditional mode in terms of learning time during phase 0
- remote mode in terms of learning time or lost time during phases 1 and 3
- new normal mode in terms of learning time or lost time during phases 2 and 4
These characterisations are also highlighted in Figure 1.
Different students in different classes in different schools will have experienced a different balance of learning time (and lost time) across these modes. More specifically, the fact that instruction was organised quite differently during different phases meant that different issues came to the fore. Fairly obviously, differential attendance rates were not a major issue during phase 1, when schools were officially closed to the vast majority of students. However, they became a major issue during phase 2, when schools were officially re-opened, yet differential infection rates led to differential attendance rates across the country.
Consequently, the dominant lost time narrative during phase 1 was not about attendance, per se, but about how much time different groups of students were spending learning while at home – a micro-level narrative relating to hours spent learning (or not learning) per day. There was also the higher-level lost time narrative concerning how much face-to-face teaching time learners (in general) had lost out on owing to school closures – a macro-level narrative relating to weeks spent learning (or not learning) per term. This was a less nuanced analysis, of course, because having lost X weeks of face-to-face teaching is not the same as having lost X weeks of learning; where learning is still happening remotely, albeit perhaps learning of a lower level of quality.
Conversely, the dominant lost time narrative during phase 2 was about attendance, and how the pandemic was affecting attendance rates differentially across the regions of England – a macro-level narrative relating to weeks spent learning (or not learning) per term. Again, though, being absent for X weeks is not necessarily the same thing as having lost X weeks of learning; depending on the reason for absence, for example serious illness vs. self-isolation. This emphasises why it is so tricky, yet also so important, to explore beneath the surface of any lost time narrative.
The following section identifies a number of macro-level lost time narratives, which arose during the different phases of the pandemic. And, in the subsequent section, a number of micro-level lost time narratives are outlined. We then attempt to illustrate the implications of these analyses by creating hypothetical scenarios for students in a variety of contexts.
Figure 3 provides a brief summary of macro and micro-level features of lost time since the start of the pandemic across remote and new normal modes. It also highlights some of the factors that were identified in the literature as being related to differential lost time, which are reviewed in detail in the sections that follow.
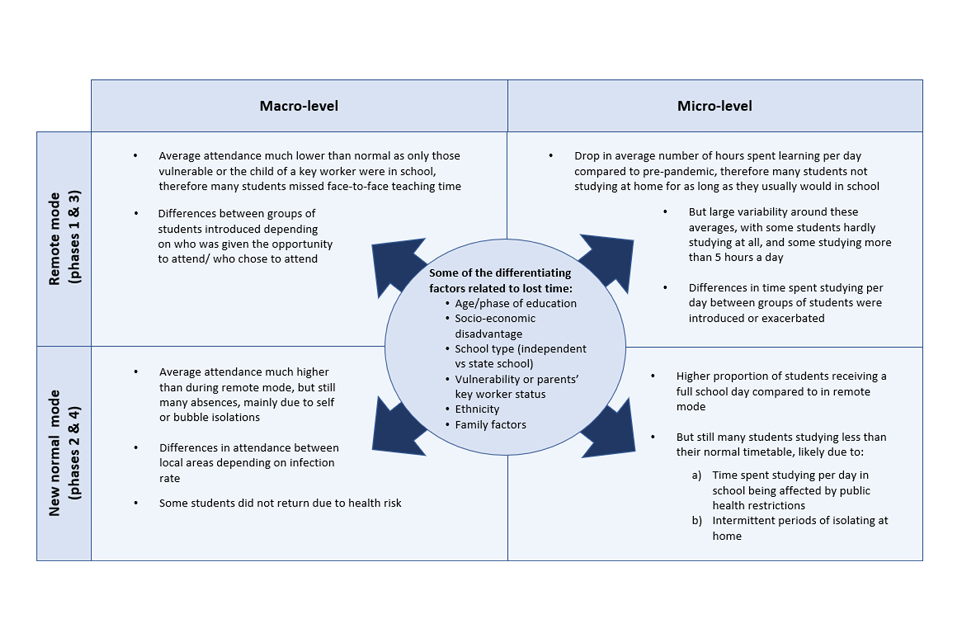
Figure 3: Summary of macro and micro-level features of lost time in remote and new normal modes, and some of the differentiating factors that were related to lost time. Note: The differentiating factors listed here were not mutually exclusive, and likely interacted with each other.
Macro-level lost time analysis
The first layer of complexity in the issue of lost time is the varying amounts of face-to-face teaching time received by students across the different phases of the pandemic on a broad scale, for example the number of days or weeks. We start by summarising some of the key findings from research which has explored attendance data across the three modes described in the ‘Instructional delivery mode’ section above.
Traditional mode
Under normal circumstances, there are 39 weeks (195 school days) in each year. Students spend 38 weeks (190 days) in school each year, and 5 of the 195 days are reserved for teacher training days. From the beginning of the school year in 2019, 25 weeks of traditional schooling elapsed before the announcement on 20 March regarding school closures in England. It is worth noting that some students may have gone into lockdown arrangements slightly earlier than others. Fourteen schools had already closed by 24 February, some due to students returning from Italy with COVID-19 symptoms[footnote 3]. There could potentially have also been some cases in schools that did not close prior to the announcement where individual students or their families had COVID-19, requiring them to self-isolate and therefore missing extra weeks of face-to-face learning.
Remote mode
In this section we will focus on the amount of face-to-face teaching time students lost during the main school closures in phases 1 and 3, and the variations in these amounts between students with different characteristics and in different circumstances.
Attendance statistics
During the first lockdown, schools were closed to most students for a period of around 14 weeks, although most remained open to children of critical workers and those who were classed as vulnerable. The attendance of students who normally attend school throughout the first lockdown was therefore very low compared to pre-pandemic, starting at around 3% in the initial week of lockdown, and gradually falling to around 1% at the time of the Easter break in mid-April[footnote 6]. This increased to approximately 3% after the Easter break in May, and 6 to 7%[footnote 40] when schools started to welcome back children from key year groups at the start of June[footnote 11]. By mid-July, an estimated 13.1% of students that would normally attend were in school (Roberts & Danechi, 2021). Primary schools were allowed to open to key year groups for a period of around 8 weeks, and secondary school settings were allowed to open to years 10 and 12 for a period of around 5 to 6 weeks before the end of term. However, even though schools were open to more students at this time, many did not attend and there were modified timetables and rota systems to accommodate social distancing measures for those who did, for example, secondary schools were often only open for part of the week or for half-day lessons (Andrew et al, 2020a; Department for Education, 2020).
When schools closed again on 5 January 2021 for a period of around 8 teaching weeks (phase 3), attendance of students who were allowed to attend (either as children of critical workers or those who were classed as vulnerable) ranged between a high of 15.9% and a low of 11.7%. Although it is difficult to compare attendance rates directly due to changes in the data collection methodology after 1 June 2020[footnote 38], these are higher attendance rates than those recorded in the first lockdown in spring 2020. This apparent increase in attendance from the first round of school closures to the second is supported by survey data collected through Teacher Tapp, which highlighted that of the children attending school during the second school closures, “less than half (47%) of them had been attending school during the first lockdown” (Montacute & Cullinane, 2021, p.3). This is likely due to more parents of critical workers sending their child to school in the second school closure period, and a change in criteria meaning that more children were eligible (as described in the chronology).
While the above statistics provide a broad overview of the proportions of students who received face-to-face teaching time throughout the periods of the pandemic when schools were closed to most students, they mask many variances at school and student level, which will be discussed below.
Vulnerable students and the children of critical workers
Although most schools were open all year round to vulnerable children and those of critical workers, not all students who met the eligibility criteria attended in person. For example, during the first lockdown from the end of March 2020 to the end of May 2020, although the proportion of children with EHCPs or a social worker attending school was higher than the national average it was still quite low (approximately 10%), increasing to a maximum of 28% in any one day at the end of term when schools were able to open to more students (Department for Education, 2020). Similarly, the National Audit Office (2021) illustrated that while the attendance of vulnerable children[footnote 41] generally increased from March to July 2020, only around one quarter of vulnerable children were in school or college by July 2020. Attendance of children in special schools was also low (for example in June it was 10%), despite being higher than the national average (around 7% in June)[footnote 11].
There could be a number of reasons for this, including parents or students choosing not to attend due to concerns about safety, and schools not being able to offer enough places to those eligible who wanted to attend. The latter may have been due to staffing issues and a lack of space to accommodate students because of social distancing measures, such as limiting the number of people per classroom. Reports in the media further highlighted cases of students with SEND (special educational needs and disability) who wanted to attend being denied access to school.[footnote 42]
As mentioned, overall attendance was higher during the second wave of school closures compared to the first lockdown. Taking a closer look at those who were in school in mid-February 2021, the proportion of students with an EHCP attending school was around 38% (Roberts & Danechi, 2021), the proportion of students with a social worker who were attending school at this time was around 44%, and the proportion of children of critical workers attending was around 69%. Again, attendance of children in special schools was higher (35% of students that would normally attend), compared to mainstream secondary schools which had the lowest attendance rate (5%).
Therefore, during these abnormal periods when most schools were closed to most students, although the attendance of vulnerable children who were allowed to attend school in-person was higher than the average attendance for all state-funded students, there was still much lower attendance compared to normal times. So we cannot assume that all those who were eligible to receive face-to-face teaching according to government criteria were receiving it.
Choices and opportunities to return
While it might appear that the key year groups who were allowed to return to school in June and July benefitted from this face-to-face teaching time, many parents who were allowed to send their child back to school chose not to do so at this point. It should also be noted that not all schools were open to these key year groups,[footnote 43] so not all of those who wanted to attend had the choice to.
Only around 30% of students from these key year groups did actually return to primary school, and 10% to secondary school, on any given day (Sibieta & Cottell, 2020). As mentioned earlier, the provision of schooling to these students was also patchy, and schools were often only open part-time, although this varied across schools (Andrew et al., 2020a). On average, around 54% of secondary schools were only open 1 day per week, and 16% were open 5 days a week. The length of the school day was also often shorter, with 39% of secondaries offering full-day classes.
Furthermore, there were inequalities within the group of students who did return. Students from Black, Asian and Minority Ethnic backgrounds were less likely to return to school in June and July, with 49% of students from a Black, Asian and Minority Ethnic background in attendance in July compared to 56% of all students who were in the eligible year groups (Sharp et al. 2020). Leaders from schools with higher proportions of students from Black, Asian and Minority Ethnic backgrounds were more likely to report that the reason for non-attendance was to a great extent due to parents’ safety concerns, compared to leaders of schools with no Black, Asian and Minority Ethnic students (Sharp et al., 2020). This could reflect responses to increased risks related to COVID-19 among people from ethnic minorities (Mamluk & Jones, 2020).
Attendance was also lower among students eligible for Pupil Premium, at 45% in July (Sharp et al. 2020). Survey data from June and July indicated that among the richest third of parents who were invited to send their child back, 80% did, compared to only 64% of the poorest third of parents (Andrew et al., 2020a). Similarly, among those who were not invited back to school, 62% of the richest parents said they would send their child back if given the opportunity, compared to 53% of the poorest parents. Although the authors stressed that parents appeared to be softening to the idea of sending their children back overall (compared to in May when asked about how likely they would be to send their child back), the differences between income groups remained.
Cattan et al. (2020) suggested some potential mechanisms of this gap. The most likely reason for parent’s reluctance to send their child back at the end of the summer term was the perceived health risk, especially in poorer families.
Cattan et al. (2020) also suggested that middle-class parents were more likely to be trying to work from home whilesupervising their child’s learning. Evidence supported this suggestion as accounting forlabour market experiences resulted in a reduction of the relationship between pre-pandemic earnings and likelihood of returning to school by one third (Cattan et al., 2020).
Phase of education
During the first school closures, and indeed throughout most of the pandemic, attendance rates of those allowed to attend school have been lower in secondary schools than in primary schools, perhaps because of the milder effects of the virus on younger children.[footnote 44] Given that some year groups (reception and years 1, 6, 10 and 12) were invited back to school in June and July in England, and students were sometimes sent home in bubbles the size of whole year groups, it is likely that there will have been further variation in attendance rates between year groups. For example, attendance of years 10 and 12 was 10% on 18 June (the week that these year groups were allowed back), compared to an overall attendance rate of 4% for secondary schools the same week. This increased and remained stable at around 13% in July.[footnote 45]
Partly taking into account the low attendance of year groups that were allowed to return and the fact that the provision of schooling they received was often only part-time, Sibieta and Cottell (2020) estimated the average number of weeks of lost face-to-face schooling by year group. They estimated that years 1 and 6 would have lost an average of 12 weeks of schooling by the end of the summer term, and other primary years would have lost 14 weeks. At secondary level, the average number of lost face-to-face teaching was 13 weeks for years 10 and 12, and 14 weeks for years 7 to 9. Sibieta and Cottell (2020) also took into account that years 11 and 13 who were due to take their GCSE or A-level equivalent exams in summer 2020 would have been on exam leave for some of the lockdown period, therefore relative to a normal year they will have lost fewer weeks of schooling than other year groups (an average 5 weeks of lost face-to-face teaching). However, as Sibieta and Cottell (2020, p.31) point out, few students will have experienced these averages, and “the actual weeks of schooling lost is likely to vary by individual due to different school policies and family choices”.
Socio-economic differences
Socio-economic differences in lost face-to-face schooling vary between the two periods of school closures. During the first lockdown, survey data suggested that there were higher proportions of children eligible for free school meals attending school than children who were not receiving free school meals (around 7% and 3%, respectively; Bayrakdar & Guveli, 2020). However, in the January 2021 lockdown when attendance overall was higher than in the first lockdown, more children from middle-class households were reportedly attending school (20%) than those from working-class households (16%) (Montacute & Cullinane, 2021). Almost half of a sample of parents who were asked about the reasons their child was in school in the January lockdown stated work-related reasons (Montacute & Cullinane, 2021). This suggests that more middle-class parents who were critical workers sent their child to school during the second round of school closures. Socio-economic differences in attendance when schools reopened, and in the amount of time spent studying at home will be discussed later.
New normal mode
In this section we will focus on the amount of face-to-face teaching time students received during phases 2 and 4 when schools reopened, and how this differed across students with different characteristics and in different circumstances. At the time of writing this report, there had been little research examining the most recent attendance data from phase 4. Nonetheless, the evidence which was available at the time are summarised here.
Attendance statistics
As the Children’s Commissioner for England (2020b) stated, the full re-opening of schools was largely successful in the early part of September 2020, when most schools opened to all students for whole-class, face-to-face teaching. However, although attendance rates were generally much higher at the start of the autumn term, towards the middle of October after half-term the situation began to change and attendance followed a general downwards trend, particularly in some regions as infection rates increased, tiering was introduced, and a national lockdown began. For example, average attendance rates of state-funded students decreased from between a high of 90.1% and a low of 86% between September to mid-October, to between a high of 89.6% and a low of 76.9% between mid-October and mid-December (Roberts & Danechi, 2021). COVID-19-related student absence rates increased from 4-5% in mid-October to 8to 10% at the end of November.[footnote 46] Therefore, broadly speaking, while students in some areas could potentially have received the full 14 weeks of face-to-face schooling in the autumn term, many will not have done. Some may have received around 5 to 8 weeks of face-to-face schooling before attendance became largely fragmented for at least the last 6 weeks of the autumn term, and others may have received much less than this.
The next time schools were open to most students was the 8 March 2021. Schools remained open until exam season would normally begin in mid-May, at the end of a 2-year course which started in autumn 2019. Therefore schools were open for 8 weeks to these students by the time they would usually have started their exams. DfE data published the week following the reopening of schools (16 March) indicated that attendance rates in state-funded primary schools was the highest it had been since the start of the pandemic, at between 94 to 96%. Attendance at secondary schools increased at a more steady pace since they were given flexibility to allow a phased return, with attendance on the 8 March at 31%, rising to 89% on 15 March[footnote 35]. Throughout the rest of March, overall attendance rates were between 90 to 91% (87- 89% in secondaries and 92- 93% in primaries).[footnote 47] In May 2021, attendance had remained high at 94% in primaries and 87% in secondaries[footnote 36]. Therefore attendance was largely more consistent and slightly higher than in phase 2.
Again, these averages mask many variances at regional, local authority, school, and student level, as are described below.
Vulnerable students
In the autumn term, the attendance of vulnerable students, including those with EHCPs or a social worker, was consistently lower than the average attendance for all students (Roberts & Danechi, 2021), for example in mid-November around 81% of students with an EHCP or a social worker were in attendance, compared to 87% for all students. Similarly, in the more recent ‘new normal’ period in March 2021, attendance of vulnerable students was lower than the averages for all students. For example, in mid-March attendance rates were 85% for students with an EHCP, and 82% for students with a social worker (compared to 91% for all students)[footnote 35]. It should be noted, however, that attendance of students with an EHCP and students with a social worker are typically lower than for other students in normal times.
Attendance of students in special schools was also lower than in mainstream schools during the autumn term (Roberts & Danechi, 2021). Following the 8 March reopening, attendance in special schools increased to 83% on 11 March, from 47% on 4 March, but remained lower than in mainstream schools[footnote 35]. Although attendance in special schools is typically lower than in mainstream settings, these differences may partly reflect decisions not to attend school due to anxiety or concerns about safety, given that students at special schools are more likely to have health conditions that make them more vulnerable to the virus. These types of decisions are discussed in the next section.
Choices and opportunities to return
We saw earlier that during June and July, not all parents who were allowed to send their child back to school decided to. There were also students who did not return in September when schools were open to all. Families still appeared to be anxious about the health risks, again, particularly in schools with higher proportions of ethnic minority students (Ofsted, 2020b), possibly because of the increased risks related to COVID-19 among people from ethnic minorities. The Ofsted interim visits in October also established that some students had not returned because they had gone to another country (sometimes their home country) and were either still there or were quarantining after their return. Some school leaders also reported that parents from Gypsy, Roma, and Traveller communities did not plan on returning their children to school until the pandemic had ended.
In the autumn, the DfE’s advice was that students who were formerly shielding or who lived with people who were shielding should normally attend school, but the exception was students who were clinically extremely vulnerable on the advice of clinicians (Roberts & Danechi, 2020). Ofsted’s interim visits in November confirmed that some students who were clinically vulnerable had not returned to school, and these families had likely faced difficult decisions having to balance the safety risks with the benefits of face-to-face schooling. Information from bodies representing children with SEND suggested the quality of the risk assessment process varied across schools, with some schools working collaboratively with families of children with SEND, and others conducting risk assessments independently of families (National Audit Office, 2021). This could have led to differences in whether families felt safe sending children with SEND to school.
Amanda Spielman, Ofsted Chief Inspector, commented on findings from the Ofsted visits that:
Children with special educational needs and/or disabilities (SEND) have also often struggled with the restrictions placed on them. These children were already less likely to attend full-time education than their peers and concerns about the pandemic has exacerbated this problem.
(Spielman, 2020)
Therefore, although some students who were shielding may have returned when schools were open in the autumn, students with SEND or those who were the most clinically vulnerable may have missed the most amount of face-to-face teaching time during this period.
Just before schools re-opened in March 2021 following the second round of school closures, a much higher proportion of parents overall said that they planned to send their child back on the 8 March (89% of parents, compared to 65% of parents in June and July) (Farquharson, _Krutikova, _Phimister, Salisbury, & Sevilla, 2021b). This is reflected by the high attendance rates described in the ‘Attendance statistics’ section of the new normal mode. In addition, the disadvantage gap between the richest and poorest families in the decision to return to school was narrower compared to in June and July, although a 7 percentage point gap between the most and least disadvantaged third of secondary school parents remained. Again, the key reason for not sending their child back to school among those parents who didn’t was the perceived health risk.
Absence for other reasons
As the Children’s Commissioner for England (2020b) indicates, there are gaps in our understanding of the absence data, as although we know overall attendance rates at a school-level and the reasons for COVID-19-related absences (including the proportions of students having a suspected or confirmed case of COVID-19, those isolating due to contact-tracing, and those in schools that were closed for COVID-19-related reasons), we do not know individual-level details about the students who were absent.[footnote 52] For example, are there some students who have been consistently absent for the whole period? How many of the students who were absent have a history of poor attendance?
The Children’s Commissioner for England (2020b) identified a possible 1 to 2% of students whose absence was ‘unexplained’ during the autumn 2020 term, meaning absence that was not COVID-19-related (such as due to other illnesses) but over and above the expected absence rate based on autumn 2019. The reasons for these absences are unknown, but the authors suggest they could be explained by parents deciding to withdraw their child from school to electively home educate them, or students who have simply ‘dropped out’ and refused to attend school. The latter is important because it suggests some students have disengaged from their learning completely during the pandemic.
Ofsted reported that almost half the 380 schools they visited in October had had at least one student being removed from the school roll by their parents since September to electively home educate them, almost always due to concerns about COVID-19, often in terms of transmission to vulnerable family members (Ofsted, 2020b). This rose to three fifths of the 297 schools Ofsted visited in November, with some parents stating that this was only temporary and they intended to return their children to school once ‘the pandemic is over’ (Ofsted, 2020c). However, it is potentially concerning that schools are not obliged to keep a student’s place free for them to return to at a later date (Roberts & Danechi, 2020), therefore these students might experience further losses of face-to-face teaching.
Phase of education
Although we know that absence rates were generally higher in secondary compared to primary schools, Sibieta and Robinson (2020) highlighted that we know very little detail about how attendance varied by individual year groups in the autumn term in England, as the DfE were not collecting or publishing this data. Attendance data from Scotland and Wales, however, showed that year 11 students had the lowest attendance rates. Estimations have also been made in England, for example, using data collected from around 1300 schools, Bibby, Plaister, & Thomson (2021) indicated that within secondary schools, older year groups missed more schooling in the autumn term, with years 10 and 11 missing an average 16% of school sessions, while year 7 missed an average 10%. The authors emphasise that these are averages, and there were around 40 schools where the absence rate for year 11s was over 32% in the autumn, and around 150 schools where it was only 8%.
In another study, using estimations of the average number of lost days of face-to-face teaching during the autumn term, after accounting for average pre-pandemic absence rates, the Children’s Commissioner for England (2020a) found that primary school children had lost an average 3.5 days in the autumn, while secondary schools had lost 6.3 days. However, taking a closer look at the regional data underlying these averages, variation can be seen across local authorities, with a few parts of the country where primary school children had lost more than 6 days (for example in Birmingham and Manchester), and many areas where secondary school children had lost more than 10 days (for example Rochdale, Oldham and Sandwell), which is much higher than some rural areas where the average number of days lost relative to pre-pandemic levels was only 4 days (Sibieta & Robinson, 2020). Regional variations are expanded upon in the next section.
Regional variances and socio-economic differences
In the autumn, attendance was generally lower in urban areas and higher in rural areas, and lower for more disadvantaged areas compared to less disadvantaged areas. But regional and socio-economic differences in attendance are a nuanced matter, with variation both across and within regions. In their analysis of the attendance data published by DfE, Burgess et al. (2020) firstly compared infection rates with secondary school attendance data by region and found that, as expected, attendance tended to be lower in regions with higher infection rates. For example, secondary school attendance was lower in the north-west, north-east and Yorkshire and the Humber regions in mid-October when these areas had the highest infection rates.
However, within these regions, there was considerable variation between different local authorities, so that even within the regions with the highest infection rates, there were still some local authorities with over 90% attendance. In addition, in regions with the lowest infection rates at the time, such as London, there were some local authorities with an attendance rate of less than 70%. This highlights how on the surface, a student in the north-west who lived in a local authority with low attendance could conceivably have missed more schooling in October than a student in London who lived in a local authority with high attendance, but they could also have missed the same amount, or even less schooling, than a student in London who lived in a different local authority with low attendance.
Some initial insights into regional variations from phase 4, when schools were reopened again after the second national closures, have recently been identified. For example, towards the end of March attendance was highest in the south-east and south-west (at around 92%) and lowest in Yorkshire and the Humber (around 86%). As with in the autumn, areas with the lowest attendance generally had higher infection rates. At local authority level, the proportion of secondary school students who were self-isolating ranged between zero in some areas to 13.8% in Thurrock, 10.8% in Hull, and 8.2% in Barnsley, the East Riding of Yorkshire and Bolton.[footnote 48]
While these examples present a picture of the variation at local authority level, Burgess et al. (2020) point out that the variation at school level is likely to be much higher. We can reasonably expect that two different schools within the same local authority could have significantly different amounts of student absence, for example, due to the size of the groups they had to send home to isolate, as will be discussed later.
To complicate matters even further, the regional averages presented by Burgess et al. (2020) on the 15 October had changed significantly by the 10 December, as a new variant of COVID-19 caused a spike in infection rates in areas which had previously had lower infection rates, such as London and the south-east of England. This meant that average attendance rates in these areas dropped significantly compared to the beginning of the autumn term (Nye, Thomson, Plaister, & Burgess, 2020). By early December, the lowest attendance rates were in London and the south-east (Roberts & Danechi, 2021).
Although Nye et al. (2020) confirmed a strong relationship between infection rate and attendance, they also highlight that infection rate is not the only factor influencing attendance, as there is still considerable variability in attendance even across local authorities with similar infection rates. For example, although Nottingham and Northumberland had similar infection rates, Nottingham had an average of 73% attendance for secondary students, and Northumberland had an average of 89%.
One factor found to influence attendance is level of socio-economic disadvantage. Using the proportion of students in a local authority who are eligible for free school meals (FSM) as a measure of disadvantage, Burgess et al. (2020) found a very strong relationship in October between disadvantage and attendance in the north-west, with areas of high disadvantage showing lower attendance rates. This relationship was found in other regions too (but not in all regions).
The Children’s Commissioner for England (2020a) also demonstrated this relationship. They highlighted that local authorities with higher FSM proportions were seeing more days of missed classroom teaching per student. Bibby et al further found that disadvantaged students missed 50% more sessions than other students in the autumn. However, the relationship observed by Burgess et al. (2020) had almost disappeared by December, when attendance even in less disadvantaged areas had dropped. This suggests that some students in more disadvantaged areas may have lost more in-person school time than students in less disadvantaged areas in the early part of the autumn term, but by the end of term students in less disadvantaged areas were also experiencing a higher rate of absence. For year 11 specifically, Bibby et al.’s findings indicate that there was a disadvantage gap in absence rates across the autumn term in all regions of England (with disadvantaged students showing higher absence rates), except in London towards the end of term where the infection spike occurred. Thus the relationship between attendance and socio-economic disadvantage is also complex, and varies over time.
More recently, attendance statistics for children eligible for free school meals during phase 4 were published by the DfE. The proportion of students eligible for free school meals attending school was 87% in March, dropping slightly to 85% in early April. This is lower than the attendance rate of all students during the same period, which was around 90 to 91%. Attendance of students eligible for free school meals is typically lower than for other pupils, for example, in the 2018 to 2019 academic year the absence rate of those eligible for FSM was 7.5%, compared to 4.2% for all pupils[footnote 3]. However, as previously mentioned, it is difficult to directly compare absence and attendance data from before and during the pandemic due to differences in the way they were calculated. Further research interrogating this data may be published in due course, which will help understand how the disadvantage gap in attendance was impacted during phase 4.
Areas that have historically had poor educational outcomes also appeared to have lower attendance rates. For example, Sibieta and Robinson (2020) show that broadly, students in areas with lower prior GCSE results, such as Knowsley, Oldham, Rochdale and Sandwell, had experienced more days of lost schooling. However, this relationship is not perfect as there are also areas with low prior GCSE results who did not miss any more days of school than areas with high prior GCSE results (eg, Isle of Wight).
As Sibieta and Robinson (2020, p.7) conclude, inequalities in education caused by the pandemic are “hard to predict based on broad individual or area-level characteristics”. This is because there is much variation in lost schooling time between students due to interactions between factors such as disadvantage, region, or prior educational outcomes. Even when we examine local infection rate, the relationship with absence has changed over time, and does not hold for all areas with similar infection rates. Some schools managed to keep attendance levels high despite high rates of COVID-19 in their local community (Children’s Commissioner for England, 2020a). One potential reason for this is the different sizes of bubbles schools were sending home when there was a confirmed case, as is discussed in the next section.
Reasons for absences
While infection rates were rising in the autumn term, social isolation measures disrupted students’ time in school. According to Teacher Tapp survey data, by mid-November just 36% of teachers reported that their school had been fully open to year 11s all term (Montacute & Cullinane, 2021).
Detailed information on the different reasons for COVID-19-related absences started to be collected by DfE in October. In December, around 9-11% of students were absent from school for COVID-19-related reasons. This included only 0.5% of students who had a suspected case of COVID-19, and 0.2% who had a confirmed case. The largest share of COVID-19-related absences (7 to 8%) represented students self-isolating due to a potential contact. And 1.7% of students were absent because they were from schools that were closed due to COVID-19-related issues (Roberts & Danechi, 2021). Therefore, as the Children’s Commissioner for England (2020a) emphasised, only a small proportion of the children missing school because of COVID-19 actually had the virus, and would likely not have been able to study due to illness. Most were self-isolating due to being in contact with a confirmed case and were therefore expected to continue studying at home.
Across the autumn period, the number of schools sending more than one student home to self-isolate increased sharply in the weeks following October half-term (Roberts & Danechi, 2021), apparently reflecting rising infections. COVID-19-related absences then fell during the November lockdown, but rose back up to 11-13% by the end of term (Sibieta, 2021a). But within this, the disruption caused by bubble closures appeared to affect state schools more so than independent schools. Teacher Tapp survey data in November revealed that 33% of teachers from state schools said their school had been fully open to year 11s so far that term, while 51% of teachers from independent schools said the same. Furthermore, the most disadvantaged schools were more likely to have had a whole year group or bubble closure in year 11 (Montacute & Cullinane, 2021).
The amount of face-to-face teaching lost due to bubble closures in the autumn varied across schools because schools were sending different size groups home to isolate, with larger groups being sent home in primary school than in secondary school (a median of 29 students per confirmed case in primary schools, and 23 in secondary schools)21. When Ofsted conducted interim visits to schools in the autumn, they reported that the average number of days students were reportedly sent home to isolate for was 9.5 (Ofsted, 2020b, 2020c). The numbers of students being sent home to isolate were most commonly between 15 and 80, but there were some cases where much larger groups were being sent home (for example over 400 students in some secondary schools where more than one year group had a confirmed case).
The Children’s Commissioner for England (2020a) analysis indicated that most local authorities were sending bubbles of between 25 and 50 students home per confirmed case, but there was a large amount of variance across local authorities, and in some areas over 100 students per confirmed case were isolating. Therefore one of the drivers of attendance in the autumn was how well schools were resourced and able to respond to confirmed cases, in terms of their approach to contact tracing. Some schools were developing better tracking systems so that they could send smaller bubbles home rather than whole year groups, and some schools had been virtually unaffected by bubble closures (Ofsted, 2020c).
As well as students being sent home to isolate, around 4 to 5% of both primary and secondary teachers were absent for COVID-19-related reasons in the autumn (Sibieta, 2021a). By comparison, it appeared fewer teachers were absent in March 2021 (between 1 to 2%). The proportions of absences due to confirmed cases in the autumn were higher in teachers than students, while in students the main driver of absence was isolation due to being in contact with a confirmed case. These teacher absences likely caused staffing issues at some schools, resulting in some school closures. For example, in November and December, 0.5 to 0.8% of the students absent from school due to COVID-19-related reasons were unable to attend because their school had had to close, whereas in March 2021, this figure was smaller at 0.1%, corresponding to lower teacher absences during this period[footnote 33].
Micro-level lost time analysis
So far we have discussed broad quantities of time students spent studying under different arrangements in terms of days or weeks. But there have also been differences between students in terms of how many hours they spent learning within a school day. In this section we discuss evidence collected about the number of hours students in different circumstances typically spent studying per day throughout the course of the pandemic. Most of the research to date has focused on the first lockdown, with some minor insights from the autumn term. Much less evidence is yet available about the impact of the second school closures, or the ‘new normal’ arrangements students have experienced since schools reopened on 8 March.
Traditional mode
To put things into perspective, in a normal school day pre-pandemic, the number of hours students typically spent learning was approximately 6 hours per day (including breaks) plus additional time on homework (Andrew et al., 2020c).
Remote mode
In this section we will focus on the amount of time per day students spent studying during the main school closures in phases 1 and 3. Many surveys have been conducted, mainly with teachers and parents, to collect self-report data about the number of hours students were spending studying at home during the first round of school closures (phase 1).
Average hours per day
Based on the results of these surveys, there are various estimates of the average number of hours students spent learning. From the Understanding Society survey data taken 1 month into lockdown, Green (2020) and Pensiero, Kelly, and Bokhove (2020) calculated that between 2.5 to 3 hours a day were being spent by students on online or offline schoolwork. Findings from other surveys have found similar averages, such as the Public First and Sutton Trust surveys of parents taken in April which found an average of just over 3 hours a day (Cullinane & Montacute, 2020) and an ONS study using ‘Opinions and Lifestyle Survey’ data which reported an average 13 hours per week (Williams, Mayhew, Lagou, & Welsby 2020). Penington (2020c) also reported that the most common amount of time spent on schoolwork in April 2020 was 2 to 3 hours a day for teenagers, and 1 to 2 hours for young children.
In contrast, higher-end estimates have been made by Cattan et al. (2020) and Andrews et al. (2020b), who asked parents to fill in online diaries about their child’s time use and the activities that fill their learning time. Andrews et al. (2020b) calculated an average 4.5 hours per day being spent on schoolwork at home between April to June 2020, which is a 25% reduction for primary and 30% reduction for secondary students compared to normal times. Cattan et al.’s (2020) study observed an initial drop in learning time in secondary students from 6.5 hours to 4.6 hours immediately following school closures, which did not improve across the following 4 months of lockdown.
Other studies include Elliot Major, Eyles, and Machin (2020) who also examined data from the Understanding Society survey in April. They treated those in school (for example who had a critical worker as a parent) and those who spent more than 5 hours per day on school work as having a ‘full school day’. They found that just under 4 in 10 students, or 38%, had full school days during the first lockdown. By converting hours spent on schoolwork into percentages of a full school day, Elliot Major et al. (2020) estimated that on average, students were receiving around 42% of their normal schooling time during the first lockdown.
Given that schools partially reopened in June and July, an overall increase in learning time might have been expected compared to earlier in the lockdown. However, Cattan et al. (2020) found that it actually dropped slightly overall, by an estimated 20 minutes per day. This was largely driven by a drop in learning time by those who were not offered the chance to return to school, as is discussed later. Schools were also not operating normal timetables for those who attended in-person in June and July, as a ‘Parentkind’ survey highlighted. This survey indicated that only 12% of children who were going in to school were there for the same number of hours as before the lockdown, and 83% were there for fewer hours than they were before the lockdown (Parentkind, 2020a), although we don’t know how much time these children were also spending studying at home in addition to the time spent at school.
Later, during the second school closures in January 2021, average learning time was much higher than during the first lockdown and school leaders reported that 75% of students were attending most of their live lessons (Nelson, Andrade & Donkin, 2021). Montacute and Cullinane (2021) examined survey data from teachers (Teacher Tapp) and parents (YouGov) in January and found that the proportion of students spending more than 5 hours per day on learning increased from the first to second school closures from 11% to 23% in primary school children, and from 19% to 45% in secondary school children. Survey data from Parent Ping collected between January to March supported this, with findings showing that just over 50% of parents of secondary school students said their child was spending more than 5 hours per day studying. Although this reduced to around 30% by early March, it is still a higher proportion than during the first school closures. This could partly be explained by the government’s introduction in January 2021 of a legal requirement for secondary schools to provide 5 hours of remote learning. Therefore many of the findings discussed in this section relating to the first lockdown (phase 1) may not be generalisable to phase 3.
There are differences in the reported average numbers of hours spent learning between survey studies because different methodologies and sampling methods have been used. In Andrew et al.’s (2020b, 2020c) studies, UK Time Use Survey data was used in which parents were asked about their child’s activities for each hour of the day in real-time, which may be considered to be more reliable than relying on recall estimates. However, parents could have reported multiple activities within 1 hour, and we cannot know how long was allotted to each activity within that hour, whether it was 10 minutes, or nearly the full hour. Therefore, these higher-end estimates of around 4.5 hours per day could be overstated.
In addition, some surveys were conducted across the UK (for example Understanding Society survey, ONS Opinions and Lifestyle Survey, and PublicFirst-Sutton Trust survey of parents), while others were in England only (eg, Andrew et al., 2020b, 2020c). Some have also been weighted to provide a representative sample of either the UK or England (for example Williams et al., 2020; Andrew et al., 2020b, 2020c), while others were not and may not reflect the national picture as they were opportunistic samples (for example Parentkind, 2020a, 2020b). The calculated averages of the time spent learning based on surveys not limited to England may have been influenced by different policies across different parts of the UK. For example, in the summer there were different re-opening policies in Wales and England (Sibieta & Cottell, 2020).
Students studying for zero or less than 1 hour a day
Within the research about average number of hours spent learning per day, there were also examples of students who did very little or no schoolwork at all while they were at home. For example, Office for National Statistics (ONS) survey data suggested that between 1 in 10 to 1 in 6 parents disagreed or strongly disagreed that their child was learning at home throughout April and into May (Department for Education, 2020). Other estimates suggest higher proportions, for example, from their analysis of the Understanding Society survey dataset which was collected during the first lockdown, Green (2020) reported that around one-fifth of all children (19.6%) were spending zero or less than an hour per day on schoolwork, and Elliot Major et al. (2020) reported that a quarter of students had no schooling or tutoring.
However, these figures represent averages for students of all ages, but only around half of year 11 and 13 students had been provided with school work in April, compared to nearly all year 10 and 12 students (Eivers et al., 2020). This is unsurprising given that exams had been cancelled for year 11 and 13 students. We were interested in particular in years 10 and 12 (now years 11 and 13), who are due to take their assessments in summer 2021. Therefore Green’s suggestion that one fifth of all students were doing no schoolwork is perhaps higher than we would expect for our year groups of interest, because it included students who were not doing schoolwork as they no longer had exams to prepare for.
Eivers et al. analysed the same survey responses that Green analysed, but broken down by primary and secondary school age, and found smaller proportions of students studying less than 1 hour per day than Green did (7% of secondary students and 13% of primary students). This inconsistency between different analyses of the same dataset are likely explained by the fact that Eivers et al.’s results referred to a subset of students who had been set work to do at home by their school (based on a ‘routing’ question), and therefore didn’t include those who were not given any schoolwork. However, as mentioned above, there were only a small proportion of students in years 7 to 9 who did not receive any schoolwork (around 2%) and almost none in year 10. So if we were to estimate the proportion of years 7 to 10 who were spending zero or less than 1 hour a day studying, including both those who had and had not been set schoolwork, we would expect this to still be around 10% or less.[footnote 49] This is supported by the results of a different survey of secondary school students in years 7 to 10, which showed that around 10% of students reported they were spending less than an hour on schoolwork on an average day (Pallan et al. 2021). Within this, 1.4% were spending no time at all on schoolwork and the remainder were spending up to 1 hour. This 10% figure appears to include those who were not set any work by their school.
However, we should certainly should not dismiss the importance of this minority who appeared to completely disengage from their learning in the first lockdown. It is also important to highlight that differences in those who reportedly did no schoolwork at home have also been found between the most and least disadvantaged students. For example, Teacher Tapp survey data showed that within state-funded schools, 27% of teachers in the least-deprived schools thought their students were learning less than an hour per day, compared to 57% of teachers in the most deprived schools (Roberts & Danechi, 2021). Eivers et al. (2020) findings also showed that a larger proportion of primary school students from lower-income families were spending less than an hour per day studying, compared to those from higher-income families (15% and 10%, respectively). There was little difference between secondary school students from the lowest and highest income families (5% and 6% respectively), but greater differences were observed in those studying for more than an hour per day studying, as is discussed later in the ‘socio-economic differences’ section.
Variations within averages
The averages described in the ‘Average hours per day’ section above mask substantial variations between individual students in their total learning time per day. Penington (2020) highlighted that there was a large spread in the distribution of time reportedly spent on learning. For example, in addition to those spending zero or less than an hour per day studying (as described above), there were also an estimated 1 in 10 teenagers studying more than 5 hours per day.
When schools opened to priority year groups in June, variability in learning time between students who did and did not return to school in this period were introduced. Cattan et al. (2020) findings indicated that primary school students who returned experienced substantial increases in learning time, while secondary school students who returned did not, likely because they were only in school 1 to 2 days a week, as per government guidance to provide ‘some contact’ to students in exam years. But of course not all children who were offered the chance to return to school in person did actually return, and interestingly, there were differences between students within the group who remained at home based on whether they had the opportunity to return or not. Those who had the opportunity but chose not to return to school did not experience any notable drops in learning time per day, while those who were not offered the chance to return experienced the biggest drop in learning time from May to July (almost 50 minutes per day in secondary school and 35 minutes in primary). Cattan et al. (2020) hypothesised that these differences may be explained by those who chose to stay at home starting to dedicate more time to their learning in order to keep up with their peers who were in the classroom. Or perhaps they benefitted from teachers live-streaming lessons they were teaching in-person to those who were in school.
Given that there were drops in learning time in some students throughout the first lockdown, and the amount of school provision received by students, on average, did not appear to change overall, Cattan et al. (2020) concluded that overall students did not appear to “settle in” to home learning over the course of the first lockdown. Between May and June, 52% of parents reported their child was struggling to continue their education at home. The most common reason for this was a lack of motivation, followed by a lack of guidance or support (Williams et al., 2020). However, there were changes experienced by individual families. For example, 16% of students gained access to online lessons, and 17% of students lost access (Cattan et al., 2020). This could reflect frequent changes made by schools as they adjusted their strategies according to parent or student feedback, and in response to changes in teacher capacity.
Another consideration is how much time the students who were going into school throughout the school closures were studying (the children of critical workers and those classed as vulnerable). Were these students studying at school for as many hours per day as they were before the pandemic? The findings from one survey suggested that many students were not. This survey took place in April 2020 and asked teachers how many hours per day students were being taught in school. Only 29% said they were being taught more than 5 hours per day, and 21% were being taught for 3 to 5 hours per day. Around 22% answered “none – we’re offering childcare”.[footnote 50] We can speculate that the reasons for these reduced hours could be due to safety restrictions to allow social distancing, such as altered start and break times, as advised by DfE. Attendance data also suggested that there was variation in attendance according to the day of the week, which probably reflects modified timetables implemented by schools in order to keep teachers and students safe (Department for Education, 2020). Therefore in-school provision for those eligible to attend almost certainly differed from what students usually received.
There are other important findings about how the amount of time spent learning by students varies according to other factors, such as gender, ethnicity, socio-economic status, or parental characteristics, which are summarised below.
Region
In April 2020, the regions where children appeared to be spending the most amount of time on their schoolwork were London, the south and the east of England (Green, 2020), where 22to 25% were spending 4 or more hours per day learning, compared to 15% in Wales, Scotland, the Midlands and northern England (Sibieta & Cottell, 2020).
Gender
Girls spent significantly more time learning per day than boys in April 2020 (Bayrakdar & Guveli, 2020), with 58% of boys and 70% of girls spending 2 hours or more a day doing their schoolwork. Furthermore, 20% of girls spent 4 or more hours on schoolwork while only 14% of boys did. However, Green (2020) stated that this gender difference also exists in normal times.
Special educational needs and disabilities
A Parentkind survey in August with parents of children with SEND found that of those whose children had been welcomed back to school in the summer, 30% reported their child was spending fewer hours in school than prior to the first lockdown, and 16% were spending the same number of hours in school as prior to lockdown (Parentkind, 2020b). Therefore being in school did not compensate fully for the amount of learning time students with SEND would have spent learning prior to the pandemic.
Ethnic background
Using the Understanding Society survey dataset, Bayrakdar & Guveli (2020) examined the amount of time children who were not in school were spending on schoolwork during the first school closures. They found striking differences between ethnic groups at primary and secondary school level, but not at higher secondary level (key stage 5), where there were only minor differences. At both primary and secondary school, children with Pakistani or Bangladeshi backgrounds spent the least amount of time learning at home (2.4 hours at primary and 3 hours at secondary), compared to the ethnic groups who spent the most average amount of time learning (3.5 hours in children from Black-Caribbean or Black-African backgrounds at primary school, and 4.3 hours in children from Indian backgrounds at secondary school). Children with Pakistani and Bangladeshi backgrounds were also less likely to receive distance teaching provision, which could explain why they were spending less time learning.
Indeed, Bayrakdar and Guveli (2020) found that schools’ distance learning provisions (including online, offline and checking of homework) significantly increased the time children spent learning at home, and fully explained the learning gap between children with Pakistani and Bangladeshi backgrounds and their peers. Another finding was that across all ethnic groups and school phases, children with Black-Caribbean or Black-African heritage spent the highest average number of hours on schoolwork.
Using the same Understanding Society dataset, Green (2020) found that Asian children were receiving more offline schoolwork, and slightly more online schoolwork than other children, but the time spent on homework overall did not differ. These findings appear to contradict Bayrakdar and Guveli’s (2020), but this is likely due to differences in how ethic groups were categorised between the two studies. For example, Bayrakdar and Guveli’s study defined 5 ethnic groups as: ‘White’, ‘Pakistani or Bangladeshi’, ‘Black-Caribbean, Black-African’, ‘Indian’ and ‘Other (which included any children from mixed backgrounds, Chinese or any other Asian background), while Green (2020) defined 4 ethnic groups: ‘Black-Caribbean-African’, ‘Mixed, Other’, ‘White’, and ‘Asian’. Therefore Green’s findings appear to be masking the differences identified by Bayrakdar and Guveli between Pakistani and Bangladeshi students compared to other students, as their broader ‘Asian’ category also included Chinese and Indian students.
Phase of education
On average, the amount of time students in different phases of education spent learning at home has differed, with students in secondary schools generally studying longer hours than those in primary school. Prior to the first lockdown, secondary school-age children typically spent more hours per day learning than primary-age children, but this decreased to a greater extent for secondary school students (by almost two hours a day) than for primary school children (90 minutes) during the first lockdown Andrew et al. (2020b).
The Understanding Society survey data also illustrated that secondary school students spent significantly more time on home learning during the first lockdown than both higher secondary school (Key stage 5), and primary school students (Bayrakdar & Guveli, 2020). For example, 28% of secondary school students spent 4 or more hours on schoolwork per day, while 23% of those in post-16 education, and 12% of primary school children did (Benzeval et al., 2020). This analysis does not distinguish between post-16 students doing A level courses and post-16 students doing other courses, such as those more vocational in nature, which may be an important differentiator. As Report 4 in this series highlights, there is little research about the nature of learning losses in vocational and technical qualifications, but remote learning will have been particularly difficult for courses with more practical elements, therefore potentially affecting quantities of time spent studying them.
Using a Public First-Sutton Trust survey of UK parents in April, Cullinane and Montacute (2020) found higher proportions of students studying for more than 4 hours a day than Bayrakdar and Guveli’s (2020) findings suggested (35% in primary school and 47% in secondary), but the proportional difference between primary and secondary was similar. Later, in an ONS survey taken between May and June, the average number of hours per week spent studying was 10 hours for primary school age students, and 16 hours per week for secondary school (Williams et al., 2020). The differences between phases of education also vary between the most and least disadvantaged children, as discussed in the next section.
Socio-economic differences
One of the most prominent areas of research into time spent learning at home is that which focuses on differences between socio-economic groups. Andrew et al. (2020b) found that during the first lockdown, total time spent learning was significantly lower than it was in previous years for all socio-economic groups. But this overall decline disproportionately affected the most socio-economically disadvantaged students, compared to the least disadvantaged (Halterbeck et al., 2020). This is likely to be due to factors such as the digital divide resulting in difficulties accessing live online lessons, home environment, and a strain on teaching time in the most deprived areas. These issues are discussed further in Report 4 of this series.
In a normal school year there are usually some differences in the amount of study time between more and less disadvantaged secondary school students. In 2014-15 for example, the average number of hours per day in secondary school children was approximately 7.1 for families in the highest quintile of earnings, and 6.2 hours for families in the lowest quintile. In primary school children, however, there was no gap in learning time between the highest and lowest income groups prior to lockdown.
Halterbeck et al. (2020) compared the figures from 2014 to 15 described above to an average 5.1 hours being spent on learning by secondary school students in the highest earning families during the first lockdown, and 3.9 hours in the lowest earning families, representing declines of 27% in the highest earning, and 37% in the lowest earning families. A gap of 1 hour per day had also been introduced in primary school children.
Overall, although the change from pre-lockdown was bigger for primary school children, the gap was still more pronounced for secondary school children, mostly driven by gaps in the time spent on independent study or other educational activities outside of online classes, including private tutoring. In primary school children the gaps were mostly driven by differences in class time, but interestingly children in the poorest families spent more time on ‘other educational activities’ than those in the richest families, possibly to compensate for the reduced class time provided by their school (compared to their richer peers).
A number of studies which analysed the Understanding Society dataset highlighted the discrepancies in time spent studying between the most and least disadvantaged students throughout the first lockdown, based on measures such as free school meal eligibility or family income. For example, Green (2020) found that 11% of students eligible for free school meals were completing more than 4 hours per day on schoolwork, while 19% of those not eligible were completing this amount.
Bayrakdar and Guveli’s (2020) analysis of this dataset confirmed findings that children in primary and secondary schools who were eligible for free school meals were, on average, not studying at home for as long as their peers who were not eligible for free school meals. But one exception to this were the oldest children in higher secondary level (key stage 5), where those eligible for free school meals were studying for longer than their non-eligible peers (on average 3.5 hours per day compared to 3.2 hours per day). The authors suggest perhaps this represented the “more industrious children who made it to that level”. In their regression model, Bayrakdar and Guveli found that taking school’s provision of distance learning into account reduced the negative impact of free school meal eligibility on learning time by half.
Eivers et al.’s (2020) analysis of the same Understanding Society dataset highlighted the difference between level of family income, where 23% of secondary school students from low-income families were reportedly studying more than 4 hours a day, and 47% were studying less than 2 hours a day. This compared to 41% of secondary school students from high-income families who were spending more than 4 hours a day studying, and only 13% spending less than 2 hours a day studying. Although, it should be noted that there was considerable variation within each income group.
Other studies have translated average hours into number of school days across the first lockdown period, and estimated that children in the richest fifth of families might have spent over 7 full school days worth of time more on their learning by the end of May (Andrew et al. 2020c). Up to July this was predicted to increase to a difference of 15 days schooling between high- and low-income families, or 75 minutes per day (Sibieta & Cottell, 2020).
Interestingly, when schools partially reopened in June 2020, among those who were not offered the chance to return, richer students decreased their study time compared to earlier in the lockdown, resulting in a narrowing of the gap between them and their poorer peers, perhaps because less time was spent on private tutoring overall. However, Cattan et al. (2020) concluded that overall, the inequalities between socio-economic groups appeared to deepen in June and July. This is likely because better-off parents were approximately 50% more likely to send their child back to school when offered the opportunity, and therefore benefit from the increased study time associated with being in school, than less well-off parents. In addition, among those who chose to return, better-off children increased their learning time by more than the amount poorer children did.
In the second wave of school closures in January 2021, although learning time had increased overall for all students compared to the first lockdown, a disadvantage gap remained. For example, 40% of students from middle-class families were spending more than 5 hours per day learning, while only 26% of students from working-class families were (Montacute & Cullinane, 2021).
Independent versus state schools
In the first lockdown, differences in remote learning time between students in state and independent schools were observed. For example, findings from a Teacher Tapp survey included that the proportion of independent school teachers who thought that students were learning less than one hour per day was 13%, while 42% of state-funded school teachers thought the same (Roberts & Danechi, 2021). Students in independent schools were also twice as likely to be spending more than 5 hours per day on learning than those in state schools (Cullinane and Montacute, 2020). Green (2020) reported similar results from their analysis of the Understanding Society survey dataset from April, which showed that approximately half of independent school students reportedly spent more than 4 hours on schoolwork at home, while only 18% of state schools did.
Using the same Understanding Society dataset, Elliot Major et al. (2020) reported that while 74% of independent school students were receiving full school days during the first lockdown, only 38% of state school students were, and that independent school students were 4 times more likely to spend more than 5 hours per day on schoolwork. This difference remained after controlling for parental income, suggesting being in an independent school itself provides the advantage of increased learning time, likely due to the differences in school provision, as detailed in Report 4 of this series.
In the second lockdown in January 2021, differences in learning time between students from state and independent schools were highlighted again. For example, 64% of teachers in independent schools said their average student was spending more than 5 hours per day studying in January, which is more than double the proportion in state schools (30%) (Montacute & Cullinane, 2021).
Family factors
Since students were predominantly learning in their own households rather than in a classroom in a school, many studies began to examine the effect of different family factors on time spent learning per day. Parental characteristics such as level of education were found to be related to students’ study time. For example, analysis of the Understanding Society survey dataset from April showed that 23% of students with a parent who has a degree were studying for 4 or more hours a day, compared to 18% of students with a parent whose highest qualifications were GCSE or lower, and 13% of students with a parent who had A levels (Benzeval et al., 2020).
Using the same dataset, Bayrakdar and Guveli (2020) similarly highlighted that secondary school children whose parents had a degree spent a longer average amount of time per day on their learning compared to those with A levels or GCSEs (3.8 hours per day compared to 3.4 hours, respectively). Cullinane and Montacute (2020) also found discrepancies here, with children of parents with an undergraduate or postgraduate education much more likely to be spending more time learning.
In further analysis of the Understanding Society survey dataset, Elliot Major et al. (2020) found differences in learning time between children whose parents had different working statuses. Those with a parent whose hours had been reduced to zero during the first lockdown were 5 percentage points more likely to have done no school work, and 6 percentage points less likely to have received a full school day, compared to children whose parent remained employed and working. This was true even though education stage, pre-lockdown parental employment status, and family income was held fixed in their regression analysis.
Pensiero et al.’s (2020) analysis of the same dataset similarly found that when the reason for having a parent regularly at home was due to unemployment, there was no advantage in terms of the total number of hours spent on schoolwork compared to having a parent at home only occasionally, while having both parents working from home regularly was positively related to total number of hours spent on schoolwork. This was mostly driven by the uptake of offline lessons. Furthermore, although total schoolwork time was not related to a parent regularly being at home due to unemployment, the number of offline lessons per day was positively related. Therefore, while the number of online lessons did not appear to be influenced by parents’ working patterns, having a parent at home regularly did help with the uptake of offline lessons, and when there were two parents working from home regularly this led to an overall increase in total time spent on schoolwork. This is possibly because online lessons are more dependent on school’s provision, while offline lessons, such as worksheets, videos, and assignments, are more dependent on parents’ planning and initiative. Interestingly though, Pensiero et al. (2020) did not find inequalities in the amount of support provided by parents, and the authors suggest it was the quality of the attention provided by parents that was important in increasing total time spent on schoolwork by their children.
Pensiero et al. (2020) further examined the influence of other circumstances, such as parents’ occupation type and the availability of computers at home. They concluded that children with 2 parents who work from home regularly, where the main parent has a ‘service class’ occupation (defined as large employers, managers or professionals), and where the child has their own computer spent a higher average number of hours on their schoolwork (2.9 hours for primary and 3.8 hours for secondary) compared to children who had to share their computer, with either parent not working from home regularly, and whose main parent was not in a service class occupation (2.3 for primary and 2.6 for secondary).
In terms of family structure, ONS survey data from summer 2020 indicated that whether there was another child aged 0 to 4 years old in the home only affected the number of hours children aged 5 to 10 years old spent studying, but not those aged 11 to 15, presumably because older children are more able to study independently without their parents’ supervision (Williams et al., 2020). However, Pensiero et al.’s (2020) findings suggested that having an older sibling negatively impacted time spent on schoolwork in secondary school students, possibly because they were competing for resources such as computers and study space.
Bayrakdar and Guveli (2020) examined the Understanding Society dataset and found that single-parent children were spending a lower average amount of time on schoolwork than children with both parents, and this was true across all phases of education (Bayrakdar & Guveli, 2020). Similarly to the positive effects of school provision described earlier in terms of reducing the negative impact of free school meal eligibility on learning time, using their regression model Bayrakdar and Guveli also found that school’s provision of distance learning appeared to reduce the negative impact of single-parenthood on learning time substantially. It also partly alleviated the effect of parental education. Pensiero et al. (2020) analysed the same dataset and found that although there were small differences in the total number of hours of spent on schoolwork between single and two-parent families, these were small and not statistically significant. However, Pensiero et al.’s analysis did not control for factors which might distort these findings, such as parental education and ethnicity.
New Normal mode
There is not much evidence about the number of hours per day spent learning during phases 2 and 4, except that overall more students were receiving full school days, which is not surprising given that schools were open again in these periods. For example, Elliot Major et al. (2020) examined data from the London School of Economics-Centre for Economic Performance (LSE-CEP) Social Mobility survey and estimated that the proportion of students receiving full school days in October had risen to just under 6 in 10, or 58% of students (compared to just 38% during the first lockdown, as reported in section ‘Average hours per day’ above). This equated to students receiving around 85% of their normal schooling in the autumn term (compared to 42% in the first lockdown).
Although there was an increase in learning time when schools reopened in September, during the second half of the autumn term when there was a rising infection rate and bubbles were being sent home, approximately 29% of parents in a survey said that their child had followed their normal timetable at home (Parentkind, 2020c). Elliot Major et al.’s (2020) findings also showed that there was still a substantial proportion (4 in 10) who were not receiving a full school day.
There was little in the literature specifically analysing the average number of hours per day spent studying at home by students isolating during phases 2 and 4. But it does seem to be the case that even though schools were open, learning time was being disrupted by intermittent periods being spent at home where it was likely less learning took place. There were also changes which potentially negatively impacted the total number of hours students spent studying per day when they were in school, such as staggered start times to allow social distancing during both phases 2 and 4. These impacts could have varied between schools depending on how they handled the situation. For example, some schools may have had longer windows for supervised drop-offs, which might have impacted learning time more than in schools with shorter drop-off windows, and some schools may have had separate entrances meaning staggered start times weren’t required at all.[footnote 51]
Lastly, the amount of time spent studying different subjects when students returned to school may have varied. Ofsted reported that most primary schools they visited in October and November were prioritising reading and mathematics. Secondary schools reported that they were teaching all their usual subjects and that there had been no significant changes to time allocations for subjects. However, some changes had been made such as prioritising specialist teaching spaces to key stage 4 and 5, meaning that key stage 3 students spent less time on practical activities in subjects such as science or music. Other adaptations included increased focus on their personal, social and health education (PSHE) curriculum, or on Physical Education in order to support student’s wellbeing.
Scenario modelling
It is evident that there are many different permutations of the effects of the pandemic on students in different circumstances, in terms of their total time spent in face-to-face schooling. To highlight the complexity of this issue, we present a set of hypothetical scenarios, using a select variety of students in different circumstances. We then estimate approximately how many weeks each of these students would have likely spent studying at home, at school, or not at all, under the three types of instructional delivery modes described earlier (traditional, remote, and new normal), throughout the course of a typical 2-year GCSE course starting in September 2019.
The total number of teaching weeks in a typical 2-year GCSE course is 69 weeks (39 weeks per normal school year minus the 9-week period at the end of the second year after exams usually begin). Estimations were performed by taking what we have learnt about attendance from the evidence presented above, and using this to count the number of weeks students likely spent under each condition chronologically (excluding school holidays). We based our estimations on the basis that phase 0 of the pandemic accounted for approximately 25 teaching weeks, phase 1 accounted for 14 weeks, phase 2 for 14 weeks, phase 3 for 8 weeks and phase 4 for 8 weeks2. Our estimations do not take into account absences that would normally occur due to reasons unrelated to COVID-19, such as students being off sick with a different illness.
The scenario modelling in Table 1 is not intended to represent anticipated differences between groups of students, but rather to illustrate how varied the ratio of face-to-face to remote learning time could potentially be across individual students. In addition, the periods of time that fell into the ‘remote mode’ category do not necessarily translate into time spent studying at home for all students, as some students may still have attended school during these periods (for example the children of critical workers), and some may not have been studying at all. Therefore we differentiated between studying ‘At home’, ‘At school’, and ‘Not studying’ within each mode.
Some observations from Table 1 include that Dylan, Priya and Muhammad could all have been from the same Local Authority, but had very different experiences, with Muhammad spending an additional 8 weeks in school compared to Priya, owing to his schools’ high attendance throughout the autumn while Priya had to self-isolate three times in the autumn term and once in March 2021. Dylan, on the other hand, was in the same class as Priya but as the child of a critical worker spent 22 weeks more in school compared to Priya. This further contrasts with Jess from London, who has an EHCP and spent most of the remote mode period studying in school, but had to isolate twice, meaning she spent a total of 65 weeks in school.
Tom who is clinically extremely vulnerable could have spent the entirety of both the remote and new normal periods studying at home, similarly to Zara who withdrew from school during the pandemic to start elective home education. However, these students would have spent the first 25 weeks of their course in school, contrasting with Adam, who was home educated prior to the pandemic and spent all 69 weeks studying at home. Ella and Aisha both experienced disruption in the autumn term, but since Ella’s school was closed she was studying at home, while Aisha was absent because she was ill with COVID-19 and therefore was not able to study at all for a period of 3 weeks. In addition, Aisha decided to return to school in June and July when she had the opportunity, whereas Ella did not. Since her school was only open part-time in June and July, Aisha’s time in school during the remote period equated to 1 week in total. Ella’s school also closed prior to the first lockdown because there were suspected cases of COVID-19 at her school after some students returned from a trip to Italy.
Finally, Jake and Tyler could have spent significant amounts of time not studying at all. Jake disengaged from his learning during the pandemic and did not return to school in September, therefore he spent 25 weeks in school, 4 weeks studying at home before disengaging, and 40 weeks not studying. Tyler’s school offered very minimal remote learning provision during the first lockdown, and he spent less than an hour per day studying during this time. He spent approximately 18 weeks of his course not studying, 43 weeks in school and 8 weeks studying at home.
Furthermore, the micro-level lost time analysis has demonstrated that there would likely also have been large variation between these students in terms of how much time they spent studying per day while they were at home, as well as some variation in how much time they spent studying per day during the weeks they were in school. For example, if Priya was eligible for free school meals and had a more disadvantaged background than Muhammad who was in the same local authority, she might have spent fewer hours per day studying than Muhammad during the time they were at home. While Tom and Zara both spent the same amount of time at home (44 weeks), Zara may have had a private tutor and spent more hours per day studying than Tom who did not have a private tutor. Aisha’s parents may have both been working from home while Muhammad’s parents weren’t, meaning that Aisha spent more than 4 hours a day studying in the 21 weeks she was at home, while Muhammad spent fewer than 4 hours a day studying during the 22 weeks he was at home. Jess and Dylan both spent significantly more time in school than at home as they were both attending school during the closures, but in Dylan’s school social distancing measures such as staggered start times, altered timetables and staff absences reduced the time spent studying while he was at school, compared to Jess whose school was able to resource extra staff to support the new alterations.
These observations illustrate that it is difficult to estimate the amount of time spent studying either face-to-face or at home for any group of students who share a single characteristic, because other factors will have influenced different students differently within that group. The lost time narrative which refers to the length of time most students were not in school can also be misleading, because it implies students were not learning at all during these periods, whereas Table 1 demonstrates that studying continued throughout the 2-year course for many students, albeit under very disrupted conditions. One big issue is about the variance across individual students in terms of the balance of time they spent learning under different circumstances, and the implications that this might have had for how effectively they were able to learn under those circumstances. For example, greater proportions of time spent studying at home compared to in school is likely to equate to less effective learning, but the balance of these proportions are different for every individual student.
Table 1: Scenario modelling demonstrating the estimated amounts of time spent studying by hypothetical students in different circumstances [accessibility note: blank spaces left in table to emphasise lack of time spent studying]
| Teaching weeks spent studying from September 2019 to mid-May 2021 | Tom who was clinically extremely vulnerable and had to shield throughout the pandemic | Jess who has an EHCP (in London) and had to isolate twice | Dylan the child of a critical worker (in the north-west) who had to isolate 4 times | Priya in same class as Dylan and also had to isolate 4 times | Muhammad in same local authority as Dylan and Priya but with high attendance when schools were open | Ella whose school was closed for most of the autumn term due to the pandemic (and closed before the first lockdown) | Adam who was home educated throughout | Zara whose parents switched to home educating during the pandemic | Jake who stopped studying at home and did not return to school in September | Aisha who went back to school early in June, but was sick with COVID-19 in October | Tyler who received little remote learning provision during the first lockdown and spent less than an hour per day studying at home |
|---|---|---|---|---|---|---|---|---|---|---|---|
| Traditional mode: at home | 4 | 69 | |||||||||
| Traditional mode: at school | 25 | 25 | 25 | 25 | 25 | 21 | 25 | 25 | 25 | 25 | |
| Remote mode: at home | 22 | 22 | 22 | 22 | 22 | 4 | 21 | 4 | |||
| Remote mode: at school | 22 | 22 | 1 | ||||||||
| Remote mode: not studying | 18 | 18 | |||||||||
| New normal mode: at home | 22 | 4 | 8 | 8 | 10 | 22 | 4 | ||||
| New normal mode: at school | 18 | 14 | 14 | 22 | 12 | 19 | 18 | ||||
| New normal mode: not studying | 22 | 3 | |||||||||
| Number of weeks at home | 44 (64%) | 4 (6%) | 8 (12%) | 30 (43%) | 22 (32%) | 36 (52%) | 69 (100%) | 44 (64%) | 4 (6%) | 21 (30%) | 8 (12%) |
| Number of weeks in school | 25 (36%) | 65 (94%) | 61 (88%) | 39 (57%) | 47 (68%) | 33 (48%) | 0 (0%) | 25 (36%) | 25 (36%) | 45 (65%) | 43 (62%) |
| Number of weeks not studying | 0 | 0 | 0 | 0 | 0 | 0 | 0 | 0 | 40 (58%) | 3 (4%) | 18 (26%) |
| Total | 69 | 69 | 69 | 69 | 69 | 69 | 69 | 69 | 69 | 69 | 69 |
Time gained
In this section we consider evidence about the time students may have spent attempting to ‘catch up’ on the lost time described in the previous sections, for example, by studying for additional hours beyond the typical school day with a private tutor, as part of a government-supported tutoring scheme, or in after-school or lunchtime catch up sessions provided by schools.
Catch up strategies
In June 2020 the Department for Education announced a programme to help students catch up on their lost learning time, which included funding allocated to schools and a National Tutoring Programme (NTP) targeted at disadvantaged children. This programme included a tuition partners scheme (involving one-to-one and small group tutoring), and an academic mentoring scheme. The National Audit Office (2021) reported that in February, 125,200 children (out of the 200,000- 250,000 children the scheme was expected to support) had been allocated a tutoring place. The authors had concerns about the extent to which the scheme would reach the most disadvantaged children as only 44% of the students who had started to receive tuition were eligible for Pupil Premium. The National Audit Office also reported that demand for academic mentors had outstripped supply at this point, with over 600 schools who had requested a mentor but not received one.
In Ofsted’s interim visits to schools in October, schools were not clear how they were going to use catch up funding. Some school leaders reported that they had started providing one-to-one or small-group tuition before or after school using their own staff, and others said they were planning to appoint additional staff to implement these types of programmes. A small number of schools had extended the school day to help their students catch up (Ofsted, 2020b). When Ofsted visited schools a month later, in November, many schools had decided how they were going to use the funding. In primary schools it was being used to provide additional teaching in English (particularly reading) and maths. In secondary schools, one of the most common uses was to fund staff to provide intervention classes either during school time, after school, on Saturdays, or in half-term (Ofsted, 2020c).
In a later survey conducted in December, the majority of primary school teachers reported that their school had not put in place extra time for students (341 out of 454). Of those who had put in place extra time, almost all reported running lunchtime learning activities, rather than extending the school day or staying open in the holidays (Weidman et al., 2021). In another survey in March 2021, only a small proportion of school leaders said they were planning to run summer schools (22% in secondary schools and 4% in primary schools; Nelson et al., 2021). Within this, the most deprived schools were more likely to be planning summer schools than the most affluent schools.
It remains to be seen what impact these strategies will have on student’s learning though, and it is unlikely that the cohort of students taking their qualifications this year will have benefitted much from these strategies by the time they are assessed.
Private tutoring
One other way some students may be attempting to catch up on their learning is by private tuition. There is ordinarily a gap between the most and least disadvantaged children in terms of private tuition (Kirby, 2016). In the immediate period following school closures in March 2020, Cullinane and Montacute (2020) reported a slight narrowing of this gap, as two-thirds of the children who would normally receive tuition could no longer receive their usual face-to-face support, and only one-third of these children accessed tuition online. The authors acknowledged that this was likely to be temporary while tutors adapted to the new restrictions. More children in families with higher incomes who had not previously received tuition were already starting to receive new tuition in the first month of lockdown (7% in families from the £60k plus income band, compared to 2% in the less than £30k income band). Charities and organisations who usually provided tutoring to more disadvantaged students were also concerned about struggling to reach pupils through online learning due to the barriers these pupils faced in accessing IT resources.
In May, Andrew et al. (2020b) found that 5% of children had a private tutor and on average spent 1.5 hours learning with them per day. Elliot Major et al. (2020) also reported an average 9.2% of parents said they paid for private tutoring during the first lockdown, and children from families in the highest income quintile were 4 times more likely to have private tuition (15.7%) compared to those in the lowest income quintile (3.8%). Children from higher-income families were therefore, unsurprisingly, more likely to receive private tutoring during the first lockdown, but Andrew et al. (2020c) further found that within the group of children who received tutoring, the richest fifth of these children spent more time with their tutor (two-thirds spent more than 5 hours a week with them) compared to the poorest children with a tutor (two-thirds spent between 1 to 4 hours a week).
During the lockdown in January 2021, 10% of parents reported paying for private tutoring (13% from middle-class households and 7% from working-class households) (Montacute & Cullinane, 2020). Overall it appears children from better-off families were receiving a higher quantity of home learning through private tuition during the school closures. For a more in-depth discussion of how the quality of home learning differed between disadvantaged and less disadvantaged families, see Report 4 in this series.
Discussion
The aim of this report was to quantify how much time students in different circumstances have spent studying, or not studying, across the course of the pandemic. This will help us understand how much time students have ‘lost’ compared to what they would usually spend studying in a normal year.
Different issues characterised different phases of the pandemic, resulting in different narratives in the literature around ‘lost time’. During periods when schools were closed, the major issue was the change from face-to-face to remote learning for most students, therefore narratives were focused on the amount of time different groups of students were spending studying per day at home (our micro-level analyses section). During periods when schools were open, the main issues were around the differing absence rates between different groups of students, therefore narratives were focused on differences in the number of days or weeks of lost face-to-face teaching time between students (our macro-level analyses section). At times these narratives overlapped, for example, when schools were still closed to most students but open to key year groups in June and July, there were macro-level issues such as the differences in face-to-face teaching time between students who had the opportunity and chose to return to school and those who didn’t. When schools were reopened there were also some micro-level issues, such as changes to school timetables affecting total time per day spent learning. In the scenario modelling section, we attempted to illustrate the implications of these analyses, by creating hypothetical scenarios for students in a variety of contexts.
Overall time spent learning, or not learning
During the first school closures from March 2020 to the end of the summer term, phase 1 of the pandemic, many students could potentially have missed up to 14 weeks of face-to-face schooling. Although some vulnerable students and children of critical workers might not have missed any, many of those who were eligible did not attend school in-person, most likely due to concerns about safety. For those who were studying at home, estimates of the amount of time students were studying range from between 2 to 4.5 hours per day between March and May 2020. The differences between these estimates are likely due to differences in sampling and methodology, but all are substantially less than average 6 hours per day students spent learning before the pandemic. Importantly, there were large variations around these averages, and some estimates suggested 1 in 10 teenagers were doing zero or less than an hour a day of schoolwork during the first lockdown.
Some key year groups in most schools, including years 10 and 12 in secondary schools, were allowed to return in June for around 5 to 6 weeks until the end of term, and may therefore have reduced the number of lost weeks from 14 to around 8 or 9. However, only a small proportion of these year groups chose to return to school (again, with the most common reason for not attending being safety concerns), and for those that did provision was mostly only part-time, with 16% of secondary schools open 5 days a week, and 54% open 1 day per week. Although the amount of time spent studying per day increased for students who returned to school in June and July, it actually dropped slightly overall for all students, by an average of 20 minutes. This appears to be largely because students who were not given the opportunity to return experienced a large drop in learning time (driven by richer students decreasing their learning time to the same level of their poorer peers), while those who were offered the opportunity but chose not to return did not experience any notable drops in learning time.
When schools reopened in phase 2 (the autumn term), although there was the potential for some students to have received up to 14 weeks of face-to-face schooling, many will not have done due to the rising infection rates in some regions resulting in students being sent home to self-isolate. This is reflected by increased COVID-19-related absence rates near the end of the autumn term, largely driven by increased numbers of self-isolations, rather than students contracting COVID-19 themselves. As well as regional variations depending on infection rates, the amount of in-person teaching time also varied across schools, depending on the size of the ‘bubbles’ being sent home, with primary schools generally sending home larger bubbles than secondary schools. Teacher absence was also around 4 to 5% in the autumn, possibly a causal factor in some schools having to close due to staff shortages, accounting for further student absences. Although a higher proportion of students were receiving a full school day (more than 5 hours) of learning time compared to during the first lockdown, there was still a substantial proportion (4 in 10) who were not.
As well as increased absences, the typical day for those in school was likely affected by social distancing measures such as staggered start times. There were also students who did not return at all in the autumn, either because they’d decided to home educate, they were concerned about safety, they were in another country or quarantining after returning, or possibly because they had disengaged from their learning entirely and ‘dropped out’.
When schools closed again in January 2021, phase 3 of the pandemic, many students could have missed another 8 weeks of in-person schooling. However, attendance rates were higher this time when compared to the first lockdown, with an increasing number of children of critical workers in attendance. There was also a change in the eligibility criteria for those allowed in school, meaning that students who “may have difficulty engaging with remote education at home (for example due to a lack of devices or quiet space to study)” were now included in the definition of vulnerable[footnote 26]. Therefore more vulnerable children were in attendance compared to the first lockdown. In addition, in January the government made it a legal requirement for schools to provide 5 hours of remote learning to key stage 3 and 4 students. This explains the apparent increase in learning time per day for those studying at home during phase 3, compared to phase 1. For example, a higher proportion of students overall were studying more than 5 hours per day (an increase from 19% to 45% in secondary school children).
Finally, when schools reopened on the 8 March in phase 4, students will potentially have received 8 weeks of in-person schooling (for those taking GCSEs who would finish their course in mid-May). Attendance rates appear slightly higher than the last time schools were open in phase 2. Although there are still COVID-19-related student and teacher absences, with some areas in England being sent home to self-isolate more than others, these appear to be lower overall than in phase 2. It is possible that the number of hours per school day is still not back to pre-COVID-19 times, however research is not yet available on this. It is also not yet known how many students may have decided to stay at home permanently for elective home education, or how many did not return because they ‘dropped out’.
Variations between students
A recurring theme throughout the research on lost time is that the averages reported mask substantial variation between regions, local authorities, schools and individual students within schools. For example, students in regions that have suffered the highest infection rates may have missed a higher average number of in-person teaching weeks than regions with lower infection rates. However, within those regions there is also variation at local authority level, therefore some local authorities within a region with a low average infection rate will have missed just as much in-person schooling as a local authority in a region with a high average infection rate. So we cannot conclude that one whole region has lost more time than another region. We cannot even conclude that all schools in a local authority with higher infection rates have missed more time than all schools in a local authority with a lower infection rate, because the extent to which different schools have managed to cope with staffing issues, bubble sizes and the impact of other social distancing measures on timetables has varied.
There are also many other factors related to how much time individual students have lost, either in school or at home, such as their level of socio-economic disadvantage, their parents’ education or occupation, whether they were clinically vulnerable, or whether they were the child of a key worker, to name a few. While the closure of schools clearly led to differences in learning time between students, even when schools reopened, differences between groups of students remained.
One of the most prominent areas of research into lost learning time has been the impact the pandemic has had on the disadvantage gap. While disadvantaged children may have been slightly overrepresented in those attending school during the first school closures (Bayrakdar & Guveli, 2020), there were many findings suggesting that disadvantaged children who were not in school were spending less time studying at home than their less disadvantaged peers, and were likely further disadvantaged in other ways, for example, through a lack of access to online lessons (see Report 4).
Although a disadvantage gap in terms of total number of hours spent learning per day existed before the pandemic, this gap widened during the first lockdown when learning predominantly became remote. This is likely to have been due to a number of factors including a digital divide, amount of school provision, and home environments, which are discussed in Report 4 of this series. One exception to this appeared to be in post-16 education, where students eligible for free school meals were reported by one study to be studying longer hours than those not eligible. During the second school closures in January 2021, more students from middle-class families who were either vulnerable or, more likely, the children of critical workers, attended school than those from working-class families. Of those at home, although overall learning time per day was higher than during the first lockdown, a disadvantage gap still existed.
Furthermore, when schools reopened to all students in the autumn, the most disadvantaged areas (those with the highest proportions of students eligible for free school meals) had lower attendance rates than the least disadvantaged areas, and therefore experienced less face-to-face teaching. This relationship appeared to vary across time and by region though, with the disadvantage gap apparent in some areas, but not others. For example, there was no obvious disadvantage gap apparent in London at the end of the autumn, although this is of little consolation since it is probably because the spike in cases started to affect the least disadvantaged areas just as badly as the most disadvantaged areas.
In addition, a disadvantage gap existed in terms of choices to return to school when the opportunity was given, with middle-class parents more likely to send their child back to school in June 2020 than working-class parents. Although this narrowed slightly when parents were able to send their children back in March 2021, a gap still existed. The most common reason for choosing not to return was the perceived health risk.
Other factors affecting how much learning time different students lost include centre type, with independent schools being less affected by bubble closures in the autumn than state schools, and independent school students reportedly studying for more hours per day than state school students during both phases of school closures. Differences between phases of education were also present, with secondary school students more likely to be absent when schools were open, probably because of the greater impact of the virus on older children. Students in years 10 and 11 missed more schooling in the autumn term than younger years. Although students in years 10 and 12 could potentially have lost less in-person schooling than other secondary school years when they were invited back in June, only 10% of these year groups did attend, and the provision they received was often only part time. However, secondary school students were more likely to be spending more hours learning when they were at home compared to primary school students, possibly because they are more independent learners, less reliant on their parents’ supervision.
Parental characteristics and family structure also influenced the number of hours spent learning at home. Children of better educated parents, parents who remained employed throughout the first lockdown, where both parents were working from home regularly, or parents with ‘service class’ occupations (such as managers or professionals) were spending the most number of hours studying at home. Children with access to their own computer also spent longer studying than those without. Finally, primary school students who had a younger sibling aged between 0 to 4 spent less time studying than primary school students without a younger sibling. Similarly, having an older sibling negatively influenced the amount of time secondary school children spent on schoolwork, possibly because they may have been competing for resources such as computers or study space.
In the scenario modelling section, we attempted to illustrate just how varied lost time was between individual students by creating hypothetical scenarios for students in a variety of contexts. This highlighted how difficult it is to put a number on lost time for any particular group of students who share some characteristic, because they’ll likely differ on some other characteristic or factor.
If we take one example, say a group of students who all in live in the same local authority, for one student, their school could have been open for the whole period. The likely maximum number of weeks of face-to-face teaching that student would have had would be 47 out of the 69 weeks of their 2-year course (68%), and the number of weeks spent at home when they would usually have been in school would be 22 weeks out of 69 (32%). Once we start to unpick the various other factors that influence time spent learning, this estimate could change considerably for other students in the same local authority. For example, a child in the same area might have had to isolate on 4 occasions, receiving 57% of their usual in-person schooling, despite living in an area with similar infection rates, since their school sent home larger bubbles than the child in the first example. Another student in the same class could have been the child of a critical worker, and they might have received 88% of their usual in-person schooling time. Another student in the same area might have had to shield throughout the pandemic, therefore only receiving 36% of their 2-year course in school. This is before even considering the variation in the time spent studying at home by the students in these examples.
Gaps in our understanding of lost time
There are still some questions remaining, and areas of research lacking detailed evidence in relation to lost time. Firstly, there are questions about the students behind the absence rates. Although we know overall attendance rates at a school-level and the reasons for COVID-19-related absences, we do not know individual-level details about the students who were absent because pupil-level data has not yet been reported on. Were some students consistently absent and some less frequently absent, and what characterised those students? For example, are they the most clinically vulnerable children, are they more likely to have a family member who is shielding, or do they have a history of poor attendance? Also, what are the proportions of students who have withdrawn from school to be home educated permanently, and how many have withdrawn temporarily and wish to return when there is less of a concern about safety?
There is also more that could be learned about how much time specific groups of students have lost. For example, there is very little research on how learning time for students who were home educated prior to the pandemic was affected. It might appear as though they basically experienced business as usual in terms of the quantity of time spent learning, because they were already completing their schooling at home. However, their learning was likely impacted in other ways by the pandemic, such as having restrictions on the social aspects of learning and not being able to access external groups and activities (Merrett, Richards & Mountford-Zimdars, 2020). The bigger issue for these students was the cancellation of exams, which has had a large impact on their access to the qualifications they have been studying for (Merrett et al. 2020; Murphy & Isaacs, in prep).
Some research examining the impact of the pandemic on SEND students in terms of quality of learning, such as the level of specialist support they received compared to pre-pandemic, is discussed in Report 4 of this series, but there is little evidence available about how total time spent learning by students with SEND differed compared to other students. There are some insights from the attendance data, for example, when schools were open to all, attendance of students with an EHCP or in special schools was lower than the averages for all students. But this is usually the case in normal times, so it is difficult to determine whether this gap widened, although Ofsted’s reports suggest that students with SEND were less likely to return in the autumn due to safety concerns.
Since students with an EHCP were eligible to attend school throughout phases 1 and 3 when most students were at home, their attendance was obviously higher than average attendance rates for all students during these periods. But those in school still only represented a small proportion of all students with an EHCP, therefore the majority remained at home. Although a Parentkind survey found that parents of children with SEND were struggling with home-schooling in the first lockdown, little is known in terms of the quantities of time spent learning by these students at home, which is the remit of this report. Furthermore, as previously mentioned, for those who were in school during the lockdowns the number of hours spent studying in school was likely to be less than before the pandemic. Some survey data from the summer 2020 term suggested students with SEND were spending less time in school than they were before the pandemic, but the extent of this difference is unknown.
Finally, the quantification of ‘time-gained’ is currently largely unknown. That is, how much learning time have students received outside of their normal school day, such as during after-school hours, in school holidays, or at weekends, and how has this differed between students in different circumstances? We have heard from Ofsted’s visits that schools were providing catch up support, and that those who have private tutors were spending additional time learning at home, but there has been little evidence collected about time spent learning per day since these strategies were put in place. There have been concerns voiced about the extent to which strategies such as the provision of tutoring or extending the school day will reach the most disadvantaged students who have missed the most amount of learning time.
Conclusions
The concept of lost learning time is a complex one, with different narratives which have changed throughout the course of the pandemic. If we go back to our hypothetical GCSE students who started their courses in 2019, the overall amount of lost in-person learning time up until the end of their course in May 2021 could range from as little as a few weeks (for example for students who were attending school throughout both school closures as the children of key workers) to the full 44 teaching weeks that will have passed since the start of the first lockdown, which equates to around two thirds of their course (for example for those who were shielding throughout the course of the pandemic). The question of lost time must also take into account the amount of time students spent learning at home, and this figure could range from zero to over 5 hours per day for students in different circumstances.
The switch from in-person to remote schooling clearly led to differences in time spent learning at home between students, depending on factors such as socio-economic background, phase of education, centre type, or parental characteristics. But even when schools reopened, there were differences in face-to-face schooling time between groups of students, for example, based on varying infection rates across local areas, and different ways in which schools dealt with bubbles and social distancing measures.
One of the main factors driving increased amounts of lost time appears to be socio-economic deprivation. While there are nuances in this relationship, a recurring theme throughout much of the research reviewed in this report was that the most socio-economically disadvantaged students were in school less during periods when schools were open, and spent less time learning at home when schools were closed, than the least disadvantaged students. There is ordinarily a disadvantage gap in terms of amount of time spent learning, but the switch to remote learning appeared to increase this gap. Further inequalities in terms of the quality of remote learning are discussed further in Report 4. As the scenario modelling demonstrated, it is difficult to put a number on lost time for any particular group of students who share some characteristic, because they will likely differ on some other characteristic or factor, such as where they live, their parents’ situation, or how their school coped with the changes. Therefore lost time is extremely varied, and is unique to each individual student.
References
Andrew, A., Cattan, S., Costa Dias, M., Farquharson, C., Kraftman, L., Krutikova, S., Phimister, A., & Sevilla, A. (2020a). September return to school offers a chance to level the playing field.
Andrew, A., Cattan, S., Costa-Dias, M., Farquharson, C., Kraftman, L., Krutikova, S., … & Sevilla, A. (2020b). Family time use and home learning during the COVID-19 lockdown. London: Institute for Fiscal Studies.
Andrew, A., Cattan, S., Costa-Dias, M., Farquharson, C., Kraftman, L., Krutikova, S., … & Sevilla, A (2020c). Learning during the lockdown: real-time data on children’s experiences during home learning. London: Institute for Fiscal Studies
Bayrakdar, S., & Guveli, A. (2020). Inequalities in home learning and schools’ provision of distance teaching during school closure of COVID-19 lockdown in the UK (No. 2020-09). Essex: Institute for Social and Economic Research, University of Essex.
Benzeval, M., Borkowska, M., Burton, J., Crossley, T.F., Fumagalli, L., Jäckle, A., Rabe, B., & Read, B. (2020). Understanding Society COVID-19 Survey April Briefing Note: Home schooling, Understanding Society Working Paper No 12/2020, ISER, University of Essex.
Bibby, D., Plaister, N., & Thomson, D. (2021). How much school did Year 11 miss in the Autumn term?
Brown, J., & Kirk-Wade, E. (2021). _Coronavirus: A history of English lockdown laws (Number 9068, 30 April 2021). London: House of Commons Library.
Burgess, S., Thomson, T., Plaister, N. & Nye, P. (2020). Pupils in the poorest areas of the country are missing the most schooling.
Cattan, S., Farquharson, C., Krutikova, S., Phimister, A., Salisbury, A. & Sevilla, A. (2020). Inequalities in responses to school closures over the course of the first COVID-19 lockdown. London: Institute for Fiscal Studies.
Children’s Commissioner for England (2020a). School attendance since September. London: Children’s Commissioner for England
Children’s Commissioner for England (2020b). School return: Covid-19 and school attendance. London: Children’s Commissioner for England
Penington, E. (2020). The numbers behind homeschooling during lockdown.
Cullinane, C., & Montacute, R. (2020) COVID-19 and Social Mobility Impact Brief #1: School Shutdown. London: The Sutton Trust.
Department for Education (2020). State of the nation 2020: children and young people’s wellbeing (Reference: DFE-RR-999). London: Department for Education.
Eivers, E., Worth, J. & Ghosh, A. (2020). Home learning during Covid-19: findings from the Understanding Society longitudinal study. Slough: NFER
Elliot-Major, L., Eyles, A., & Machin, S. (2020). COVID: Emerging work and education inequalities (Paper No.011). London: London School of Economics
Farquharson, C., Krutikova, S., Phimister, A., Salisbury, A., & Sevilla, A. (2021a). Two-thirds of parents concerned about lost learning – and want policies to promote children’s well-being as well as to catch up on education.
Farquharson, C., Krutikova, S., Phimister, A., Salisbury, A., & Sevilla, A. (2021b). The return to school and catch-up policies. London: Institute for Fiscal Studies
Green, F. (2020). Schoolwork in lockdown: new evidence on the epidemic of educational poverty. Centre for Learning and Life Chances in Knowledge Economies and Societies (LLAKES), Research Paper, 67.
Halterbeck, M., Conlon, G., Patrignani, P., & Pritchard, A. (2020). Lost Learning, Lost Earnings. London: The Sutton Trust.
Howard, E., Khan, A., & Lockyer, C. (2021). Learning During the Pandemic: report 4. Coventry: Ofqual.
Kirby, P. (2016). Shadow Schooling: Private tuition and social mobility in the UK. London: The Sutton Trust
Labour Party (2021). Labour urges Government to deliver a plan for 2022 exams as analysis reveals year 10 pupils have missed one in eight days of GCSE teaching.
Mamluk, L. & Jones, T. (2020). The impact of COVID-19 on black, Asian and minority ethnic communities.
Merrett, J., Richards, M., & Mountford-Zimdars, A. (2020). Evidence regarding: The effect of cancelling formal exams, including the fairness of qualifications awarded and pupils’ progression to the next stage of education or employment: The Voice of Experienced Elective Home Educating (EHE) parents: the risk of missing home-educated children in the education policy response to school closure and lessons for adapting home learning_._ Centre for Social Mobility, University of Exeter.
Montacute, R., & Cullinane, C. (2021). Learning in Lockdown. London: The Sutton Trust.
Moss, G., Bradbury, A., Duncan, S., Harmey, S., & Levy, R. (2020). Written evidence submitted by the International Literacy Centre, UCL, Institute of Education to the Education Select Committee Inquiry into the impact of COVID-19 on education and children’s services, July 2020. International Literacy Centre, UCL Institute of Education: London, UK.
Murphy, R. & Issacs, T. (In prep). Impact of Covid-19 on Learning Project: Third Interim Report. A report written on behalf of Ofqual.
National Audit Office (2021). Support for children’s education during the early stages of the Covid-19 pandemic. London: National Audit Office.
Nelson, J., Andrade, J. and Donkin, A, (2021). The impact of Covid-19 on schools in England: experiences of the third period of partial school closures and plans for learning recovery: Graphs and commentary on questions posed to the NFER Teacher Voice Omnibus Survey panel. Slough: NFER
Nye, P., Thomson, D., Plaister, N. & Burgess, S. (2020). New attendance figures paint a worrying picture of mass absences.
Ofsted (2020a). COVID-19 series: briefing on schools, September 2020. Manchester: Ofsted.
Ofsted (2020b). COVID-19 series: briefing on schools, October 2020. Manchester: Ofsted.
Ofsted (2020c). COVID-19 series: briefing on schools, November 2020. Manchester: Ofsted.
Pallan, M., Adab, P., Clarke, J., Duff, R., Frew, E., Lancashire, E., Mason, F., Murphy, M. (2021). Impacts of the first COVID-19 lockdown on learning, health behaviours and mental wellbeing in young people aged 11-15 years. Birmingham: University of Birmingham
Parentkind (2020a). Coronavirus Parent Survey 3.
Parentkind (2020b). Coronavirus Parent SEND survey.
Parentkind (2020c). Coronavirus Parent Survey 4.
Pensiero, N., Kelly, A. & Bokhove, C. (2020). Learning inequalities during the Covid-19 pandemic: how families cope with home-schooling. University of Southampton research report.
Roberts, N., & Danechi, S. (2020). Coronavirus and schools: FAQs (Number 08915, 14 December 2020). London: House of Commons Library.
Roberts, N., & Danechi, S. (2021). Coronavirus and schools: FAQs (Number 08915, 23 February 2021). London: House of Commons Library.
Sharp, C., Nelson. J., Lucas. M., Julius, J., McCrone. T. & Sims, D. (2020). Schools’ responses to Covid-19: The challenges facing schools and pupils in September. National Foundation for Educational Research.
Sibieta, L., & Robinson, D. (2020). School attendance and lost schooling across England since full reopening. London: Education Policy Institute.
Sibieta, L. (2021a). COVID-related teacher and pupil absences in England over 2020 autumn term. London: Education Policy Institute.
Sibieta, L. (2021b). Changes in school attendance by local authority in England over 2020 Autumn Term. London: Education Policy Institute.
Sibieta, L., & Cottell, J. (2020). Education policy responses across the UK to the pandemic. London: Education Policy Institute.
Spielman (2020). HMCI commentary: findings from visits in November. London: Ofsted
Williams, T., Mayhew, M., Lagou, M., & Welsby, M. (2020). Coronavirus and homeschooling in Great Britain: April to June 2020. Office for National Statistics
Weidmann, B., Allen, R., Bibby, D., Coe, R., James, L., Plaister, N. & Thomson, D. (2021). Covid-19 disruptions: Attainment gaps and primary school responses. London: Education Endowment Foundation
Endnotes
-
See ‘Gavin Williamson hints school day could be lengthened in bid to boost learning after Covid’ on the Evening Standard website (24 February 2021) ↩
-
We have overlooked INSET days and any additional exam leave prior to mid May ,so, this is probably a slight overestimate of the total number of teaching weeks across a two year period. However, this overestimate may be slightly offset by the fact that some students might be studying for another 2 weeks at the end of May. Since we were estimating the proportion of a normal school year that students spent studying in advance of their assessments, we assumed a cut-off of mid-May, as this is usually when exams start in a normal year. However, this year, students’ work completed up until the end of May could potentially count towards their teacher assessed grades, resulting in an additional 2 weeks of study time. This may vary across schools though, depending on when they finalise their teacher assessed grades for submission. For example, DfE guidance states that “The 2021 exams approach requires schools to submit grades by 18 June 2021. This process requires considerable staff resource and we recognise that in practice, for many pupils, work done after the May half term will not contribute towards their grades.” See Annex B of this DfE guidance (6 April 2021). ↩
-
See ‘Will shutting down UK schools stop coronavirus? It’s complicated’ on wired.co.uk (28 February 2020) ↩
-
See press release from Department for Education and The Rt Hon Gavin Williamson (18 March 2020) ↩
-
See ‘Impact of the COVID-19 pandemic on education in the United Kingdom’ on Wikipedia (6 May 2021) ↩
-
See ‘Secondary pupils back - but most only part-time’ on the BBC website (15 June 2020) ↩
-
See collection of DfE attendance statistics (23 June 2020) ↩ ↩2
-
See ‘Timeline of the COVID-19 pandemic in England (January–June 2020)’ on Wikipedia (6 May 2021) ↩
-
See ‘Prime Minister’s statement on coronavirus’ (31 October 2020) ↩
-
See ‘[Press release from Prime Minister’s Office, 10 Downing Street and The Rt Hon Boris Johnson](https://www.gov.uk/government/news/prime-minister-announces-tier-4-stay-at-home-alert-level-in-response-to-new-covid-variant#:~:text=The%20Prime%20Minister%20has%20announced%20tougher%20restrictions%20for%20large%20parts,Stay%20at%20Home’%20alert%20level.&text=the%20East%20of%20England%20(Bedford,Colchester%2C%20Uttlesford%20and%20Tendring)’ (19 December 2020) ↩
-
See “Local lockdown guidance: Schools urged to set ‘realistic expectations’” on sec-ed.co.uk (02 September 2020) ↩
-
See ‘Press release from Prime Minister’s Office, 10 Downing Street and The Rt Hon Boris Johnson’ (19 December 2020) ↩
-
See Prime Minister’s address to the nation (4 January 2021) ↩
-
See ‘Fact check: What does the guidance on key worker children attendance actually say?’ on schoolsweek.co.uk (11 January 2021) ↩
-
See ‘What should remote education look like?’ blog from DfE (8 January 2021) ↩
-
See ‘background’ section in DfE attendance statistics (16 March 2021) ↩
-
See ‘Attendance in state-funded schools’ section in DfE attendance statistics (8 April 2021) ↩
-
These figures do not include students who were shielding. ↩ ↩2
-
Although, with additional COVID-19-related restrictions and practices in place, these were not the same as traditional circumstances. ↩
-
From 1 June the method of data collection changed, therefore affecting direct comparability. For details of the methodology see DfE attendance statistics (4 June 2020) ↩
-
‘Vulnerable’ children were defined as those assessed as ‘in need’ under the Children Act 1989, or have an EHCP, or assessed as ‘otherwise vulnerable’ at local level. ↩
-
See ‘Covid-19: SEND families’ struggles amplified in lockdown’ on BBC news website (7 January 2021) ↩
-
83% of parents said in a survey that their child’s school had reopened to at least some year groups (Andrews et al., 2020a) ↩
-
See collection of DfE attendance statistics March to June 2020 (21 April 2020) ↩
-
Additional pupil-level data have now been published, although there was insufficient time to integrate any detailed analysis of these data within the present report. ↩
-
See ‘Attendance data shows stark divides in Covid disruption across England’ on Schoolsweek.co.uk ↩
-
Francis Green (personal communication) very kindly conducted a new analysis, restricted to students aged 11 to 14, which returned a figure of 8.4%. ↩
-
See ‘Reality of lockdown for school staff: 5 key findings’ on tes.com (5 May 2020) ↩
-
See ‘4 ways to make staggered school start times work’ on tes.com (9 March 2021) ↩