HM Land Registry plans: the basis of Land Registry plans (practice guide 40, supplement 1)
Updated 30 January 2016

© Crown copyright 2016
This publication is licensed under the terms of the Open Government Licence v3.0 except where otherwise stated. To view this licence, visit nationalarchives.gov.uk/doc/open-government-licence/version/3 or write to the Information Policy Team, The National Archives, Kew, London TW9 4DU, or email: psi@nationalarchives.gov.uk.
Where we have identified any third party copyright information you will need to obtain permission from the copyright holders concerned.
This publication is available at https://www.gov.uk/government/publications/land-registry-plans-the-basis-of-land-registry-applications/land-registry-plans-the-basis-of-land-registry-plans-practice-guide-40-supplement-1
Please note that HM Land Registry’s practice guides are aimed primarily at solicitors and other conveyancers. They often deal with complex matters and use legal terms.
To view the update history for this practice guide, please see practice guide 40, supplement 1: update history.
1. Introduction
Ordnance Survey is the national mapping agency of Great Britain, with a long history of producing paper maps and intelligent geographic data. Ordnance Survey mapping shows topographical features that existed on the ground at the time of the survey. They are multi-purpose maps and the detail shown on them is not intended to represent property boundaries.
In the past all HM Land Registry plans were based on the large-scale paper maps published by Ordnance Survey; even today some plans remain in paper format. HM Land Registry now uses Ordnance Survey’s MasterMap® as a basis for all its plans.
2. Ordnance Survey mapping
MasterMap is Ordnance Survey’s definitive large-scale digital map data product. Ordnance Survey produces MasterMap in colour but, because HM Land Registry has traditionally used its own colour references to depict matters referred to in the register, Ordnance Survey colours within MasterMap are suppressed from HM Land Registry produced plans. For information purposes the examples below show extracts of both versions.
OS MasterMap is supplied and maintained in a seamless and consistent format but is surveyed and produced at different scales. The ranges of scales used are the same as those that Ordnance Survey has traditionally employed. Depending on the nature and location of the land being registered we will prepare title plans, as described in Supplement 5 – Title plans, broadly in line with the following scales.
- 1:1250 scale (1cm = 12.5m) for land in urban areas, see Example 1.
- 1:2500 scale (1cm = 25m) for land in rural areas, see Example 2.
- 1:10 000 scale (1cm = 100m) scale for land in mountain and moorland areas, see Example 3.
2.1 Example 1: scale 1:1250
HM Land Registry plan extract
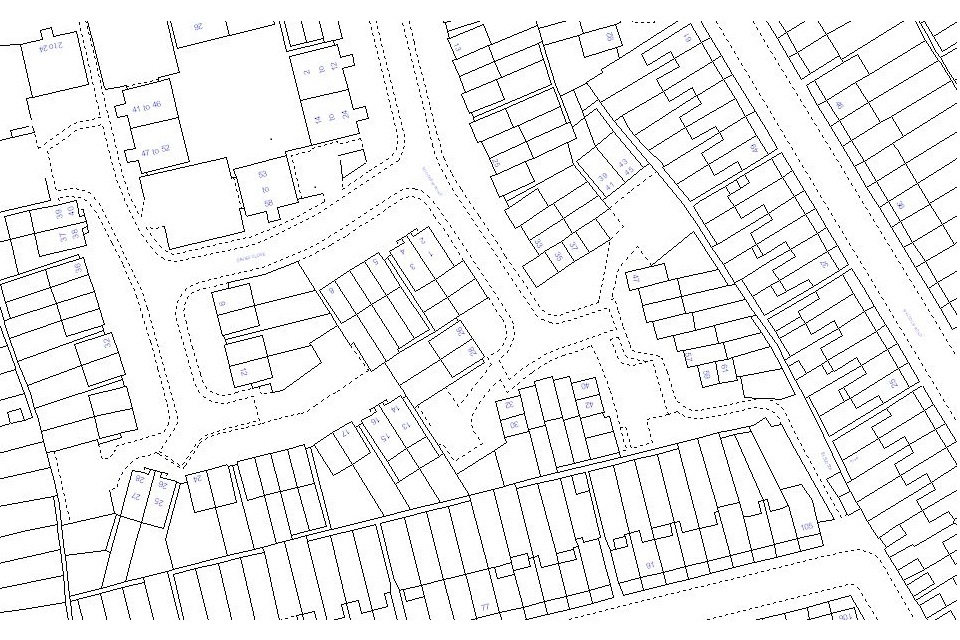
Land Registry plan extract
OS Mastermap

OS Mastermap
© CROWN COPYRIGHT. Produced by HM Land Registry. Further reproduction in whole or part is prohibited without the prior permission of Ordnance Survey.
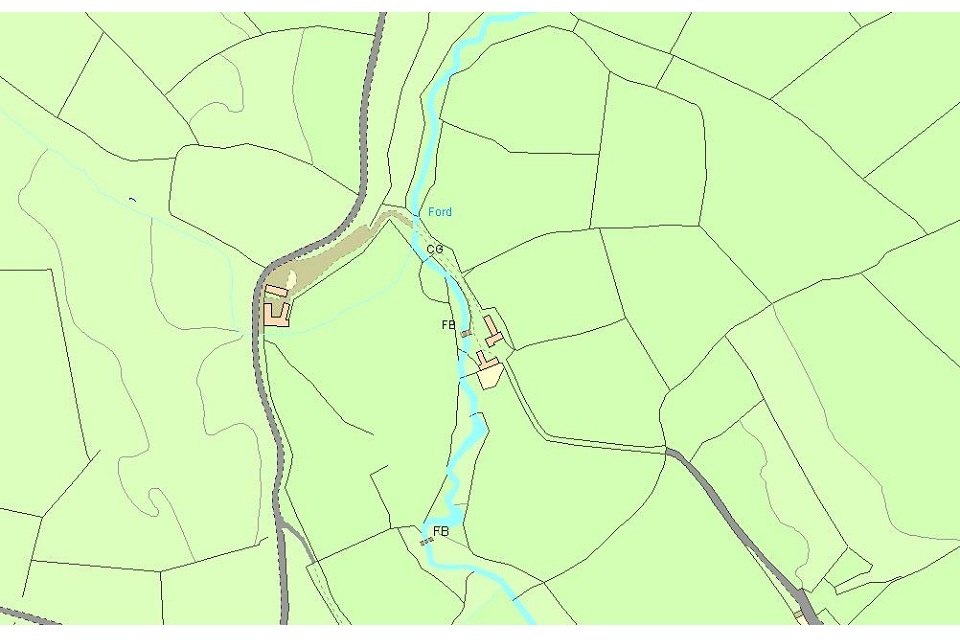
2.2 Example 2: scale 1:2500
HM Land Registry plan extract
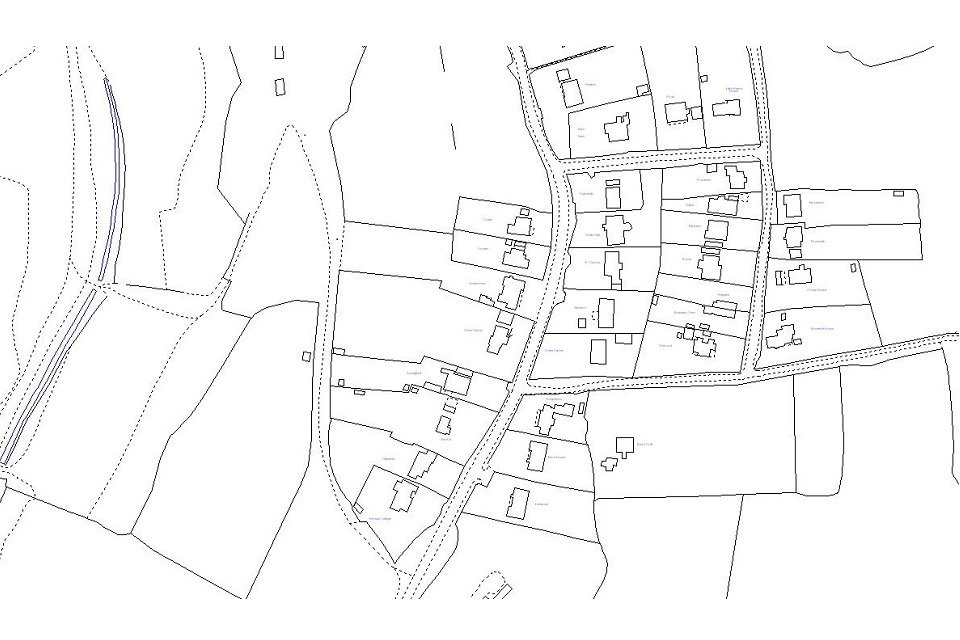
Land Registry plan extract
OS MasterMap
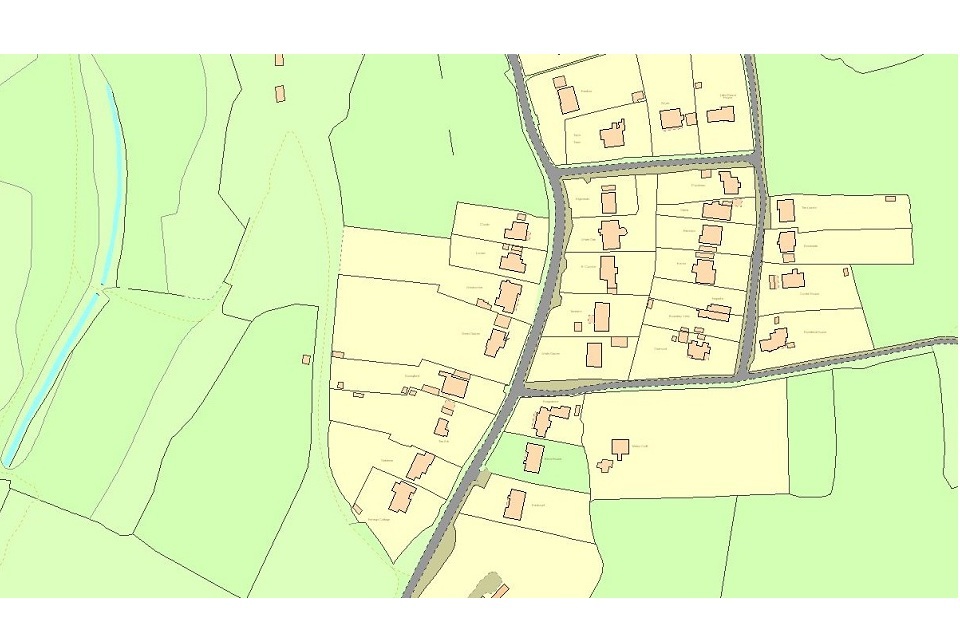
OS MasterMap
© CROWN COPYRIGHT. Produced by HM Land Registry. Further reproduction in whole or part is prohibited without the prior permission of Ordnance Survey.
2.3 Example 3: scale 1:10 000
HM Land Registry plan extract
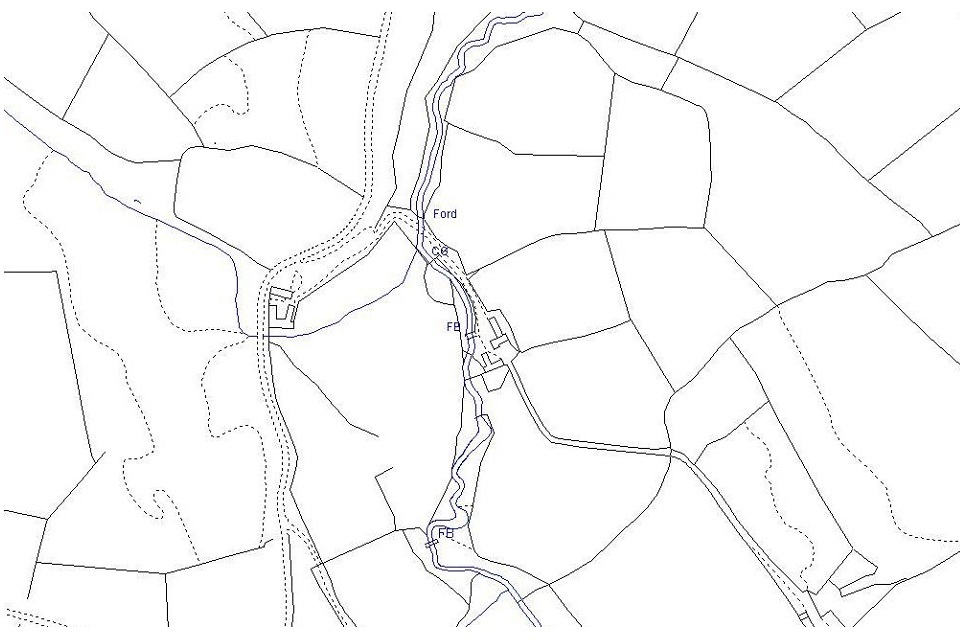
Land Registry plan extract
OS MasterMap
OS MasterMap
© CROWN COPYRIGHT. Produced by HM Land Registry. Further reproduction in whole or part is prohibited without the prior permission of Ordnance Survey.
3. Scale and accuracy of Ordnance Survey mapping
Utilising their standard surveying and mapping processes, it is not possible for Ordnance Survey to replicate the exact position of each physical feature on the ground. The degree of variation between the ‘real life’ position and that recorded on the map is known as the specified accuracy tolerance. This will mean that measurements scaled between features shown on Ordnance Survey mapping may not exactly match the actual distance measured between the same features on the ground. Different levels of accuracy apply dependent on the scale of the map and the original survey method used to create it.
As a general guide, the width of a line on a 1:1250 Ordnance Survey map roughly represents 0.3 metres on the ground. The width of a line on a 1/2500 Ordnance Survey map roughly represents 0.6 metres on the ground. Ordnance Survey publishes expected confidence levels in the accuracy of their maps in terms of relative and absolute accuracy, which are summarised in Relative accuracy and Absolute accuracy respectively.
It is for these reasons that HM Land Registry is unable to provide scaled measurements from title plans or from Ordnance Survey mapping.
Where an Ordnance Survey map has been enlarged from its original scale, the degree of accuracy remains the same as the original map specification. For example, a plan surveyed at 1:2500 and enlarged to 1:1250 will still be subject to the survey specifications of 1:2500 mapping.
It should be noted that copying, reducing or enlarging a plan is likely to distort its accuracy.
3.1 Accuracy categories
The large scale Ordnance Survey map has been produced at different scales using different surveying methods resulting in varying degrees of accuracy.
There are four accuracy categories.
- 1:1250 scale
- 1:2500 scale resurvey/reformed
- 1:2500 scale overhaul. Maps originally recompiled from pre-1946 County Series mapping
- 1:10 000 scale.
Ordnance Survey describes accuracy in two ways.
- Relative accuracy
- Absolute or positional accuracy.
3.2 Relative accuracy
Relative accuracy is a measure of the positional consistency of a data point in relation to other local points of detail. Relative accuracy compares the scaled distance between features measured from the map data with distances measured between the same features on the ground. The following table represents the relative accuracy applicable to the scale of capture.
| Relative accuracy | ||||
|---|---|---|---|---|
| Scale | Relative error | 95% confidence limit | 99% confidence limit | Maximum measured distance |
| 1:1250 (urban) | <±0.5m | <±0.9m | <±1.1m | 60.0m |
| 1:2500 resurvey or reformed (urban and rural) | <±1.0m | <±1.9m | <±2.5m | 100.0m |
| 1:2500 overhaul (urban and rural) | <±1.8m | <±3.6m | <±4.7m | 200.0m |
| 1:10 000 (mountain and moorland) | <±4.0m | <±7.7m | <±10.1m | 500.0m |
To put this in more practical terms, if, at a scale of 1:1250 the distances between well defined points of detail 60.0m apart were measured on the ground, there would be an expectation that 95 per cent would be represented on the Ordnance Survey map by scaled distances of between 59.1m and 60.9m. Similarly, at 1:2500 resurvey the measured distances between points of detail 100.0m apart there would be an expectation that 95 per cent would be represented on the Ordnance Survey map by scaled distances of between 98.1m and 101.9m.
3.3 Absolute accuracy
Absolute accuracy is the measure which indicates how closely the coordinates of a point in Ordnance Survey map data agree with the ‘true’ National Grid coordinates of the same point on the ground. As the true position can never be known exactly, the statistic is quoted relative to the best known position determined by precise survey methods. Ordnance Survey publishes the following expected absolute accuracy values for well-defined points within each category of mapping contained in the National Topographic Database.
| Absolute accuracy | |||
|---|---|---|---|
| Scale | RMSE* | 95% confidence level | 99% confidence level |
| 1:1250 (urban) | <±0.5m | <±0.8m | <±0.9m |
| 1:2500 (rural) (resurvey or reformed) | <±1.1m | <±1.9m | <±2.4m |
| 1:2500 (rural) | <±2.8m | <±4.7m | <±5.8m |
| 1:10 000 (mountain and moorland) | <±4.1m | <±7.1m | <±8.8m |
*RMSE (root mean squared error) is the square root of the mean of the sum of the squares of the errors between the observations.
The above information is reproduced with the kind permission of Ordnance Survey.
4. Feature representation on Ordnance Survey mapping
The Ordnance Survey map shows permanent physical features, normally at ground surface level, together with a variety of descriptive information and symbols. Generally the Ordnance Survey map shows features more than 30cm high such as walls, fences, hedges or building outlines by firm black lines. Features less than 30cm high, such as kerbs or where two different surfaces meet, are shown by dotted black lines. Dotted black lines can also represent features that overhang such as the outline of a building above ground surface level or where a roadway passes underneath.
Whatever the feature, it is important to remember that its depiction is a snapshot in time; the map shows that there was a feature in a given position at the time the survey was carried out and is shown to a level of accuracy and completeness that the surveying and mapping techniques of the time allowed.
The only features the Ordnance Survey map shows within private gardens are permanent buildings more than 12 sq metres in area, roads and tracks over 100m long. The Ordnance Survey map also shows other continuous features such as streams and features that mark the line of an administrative boundary. Ordnance Survey map specification has changed over the years, which can lead to some apparent inconsistencies.
The amount of information shown on the Ordnance Survey map differs between the scales. More detail can be shown on a larger scale map than on a map of a smaller scale; therefore, a 1:1250 map is surveyed to include more information and detail than a 1:2500 map. For example, a small feature such as a 1 metre jut in a building or a small dog-leg in a fence can be shown at a scale of 1:1250 whereas it may not be possible to show the same feature at a scale of 1:2500. Another example would be where two features on the ground, such as a hedge and a fence, are too close together to be plotted correctly at scale. In this instance two features 1 metre apart at 1:1250 scale or 2 metres apart at 1:2500 scale will be represented by a single feature on the map. In determining which of the two features to show, Ordnance Survey adopts the following hierarchy. It will show the feature that:
- is used to merge an administrative boundary (for example, if the administrative boundary follows the root of a hedge, then it is the hedge that would be the surveyed feature)
- appears to define the extent of a property – remember that this is Ordnance Survey’s interpretation of a property extent as opposed to an extent to which documentary title has been show or that has been registered
- appears more important (for example, if there is a wall or hedge next to a stock fence, then it is the wall or hedge that would be the surveyed feature)
5. Availability of Ordnance Survey mapping
HM Land Registry cannot supply extracts of Ordnance Survey map data it holds, either generally or for conveyancing purposes. Maps of a house or other property for planning permission and/or submission to HM Land Registry are not available directly from Ordnance Survey or HM Land Registry. Please visit www.ordnancesurvey.co.uk/pam to find your nearest Ordnance Survey partner selling large scale maps for this purpose.
6. Copyright
All HM Land Registry plans are Crown copyright and all rights are reserved. Please email any enquiries regarding copyright to DRO@landregistry.gov.uk.
7. Contacting Ordnance Survey
For further information on the scale, accuracy and how features are shown on Ordnance Survey mapping please visit the Ordnance Survey website, or use the following contact details:
- post:
Customer Service Centre,
Ordnance Survey,
Adanac Drive,
Southampton SO16 0AS
- email: customerservices@ordnancesurvey.co.uk
- phone: 08456 05 05 05, or their dedicated Welsh language helpline: 08456 05 05 04 between the hours of 08:30 and 17:30, Monday to Friday.
8. Things to remember
We only provide factual information and impartial advice about our procedures. Read more about the advice we give.