Laboratory reports of hepatitis A and C (England and Wales): October to December 2013
Published 25 April 2014

© Crown copyright 2014
This publication is licensed under the terms of the Open Government Licence v3.0 except where otherwise stated. To view this licence, visit nationalarchives.gov.uk/doc/open-government-licence/version/3 or write to the Information Policy Team, The National Archives, Kew, London TW9 4DU, or email: psi@nationalarchives.gov.uk.
Where we have identified any third party copyright information you will need to obtain permission from the copyright holders concerned.
This publication is available at https://www.gov.uk/government/publications/laboratory-reports-of-hepatitis-a-and-c-2013/laboratory-reports-of-hepatitis-a-and-c-england-and-wales-october-to-december-2013
1. Laboratory reports of hepatitis A (England and Wales): October to December 2013
There were a total of 67 laboratory reports of hepatitis A reported to PHE during the fourth quarter of 2013 (October-December). This was a 19.6% increase on the number of reports during the third quarter of 2013 (n=56) and a 23.9% decline on the same quarter in 2012 (n=88).
Age-group and sex were well reported (>98% complete). Thirty (45.5%) reports were among those aged over 44 years, a further 21 (31.8%) reports were from those aged 15-44 years and 15 (22.7%) reports were from the under 15 year age-group.
Males accounted for 57.6% of all reports. This varied by age-group; males accounted for 66.7% of the 15 to 44 years old age group and 60% of the over 44 years age-group, conversely females accounted 60.0% of the under 15 years age-group.
1.1 Table 1. Laboratory reports of hepatitis A in England and Wales, October to December 2013
| Age group | Male | Female | Unknown | Total |
|---|---|---|---|---|
| <1 year | 0 | 0 | 0 | 0 |
| 1 to 4 years | 0 | 1 | 0 | 1 |
| 5 to 9 years | 3 | 6 | 0 | 9 |
| 10 to 14 years | 3 | 2 | 0 | 5 |
| 15 to 24 years | 5 | 3 | 0 | 8 |
| 25 to 34 years | 6 | 2 | 0 | 8 |
| 35 to 44 years | 3 | 2 | 0 | 5 |
| 45 to 54 years | 6 | 4 | 0 | 10 |
| 55 to 64 years | 4 | 4 | 0 | 8 |
| ≥ 65 years | 8 | 4 | 0 | 12 |
| Unknown | 0 | 0 | 1 | 1 |
| Total | 38 | 28 | 1 | 67 |
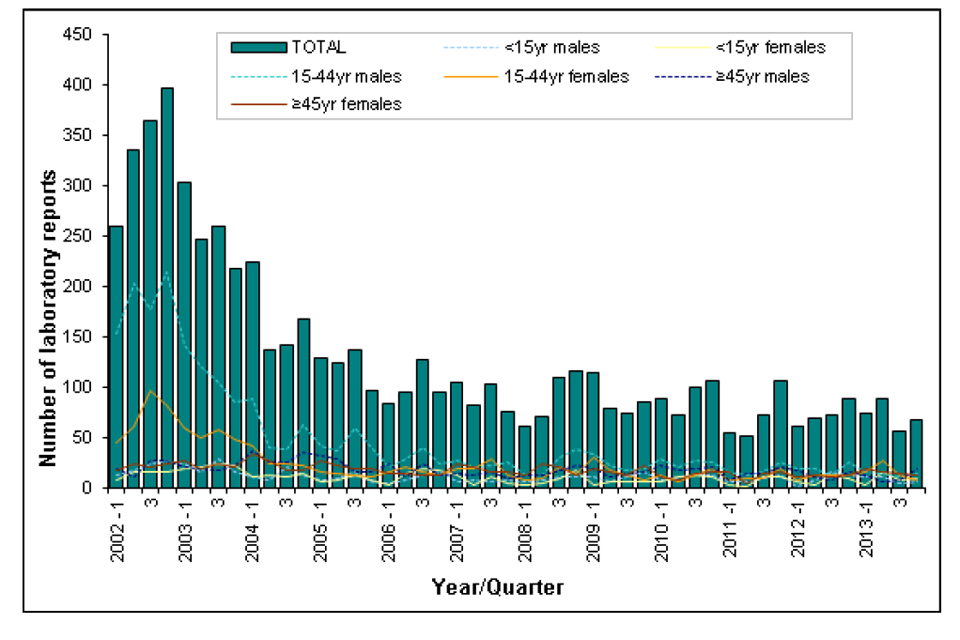
Laboratory reports of hepatitis A by age group and sex (England and Wales), January 2002 to December 2013
2. Laboratory reports of hepatitis C (England and Wales), October to December 2013
There were a total of 2,757 laboratory reports of hepatitis C reported to PHE between October and December 2013. This was a 4.7% decline on the previous quarter (n=2,893), and a similar number of reports as the same quarter in 2012 (n=2,696).
Age-group and sex were well reported (>98% complete). Where known males accounted for 69.2% of reports (1,879/2,716), which is consistent with previous quarters. Adults aged 25 to 44 years accounted for 54.4% of the total number of hepatitis C reports.
2.1 Table 2. Laboratory reports of hepatitis C in England and Wales, October-December 2013
| Age group | Male | Female | Unknown | Total |
|---|---|---|---|---|
| <1 year | 3 | 4 | 0 | 7 |
| 1 to 4 years | 1 | 1 | 0 | 2 |
| 5 to 9 years | 2 | 1 | 0 | 3 |
| 10 to 14 years | 3 | 1 | 0 | 4 |
| 15 to 24 years | 59 | 59 | 3 | 121 |
| 25 to 34 years | 457 | 247 | 11 | 715 |
| 35 to 44 years | 571 | 196 | 12 | 779 |
| 45 to 54 years | 501 | 186 | 8 | 695 |
| 55 to 64 years | 212 | 89 | 3 | 304 |
| ≥65 years | 62 | 51 | 1 | 114 |
| Unknown | 8 | 2 | 3 | 13 |
| Total | 1,879 | 837 | 41 | 2,757 |