Annual Report on Major Projects 2020 to 21
Published 15 July 2021

© Crown copyright 2021
This publication is licensed under the terms of the Open Government Licence v3.0 except where otherwise stated. To view this licence, visit nationalarchives.gov.uk/doc/open-government-licence/version/3 or write to the Information Policy Team, The National Archives, Kew, London TW9 4DU, or email: psi@nationalarchives.gov.uk.
Where we have identified any third party copyright information you will need to obtain permission from the copyright holders concerned.
This publication is available at https://www.gov.uk/government/publications/infrastructure-and-projects-authority-annual-report-2021/annual-report-on-major-projects-2020-to-21
1. The Government Major Projects Portfolio
1.1 The Infrastructure and Projects Authority
The Infrastructure and Projects Authority (IPA) is the government’s centre of expertise for infrastructure and major projects. It sits at the heart of government, reporting to the Cabinet Office and HM Treasury (HMT). The IPA works across government to support the successful delivery of all types of major projects, ranging from railways, roads, schools, hospitals and housing to energy, telecommunications, defence, IT and major transformation programmes.
Our purpose is to continuously improve the way the government delivers projects and programmes and to provide confidence that they will achieve their aims, improve public services and people’s lives. As part of this, the IPA drives the development of the project delivery profession, and of the world-class skills and expertise needed to meet our ambition for nothing less than world class delivery.
1.2 The Government Major Projects Portfolio
The Government Major Projects Portfolio (GMPP) ensures robust oversight of the government’s most complex and strategically significant projects and programmes. The GMPP comprises the largest, most innovative and highest risk projects and programmes delivered by the government. GMPP projects are typically those where approval is required from HMT, either because the budget exceeds a department’s delegated authority level and/or because the project is novel, complex, contentious, or requires primary legislation. While the GMPP spans many of the government’s most high-profile projects, it represents a subset of the projects delivered across government.
Projects on the GMPP receive independent scrutiny and assurance from the IPA. Expert teams in the IPA also give specialist project delivery, commercial and financial advice, provide practical tools and make specific recommendations to help improve the chance of successful delivery. Projects on the GMPP are required to provide quarterly data returns on delivery progress. This data is used to monitor progress across the portfolio and risks and insights are shared with departments and the centre of government. This year’s GMPP snapshot comprises 184 projects with a total Whole Life Cost (WLC) of £542bn and £826bn of monetised benefits that are delivered by 18 departments and their arm’s-length bodies.
GMPP projects fall into one of four categories, determined by the purpose and nature of their delivery.
-
Infrastructure and Construction projects include improving and maintaining the UK’s energy, environment, transport, telecommunications, sewage and water systems; and constructing new public buildings. These high investment projects are essential to the nation’s economic growth, development and prosperity. An example is the work to add new capacity and sustainable infrastructure through the HS2 Phase 1 project, which will link Britain’s largest cities with a new low carbon and high-speed rail line.
-
Transformation and Service Delivery projects change ways of working to improve the relationship between government and the people of the UK, and harness new technology to improve public services and/or make government more efficient. This category encompasses a wide field of projects including the Vaccines Task Force, which was set up in response to the COVID-19 pandemic to ensure that the UK population has access to safe and effective COVID-19 vaccines as soon as possible.
-
Military Capability projects are vital to the effective operation of the Armed Forces. Many military projects ensure the Armed Forces have the correct resources and personnel, as well as equipment and systems , such as the Dreadnought-class ballistic submarine programme.
-
Information and Communication Technology (ICT) projects enable the transition from old legacy systems to new digital solutions to equip government departments for the future. ICT projects are very important for achieving cost savings and efficiency and ensure our public services benefit from advances in innovation and technology. One example of this is the HMRC’s Technology Sourcing Programme which will deliver new contracts for IT services and improve our ways of working through simplified capabilities, processes, tools and standards.
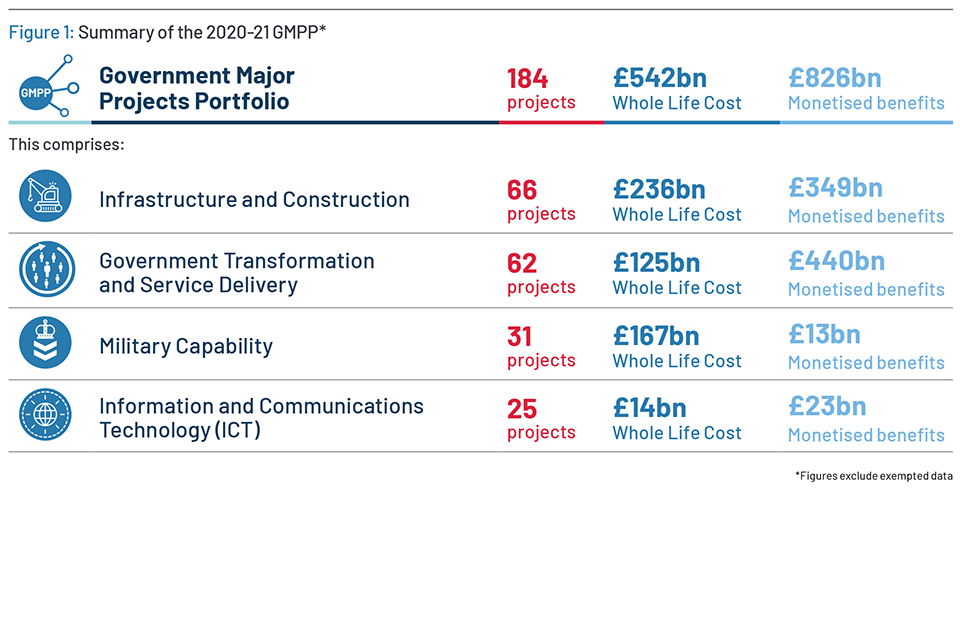
Figure 1: Summary of the 2020-21 GMPP
The GMPP is an evolving portfolio that shifts in size and shape as projects join and leave. Since the 2019 Annual Report, 95 projects have joined and 36 projects have left the GMPP. The number of joining projects is significantly higher this year compared to any other previous year (see Figure 2). This influx of projects reflects the importance the IPA now places on front end-loading. It follows a review into major project governance and ensures that rigorous oversight of project management and delivery is applied to all eligible projects meeting GMPP criteria (see IPA Annual Report on Major Projects 2020-21, section ‘Discipline across the GMPP’, page 21). As a result, the GMPP portfolio increased both in size and cost (see Figure 2).
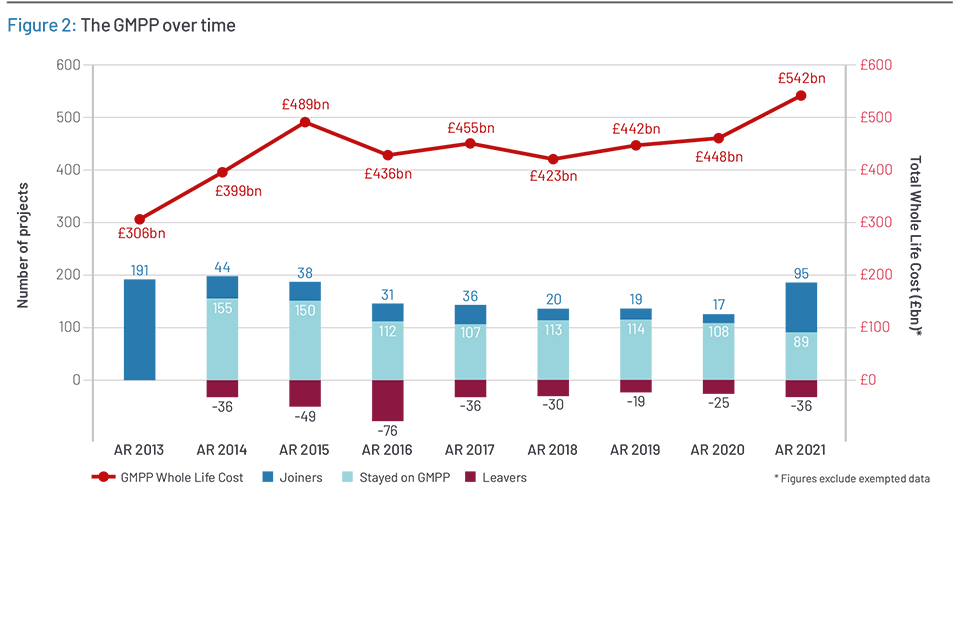
Figure 2: The GMPP over time
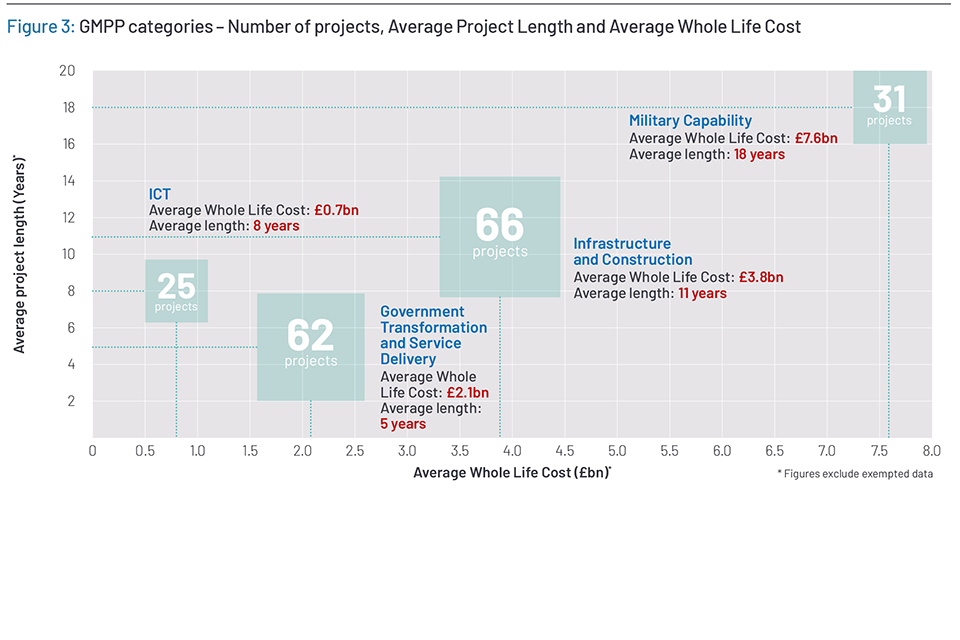
Figure 3: GMPP categories – Number of projects, Average Project Length and Average Whole Life Cost
Infrastructure and Construction is the largest GMPP category both in terms of project number and Whole Life Cost. Currently there are 66 Infrastructure and Construction projects on the portfolio, up from 34 last year, with a total Whole Life Cost of £236bn, and a total monetised benefits of £349bn. As with Military Capability, these projects are typically lengthier than projects in other categories (with an average duration of 11 years).
Transformation and Service Delivery is the second largest category by project number, totalling 62 projects this year. This is an increase on last year when there were 34 projects on the GMPP in this category, with many leaving after their successful delivery (see IPA Annual Report on Major Projects 2020-21, page 18). Projects in this category tend to have a lower average Whole Life Cost (£2.1bn) and as a result it is only the third largest category in terms of total Whole Life Cost (at £125bn). These projects have the largest amount of reported monetised benefits: £440bn. Projects also tend to be shorter (5 years) compared to Military Capability and Infrastructure and Construction projects.
Military Capability projects are some of the most complex and strategically important that the government delivers. Military Capability is the second largest category in terms of total Whole Life Cost (at £167bn) and, in line with their scale, these projects tend to be lengthier than other categories, with an average forecast duration of 18 years. This year, there are 31 projects in this category. This is a slight increase from last year, when there were 30 projects on the GMPP in this category. Military Capability projects are reporting the lowest amount of monetised benefits, £13bn. This is because the benefit these projects provide is often not convertible into a pound figure. All Military Capability projects are delivered by the Ministry of Defence.
Information and Communications Technology (ICT) is the smallest category by number and value with 25 projects at a total Whole Life Cost of £14bn but is still an important part of the portfolio with many projects in other categories having significant digital components. On average, these projects take 8 years to deliver.
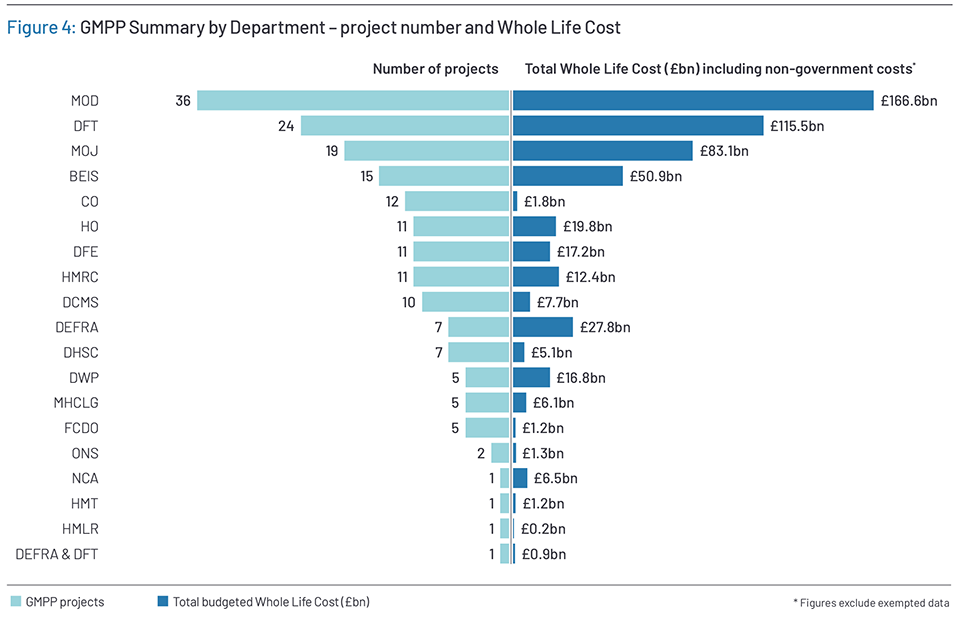
Figure 4: GMPP Summary by Department – project number and Whole Life Cost
The GMPP consists of projects from 18 departments with varying portfolio sizes. The Ministry of Defence (MOD) and the Department for Transport (DfT) continue to make up the majority of the GMPP with 33% of projects by number and 51% by Whole Life Cost.
MOD has the largest portfolio and the highest Whole Life Cost by department. This year, there are 36 MOD projects on the GMPP, which account for about a fifth of the portfolio by number. MOD delivers all of the 31 Military Capability projects, as well as 5 ICT projects.
DfT has the second largest portfolio and the second highest Whole Life Cost by department. Of the 24 projects that are led by DfT, 22 are Infrastructure and Construction projects, and 2 Transformation and Service Delivery projects.
Ministry of Justice (MOJ) has the third largest portfolio and the third highest Whole Life Cost by department. Of the 19 projects that are led by MOJ, 12 are Transformation and Service Delivery projects; 5 are Infrastructure and Construction projects; and 2 are ICT projects.
The Department for Business Energy and Industrial Strategy (BEIS) is the fourth and final significant contributor to the Whole Life Cost of the GMPP, accounting for a larger amount of cost than the next 2 departments, the Department for Environment, Food & Rural Affairs (DEFRA) and the Home Office (HO), despite having fewer projects. The Department for Work and Pensions (DWP) only has 5 projects on the GMPP, but these have a total cost of approximately £17bn.
There are several departments with multiple GMPP projects that are actively managed as part of wider portfolios. This is in line with the government Project Delivery Functional Standard, which identifies that, ‘a portfolio comprises part or all of an organisation’s investment required to achieve its objectives… such as other portfolios, programmes, projects, other work and work packages’.[footnote 1] The Standard sets the expectation that all departments will adopt a portfolio management framework to manage their major projects and programmes.
The maturity of portfolio management varies across departments. For example, HMRC has a well-developed central portfolio approach to govern the major project investments, to actively manage resources and to adjust delivery priorities in response to changes in context. Other departments take a similar approach, with arrangements tailored to suit the nature of the portfolios and to dock with existing governance, accountabilities and responsibilities. Following from last year’s Department for Transport and IPA’s ‘Lessons from transport for the sponsorship of major projects’, DfT has now implemented a central portfolio approach to managing its major projects. Other departments also manage clearly identifiable sub-portfolios. For example, the Department for Culture Media and Sport (DCMS) has several projects that collectively are part of the Building Digital UK programme for delivering broadband networks to the nation.
In the above examples a portfolio approach allows the departments to ensure that their particular mix of projects and programmes is helping to deliver their strategic objectives. The IPA is committed to supporting the development of increasingly mature and effective approaches to portfolio management in departments. Through a combination of tailored advice and support and the introduction of portfolio-level assurance tools, the IPA aims to help departments to manage the totality of their major change, as well as delivering the individual projects successfully.
1.3 GMPP delivery confidence
The IPA assesses the likelihood of each project delivering its objectives to time and cost with a Delivery Confidence Assessment (DCA). Ratings are categorised into five groups, which span a range from Red to Green, with each providing an indication of the likelihood of successful delivery and level of associated risks. Detailed definitions of each rating can be found in Annex A. DCAs are not a comprehensive reflection of project performance but reflect a project’s likelihood of success at a specific snapshot in time if issues and risks are left unaddressed. They are reviewed quarterly by the IPA and change depending on the challenges projects are facing, the results of focused independent assurance reviews and actions taken by projects. By taking the right steps following reviews and managing delivery challenges effectively, DCAs are often improved over time.
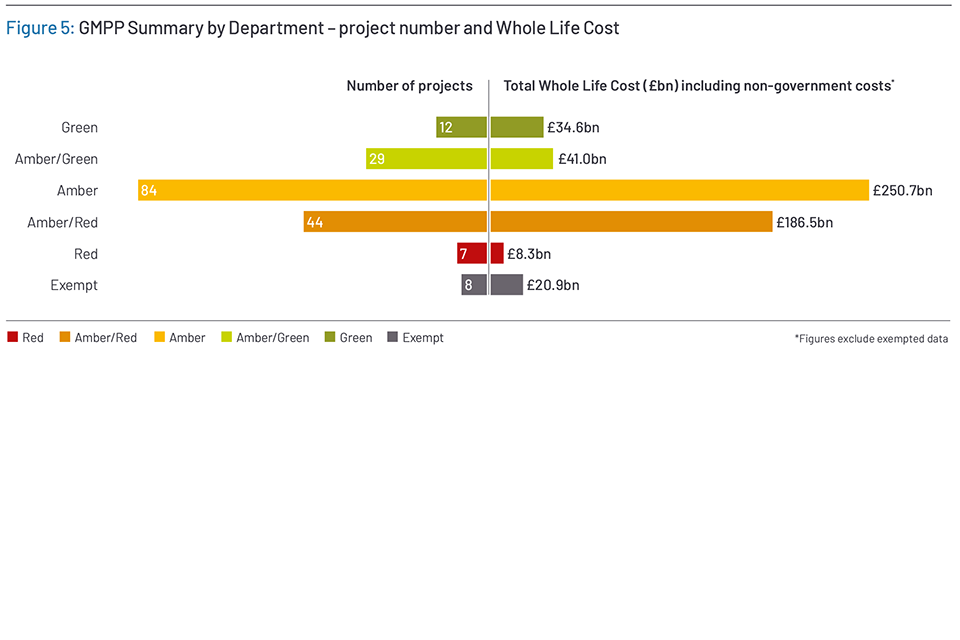
Figure 5: GMPP Summary by Department – project number and Whole Life Cost
At this year’s snapshot (end of March 2021)[footnote 2], 41 projects were rated Green or Amber/Green (22% of the GMPP) and 51 projects were assigned Red or Amber/Red (28%), while 84 projects (46%) were Amber (see Figure 5).
As illustrated in Figure 5 in the 2020-21 snapshot there was around £8bn of Whole Life Costs associated with projects rated Red (this figure excludes HS2 phase 2b’s cost). Amber-rated projects make up almost half of the portfolio by project number and are responsible for almost half of total Whole Life Cost. Green or Amber/Green projects make up about 15% of GMPP’s total Whole Life Cost.
In this year’s report, there are 7 projects rated as Red, but 3 of these projects have joined GMPP this year. Out of the remaining 4 projects, only two have remained Red compared to last year’s Annual Report, the Crowsnest Programme, and HS2 phase 2b. The other 2 projects, National Law Enforcement Data Programme (NLEDP) and Armoured Cavalry 2025, have had their DCA rating increased by the IPA to Red at this year’s Annual Report.
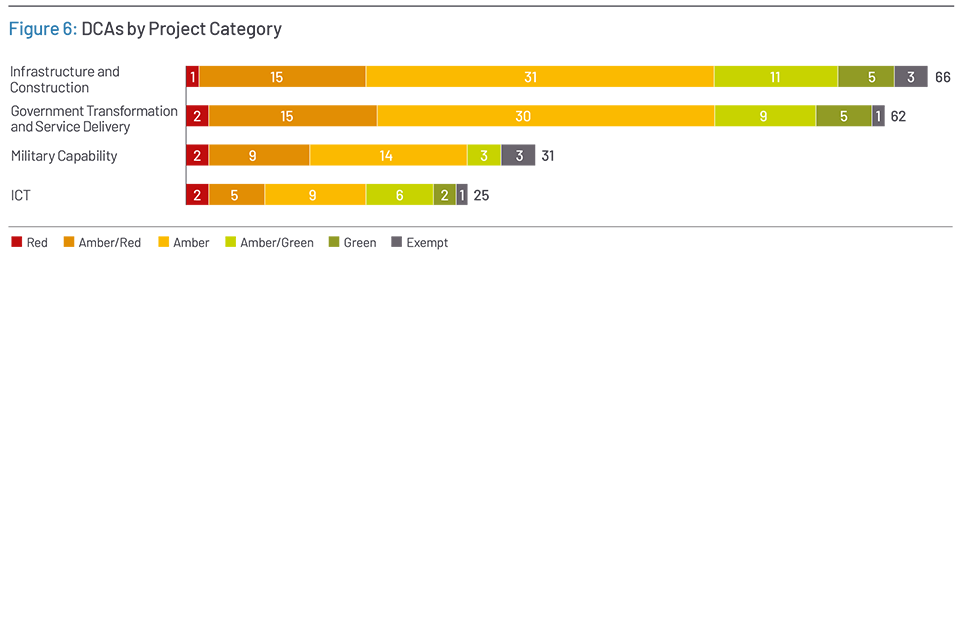
Figure 6: DCAs by Project Category
In looking at this pattern of delivery confidence, it is important to acknowledge that GMPP projects are the government’s most difficult and challenging projects to deliver. They are, by definition, large, complex or innovative, with many ‘breaking new ground’. Focusing on supporting these difficult projects is at the core of the GMPP’s purpose. This helps ensure IPA resources are deployed to priority areas; and it aligns with the IPA’s commitment of increasing focus on the most difficult projects in order to set them up for success.
1.4 GMPP delivery confidence by category
Projects with a Red Delivery Confidence Assessment are almost evenly spread around the 4 Annual Report categories, where each contains 2 red projects, with the exception of Infrastructure and Construction that only has one red project. Of projects with an Amber/Red Delivery Confidence Assessment, 66% are either Transformation and Service Delivery or Infrastructure and Construction.
Projects in all the Annual Report categories, except for Military Capability, receive in proportion, similar DCA ratings. On average, 70% of Infrastructure and Construction, Transformation and Service Delivery, and ICT projects are rated Amber or better. For projects in the Military Capability category, this percentage is 55%.
Projects in the ICT category have most improved compared to the data in last year’s report. This year, 32% of ICT projects are rated Amber/Green or better, compared to only 7% reported last year.
There are several strands of work underway across government to support and improve the future delivery of Infrastructure and Construction. This includes the recent publication of the UK’s first National Infrastructure Strategy (NIS) in November 2020 (see IPA Annual Report on Major Projects 2020-21, section ‘Infrastructure Delivery’, page 26), the launch in April 2021 of the IPA’s Cost Estimating Guidance (see IPA Annual Report on Major Projects 2020-21, section ‘Capacity and Capability’, page 24), and the refresh of the Transforming Infrastructure Performance (TIP) publication – TIP: Roadmap to 2030 – in July 2021 (see IPA Annual Report on Major Projects 2020-21, section ‘Infrastructure Delivery’, page 26).
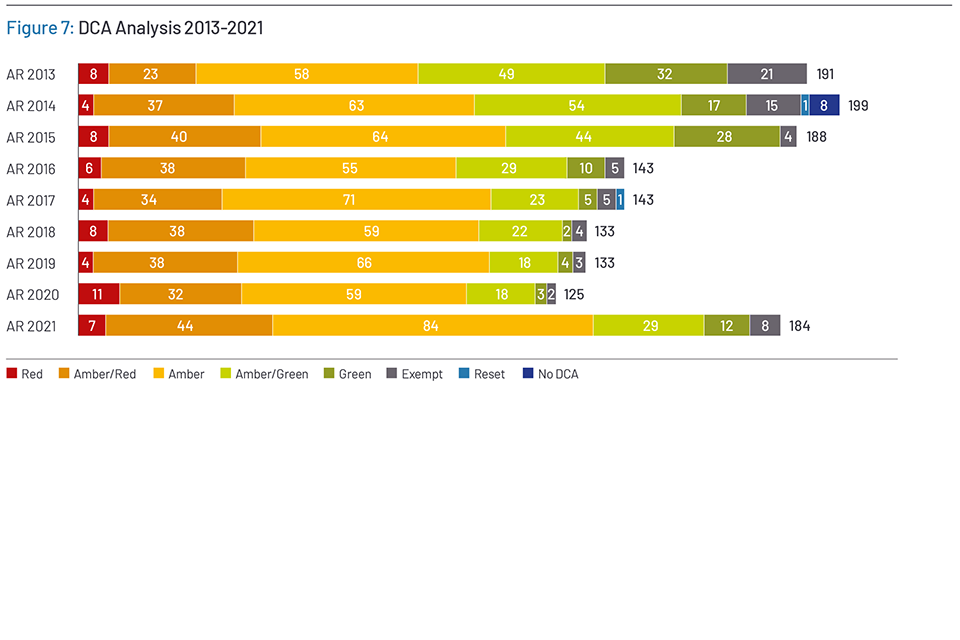
Figure 7: DCA Analysis 2013-2021
1.5 GMPP delivery confidence change
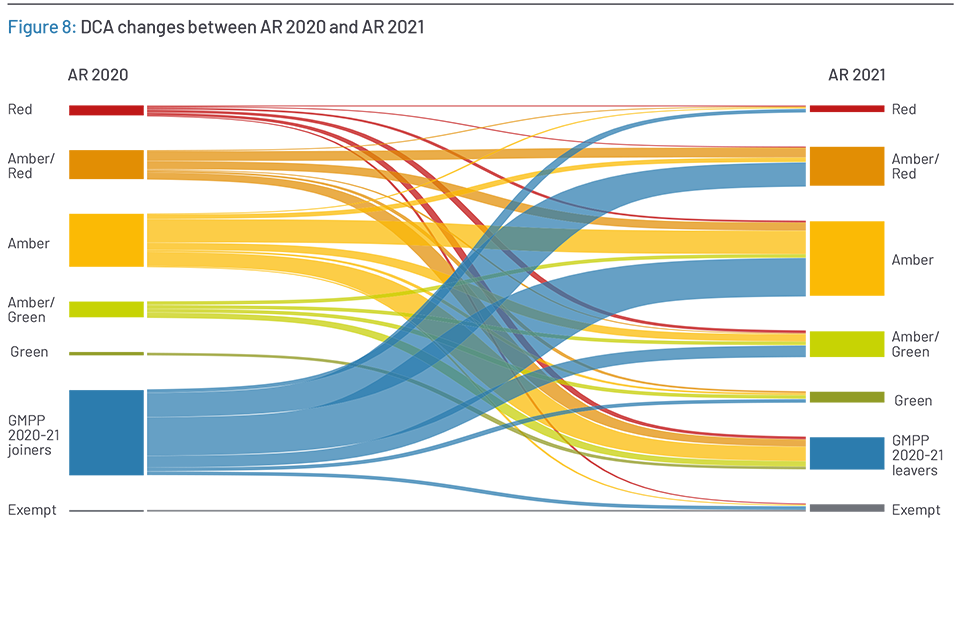
Figure 8: DCA changes between AR 2020 and AR 2021
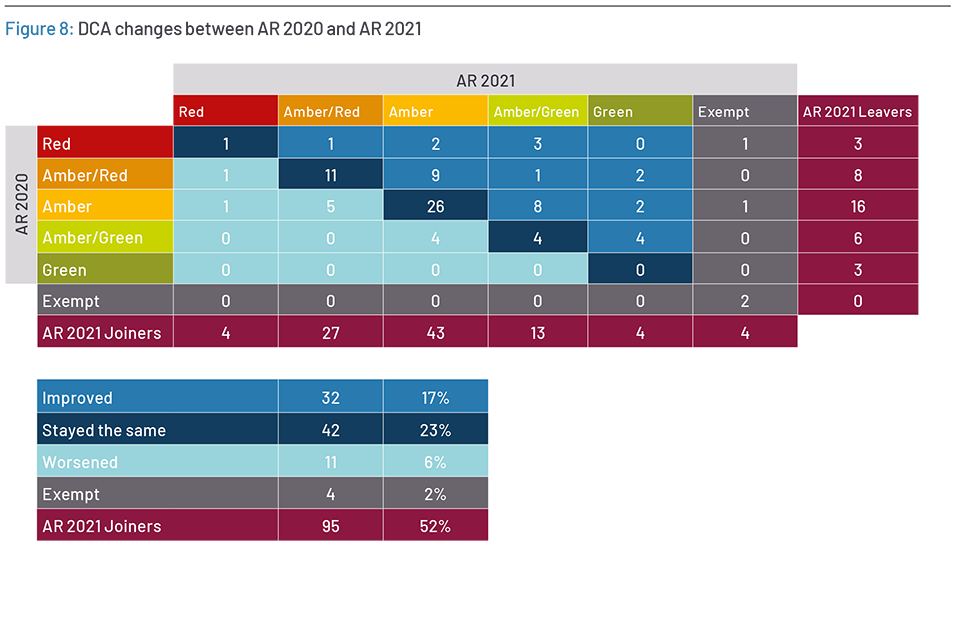
Figure 8b: DCA changes between AR 2020 and AR 2021
The cohort of GMPP projects presents many distinct challenges and complexities, and these are highlighted by a dual trend in the pattern of delivery confidence (see Figure 7). In the first 4 years, there is a decrease in projects’ health, where the proportion of projects that are Amber/Red or worse increased from 16% (31 projects) at the 2013 Annual Report to 31% (44 projects) at the 2016 Annual Report. Since then, there has been a relative plateau in projects’ health, where the proportion of projects that are Amber/Red or worse remained at about 31% over the past 6 years.
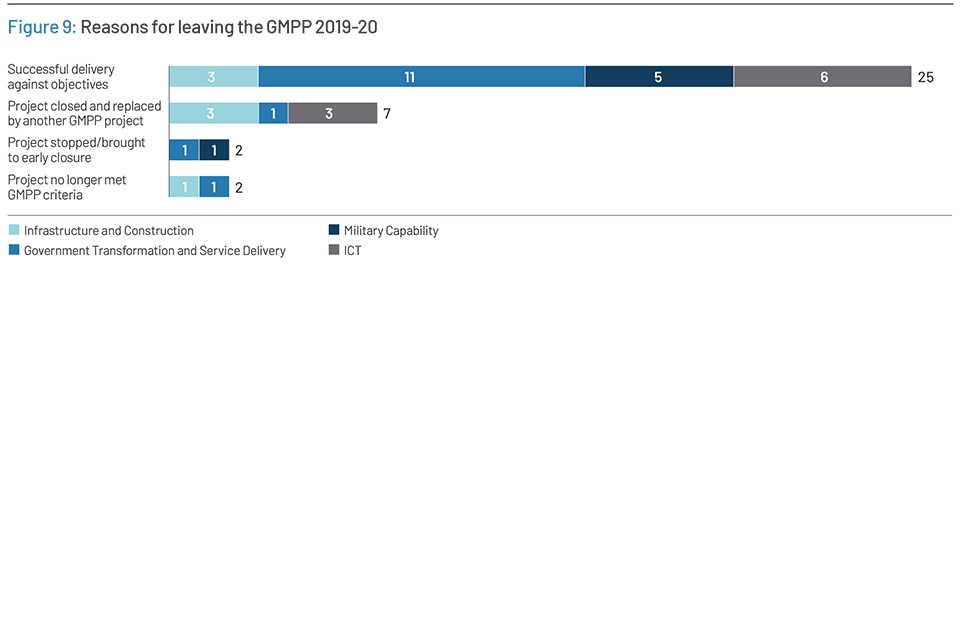
Figure 9: Reasons for leaving the GMPP 2019-20
Despite these long-term challenges and complexities, the impact of the government and IPA’s actions is starting to be visible in the data. Compared to last year, there has been an overall increase in projects’ delivery confidence, where the proportion of projects that are Amber/Red or worse has reduced from 34% last year (43 projects) to 28% this year (51 projects) (see Figure 7). A careful analysis of this reduction reveals that it is attributable to the IPA’s action, not to the influx of new GMPP projects (see Figure 8):
-
Projects that have joined GMPP this year as part of the GMPP reset are about as confident in their delivery as last year’s GMPP portfolio. Of the 95 projects that joined GMPP this year, 34% of projects (31 projects) were Amber/Red or worse, compared to 33% (43 projects) last year.
-
Projects that have remained on GMPP since the last annual report are more confident in their delivery than they were a year ago. Of the 89 current projects that have been on the GMPP for at least a year, 36% (32 projects) have improved their DCA since the last Annual Report, while 12% (12 projects) have moved to a worse DCA than in 2019. The remaining 47% (42 projects) have maintained their DCA rating compared to 2019. Of those that improved DCA, 10 projects improved by 2 or more DCA ratings. This notably includes the Future Maritime Support Programme, GOV UK Verify, which moved down from Red to Amber/Green at the 2020/21 Q4 snapshot.
These ratings demonstrate the significant challenges inherent in delivering such complex projects and programmes. Building project delivery capability across government continues to be a priority for the IPA, as well as providing departments with expert support and advice from the centre (see IPA Annual Report on Major Projects 2020-21, section ‘Capacity and Capability’, page 24).
1.6 GMPP leavers 2019-20
Since last year’s Report, 36 projects have left the GMPP. In most cases a project leaves the GMPP when it has been successfully delivered or no longer demands regular IPA support; for instance, where a project reaches a business-as-usual stage of delivery, readiness to leave is judged by the IPA alongside departments. Of the 36 projects that left the GMPP this year, 25 were on track to deliver against their objectives and expected benefits.
Other reasons for leaving the GMPP include where a project is merged with, or replaced by, other similar projects, or when it no longer meets the GMPP criteria. For example, HS2 was replaced and divided into 3 new projects which have each joined the GMPP: HS2 phase 1, HS2 phase 2a, and HS2 phase 2b.
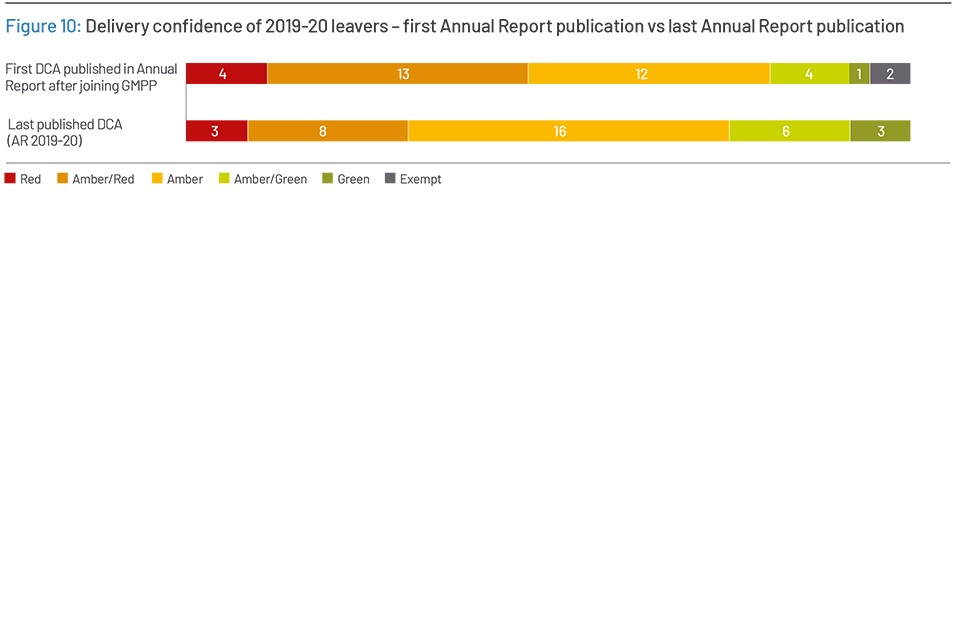
Figure 10: Delivery confidence of 2019-20 leavers – first Annual Report publication vs last Annual Report publication
Projects join the GMPP at an early stage of their lifecycle and consequently with an uncertain delivery confidence. This is illustrated in the initial published DCAs for this year’s leavers cohort: of the 36 projects that left the GMPP in the last year, 17 started with a Red or Amber/Red DCA while 5 projects started with a Green or Amber/Green DCA. Over the course of their time on the GMPP, 9 projects left the GMPP with a Green or Amber/Green delivery confidence. Considering the complexity of these projects and the challenging delivery environment this is a positive performance and shows improvements over time.
Nearly one in 2 projects leaving with a Red or Amber/Red DCA in the last year were closed and replaced by another GMPP project. The IPA has overseen an increase in this type of closure in the last 12 months for strategic, operational reasons or to support departmental prioritisation.
While the IPA supports successful project delivery, it must also help government and departments to prioritise the correct projects. This year 2 projects have been stopped or brought to an early closure.
Leaving the GMPP rarely marks the end of a project’s delivery, and for some of the most complex projects the IPA maintains a continued involvement in the project, as required. In line with recent National Audit Office recommendations, the IPA is committed to ensuring that all projects leaving the GMPP have had an exit (or equivalent) review which includes consideration of the ongoing tracking of project benefits.
-
Lessons from Transport for the Sponsorship of Major Projects, DfT/ IPA (2019) ↩
-
This year the Annual Report is using more up-to-date data than its previous iterations. As a result, the data in this year’s report are accurate as of 31 March, compared to 30 September for previous versions of the Annual report. This change ensured that all eligible projects meeting GMPP criteria had been onboarded onto GMPP (see IPA Annual Report on Major Projects 2020-21, section ‘Discipline across the GMPP’, page 18) ↩