Why do people come to the UK? (3) To study
Published 30 November 2017

© Crown copyright 2017
This publication is licensed under the terms of the Open Government Licence v3.0 except where otherwise stated. To view this licence, visit nationalarchives.gov.uk/doc/open-government-licence/version/3 or write to the Information Policy Team, The National Archives, Kew, London TW9 4DU, or email: psi@nationalarchives.gov.uk.
Where we have identified any third party copyright information you will need to obtain permission from the copyright holders concerned.
This publication is available at https://www.gov.uk/government/statistics/immigration-statistics-july-to-september-2017/why-do-people-come-to-the-uk-3-to-study
Back to Immigration statistics July to September 2017 content page.
This is not the latest release. View latest release.
Data relate to the year ending September 2017 and all comparisons are with the year ending September 2016, unless indicated otherwise.
This section provides on overview of emerging trends related to Study visas granted to non-European Economic Area (EEA) nationals. It also includes estimates of non-European Union (EU) long-term immigration to study (i.e. those intending to stay for at least 12 months to work). In line with our plan to provide users annually with a more detailed commentary, a more detailed discussion of the figures was included in the Immigration Statistics April to June 2017 release Why do people come to the UK? (3) To study topic. In August ONS also published: (ONS) International student migration research update.
The Higher Education Statistics Agency, publishes data on new entrants to UK higher education providers. ONS publishes figures on long-term immigration to study (i.e. those intending to stay for at least 12 months to study) for EU and non-EU nationals. ONS data are published in the Migration Statistics Quarterly Report.
1. Key facts
Aside from visitors, the most common visa granted was for study (8% of all visas granted, and 37% of non-visit visas).
In the year ending September 2017, there were 224,392 study-related visas granted, excluding the Short-term student category (formerly known as Student visitors), an increase of 8% (16,942).
Over the same period, the number of University-sponsored study visa applications (main applicants) rose 6% to 177,961.
Within the University sector there was a 9% increase for Russell Group universities to 87,362. There were increases for the Independent school (3% to 13,787) and English Language school (34% to 3,755) sectors; however, the Further education sector fell (-4% to 14,278). Most of the fall in the Further education sector’s sponsored visa applications since the peak in mid-2011 was accounted for by licences which have since been revoked.
In the year ending June 2017, the Office for National Statistics (ONS) estimates that there were 95,000 non-EU long-term immigrants coming to study and who had an intention to remain a year or more, a 16% fall (-18,000), but this is not statistically significant. The comparable number of study visas issued rose by 5% to 143,735.
Three nationalities (China, United States and India) accounted for around half (52%) of the 224,392 study-related visas granted in the year ending September 2017, with the largest number going to Chinese nationals (88,258 or 39% of the total). There were higher numbers of Study visas granted for Chinese (+11,697 or +15%), Indian (+2,962; +27%), Pakistani (+1,141; +36%) and United States (+877; +6%) nationals; and fewer issued to Indonesian (-680; -21%), Nigerian (-549; -8%) and Malaysian (-511; -6%) nationals.
2. Study immigration: latest trends
| Year ending September 2016 | Year ending September 2017 | Change | Percentage change | |
|---|---|---|---|---|
| Study-related visas granted, excluding Short-term students (1) | 207,450 | 224,392 | +16,942 | +8% |
| of which (Top 5): | ||||
| China | 76,561 | 88,258 | +11,697 | +15% |
| United States | 14,162 | 15,039 | +877 | +6% |
| India | 11,119 | 14,081 | +2,962 | +27% |
| Hong Kong | 8,923 | 9,332 | +409 | +5% |
| Saudi Arabia | 8,486 | 8,352 | -134 | -2% |
| Short-term study visas (1) (main applicants only) | 86,320 | 105,804 | +19,484 | +23% |
| Year ending June 2016 | Year ending June 2017 | Change | Percentage change | |
| Long-term immigration for study, excluding dependants (2) | 113,000 | 95,000 | -18,000 | -16% |
| Long-term (1 year or more) study-related visas, excluding dependants | 136,630 | 143,735 | +7,105 | +5% |
Table notes
Source: Home Office, Immigration Statistics July to September 2017, Visas tables vi 04 q (volume 1) and Visas tables vi 06 q s (volume 3), International Passenger Survey, Office for National Statistics, Migration Statistics Quarterly Report Statistical bulletins.
(1) The Short-term study category (previously described as Student visitor) allows individuals to come to the UK for 6 months (or 11 months if they will be studying an English Language course) and cannot extend their stay (further details, Short-term study visa. For consistency and comparability over time Short-term study visas have been excluded from study-related totals.
(2) The fall of 18,000 in non-EU study-related immigration for the year ending June 2017 had an estimated confidence interval of +/-20,000.
(3) Immigration for study data are estimates of the number of non-EU nationals intending to change their residence to the UK for at least 12 months based on the International Passenger Survey.
3. Long-term trends in student immigration
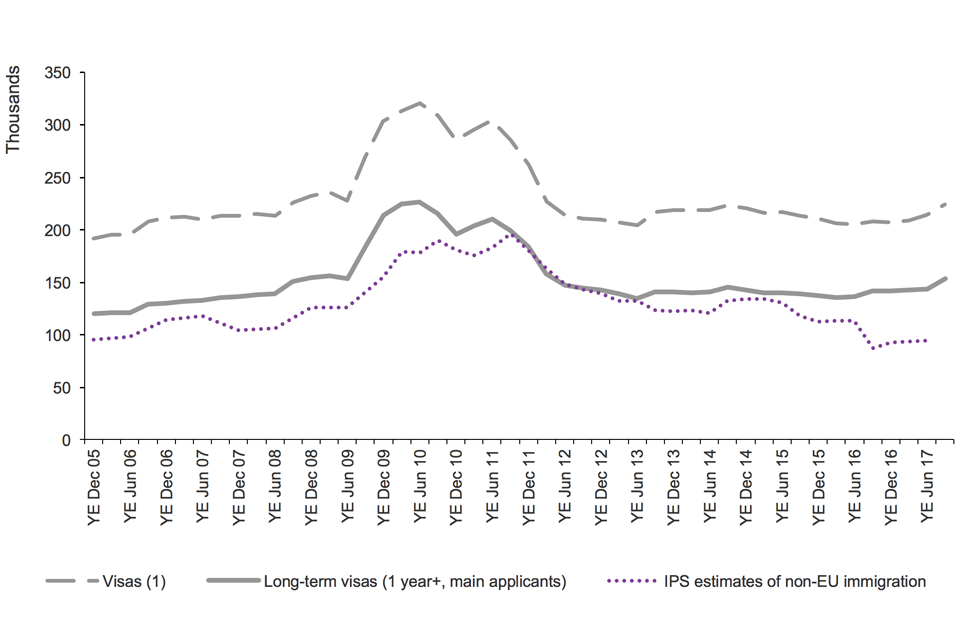
The chart shows the trends for Study of visas granted and International Passenger Survey (IPS) estimates of non-EU immigration, between 2005 and the latest data published. The data are sourced from Table vi 04 q and corresponding datasets.
Chart notes
Source: Home Office, Immigration Statistics July to September, Visas table vi 04 q (Visas volume 1) and corresponding datasets; Office for National Statistics, Population and migration.
(1) Excludes Short-term students (previously referred to as Student visitors) who are allowed to come to the UK for 6 months (or 11 months if they will be studying an English Language course) and cannot extend their stay. A proportion of Tier 4 Student visas are also short term (under 1 year), see ‘Entry clearance visas by length’ but are not included within the Short-term students category.
The above chart shows that IPS long-term immigration estimates, while being substantially lower as they cover only those intending to remain a year or more, have followed a broadly similar trend to Student visas granted and passenger arrivals over the longer-term.
4. Sponsored study visa applications by education sector
The number of study-related sponsored visa applications (main applicants) rose 6% in the year ending September 2017 to 212,381, compared with the previous 12 months (200,640).
There was a rise in sponsored visa applications for the University sector as a whole (to 177,961; +6%). This included a 9% increase for Russell Group universities to 87,362 and a 4% rise for other universities to 90,599. There were increases for the Independent school (to 13,787; +3%) and English Language school (to 3,755; +34%) sectors; however the Further education sector fell (to 14,278; -4%).
Sponsored applications from students to study at universities in the UK are 24% higher in the year ending September 2017 than in the calendar year 2010. Use of Confirmation of Acceptance for Study (CAS) by sponsoring educational institutions only became mandatory from February 2010; therefore, comparisons with the calendar year 2010 should be viewed with caution.
Study-related sponsored visa applications by sector
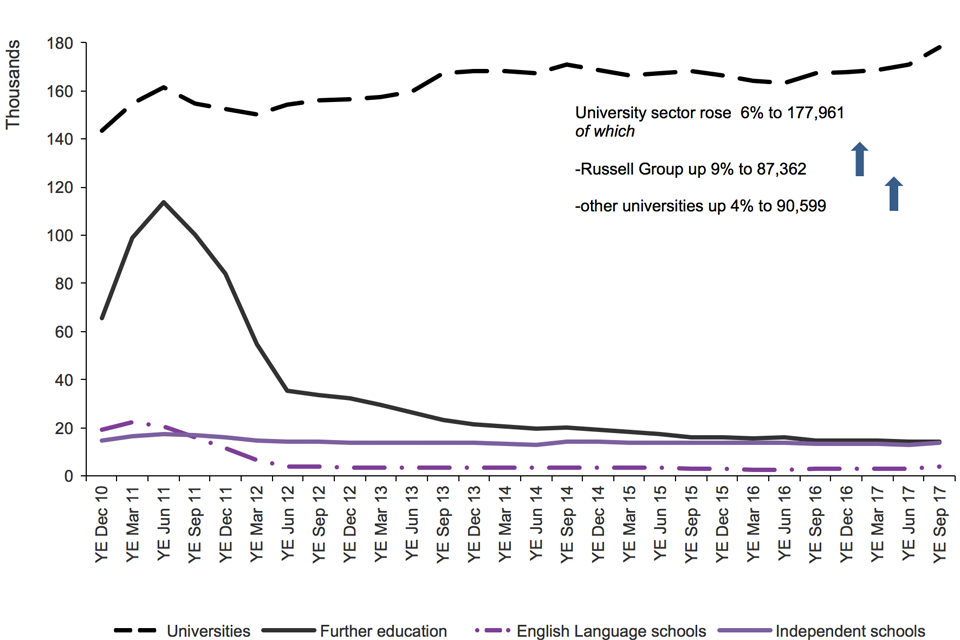
The chart shows the trends in confirmations of acceptance of studies used in applications for visas by the education sector since 2005 to the latest data available. The chart is based on data in Table cs 09 q.
Chart notes
Source: Home Office, Immigration Statistics July to September 2017, Sponsorship table cs 09 q.
‘Universities’ relate to UK-based Higher education institutions.
‘Further education’ relates to tertiary, further education or other colleges.
5. Short-term students
There were 250,000 Short-term student admissions in the calendar year 2016, much higher than the numbers of Student visitor visas granted (87,353 over the same period). This is due to many student visitor admissions being from nationalities that are not required to obtain a visa if they wish to come to the UK as a short-term student for up to a maximum of 6 months. Slightly less than half (46%) of the Short-term student admissions are accounted for by US nationals (115,000) who do not require a visa for these short visits. Other non-visa countries using the Short-term student admission route in 2016 include Japan (11,600) and Brazil (8,740).
6. Data tables
Data on student immigration, sourced from Home Office administrative systems, can be found in the following tables:
Sponsorship tables
Visas tables volume 1
Visas tables volume 2
Visas tables volume 3
Admissions tables
Extensions tables