Summary of latest statistics
Published 30 November 2017

© Crown copyright 2017
This publication is licensed under the terms of the Open Government Licence v3.0 except where otherwise stated. To view this licence, visit nationalarchives.gov.uk/doc/open-government-licence/version/3 or write to the Information Policy Team, The National Archives, Kew, London TW9 4DU, or email: psi@nationalarchives.gov.uk.
Where we have identified any third party copyright information you will need to obtain permission from the copyright holders concerned.
This publication is available at https://www.gov.uk/government/statistics/immigration-statistics-july-to-september-2017/summary-of-latest-statistics
Back to Immigration statistics July to September 2017 content page.
This is not the latest release. View latest release.
1. How many people come to the UK each year?
There were 134.3 million passenger arrivals in the year ending September 2017, including returning UK residents; a record number and an increase of 6.2 million compared to the year ending September 2016. This increase was divided between 3.5 million (+3% to 115.8 million) more arrivals by British, other European Economic Area (EEA) and Swiss nationals and 2.7 million by non-EEA nationals (+17% to 18.5 million). These numbers represent the number of occasions when a person entered the UK, not the number of distinct individuals.
The chart below illustrates the type and volume of entry clearance visas granted in the year ending September 2017. The data measure permission to visit, rather than confirmed arrivals.
Visas, year ending September 2017, thousands

The chart shows the number and type of visas granted for the latest year available. The data are available in Visas tables vi 01 q and vi 06 q o.
Chart notes
Source: Home Office, Immigration Statistics July to September 2017, Visas table vi 01 q (Visas volume 1) and Visas table vi 06 q o (Visas volume 3).
2. Why do people come to the UK?
2.1 Visit
In 2016, the number of non-EEA visitor arrivals increased by 0.7 million (7%) to 10.1 million. Over a quarter (26%) of all non-EEA visitor arrivals were United States (US) nationals.
Many nationalities, including US nationals, do not normally require a visa to visit the UK. Consequently the number of Visitor visas granted is much lower than the total number of arrivals. Over 2.6 million visas were granted in the year ending September 2017 and, of these, over 2 million (77%) were to visit.
There were 199,777 (11%) more Visitor visas granted in the year ending September 2017. There were notable increases in Visitor visas granted to Chinese nationals, up by 92,034 (20%) to 542,875 (excluding Hong Kong), and Indian nationals, up 42,123 (11%) to 427,737, and together these two nationalities accounted for almost half (47%) of all visit visas granted.
For further details see the Visit section and the data tables.
2.2 Work
There were 54,697 Tier 2 Skilled work-sponsored visa applications in the year ending September 2017, lower than year ending September 2016 (56,551). This included a 24% increase (1,176 more visas) in the Human health and social work activities sector, which is likely to reflect the addition of nurses to the government’s shortage occupation list in November 2015. The largest fall was in applications for the Information and Communication sector (-1,509; -6%).
Including dependants, there were 93,700 Tier 2 Skilled work visas granted in the year ending September 2017, a similar level to the previous year (93,913) and 41,652 Tier 5 Youth mobility and temporary visas granted, down 346 (1%).
For further details see the Work section and the data tables.
2.3 Study
Aside from visitors, the most common visa granted was for study (8% of all visas granted, and 37% of non-visit visas). In the year ending September 2017, there were 224,392 study-related visas granted (excluding the Short-term student category, formerly known as Student visitors), an increase of 8% (16,942).
Over the same period, the number of University-sponsored study visa applications (main applicants) rose 6% to 177,961. Within the University sector there was a 9% increase for Russell Group universities to 87,362. There were increases for the Independent school (3% to 13,787) and English Language school (34% to 3,755) sectors; however, the Further education sector fell (-4% to 14,278). Most of the fall in the Further education sector’s sponsored visa applications since the peak in mid-2011 has been accounted for by licences which have since been revoked.
Study-related sponsored visa applications by sector
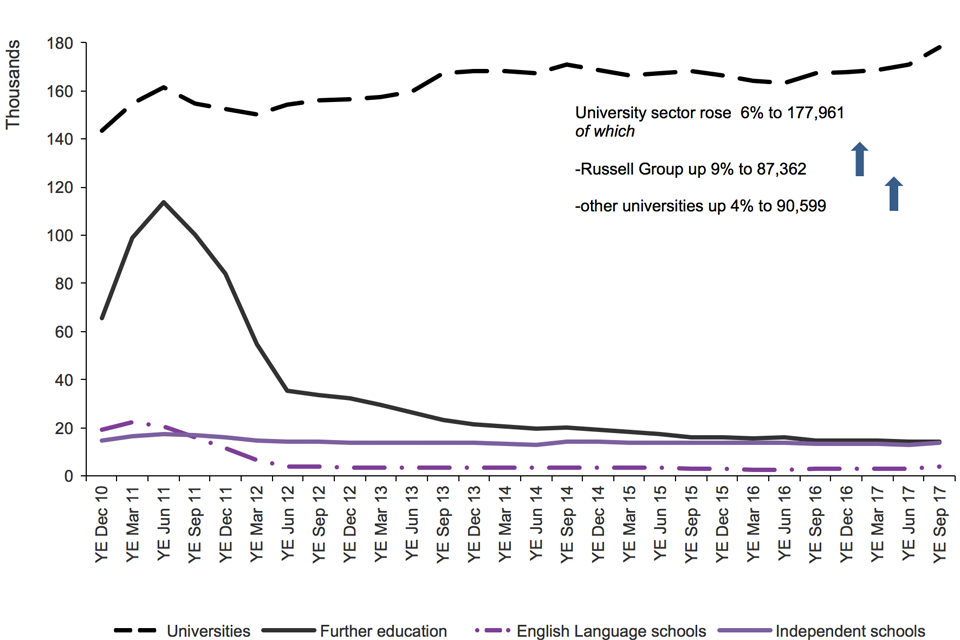
The chart shows the trends in confirmations of acceptance of studies used in applications for visas by the education sector since 2005 to the latest data available. The chart is based on data in Table cs 09 q.
Chart notes
Source: Home Office, Immigration Statistics July to September 2017, Sponsorship table cs 09 q.
‘Universities’ relate to UK-based higher education institutions.
‘Further education’ relates to tertiary, further education or other colleges.
In the year ending June 2017, the Office for National Statistics (ONS) estimates that there were 95,000 non-EU long-term immigrants coming to study and who had an intention to remain a year or more, a 16% fall (-18,000), but this is not statistically significant. The comparable number of study visas issued rose by 5% to 143,735.
For further details see the Study section and the data tables.
2.4 Family
The combined total number of family-related visas granted, including European Economic Area (EEA) Family permits granted to non-EEA nationals, and visas granted to dependants of other visa holders (excluding visitors) fell by 5,669 (4%) to 130,054 in the year ending September 2017.
For further details see the Family section and the data tables.
3. How many people do we grant asylum or protection to?
In the year ending September 2017, there were 15,618 grants of asylum, alternative forms of protection and resettlement, compared with 15,433 in the previous year. This comprised of:
- 8,147 grants of asylum to main applicants and dependants (down 9%)
- 1,123 grants of alternative form of protection to main applicants and their dependants (down 29%)
- 6,348 people provided with protection and support under a resettlement scheme (up 30%)
The number of asylum applications in the UK from main applicants decreased by 21% to 26,617 in the year ending September 2017.
There were 924 grants of asylum, or an alternative form of protection, to Syrian nationals (including dependants) at initial decision in the year ending September 2017.
An additional 4,980 Syrian nationals were resettled under the Vulnerable Persons Resettlement Scheme (VPRS). Since this scheme began in 2014, a total of 9,394 people have been resettled.
For further details see How many people do we grant asylum or protection to? and the data tables.
4. How many people continue their stay in the UK?
There were 220,295 decisions on applications to change or extend an existing visa in the year ending September 2017, 19,158 or 8% fewer decisions than the previous year. Of the 220,295 decisions, 92% were grants (201,787) and 8% (18,508) were refusals.
There were 60,106 people granted permission to stay permanently in the year ending September 2017, 5% or 2,969 fewer than the previous year. The number of grants is low relative to the peak in the year ending September 2010 (241,586).
In the year ending September 2017, 168,198 documents certifying permanent residence and permanent residence cards were issued to EEA nationals and non-EEA family members. This is the highest recorded annual figure and more than 4 times the figure for the previous 12 months (37,555).
Total applications for British citizenship fell by 4,893 (3%) to 137,286 in the year to September 2017 compared to the previous year, and 41% (94,976) lower than the peak in 2013 (232,262). Applications made by non-European Union (EU) nationals fell by 21,983 to 104,430, and applications by EU nationals more than doubled (+108%) to 32,856.
For the latest key facts and background information see How many people continue their stay in the UK? and the data tables.
5. How many people are detained or returned?
An individual may be held and remain in immigration detention for a variety of reasons, including reasons within and outside the control of the Home Office. In addition, the Home Office seeks to return people who do not have any legal right to stay in the UK.
In the year ending September 2017, 27,565 people entered detention (of which 813 entered through prisons). This was a decrease of 7% compared with the previous year (29,758).
Over the same period, there was an 8% decrease in those leaving detention (from 30,210 to 27,809).
As at the end of September 2017, excluding those in prison, there were 3,125 people in detention, a 4% increase on the number recorded at the end of September 2016 (2,998). A further 330 detainees were held in prisons.
The proportion of detainees being returned or voluntarily departing the UK on leaving detention increased from 46% in year ending September 2016 to 48% in the year ending September 2017.
The total number of enforced returns from the UK, including those not directly from detention, decreased by 1% to 12,560 in the year ending September 2017 compared with 12,707 in the previous year. This includes 10,397 enforced removals and 2,163 other returns from detention. In the same period, there were 20,691 voluntary returns (excluding returns from detention).
Of the 12,560 enforced returns in year ending September 2017, there were 2,373 enforced returns of people who had previously sought asylum, down 15% from the previous year (2,792).
In the year ending September 2017, provisional data show that 5,990 Foreign National Offenders (FNOs) were returned compared to 6,134 in the previous year. This number reached a peak of 6,346 in the year ending March 2017.
For the latest key facts and background information see How many people continue their stay in the UK? and the data tables.