Immigration statistics, July to September 2012
Updated 3 October 2013

© Crown copyright 2013
This publication is licensed under the terms of the Open Government Licence v3.0 except where otherwise stated. To view this licence, visit nationalarchives.gov.uk/doc/open-government-licence/version/3 or write to the Information Policy Team, The National Archives, Kew, London TW9 4DU, or email: psi@nationalarchives.gov.uk.
Where we have identified any third party copyright information you will need to obtain permission from the copyright holders concerned.
This publication is available at https://www.gov.uk/government/statistics/immigration-statistics-july-to-september-2012/immigration-statistics-july-to-september-2012
This is not the latest release. View latest release.
1. Summary points: quarter 3 2012
(All data relate to year ending September 2012; comparisons are with previous 12 months unless indicated)
There were further falls in visas issued for work, study and family reasons, and also fewer extensions of stay and fewer permissions to stay permanently (settlement). The recent falls for work and study are likely in part to be due to policy changes, which came into effect in December 2010 and April 2011.
Work
There were fewer work-related visas issued (-4% to 145,604, the lowest recorded using comparable data) and fewer grants of work-related permissions to stay permanently (-5% to 65,310). However there was an increase in work-related grants to extend stay in the UK (10% to 142,443).
Study
There were 29% fewer sponsored student visa applications and similarly there were 26% fewer study visas issued. There was a 1% increase in sponsored student visa applications for the university sector, contrasting with falls for the further education sector (- 67%), English language schools (-76%), and independent schools (-17%).
Before entry
The total number of visas issued, excluding visitor and transit visas, fell by 14% to 508,488, to the lowest 12-monthly total recorded using comparable data available from 2005.
Admissions
There were 105.6 million journeys to the UK in the year ending September 2012. This total was 0.6 million less than for the year ending June 2012 reflecting fewer passengers arriving during the staging of the London 2012 Olympic Games and Paralympic Games.
Asylum
There were 20,838 asylum applications, 8% higher than the previous 12 months. This remains well below the peak number of asylum applications received in the year ending December 2002 (84,132).
Detention
During the third quarter of 2012 (July to September), 48 children entered detention, lower than for the second quarter of 2012 (60). The number of children in detention for the third quarter of 2012 remains well below the peak in these figures for the third quarter of 2009 (322) using comparable data available from 2009.
Removals and Voluntary Departures
Enforced removals remained steady at 14,823, while the number of passengers refused entry at port and who subsequently departed has fallen 15% to 13,632. There was a 7% fall in total voluntary departures to 23,184, (although retrospective checks mean that these figures are particularly subject to upward revision).
For additional summary points see the full summary in the Statistical News Release.
2. Data tables
The data tables can be found in the Immigration Statistics July to September 2012 series.
3. Work
3.1 Introduction
This topic brief describes non-EEA nationals who are coming to the UK to work or who are in the UK for work. It explains trends in the numbers of such people who are granted visas, admissions (number of journeys), immigration (long-term migrants i.e. those intending to stay for at least 12 months), granted extensions to stay, or who are given permission to stay permanently (known as settlement).
3.2 Key facts
In the year ending September 2012, there were 4% and 5% falls for work-related visas (145,604) and permissions to stay permanently (65,310) compared with the previous 12 months, and a 10% increase in work-related extensions of stay (142,443). In 2011 there were 9% fewer work-related admissions (149,000) and in the year ending March 2012 work-related long-term immigration fell 7% to 48,000 (with those indicating they had a definite job unchanged and smaller numbers ‘looking for a job’). The 145,604 work-related visas issued in the year ending September was the lowest 12-monthly total recorded using comparable data available from 2005.
Recent falls for work-related visas, admissions and immigration are likely to be partly due to policy changes that came into effect from 2011. The increase in extensions was largely accounted for by grants to highly skilled individuals under the post-study work route. The post-study work route was closed to new applications on 6 April 2012 but existing applications continue to be processed (see below and the User Guide to Home Office Immigration Statistics).
The 4% fall for work-related visas (-6,437) was largely a result of lower numbers issued to highly skilled individuals (Tier 1) and their dependants, (falling from 26,019 to 19,503), which in turn was mainly due to the closure of the Tier 1 ‘general’ route in December 2010 (falling from 15,140 to 6,668). By contrast, there was a 2% increase in visas issued for skilled individuals (Tier 2) from 66,125 to 67,698.
Certificates of sponsorship are issued by employers to support applications for work-related visas and for extensions of stay. In the year ending September 2012 there were 40,397 sponsored visa applications (main applicants) to work as skilled individuals (Tier 2), mainly related to the Information and Communication (17,272), Professional, Scientific and Technical Activities (7,406) and Financial and Insurance Activities (5,237) sectors.
The large majority of the 39,164 sponsored visa applications (main applicants) for youth mobility and temporary workers (Tier 5) related to the Arts, Entertainment and Recreation (28,655), and Education (4,124) sectors.
Trends in work-related immigration
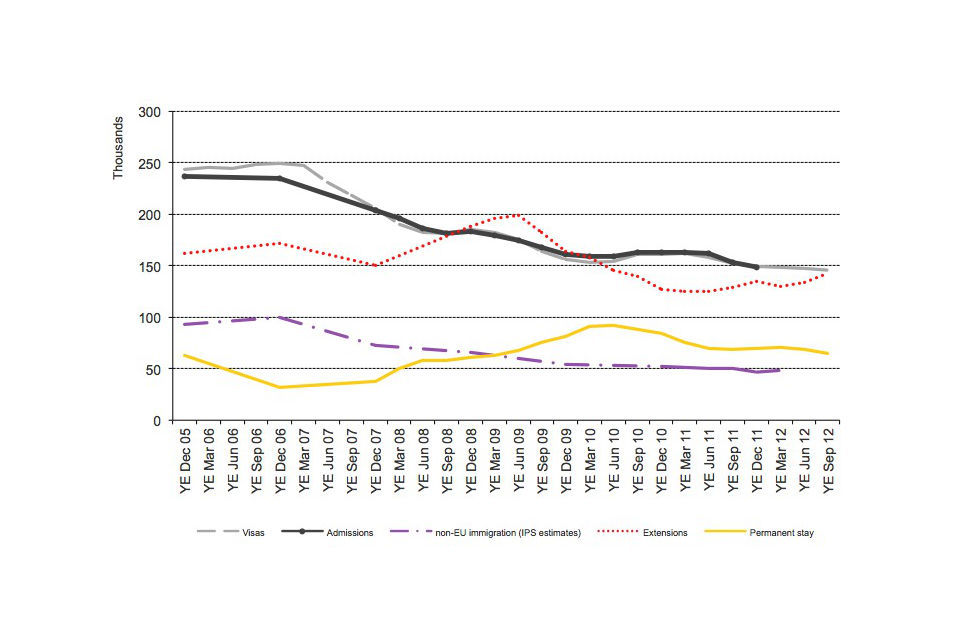
Trends in work-related immigration
Chart notes
Source: Home Office, Immigration Statistics July –September 2012, Before Entry tables be.04.q, Admissions table ad.02.q, Extensions table ex.01.q and Settlement table se.02.q; Office for National Statistics.
The above chart shows that International Passenger Survey (IPS) estimates of non-EU immigration are substantially lower than work-related visas and admissions. However, the IPS estimates follow a broadly similar trend with increases in all three series between 2005 and 2006, followed by subsequent falls. Two reasons why IPS estimates of immigrants for work are lower than figures for work visas issued or passenger arrivals are that the IPS figures exclude any workers who intend to stay for less than a year and exclude dependants. Further reasons are described in the user guide.
Top ten non-EEA nationalities granted visas for work, year 2011 (Total 149,221)
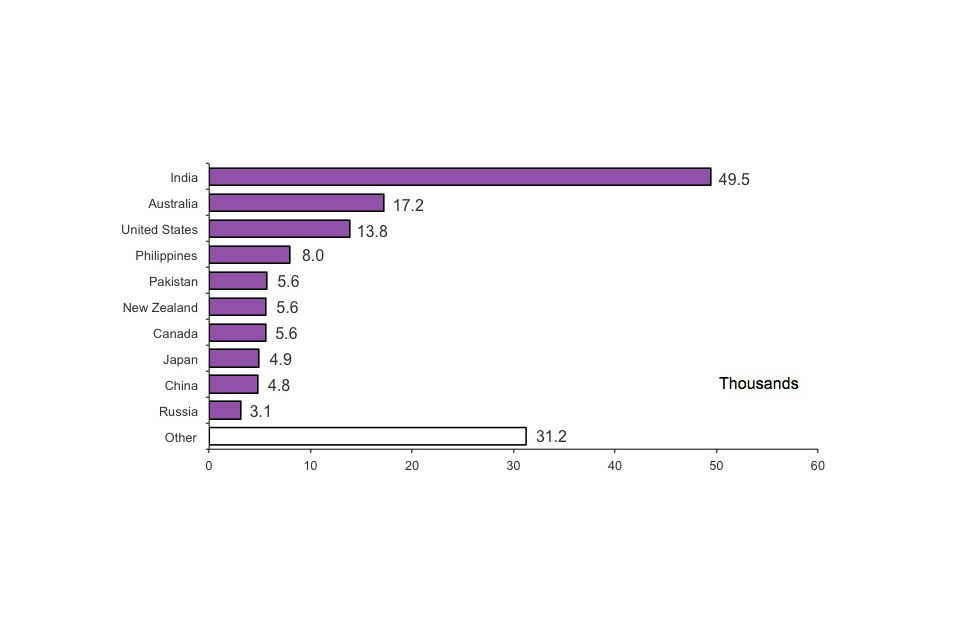
Top ten non-EEA nationalities granted visas for work, year 2011 (Total 149,221)
Chart notes
Source: Home Office, Immigration Statistics July–September 2012, Before Entry tables be.06.w.
For work-related visas and admissions the highest numbers relate to Indian, USA and Australian nationals. The top ten nationalities are the same, apart from a difference in the tenth place (Nigeria is tenth for admissions), though the order differs.
Some of the differences in the ranking between visas and admissions data may be due to timing differences e.g. some visas granted in 2011 may be used in 2012. Additionally, some individuals admitted within the creative and sporting category (part of Tier 5) do not need a visa, and this largely explains the higher number of admissions (estimated 26,000) seen for United States nationals.
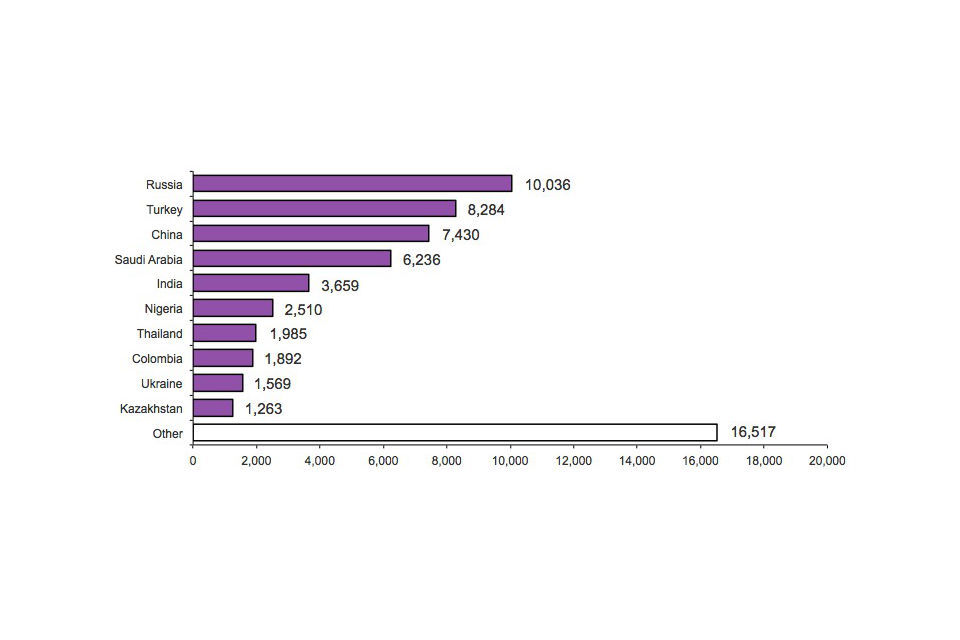
Top ten nationalities granted an extension to stay for work, 2011 (excludes dependants) (Total 96,798)
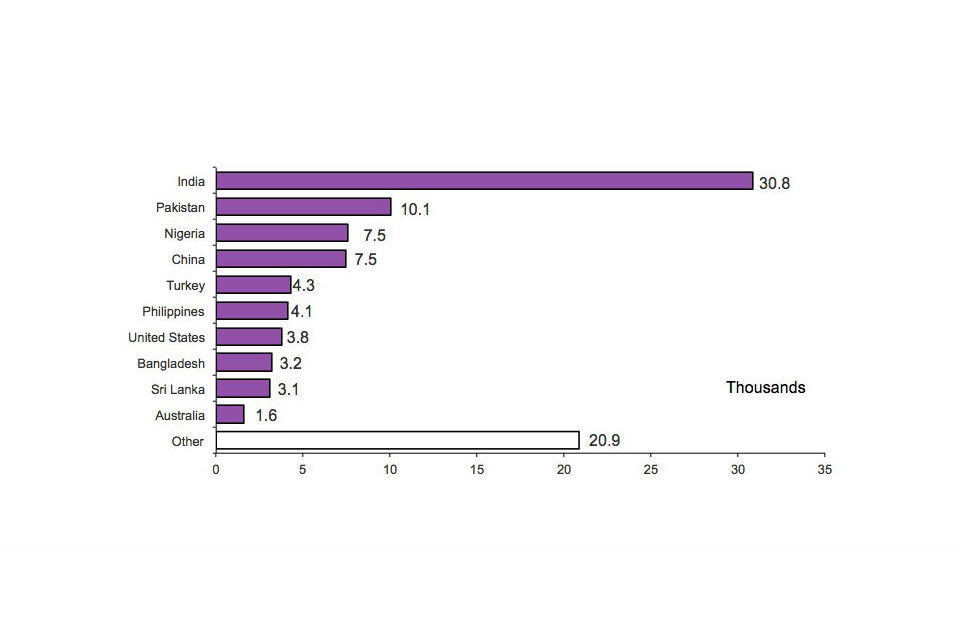
Top ten nationalities granted an extension to stay for work, 2011 (excludes dependants)
Chart notes
Source: Home Office, Immigration Statistics July–September 2012, Extensions table ex.02.w.
The nationality breakdown for those granted extensions is in some respects different to the top ten nationalities rankings for admissions and for visas, notably with Nigeria, Turkey, Bangladesh, and Sri Lanka accounting for the third, fifth, eighth and ninth highest number of extensions for work.
Analysing the data further (Table ex.02.w), the main explanation is that most of these Nigerian, Bangladeshi and Sri Lankan nationals were granted extensions as highly skilled individuals under the (Tier 1) Post-study route. Since they originally entered via a study route, they are not prominent in the nationality rankings for work-related admissions and visas. Turkish nationals also have special provision to switch into the ‘work route’ under the European Community Association Agreement with Turkey.
3.3 Permission to stay permanently (Settlement)
Some individuals who are admitted to the UK to work can become eligible to stay permanently after five years.
The latest data show that work-related grants of permission to stay permanently fell by 5% to 65,310 in the year ending September 2012, compared with the previous 12 months, having fallen back from 88,585 in the year ending September 2010. This decrease follows a broadly rising trend in work-related grants that had partly reflected an increase in the number of people admitted in work categories five years earlier. The dip in the number of work-related grants in 2006 and 2007 reflects a change in the qualifying period from four to five years, delaying grants that would otherwise have occurred earlier.
The nationality profile for grants of permission to stay permanently differs slightly to the profile for grants of work visas, with seven of the top ten nationalities also in the top ten nationalities granted visas for work. A notable difference was South Africa, ranked third for permission to stay permanently. Analysing the data further (Table se.03) reveals that the most common of the qualifying categories for South Africans was ‘Commonwealth citizens with a United Kingdom born Grandparent taking or seeking employment’.
3.4 Certificates of Sponsorship data (skilled individuals (Tier 2) and youth mobility and temporary workers (Tier 5))
As part of the application process for visas and extensions, individuals must obtain a certificate of sponsorship from an employer. This release contains tables (cs.01 to cs.05, see the Before Entry topic tables) providing information on the number of employers registered and their sponsor rating.
The tables also provide data on the nationality and industry sector of those (main applicants) using certificates. More detailed information on visas and extensions are given in the before entry and extensions topics.
UKBA Register of sponsors
An employer may be counted more than once in the total if registered separately to sponsor both Tier 2 and Tier 5 individuals or registered for more than one sub-Tier. Altogether there were 25,399 employers on the register on 1 October 2012, 8% higher than 30 September 2011 (23,416). On 1 October 2012 28,416 employers registered for sponsoring skilled individuals (Tier 2) and 3,867 employers for youth mobility and temporary workers (Tier 5).
Skilled individuals (Tier 2)
In the year ending September 2012, there were 4% more sponsored applications (main applicants) for visas as skilled individuals than the previous 12 months (from 38,998 to 40,397). The majority of the 40,397 certificates related to the Information and Communication (17,272, up 5%), Professional, Scientific and Technical Activities (7,406, up 6%) or Financial and Insurance Activities (5,237, down 6%) sectors. These three sectors also accounted for nearly half (47%) of the 24,123 certificates used for applications for extensions.
Youth mobility and temporary workers (Tier 5)
In the year ending September 2012, there were 2% more sponsored visa applications (main applicants) as youth mobility and temporary workers than the previous 12 months (from 38,389 to 39,164). The large majority of these 39,164 certificates related to the Arts, Entertainment and Recreation (28,655 up 2%) and Education (4,124, up 16%) sectors. The total number of extensions in the year ending September 2012 for Tier 5 was 374, the relatively small numbers reflecting the rules relating to extensions for such workers.
3.5 Data tables
Data on immigration for work, sourced from Home Office administrative systems, can be found in the following tables:
- Before entry (Tables be.01 to be.04q and be.06.w and Before entry Tables cs.01 to cs.05q)
- Admissions (Tables ad.02 to ad.03 and ad.03.w)
- Extensions (Tables ex.01 to ex.02)
- Settlement (Tables se.01 to se.05)
3.6 About the figures
There are a range of measures that can be used to monitor those, subject to immigration control, coming to the United Kingdom to work. These include:
issues of visas for entry clearance, providing information of those intending to come; admissions data, providing information on migrants at the border; numbers of people allocated national insurance numbers, providing an indication of migrants entering the labour market; and estimates on non-EU immigration from the International Passenger Survey (IPS) on migrants intending to stay for at least a year for work purposes. In addition, grants of (in-country) extensions of stay for work purposes provide information on migrants in-country, while work-related grants of settlement provide a measure of longer-term migration.
Trends in extensions and in permission to stay permanently will depend on admissions and immigration in previous years.
Figures for immigration in this topic relates to non-EU nationals whilst other figures (visas, admissions, extensions, permission to stay permanently) relate to non-EEA nationals.
These various statistics and research can appear to give different pictures of immigration for work. Often this is because the latest data for different measures cover different time periods. In addition, they also count different aspects of the immigration process, with some showing intentions or permissions, while others show actual events.
The ‘before entry’, ‘admissions’ and ‘settlement’ sections of the user guide include a discussion on the differences between the various data sources presented on immigration for work.
Data includes dependants unless stated otherwise.
The user guide provides further details on the topics related to work including definitions used, how figures are compiled, data quality and issues arising from figures being based on data sourced from an administrative database or from surveys.
For further information on changes to immigration legislation affecting the statistics, see the policy and legislative changes timeline published alongside the user guide. The Work section details changes made in immigration legislation affecting these data including the closure in December 2010 of the Tier 1 (General) category for new applicants for entry clearance, and changes to Tier 1 (highly skilled) and Tier 2 (skilled) from April 2011.
All data for 2011 and 2012 are provisional (IPS data are final for 2011).
Figures for admissions and immigration are estimates rounded to the nearest thousand.
3.7 Other related data
Office for National Statistics international migration statistics and Office for National Statistics labour market.
National Insurance Number Allocations to Adult Overseas Nationals entering the UK are published by the Department for Work and Pensions.
On 20 January 2012, the department published a report on Nationality at point of National Insurance Number registration of DWP benefit claimants: February 2011 working age benefits.
Reports of the Migration Advisory Committee can be found on the UKBA website.
Salt, J., 2011, International Migration and the United Kingdom: Report of the United Kingdom SOPEMI Correspondent to the OECD, 2011, London: Migration Research Unit.
4. Study
4.1 Introduction
This topic briefing focuses on non-EEA nationals who are subject to immigration control and who come to or who are in the UK to study.
For those students subject to immigration control, administrative information is available on visas, extensions to stay and records of student admissions (number of journeys). The International Passenger Survey (IPS), run by the Office for National Statistics (ONS), also provides estimates of long term immigration of students to the UK (those arriving with the intention of staying for a year or more).
4.2 Key facts
Most recent data for the year ending September 2012 (210,921) shows there has been a 26% decrease in the number of visas issued for study in comparison with the year ending September 2011 (284,649). Admissions of those for the purposes of study in 2011 (267,000) have also fallen by 10% compared to 2010 (296,000). IPS estimates for long term student migration for the year ending March 2012 have fallen by 7% (163,000) compared with the previous 12 months (175,000). Entry clearance visas provide the most up-to-date picture of immigration.
The number of sponsored student visa applications (main applicants) fell by 29% (similar to the 26% fall in visas issued) in the year ending September 2012 (211,001) compared with the previous 12 months (295,345). There was a 1% increase for the university sector (UK-based Higher Education Institutions) and falls of 67%, 76% and 17% respectively for the further education sector (Tertiary, further education or other colleges), English language schools and independent schools.
Falls in the number of visas issued for the purposes of study since the second quarter of 2011 are consistent with significant changes to the student visas system from April 2011 following a major public consultation on reforming Tier 4 of the points-based system.
Across the available range of data sources for non-EU nationals study has been the most common reason for coming to the UK since 2006. Between 2005 and the early part of 2011, figures from entry clearance visas, admissions and estimates from the IPS for non-EU nationals all showed a rise in student immigration. However, there are now signs that student immigration may have peaked, as figures across the range of data sources have all seen recent decreases.
Long term trends in student immigration
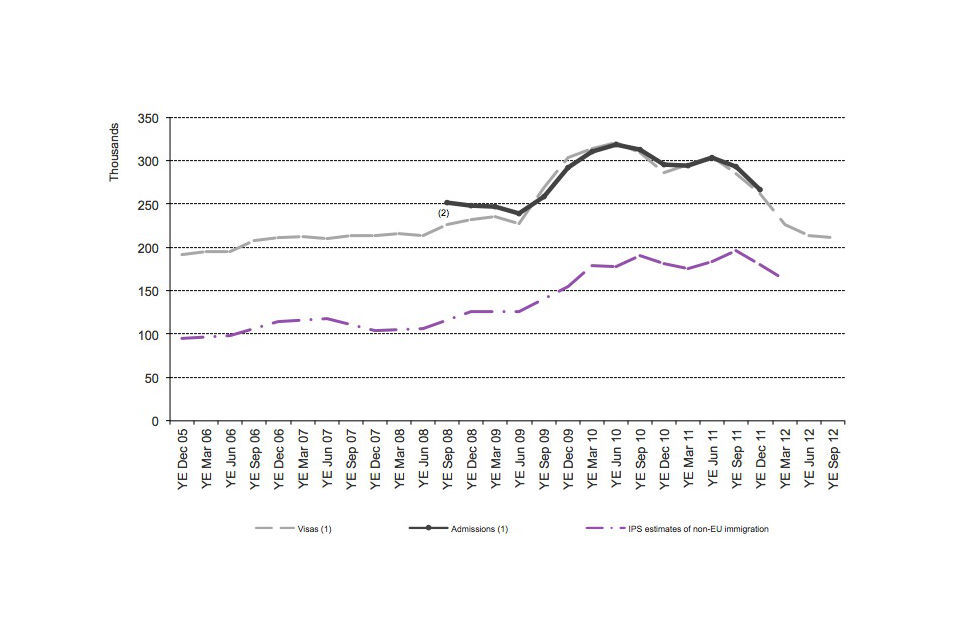
Long term trends in student immigration
Chart notes
Source: Home Office, Immigration Statistics July - September 2012, Before Entry tables be.04.q and Admissions table ad.02.q Office for National Statistics. (1) Excludes student visitors who are allowed to come to the UK for six months (or 11 months if they will be studying an English Language course) and cannot extend their stay. (2) For periods prior to the year ending September 2008, the count of student admissions is not comparable as there was no specific category for student visitors who may then have been recorded as either students or visitors.
The above chart shows that IPS long term estimates, while being substantially lower, follow a broadly similar trend to student visas issued and passenger arrivals, with steeper increases in all three series during 2009. Two of the reasons why IPS estimates of students arriving are lower than figures for student visas issued or passenger arrivals is that the IPS figures excludes the many students who intend to stay for less than a year and exclude dependants of those immigrating for the purposes of study.
Despite the general trend being similar, there are instances where the trends in visas issued, admissions and IPS estimates occasionally diverge. This apparent discrepancy could be due to the potential for a margin of error that is inherent in sample surveys, together with possible changes in the proportion intending to stay for more than a year and the time difference between a visa being issued and the individual arriving.
4.3 Visas issued
Latest quarterly data show that in the year ending September 2012, the number of student entry clearance visas issued was 210,921, a decrease of 26% on a year earlier (284,649). This fall is consistent with the tightening of the immigration rules for students since April 2011.
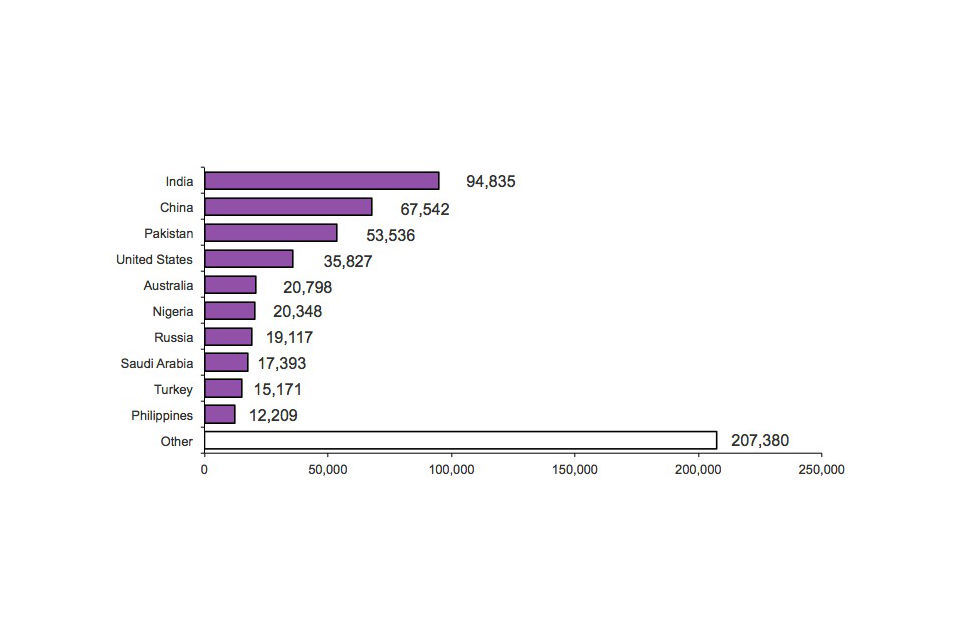
Of the total 261,405 people issued visas for the purposes of study in 2011, over two thirds (69% or 179,656) were to Asian nationals, with the highest number of visas issued to nationals of China, Pakistan and India.
Top ten nationalities issued entry clearance visas for the purposes of study, 2011 (Total 261,405)
Top ten nationalities issued entry clearance visas for the purposes of study, 2011
Chart notes
Source: Home Office, Immigration Statistics July – September 2012, Before Entry tables be.06.s.
4.4 Student visitors
Student visitors are issued with a visa for a maximum six-month duration or, following a recent change in the rules, in a very small number of cases for 11 months if studying an English language course. Student visitors are not counted as long-term migrants and do not appear in the data for extensions of stay.
In the year ending September 2012, 66,569 people were issued student visitor visas, a 12% increase on the previous year. The number of visas issued to student visitors has increased steadily since 2005 (15,834) reaching a peak in the year ending June 2012 (68,997). In 2011 61,381 visas were issued to student visitors, of which nearly three quarters (44,864) were issued to the top ten nationalities granted these types of visa.
Top ten nationalities issued student visitor visas, 2011 (Total 61,381)
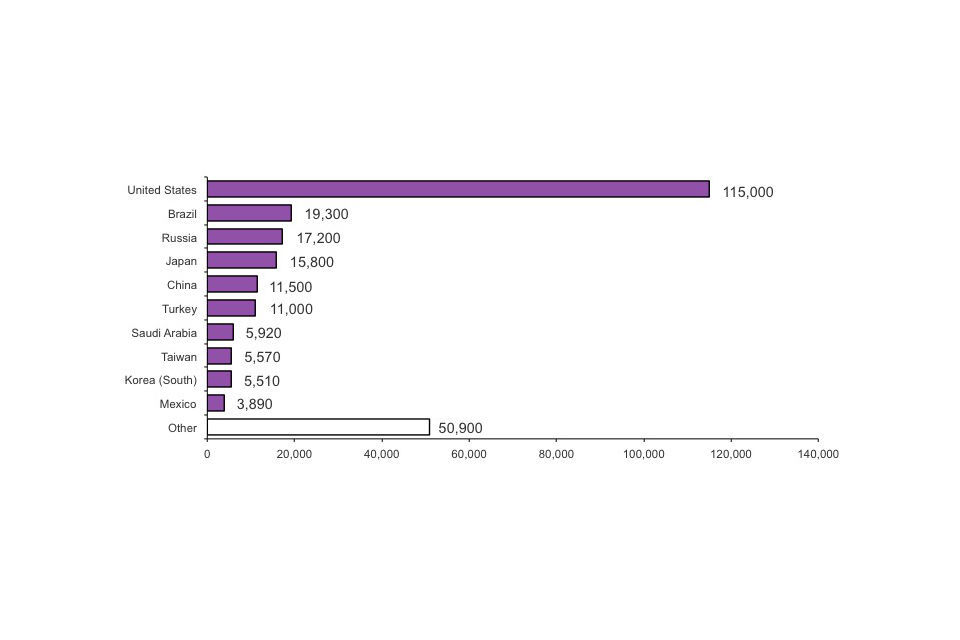
Top ten nationalities admitted under student visitor rules, 2011 (Total 262,000)
Chart notes
Source: Home Office, Immigration Statistics July – September 2012, Before Entry tables be.06.s.
Although there have been increases in numbers of student visitors in a period where longer term student visas have been in decline, the pattern of these changes for individual nationalities does not indicate a clear or consistent relationship. This is not too surprising given the differing makeup of student visitors in terms of nationality. For example, Pakistan ranks second in terms of student visas numbers but is not within the top ten for student visitors and Russia ranks first as a student visitor nationality but is not within the top ten for the longer term student visas.
The latest data available on passenger arrivals show that in 2011, 262,000 people (a 9% rise on 2010) were admitted under student visitor rules. Non-visa nationals (e.g. nationals of the United States and Brazil) do not need to obtain an entry clearance visa if they wish to come to the UK as a student visitor for up to 6 months. However, non-visa nationals will be included in the passenger admissions data as a student visitor. This results in student visitor admissions that are considerably higher than student visitor visas issued (61,381 in 2011).
Top ten nationalities admitted under student visitor rules, 2011 (Total 262,000)

Long-term trends in family immigration
Chart notes
Source: Home Office, Immigration Statistics July – September 2012, Admissions table ad.03.s
Nearly half of all arrivals admitted under student visitor rules in 2011 were from the United States (115,000) and of the top ten nationalities for student visitor arrivals six were non-visa nationalities.
4.5 Admissions
Latest data show that the total number of student admissions was 267,000 in 2011, a decrease of 28,700 (10%) on 2010.
When considering study (excluding student visitors), since the introduction of the student visitor category, admissions and entry visa numbers follow a similar trend as all those wishing to stay for six months or more require a visa. While the trend for the two series is similar there can be differences due to a possible time difference between a visa being issued and the individual arriving.
4.6 Immigration for study
For the year ending March 2012, the provisional IPS estimate for non-EU nationals arriving to study for more than a year (163,000) fell by 7% on the previous year (175,000).
Source: ONS, Long-Term International Migration
4.7 Extensions of stay
Latest data show that in the year ending September 2012, the number of extensions of stay granted to those for study was 93,104 a decrease of 28% on a year earlier (129,158). This is again consistent with the tightening of the immigration rules for students since April 2011.
The number of grants of extension for the year ending September 2012 are lower than any comparable period in the current published series.
Confirmation of Acceptance for Studies (Tier 4 students, excluding student visitors)
New tables in this edition (cs.06 to cs.10.q, see the Before Entry topic tables) show the trends in the numbers of applications (from main applicants) for student visas and for extensions as students, by educational sector and by nationality, as well as the numbers of sponsoring educational institutions. The overall trends in grants are similar to trends in applications.
To apply for a student visa or for an extension as a student, individuals must use a confirmation of acceptance for studies from a sponsoring educational institution.
More detailed information on visas and extensions are given in the Before Entry and Extensions topics.
Register of Sponsors (Tier 4)
On 1 October 2012 there were 1,983 educational institutions on UKBA’s register, 3% lower than 29 June 2012 (2,037) and continuing the fall seen since 3 October 2011 (2,370).
Visa applications, by educational sector
In the year ending September 2012, there were 211,001 sponsored visa applications (main applicants), a fall of 29% compared with the previous 12 months. This included an increase of 1% for the university sector (UK-based Higher Education Institutions, to 155,821), and falls of 67%, 76% and 17% respectively in the further education sector (Tertiary, further education or other colleges to 32,900), English language schools (to 3,748) and independent schools (to 14,087).
As a consequence, the share of visa applications for the university sector rose from around half (52%) to three quarters (74%) over the same period, whilst the shares for the further education sector and for English language schools fell respectively from 34% to 16%, and from 5% to 2%.
Applications for extensions of stay, by educational sector
In the year ending September 2012, there were 86,004 sponsored applications for extensions (main applicants), a fall of 25% compared with the previous 12 months. This included falls of 4%, 43%, 68% and 5% for the university sector (UK-based Higher Education Institutions, to 53,033), the further education sector (Tertiary, further education or other colleges, to 26,990), English language schools (to 1,962) and independent schools (to 2,243).
As a consequence, the share of applications for extensions for the university sector rose from around half (48%) to six tenths (62%) over the same period, whilst the shares for the further education sector and for English language schools fell respectively from 41% to 31%, and from 5% to 2%.
4.8 Data tables
Data on student immigration, sourced from Home Office administrative systems, can be found in the following tables:
- Study (Table st.01)
- Before entry (Tables be.01 to be.04q and be.06.w and Before entry Tables cs.01 to cs.05q)
- Admissions (Tables ad.02 to ad.03 and ad.03.w)
- Extensions (Tables ex.01 to ex.02)
The Office for National Statistics publishes data on student immigration, International Migration.
4.9 About the figures
There are a range of measures that can be used to monitor those, subject to immigration control, coming to the United Kingdom to study. These include:
- issues of visas for entry clearance, providing information of those intending to come;
- admissions data, providing information on migrants at the border;
- estimates on non-EU immigration from the International Passenger Survey (IPS) on migrants intending to stay for at least a year for study purposes.
In addition, grants of (in-country) extensions of stay for study purposes provide information on migrants in-country.
Trends in extensions and in permission to stay permanently will depend on admissions and immigration in previous years.
Figures for immigration in this topic relates to non-EU nationals whilst other figures (visas, admissions, extensions) relate to non-EEA nationals.
The various statistics for those coming to the UK to study can appear to give different pictures of student immigration. Often this is because the latest data for different measures cover different time periods. In addition, they also count different aspects of the immigration process, with some showing intentions or permissions, while others show actual events.
The Before Entry, Admissions and Extensions sections of the user guide includes a discussion on the differences between the various data sources presented on immigration for study.
For further information on changes to immigration legislation affecting the statistics see the policy and legislative changes timeline published alongside the User Guide.
Data for entry clearance visas and admissions excludes student visitors unless stated otherwise. The student visa category was introduced in 2007 and may include individuals previously recorded as visitors, so for consistency and comparability over time they are excluded from study-related totals.
Data include dependants unless stated otherwise.
The user guide provides further details on the topics relating to study including definitions used, how figures are compiled, data quality and issues arising from figures being estimated from samples or based on data sourced from an administrative database of from surveys.
All data for 2011 and 2012 are provisional (2011 IPS data is final).
Figures for admissions and immigration in this briefing are estimates rounded to the nearest thousand.
4.10 Other related data
Statistics on students in Higher Education Institutions including analysis of overseas student numbers are available from published statistics released by The Higher Education Statistics Authority (HESA).
An overview of student immigration policy in the UK and the evidence that has instigated recent policy change is published by the European Migration Network (EMN) in European Migration Network: Immigration of International Students to the EU: Empirical evidence and current policy practice.
5. Family
5.1 Introduction
This topic briefing focuses on non-EEA nationals who are subject to immigration control and who come to the UK for family reasons.
For those subject to immigration control, administrative information is available on visas, extensions of stay, records of admissions (number of journeys) and permission to stay permanently (known as settlement). These differentiate between the ‘family route’ and dependants of other migrants. The International Passenger Survey (IPS), run by the Office for National Statistics (ONS), also provides estimates of long-term immigration for all those who state their main reason for migrating to the UK is to accompany or join someone else including family members (with the intention of staying for a year or more).
5.2 Key facts
Most recent data for the year ending September 2012 show that the number of entry clearance visas issued to those on the ‘family route’ was 42,213, a decrease of 15% on the year ending September 2011 (49,587). There has also been a 21% fall in the number of visas issued to all other dependants (excluding visitors) for the year ending September 2012 (70,805) compared with the year ending September 2011 (89,690). Entry clearance visas provide the most up-to-date picture of immigration.
Decreases in the number of visas issued to dependants coming to the UK as family members of those working and studying in the UK are, in part, consistent with changes to the rules governing visas issued to those and their dependants on the work route from December 2010 and study route from April 2011.
IPS long-term estimates for those accompanying or joining others in the UK have fallen by 10% for the year ending March 2012 (51,000) compared with the year ending March 2011 (57,000).
Since the year ending December 2005, ONS estimates and the number of visas issued to dependants have followed broadly similar trends with some recent decline across both data sources since the year ending March 2011.
Long-term trends in family immigration
Long-term trends in family immigration
Chart notes
Source: Home Office, Immigration Statistics July–September 2012, Before Entry tables be.04.q Office for National Statistics. (1) Includes all dependants (e.g. dependants for work and study), except visitors.
IPS long-term estimates of non-EU immigration for those accompanying or joining others in the UK include those arriving on family visas, but also persons accompanying others who are arriving for other reasons, such as for work or study. The above chart shows that IPS estimates, while being substantially lower, follow a broadly similar trend to the total for family route visas and other visas issued to dependants. The trend for IPS estimates appears to be similar to figures for family visas alone; however, this is coincidental given the scope of information recorded in the corresponding IPS category. A reason why IPS estimates of those arriving are lower than figures for family and dependant visas combined is that the IPS figures exclude the many people who come to the UK but intend to stay for less than a year.
Despite the general trend of IPS estimates being similar to those for visas issued for family reasons, there are instances where the trends appear to be different. This apparent discrepancy could be due to the potential for a margin of error that is inherent in sample surveys, together with possible changes in the proportion intending to stay for more than a year, differential trends who state to the IPS that they are accompanying and joining others coming to the UK and the time difference between a visa being issued and the individual arriving.
5.3 Visas
Most recent data show that, in the year ending September 2012, the number of entry clearance visas issued to those on the ‘family route’ was 42,213, a decrease of 15% on a year earlier (49,587).
In addition, for the year ending September 2012 there was a 7% fall in the number of visas issued for dependants of workers (down from 45,292 to 42,184), a 43% fall for dependants of students (down from 29,093 to 16,462) and a 21% fall for all other dependants (excluding visitors, down from 15,028 to 11,943).
The numbers of passengers recorded as entering the country for family reasons are much lower than numbers of visas issued (in 2011 just over 32,000 such admissions were recorded). Some of those that are identifiable as coming for family reasons in the visa data are not identifiable in the admissions data and are included within ‘Others given leave to enter’.
5.4 Immigration for family reasons
Provisional IPS estimates of non-EU nationals accompanying or coming to join family or friends for a year or more were 51,000 in the year ending March 2012, and are now at the same level as the year ending June 2010.
Source: ONS, Long-Term International Migration.
5.5 Extensions of stay
Latest data show that in the year ending September 2012, the number of extensions of stay granted to those on the ‘family route’ was 15,550, a decrease of 12% on a year earlier (17,645), continuing the fall in the previous two years. In addition, there were 42,699 dependants of workers, 12,269 dependants of students and 6,156 other dependants.
5.6 Settlement
Family formation and reunion grants of settlement fell by 19% from 55,407 in the year ending September 2011 to 44,990 in the year ending September 2012. This is lower than levels seen in 2007 (50,822), and continues the fall for the previous 12 months (from 75,401 in the year ending September 2010).
5.7 Data tables
Data on family immigration, sourced from Home Office administrative systems, can be found in the following tables:
- Before entry (Tables be.01 to be.06.f)
- Admissions (Tables ad.02 to ad.03.f)
- Extensions (Tables ex.01 to ex.02.f)
- Settlement (Tables se.01 to se.06)
The Office for National Statistics publishes estimates of those coming to join or accompany others at International Migration.
5.8 About the figures
There are a range of measures that can be used to monitor those, subject to immigration control, coming to the UK for family reasons. These include:
- issues of visas for entry clearance, providing information of those intending to come
- admissions data, providing information on migrants at the border
- settlement data, providing information on the number of people who are granted or refused permission to stay permanently
- estimates on non-EU immigration from the International Passenger Survey (IPS) on migrants intending to stay for at least a year to accompany or join someone else including family
In addition, grants of (in-country) extensions of stay granted to those on the ‘family route’ provide information on migrants in-country.
The numbers of applications and decisions made reflect changes over time in levels of immigration, as well as policy and legislative changes, including changes to immigration legislation. The availability and allocation of resources within the UK Border Agency can also affect the number of decisions.
There are a number of ways that allow people to come to the UK for family reasons. The traditional ‘family route’ is made up of those coming to join or accompany family members who are British Citizens or settled people. This includes married or unmarried partners, including same-sex partners; children; and elderly relatives. Others come as dependants of people who have not been granted the right to stay permanently, including the family members of those working or studying in the UK and of refugees. There are also those who come for a short time to visit family members.
Figures for immigration in this topic relate to non-EU nationals whilst other figures (visas, admissions, extensions) relate to non-EEA nationals.
The various statistics for those coming to the UK for family reasons can appear to give different pictures of immigration. Often this is because the latest data for different measures cover different time periods. In addition, they also count different aspects of the immigration process, with some showing intentions or permissions, while others show actual events.
The ‘before entry’, ‘admissions’ and ‘settlement’ sections of the user guide include a discussion on the differences between the various data sources presented on immigration for family reasons.
For further information on changes to immigration legislation affecting the statistics, see the policy and legislative changes timeline published alongside the user guide.
The user guide provides further details on the topics relating to family including definitions used, how figures are compiled, data quality and issues arising from figures being estimated from samples or based on data sourced from an administrative database.
All data for 2011 and 2012 are provisional (2011 IPS data are final).
Figures for admissions and immigration in this briefing are estimates rounded to the nearest thousand.
5.9 Other related data
Information on numbers of non-EEA family members of EEA nationals who exercise rights to stay in the country is available in the European Economic Area topic.
6. Before entry
6.1 Introduction
The figures in this topic brief relate to the number of applications and issues of entry clearance visas and the number of passengers refused entry at ports
6.2 Key facts
Excluding visitor and transit visas, there were 508,488 visas issued in the year ending September 2012, the lowest 12-monthly total recorded using comparable data available from 2005. This was 14% lower than the previous 12 months (593,978).
In the year ending September 2012, work and family-related visas issued fell 4% and 15% respectively (to 145,604 and 42,213, the lowest levels recorded using comparable data). Over the same period study visas issued (excluding student visitors) fell 26% to 210,921. The recent falls for work and study are likely to be partly due to policy changes, which came into effect from 2011 for these reasons for entry to the UK.
By contrast, there was a 12% increase in student visit visas issued to 66,569 in the year ending September 2012. Student visit visas are for short-term study (typically for six months) and cannot be extended.
The number of passengers refused entry at port has fallen 10% in the year ending September 2012 to 15,590 from 17,399 in the previous 12 months, continuing the falls over the last seven years (from 31,376 in the year ending September 2005).
6.3 Visas issued by reason (excluding visitor and transit visas)
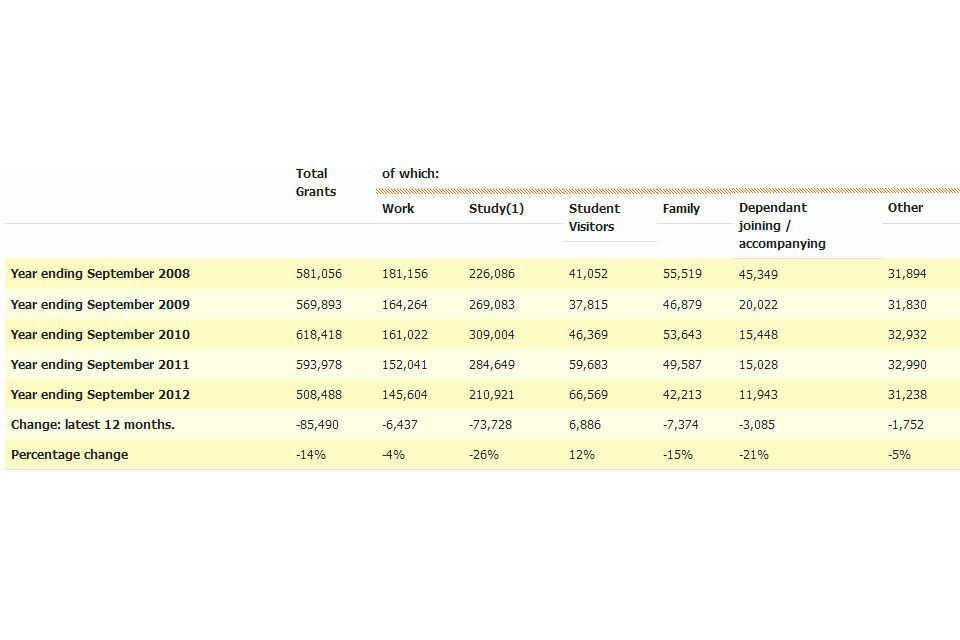
Visas issued by reason (excluding visitor and transit visas)
Table Note (1) Student visitors are allowed to come to the UK for six months (or 11 months if they will be studying an English Language course) and cannot extend their stay. The student visitor category was introduced in 2007 and may include individuals previously recorded as visitors, so for consistency and comparability over time they have been excluded from study-related totals. For further discussion of study and student visitors see the study topic briefing.
6.4 Long-term trends in visas issued (excluding visitor and transit visas)
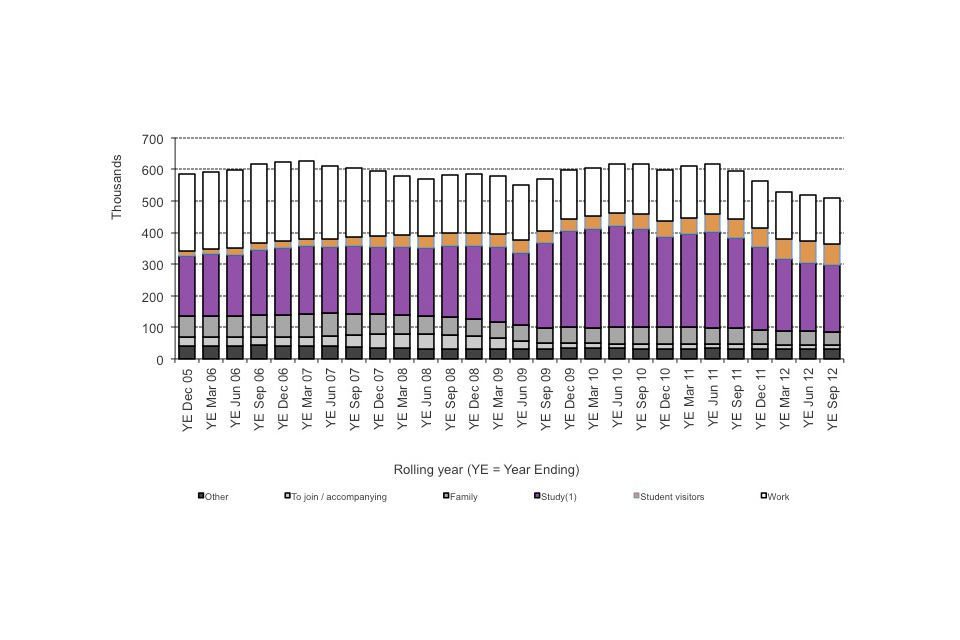
Long-term trends in visas issued (excluding visitor and transit visas)
Chart notes
Source: Home Office, Immigration Statistics July –September 2012, based on data in Before Entry tables be.04.q
Chart Note (1) Student visitors are allowed to come to the UK for six months (or 11 months if they will be studying an English Language course) and cannot extend their stay. The student visitor category was introduced in 2007 and may include individuals previously recorded as visitors, so for consistency and comparability over time they have been excluded from study-related totals. For further discussion of study and student visitors see the study topic briefing.
Detailed briefing on the trends of visas issued for work, study or family reasons (together with dependants joining / accompanying) are available in the ‘Work’, ‘Study’ and ‘Family’ topics. For example, the ‘Study’ topic contains discussion of the differing trends for student visitors and the other students.
6.5 Visas issued by nationality
Excluding visitors and transit visas, over half (57% or 320,790) of the total 564,156 people issued entry clearance visas in 2011 were Asian nationals and a further 12% (64,989) were nationals of the Americas.
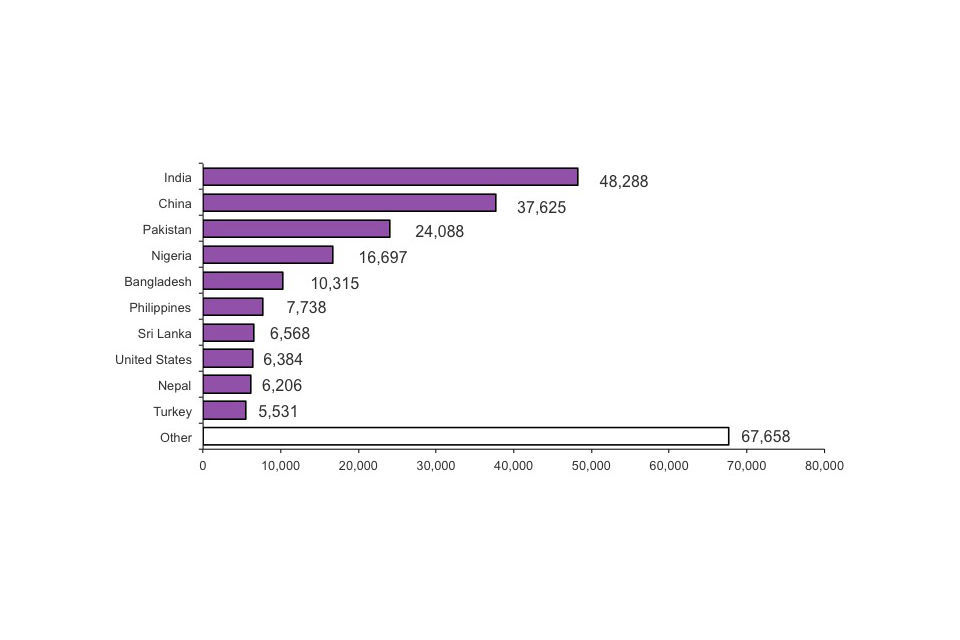
6.6 Top ten nationalities – visas issued, 2011 (excludes visitors and transit) (Total number of visas issued: 564,156)
Top ten nationalities – visas issued, 2011 (excludes visitors and transit) (Total number of visas issued: 564,156)
Chart notes
Source: Home Office, Immigration Statistics July–September 2012, before entry tables be.06 to be.06.o
6.7 Data tables
Further data are available in on Before Entry Tables be.01 to be.08)
6.8 About these figures
Before travelling to the UK, a person may be required to apply for and be issued with an entry clearance visa, depending on their nationality, purpose of visit and intended length of stay. On arrival at UK ports, or UK border controls in France and Belgium (often termed ‘juxtaposed’ controls), all individuals have to satisfy a UK Border Agency officer that they have the right to enter the country before being admitted to the UK.
Passengers refused entry relates to non-asylum cases dealt with at ports of entry.
The user guide provides further details on this topic including definitions used, how figures are compiled, data quality and issues arising from figures being based on data sourced from an administrative database. For further information on changes to immigration legislation affecting the statistics, see the policy and legislative changes timeline published alongside the User Guide.
The data in this briefing include dependants, unless stated otherwise. Data prior to 2005 are not comparable.
6.9 Other related data
Information on passengers refused entry and subsequently removed are available in the removals and voluntary departures topic.
The Before Entry section of the user guide includes a discussion on the differences between entry clearance visas and other data sources including: passenger arrivals, long-term international migration estimates of immigration published by the Office for National Statistics and differences between appeals on visa decisions published by the Home Office and the HM Courts and Tribunals Service.
Data on migration applications decided within published standards and the cost per decision for all permanent and temporary migration applications are published as Official Statistics by the UKBA as part of their key input and impact indicators, UK Border Agency Our Performance.
7. Admissions
7.1 Introduction
The figures in this topic brief relate to the number of journeys made by people entering the UK. Where an individual enters the country more than once, each arrival is counted. For non-EEA nationals who are subject to immigration control, more detailed information is available on the purpose of their journey and nationality.
7.2 Key facts
The total number of admissions was 105.6 million in the year ending September 2012, similar to the previous 12 months (increasing less than 0.5% from 105.2 million). The 105.6 million total was 0.6 million less than for the year ending June 2012 (106.2 million) and reflects fewer numbers of passengers arriving during the staging of the London 2012 Olympic Games which took place from 27 July to 12 August 2012, and the Paralympic Games which took place from 29 August to 9 September 2012.
In the latest 12 months, there were an extra 0.9 million journeys by British, other EEA and Swiss nationals (92.8 million), compared with the previous 12 months (91.8 million) By contrast, there were, correspondingly, 0.5 million fewer journeys by non-EEA nationals (falling from 13.3 million to 12.9 million).
The 0.6 million fall in admissions in the year ending September 2012 compared with the year ending June 2012 was accounted for by falls for both British, other EEA and Swiss nationals (falling 0.4 million) and non-EEA nationals (falling 0.2 million).
The latest data available by purpose of journey show that in 2011 journeys by non-EEA nationals increased by 7% to 13.3 million. This was almost wholly due to a 12% increase in visitors from 7.0 million to 7.9 million, and there was also a 9% increase (from 240,000 to 262,000) for student visitors. There were falls of 9%, 10% and 14% for the work, study and family categories, the first two of which may reflect policy changes for the work and study routes which came into effect during 2011.
Admissions by purpose of journey - non-EEA nationals

Admissions by purpose of journey - non-EEA nationals
Table Note (1) Student visitors are allowed to come to the UK for six months (or 11 months if they will be studying an English Language course) and cannot extend their stay. The student visitor category was introduced in 2007 and may include individuals previously recorded as visitors, so for consistency and comparability over time they have been excluded from study-related totals. For further discussion of study and student visitors see the study topic briefing.
7.3 Long- term trends in admissions

Long- term trends in admissions
Chart notes
Source: Home Office, Immigration Statistics July – September 2012, Admissions table ad.01.
7.4 Non-EEA nationalities admitted to the UK
United States nationals accounted for more than a quarter (28%) of the 13.3 million journeys by non-EEA nationals into the UK. The top ten nationalities accounted for 69% of all journeys made.
7.5 Top ten nationalities admitted, 2011 (Total number of admissions 13.3 million)
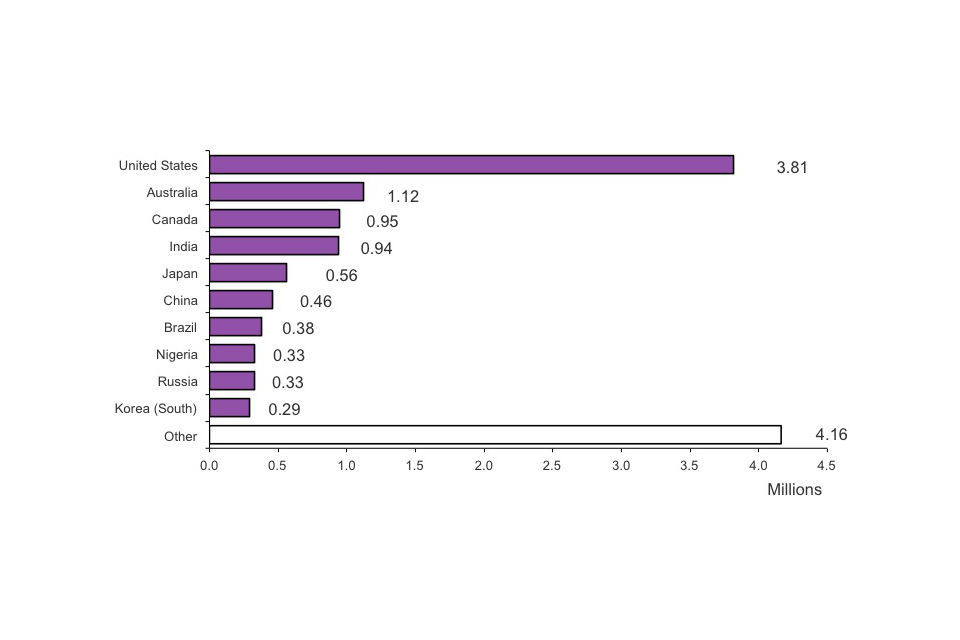
Top ten nationalities admitted, 2011 (Total number of admissions 13.3 million)
7.6 About the figures
All people admitted are subject to immigration control except British, other European Economic Area (EEA) and Swiss nationals.
Most data in this briefing are rounded to three significant figures. All data include dependants.
For arriving passengers subject to immigration control, who have previously obtained leave to enter, the journey is recorded as ‘returning after a temporary absence abroad’. Due to the volume of passengers arriving at Heathrow and Gatwick some data are estimated from monthly samples.
Some major components of the total (visitors, passengers returning and passengers in transit) reflect, to a large extent, trends in international tourism. The number of other admissions (for example, for work, study or family reasons) are likely to reflect trends in international migration and related policy and legislative changes affecting those subject to immigration control, for example changes in immigration legislation, enlargement of the European Union, and the introduction of the points-based system for work and study in 2008 and 2009 respectively.
Total passenger arrival data are available up to the year ending September 2012 (Table ad.01 q); data on the purpose of journey (e.g. visit, work, study) and data for individual nationalities are available up to the calendar year 2011 (Tables ad. 02 and ad.03). More detailed data on passenger arrivals to the year ending June 2012 will be available in future editions.
The User Guide provides further details on this topic including definitions used, how figures are compiled, data quality and issues arising from figures being estimated from samples. For further information on changes to immigration legislation affecting the statistics, see the policy and legislative changes timeline published alongside the User Guide.
7.7 Data tables
Further data are available in Admissions Tables ad.01 to ad.03.
7.8 Other related data
Further briefing on those arriving who are not subject to immigration control is available in the EEA topic.
The Admissions section of the user guide includes a discussion on the differences between passenger arrivals and long-term international migration estimates of immigration published by the Office for National Statistics. A comparison between passenger arrivals and entry clearance visas is provided in the Before Entry section.
Further information on visitors to the UK is published by the Office for National Statistics in Overseas Travel and Tourism – September 2012.
Historical data on travel trends from 1980 to 2011 was published in ONS’s bulletin Travel trends 2011.
Data on the clearance of passengers at the border within published standards and the cost of passengers cleared at the border are published as official statistics by the UK Border Agency as part of their key input and impact indicators, UK Border Agency Our Performance.
8. Asylum part 1: applications, initial decisions and outcome
8.1 Introduction
This is part one of three topic briefings on asylum. Asylum is when someone applies for protection from persecution or fear of persecution in their own country. The UK Border Agency then decides whether the application is legitimate.
This briefing covers asylum applications, initial decisions and outcome analysis. The second covers appeals, unaccompanied asylum-seeking children and age disputes. The final briefing covers support, resettlement and international comparisons.
8.2 Key facts
In the year ending September 2012, there were 20,838 asylum applications, a rise of 1,583 (8%) from the previous 12-month period. This follows a smaller increase in the previous year. This increase coincides with a large proportionate increase in the number of applicants from Syria since the outbreak of the Syrian civil war (809 applications in the year ending September 2012 compared with 244 in the previous 12 months). The number of applications remains low relative to the peak number of applications in the year ending December 2002 (84,132).
The number of initial decisions on asylum applications has fallen 8% (-1,546) to 16,692. The proportion of applicants granted asylum, a form of temporary protection (humanitarian protection or discretionary leave) or leave under new family or private life rules has increased to 36% (5,942) in the latest 12 months, the highest proportion in the current series of published data available from 2001.
8.3 Asylum applications and initial decisions for main applicants

Asylum applications and initial decisions for main applicants
(1) Granted includes grants of asylum, humanitarian protection, discretionary leave, leave to remain under family life rules and leave to remain under private life rules.
8.4 Long-term trends in asylum applications, 2001–2011
The chart below shows the number of asylum applications made for calendar years back to 2001.
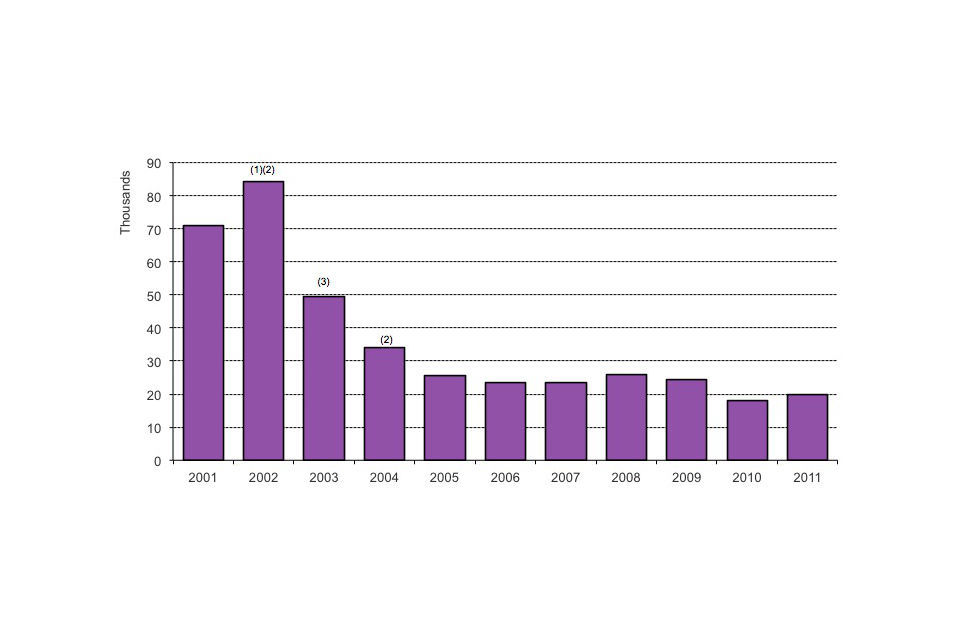
Long-term trends in asylum applications, 2001–2011
Chart notes
Source: Home Office, Immigration Statistics July–September 2012, Asylum table as.01 (1) A process preventing certain nationalities from appealing a decision while in the country (non-suspensive appeals process) was introduced in 2002. (2) Juxtaposed controls, full immigration controls operated by UK immigration officers, were opened in France and Belgium in 2002 and 2004. (3) Fast-track facilities for asylum applications were introduced in 2003.
Asylum applications were up 11% in 2011 (19,865) compared with 2010 (17,916), although the annual number of applications remains low relative to the 2002 peak with only 2010 having a lower annual figure.
Falls in asylum applications since 2002 coincide with the introduction in 2002 of a process preventing certain nationalities from appealing a decision while in the country, the opening of UK border controls (often termed ‘juxtaposed’ controls) in France and Belgium in 2002 and 2004 respectively and the introduction of fast-track facilities for asylum applications in 2003.
8.5 Nationalities applying for asylum
World events have an effect on which nationals are applying for asylum at any particular time. Recent political unrest in Libya appears to have led to a substantial increase in asylum applications from Libyan nationals in 2011 (722 applications compared to 90 in 2010), although numbers of applications fell during the third quarter of 2012 to just 56 compared with 206 in the third quarter of 2011, reflecting a more stable situation in Libya.
8.6 Top ten nationalities applying for asylum, 2011 (Total number of applications 19,865)
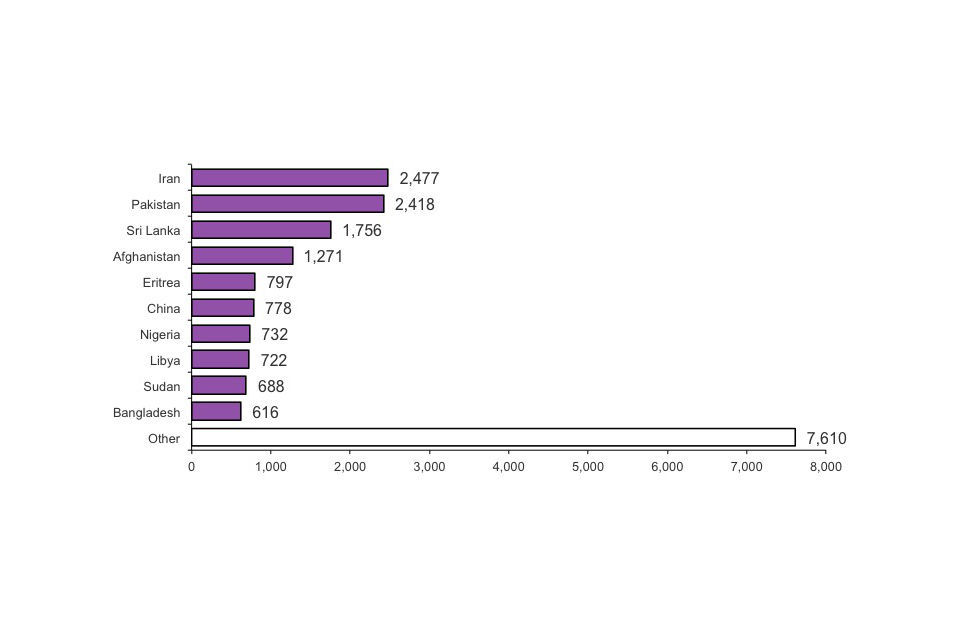
Top ten nationalities applying for asylum, 2011 (Total number of applications 19,865)
8.7 Chart notes
Source: Home Office, Immigration Statistics July–September 2012, Asylum table as.01
Most applications are made by those already in the country (88% of applications in 2011) rather than people arriving at port. Applicants also tend to be young and male. Of applicants in 2011, over half (58%) were between the ages of 21 and 34 and 73% were male.
8.8 Outcome of asylum applications, by year of application
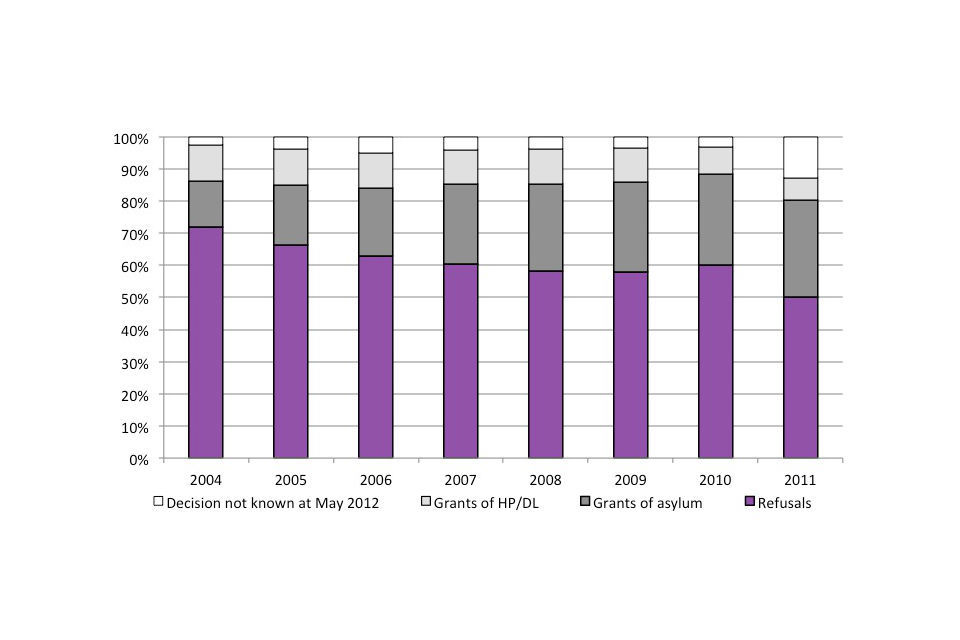
Outcome of asylum applications, by year of application
Chart notes
Source: Home Office, Immigration Statistics July–September 2012, Asylum table as.06
Following through the 19,865 main applicants who applied for asylum in 2011, as at May 2012 when the statistics were compiled, an estimated 7,347 (37%) had been granted asylum, humanitarian protection or discretionary leave at either initial decision or appeal; 9,948 (50%) cases had been refused; and a further 2,570 (13%) were awaiting confirmation of an initial decision. The overall proportion of applications either granted asylum or a form of temporary protection at initial decision or having an appeal allowed, was estimated to be 26% in 2004; and the proportion gradually increased year-on -year to 39% in 2009.
The increase in applications and grants of asylum in 2008 and 2009 compared to earlier years is related to the large number of nationals of Zimbabwe applying for asylum in late 2008 and early 2009. Of the 5,613 main asylum applicants from Zimbabwe in 2009, 3,128 (56%) were granted asylum, humanitarian protection or discretionary leave at either initial decision or appeal and 2,395 cases were refused.
8.9 Applications pending
At the end of September 2012, 13,008 applications received since April 2006 from main applicants were pending a decision (initial decision, appeal or further review), 8% more than at the end of September 2011.
8.10 Data tables
8.11 About the figures
The user guide provides further details on this topic including definitions used, how figures are compiled, data quality and issues arising from figures being based on data sourced from an administrative database. For further information on changes to immigration legislation affecting the statistics see the policy and legislative changes timeline published alongside the User Guide.
One person (the main applicant) can apply for asylum on behalf of themselves and others (dependants). This briefing excludes numbers of dependants, unless stated otherwise.
All data for 2011 and 2012 are provisional.
8.12 Other related data
Numbers of asylum applicants removed are available in the Removals and voluntary departures topic.
The UK Border Agency publishes data on asylum performance framework measures and the size of the controlled archive, UK Border Agency Our Performance.
9. Asylum part 2: appeals, unaccompanied asylum-seeking children, age disputes and dependants
9.1 Introduction
This is part two of three topic briefings on asylum. Asylum is when someone applies for protection from persecution or fear of persecution in their own country. The UK Border Agency then decides whether the application is legitimate.
This briefing covers appeals, unaccompanied asylum-seeking children (UASCs) and age disputes. The first covers asylum applications, initial decisions and outcome analysis. The final briefing covers support, resettlement and international comparisons.
9.2 Asylum appeals
The HM Courts and Tribunals Service (HMCTS) (formerly Tribunals Service Immigration and Asylum and the Asylum and Immigration Tribunal (AIT)), an executive agency of the Ministry of Justice, hears and decides appeals against decisions made by the UK Border Agency. It consists of the First-tier Tribunal Immigration and Asylum Chamber and Upper Tribunal Immigration and Asylum Chamber (FTTIAC and UTIAC). The First-tier Tribunal Judge will decide whether the appeal against the decision is successful or not (this is known as the decision being ‘allowed’ or ‘dismissed’).
The HM Courts and Tribunals Service received 8,316 asylum appeals from main applicants in the year ending September 2012, continuing the falls over the last two years (from 15,124 in the year ending September 2010). The fall coincides with a similar fall in the number of refusals at initial decision over the same period.
In the year ending September 2012, the proportion of appeals dismissed was 66% and allowed was 27%; the remainder were withdrawals.
9.3 Asylum appeals received and determined for main applicants
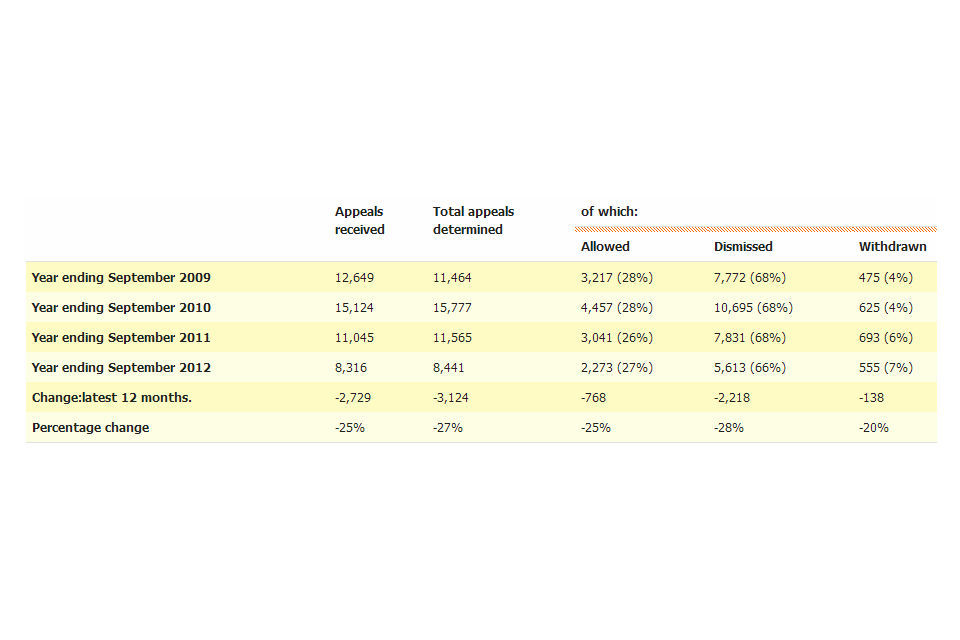
Asylum appeals received and determined for main applicants
9.4 Longer-term trends in asylum appeals
In 2011, a total of 9,986 main applicants requested an asylum appeal, a 28% decrease compared to 2010 (13,928). Data from the UK Border Agency sources are currently only available back to 2007, but data published by the HM Courts and Tribunals Service suggest that 2010 saw the most cases determined since 2005.
9.5 Unaccompanied asylum-seeking children
An unaccompanied asylum-seeking child (UASC) is a person under 18, applying for asylum on his or her own right, who is separated from both parents and is not being cared for by an adult who by law has responsibility to do so. The figures presented here consist of all those unaccompanied children who go on to claim asylum and so can include some cases where an unaccompanied child at a later date makes a claim when over 18.
UASC annual applications continue to fall and fell by 19% between 2010 and 2011 (1,398 applications). This decreasing trend has been influenced by falling applications from nationals of Afghanistan. In 2011, 7% of main applicants were UASCs. Almost a third (29%) of UASC applications were made by male nationals of Afghanistan; and overall 82% (1,149) of applications were from male applicants.
A total of 1,353 initial decisions were made on UASC applications in 2011, a decrease of 43% compared to 2010 (2,359).
9.6 Age disputes
The UK Border Agency disputes the age of some asylum applicants, who claim to be children. In 2011, 374 individuals had their age disputed, a decrease of 24% compared with 2010 (489) and a decrease of 67% compared with 2009 (1,129). Of the 374 individuals, 30% (112) were nationals of Afghanistan.
9.7 Dependants
One person (the main applicant) can apply for asylum on behalf of themselves and others (dependants). A dependant is an asylum seeker’s spouse or any dependent child of the asylum seeker or spouse who is under the age of 18.
In 2011, the 19,865 asylum applications received accounted for 25,898 individuals when dependants were included; an average of one dependant for every three main applicants. Comparing the ten nationalities with the highest number of main applicants in 2011, the ratios of dependants to main applicants ranges from one dependant for every 27 main applicants for nationals of Eritrea to one dependant for every two main applicants from Libya.
Initial decisions were made relating to 5,412 dependants in 2011. Of these 1,181 (22%) were granted asylum, 352 (7%) were granted a form of temporary protection, and 3,879 (72%) were refused. The proportion being refused asylum is higher than main applicants in 2011, although lower than the proportion for dependants in 2010 (80%).
9.8 Data tables
9.9 About the figures
The user guide provides further details on this topic including definitions used, how figures are compiled, data quality and issues arising from figures being based on data sourced from an administrative database.
One person (the main applicant) can apply for asylum on behalf of themselves and others (dependants). This briefing excludes numbers of dependants, unless stated otherwise.
All data for 2011 and 2012 are provisional. For further information on changes to immigration legislation affecting the statistics see the policy and legislative changes timeline published alongside the User Guide.
9.10 Other related data
Numbers of asylum applicants removed are available in the removals and voluntary departures topic.
The UK Border Agency publishes data on asylum performance framework measures and the size of the controlled archive, UK Border Agency Our Performance.
Cases heard at the Upper Tribunal Immigration and Asylum Chamber are a subset of data published in Quarterly statistics for the Tribunals Service.
10. Asylum part 3: asylum support, international comparisons and resettlement
10.1 Introduction
This is part three of three topic briefings on asylum. Asylum is when someone applies for protection from persecution or fear of persecution in their own country. The UK Border Agency then decides whether the application is legitimate.
This third briefing covers support, resettlement and international comparisons. The first covers asylum applications, initial decisions and outcome analysis. The second covers appeals, unaccompanied asylum-seeking children and age disputes.
10.2 Support
As asylum seekers are not normally allowed to work for the first year while their application is being considered, support is available (known as Section 95 support). This may be provided as both accommodation and subsistence, or accommodation or subsistence only. Failed asylum seekers who are not eligible for support under section 95, but are homeless and have reasons that temporarily prevent them from leaving, may be eligible for support (called Section 4 support).
There were 11,372 support applications in 2011, having fallen from a peak of 68,624 in 2002. The overall falls in support applications and numbers receiving support are in line with falling numbers of asylum applications and the clearance of a backlog of asylum cases from the early part of the decade.
10.3 Long-term trends in support applications
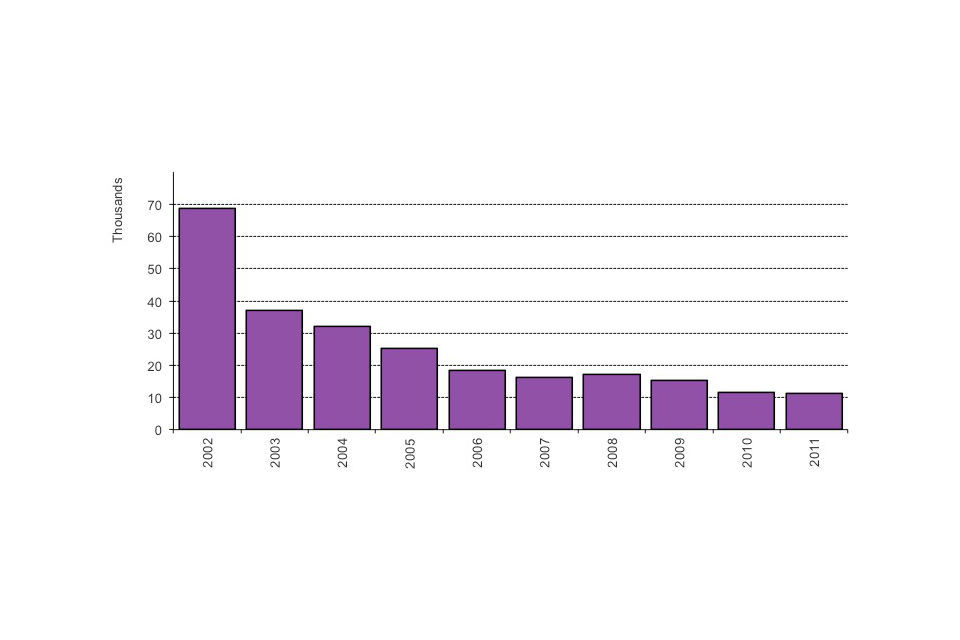
Long-term trends in support applications
Chart notes
Source: Home Office, Immigration Statistics July–September 2012, Asylum table as.15.
10.4 Numbers of asylum seekers supported under Section 95, Section 98 and Section 4, as at end of quarter
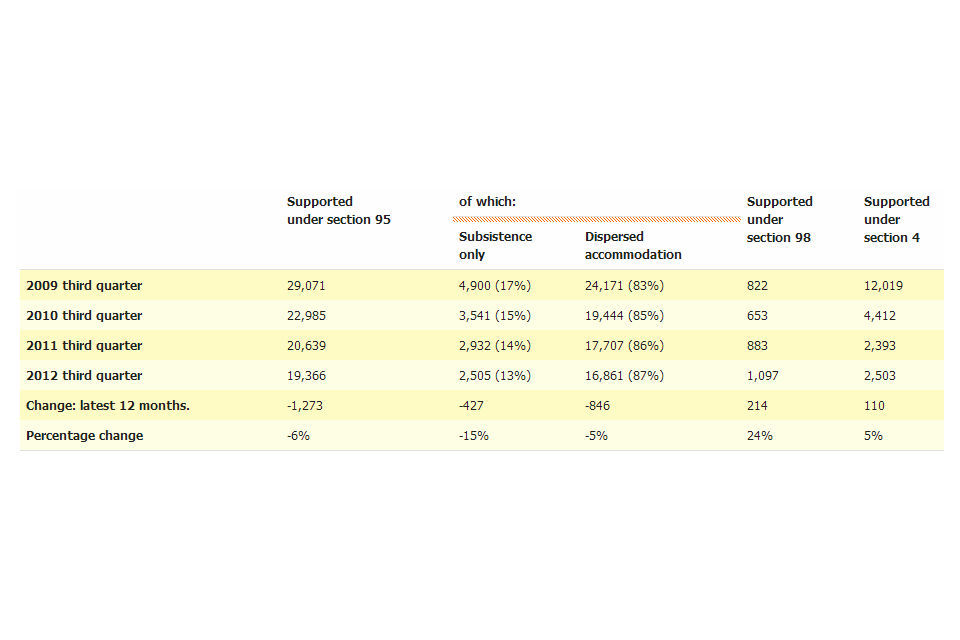
Numbers of asylum seekers supported under Section 95, Section 98 and Section 4, as at end of quarter
Those supported under Section 95 and Section 98 include dependants.
The largest nationality group currently supported under section 95 are nationals of Pakistan (20% of the total).
10.5 Resettlement
In addition to those asylum seekers who apply in the UK, a resettlement scheme is also offered to those who have been referred to the UK Border Agency by UNHCR (the UN agency for refugees).
In 2011, a total of 454 refugees were resettled in the UK through this process. This is lower than in recent years due to the scheduling of arrivals within an operating year of April to March, rather than a calendar year.
10.6 International comparisons
Including dependants, the estimated total number of asylum applications to the EU was 284,800 in 2011. The total number of asylum applications across the EU increased from 2010 (241,100) and was the highest since 2003.
10.7 Top ten EU countries receiving asylum applications, 2011 (includes dependants) (Total number of applications 284,800)
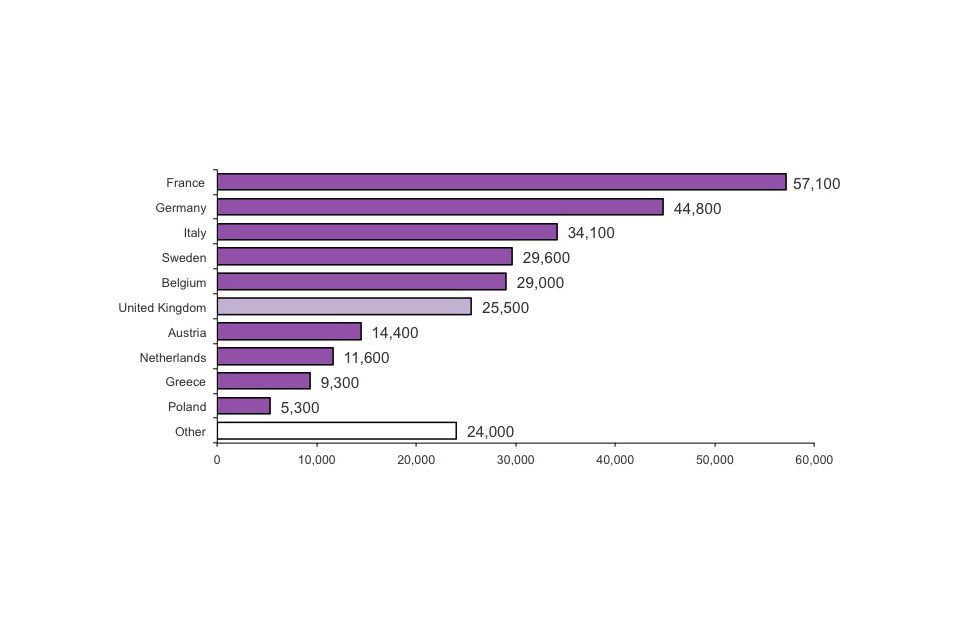
Top ten EU countries receiving asylum applications, 2011 (includes dependants) (Total number of applications 284,800)
Chart notes
Source: Home Office, Immigration Statistics July–September 2012, Asylum table as.07.
The UK has remained sixth highest in terms of asylum applications to the EU between 2010 and 2011. However, the UK has dropped from second highest to sixth highest in terms of asylum applications within the EU between 2009 and 2011, with France, Germany, Italy, Sweden and Belgium now having more applicants. With the relative size of resident populations of the 27 EU countries taken into account, the UK ranked 14th in terms of asylum seekers per head of population in 2011, compared with 13th in 2010.
10.8 Data tables
- Asylum vol.3: Tables as.07 and as.07.q
- Asylum vol. 5: Tables as.15 to as.18.q and Resettlement as.19
10.9 About the figures
The User Guide provides further details on this topic including definitions used, how figures are compiled, data quality and issues arising from figures being based on data sourced from an administrative database. For further information on changes to immigration legislation affecting the statistics see the policy and legislative changes timeline published alongside the User Guide.
The Asylum section of the User Guide includes a discussion on the differences between the definition of asylum applications used in this release compared to Eurostat (the European statistical organisation), as well as the definition of asylum appeals used in this release compared to asylum appeals published by the HM Courts and Tribunals Service.
One person (the main applicant) can apply for asylum on behalf of themselves and others (dependants). This briefing excludes numbers of dependants, unless stated otherwise.
All data for 2011 and 2012 are provisional.
10.10 Other related data
Numbers of asylum applicants removed are available in the removals and voluntary departures topic.
The UK Border Agency publishes data on asylum performance framework measures and the size of the controlled archive, UK Border Agency Our Performance.
11. Extensions of stay
11.1 Introduction
The figures in this topic brief relate to the number of people, subject to immigration control, who are granted or refused permission to extend their stay in the UK. An individual may make more than one application in any given year.
11.2 Key facts
There were 10% fewer grants of extensions (273,513) in the year ending September 2012, largely due to a 28% fall in study-related grants, which continued the falls seen over the last three years. The 10% fall is consistent with the tightening of the immigration rules for students since April 2011 (details below).
Whilst study and family-related grants of extensions fell, work-related extensions (142,443) were 10% (13,516) higher in the year ending September 2012 than the previous 12 months, although still lower than three years ago (182,442 in year ending September 2009).
Grants to highly skilled individuals rose from 82,749 to 89,762 in the year ending September 2012. This was almost entirely accounted for by higher levels of grants made specifically for post-study work during the period April to September 2012 (22,402 compared with 16,438 for the corresponding period in 2011). This post-study work route was closed to new applications on 6 April 2012 but existing applications continue to be processed.
Individuals who have graduated after studying in the UK can stay under other immigration routes if they meet the criteria. There was also a 37% increase in grants for skilled workers (from 31,528 to 43,048) which may partly reflect the closure in April 2012 of the post-study work route for highly skilled individuals (see above).
Grants to extend stay by reason, and refusals

Grants to extend stay by reason, and refusals
11.3 Long-term trends in grants of an extension of stay
The chart below illustrates longer-term trends in grants to extend stay for the calendar years 2005 to 2011.
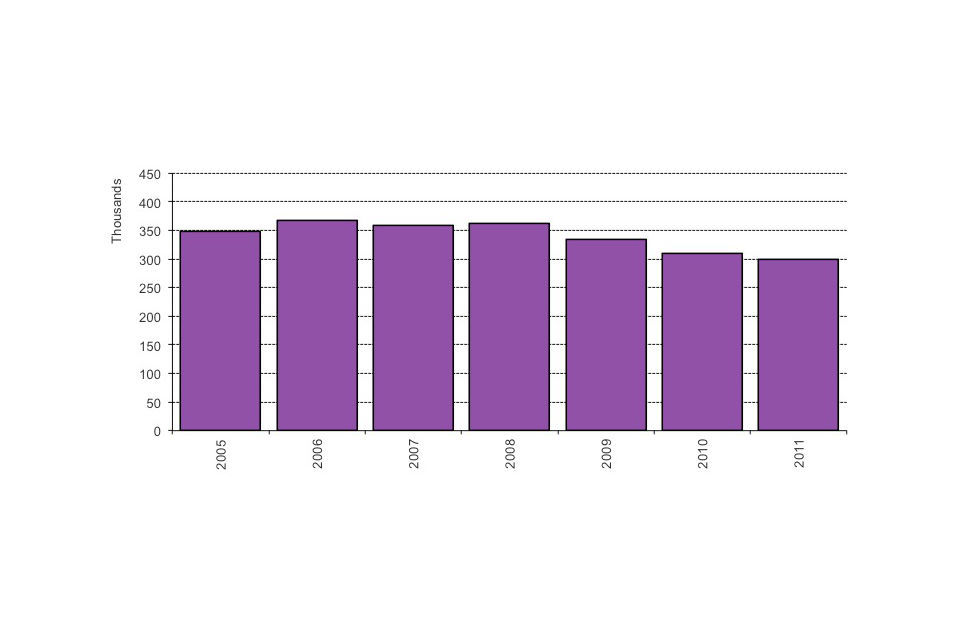
Long-term trends in grants of an extension of stay
Chart notes
Source: Home Office, Immigration Statistics July–September 2012, Extensions table ex.01.
11.4 Nationalities granted an extension (excludes dependants)
Of the total 237,098 grants of an extension of stay in 2011, 67% (158,645) were to Asian nationals and 15% (35,974) were to African nationals.
Top ten nationalities granted an extension to stay, 2011 (excludes dependants) (Total number of grants 237,098)
Top ten nationalities granted an extension to stay, 2011 (excludes dependants) (Total number of grants 237,098)
Chart notes
Source: Home Office, Immigration Statistics July–September 2012, Extensions table ex.02.
11.5 Data tables
Further data are available in Extensions Tables ex.01 to ex.02.
11.6 About the figures
EEA nationals are not subject to immigration control so are not included in these figures. When a country joins the EU its nationals are no longer included in these figures e.g. Bulgarian and Romanian nationals are not included from 2007 onwards.
Details of changes to the student route, and the highly skilled route, from April 2011 are given at the links below
- Student visas statement of intent and transitional measures
- Summary of the new student policy
- Tier 1 and 2 Immigration Rules, settlement and asylum
The data in this briefing include dependants, except where stated otherwise, and take account of the outcomes of reconsiderations and appeals. All figures for 2011 and 2012 are provisional.
The numbers of applications and decisions made reflect changes over time in levels of immigration, as well as policy and legislative changes, including changes to immigration legislation. The availability and allocation of resources within the UK Border Agency can also affect the number of decisions.
The user guide provides further details on this topic including definitions used, how figures are compiled, data quality and issues arising from figures being based on data sourced from an administrative database.
11.7 Other related data
Data on migration applications decided within published standards, the cost per decision for all permanent and temporary migration applications and the size of the controlled archive are published as Official Statistics by the UK Border Agency as part of their performance data. Details including an explanation of what the controlled archive includes are given at UK Border Agency Our Performance.
12. Settlement
12.1 Introduction
The figures in this topic brief relate to the number of people, subject to immigration control, who are granted or refused permission to stay permanently in the UK, known as settlement.
12.2 Key facts
In the year ending September 2012 the number of people granted permission to stay permanently fell by 28% (50,793) to 132,099, the lowest level in the last five years.
Most of the 50,793 fall was accounted for by lower numbers of grants given on a discretionary or other basis (which fell from 47,127 to 10,451). Such grants in recent years have mainly resulted from a review of the backlog of cases from before March 2007 involving unsuccessful asylum applicants, and the latest fall follows the completion of the review.
The rest of the 50,793 fall was accounted for by falls in family-related grants (down 10,417 or -19%) and in work-related grants (down 3,663 or -5%), both of which have fallen since the year ending September 2010.
Asylum-related grants remained steady at 11,348 in the latest 12 months as compared to the year ending September 2011. The lower levels in the preceding three years reflect rule changes in August 2005 that effectively delayed grants of settlement for some people. The rule change meant that people given refugee status no longer received a grant immediately, and instead they have been given five years’ temporary permission to stay.
Grants to stay permanently by reason, and refusals

Grants to stay permanently by reason, and refusals
Long-term trends in grants to stay permanently
The chart below illustrates longer-term trends in grants to stay permanently for the calendar years back to 2001.
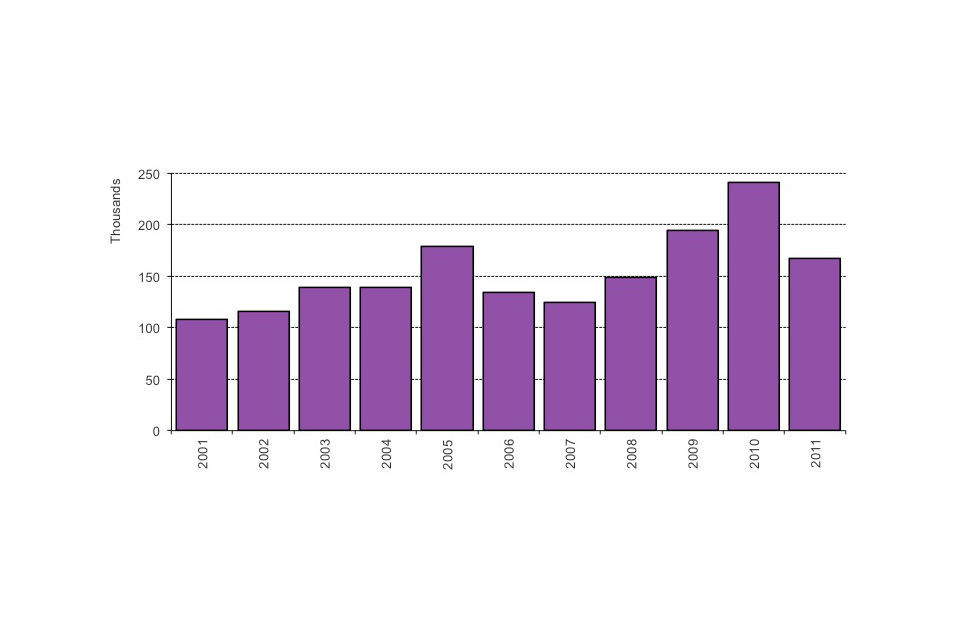
Long-term trends in grants to stay permanently
Chart notes
Source: Home Office, Immigration Statistics July–September 2012, Settlement table se.02
The increase from 2001 to 2005 was mainly due to increases in work and asylum-related grants, which then fell back in 2006 and 2007, reflecting changes to rules on how quickly those granted refugee status were granted settlement, and how quickly individuals qualified for work-related settlement. The higher levels in 2009 and 2010 were due to grants given on a discretionary or other basis resulting from a review of the backlog of cases involving unsuccessful asylum applicants, and the fall in 2011 follows the completion of the review.
Nationalities granted permission to stay permanently
Of the total 166,878 people granted permission to stay permanently in 2011, over half (53% or 88,528) were to Asian nationals and a further quarter (25% or 42,148) were to African nationals.
Top ten nationalities granted permission to stay permanently, 2011 (Total 166,878)
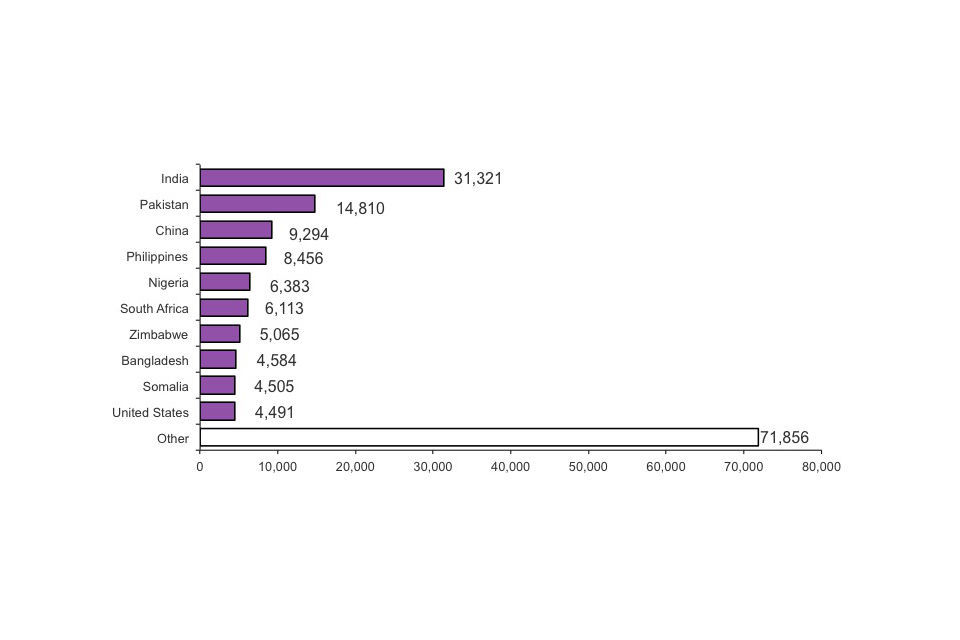
Top ten nationalities granted permission to stay permanently, 2011 (Total 166,878)
Chart notes
Source: Home Office, Immigration Statistics July–September 2012, Settlement table se.03.
12.3 Data tables
Further data are available in Settlement Tables se.01 to se.06.
12.4 About the figures
EEA nationals are not subject to immigration control and so are not included in these figures. When a country joins the EU its nationals are no longer in these figures e.g. Bulgarian and Romanian nationals are not included from 2007 onwards.
The numbers of applications and decisions about permission to stay permanently reflect changes over time in levels of those entering the country, as well as policy and legislative changes. These may affect the number of people potentially eligible to stay permanently, for example. The availability and allocation of resources within the UK Border Agency can also affect the number of decisions.
The user guide provides further details on this topic including definitions used, how figures are compiled, data quality and issues arising from figures being based on data sourced from an administrative database. It also includes a discussion of the differences between the grants of permission to stay permanently and long-term international migration estimates of immigration published by ONS. For further information on changes to immigration legislation affecting the statistics, see the policy and legislative changes timeline published alongside the User Guide.
All the figures include spouses and dependants, unless stated otherwise. All data for 2011 and 2012 are provisional.
12.5 Other related data
From 2003 onwards, dependants of EEA and Swiss nationals in confirmed relationships may be shown separately in figures on issues and refusals of permanent residence documents, rather than in figures about settlement. Figures on issues and refusals of permanent residence documentation to EEA nationals and their family members are shown in Table ee.02 in the European Economic Area section.
Data on migration applications decided within published standards, the cost per decision for all permanent and temporary migration applications and the size of the controlled archive are published as Official Statistics by the UK Border Agency as part of their performance data. Details including an explanation of what the controlled archive includes are given on the Home Office website, UK Border Agency Our Performance.
13. Citizenship
13.1 Introduction
The figures in this topic brief relate to the number of people who are granted or refused British citizenship.
13.2 Key facts
There were 3% more people granted British citizenship in the year ending September 2012 (184,849) compared with the previous 12 months (179,532), and a corresponding 3% increase in decisions. These increases may be due to greater availability of resource for decision-making as there was a 12% fall in applications over the same period (see Table cz.01.q). The 12% fall in applications may in turn reflect the 28% fall in grants of permission to stay permanently, known as settlement.
In the year ending September 2012, there were a record 101,338 people granted citizenship based on residence (a 9% increase).
Grants and refusals of citizenship
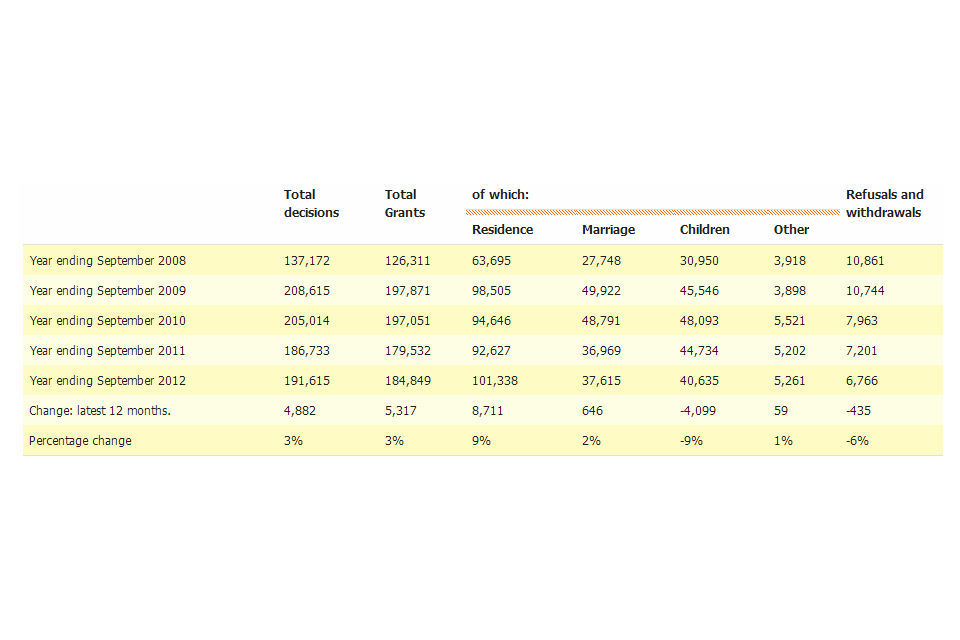
Grants and refusals of citizenship
Long-term trends in grants of citizenship
The chart below illustrates longer-term trends in grants of citizenship by calendar year.
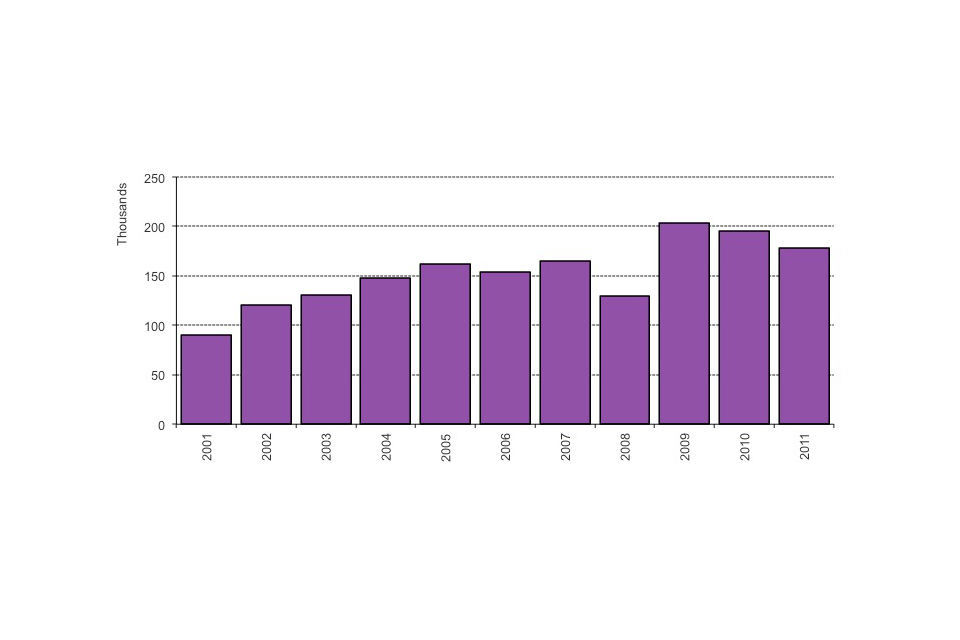
Long-term trends in grants of citizenship
Chart notes
Source: Home Office, Immigration Statistics July –September 2012, Citizenship table cz.03.
The numbers of applications and grants have generally risen from 2001 onwards, although grants have fallen in the last two years. The overall increase in the last decade is likely, in part, to reflect increased grants of permission to stay permanently (known as settlement). After a period of residence those granted settlement become eligible to apply for citizenship. Grants in 2008 were reduced when staff resources were temporarily transferred from decision-making to deal with administration of new applications. There were 177,785 grants in 2011, lower than the record 203,789 in 2009, but remaining nearly double the level seen in 2001.
13.3 Grants of citizenship by previous nationality
Former Indian and Pakistani nationals have accounted for the largest numbers of grants in almost every year from 2001, (the exception was 2007, when former nationals of Pakistan accounted for only the fifth highest number of grants). Together, former Indian and Pakistani nationals accounted for a quarter (25%) of grants in 2011.
Top ten previous nationalities granted citizenship, 2011 (Total number of grants 177,785)
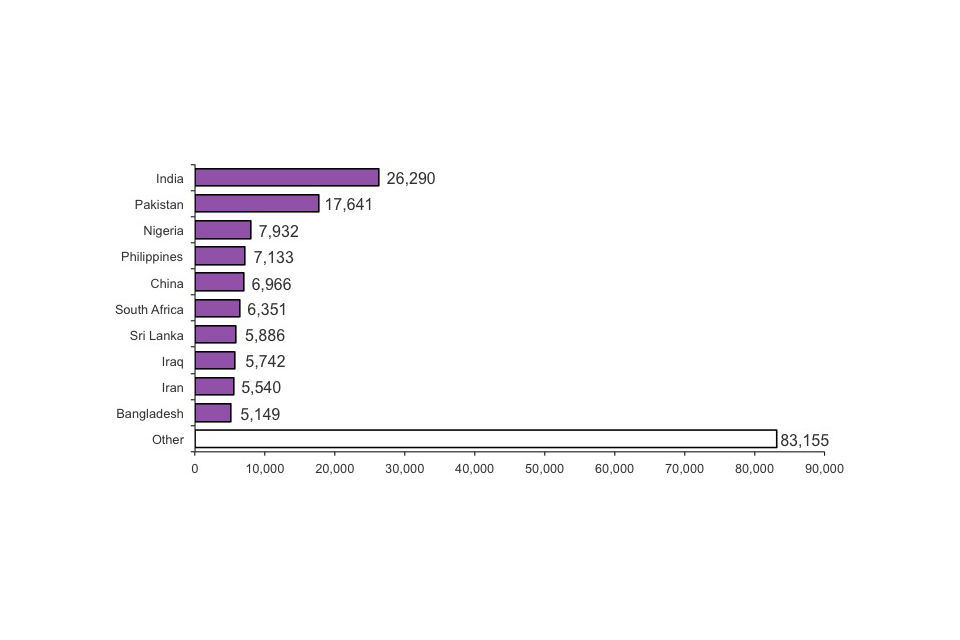
Top ten previous nationalities granted citizenship, 2011 (Total number of grants 177,785)
Chart notes
Source: Home Office, Immigration Statistics July–September 2012, Citizenship table cz.06
13.4 Where are new citizens attending ceremonies?
While the total number of ceremonies attended has increased in line with grants, the proportion in the London region fell from 54% in 2005 to 40% in 2010. Over the same period there were increases in the proportions for the North West, Yorkshire and the Humber, the West Midlands and the South East. In 2011 the geographical distribution has remained similar to 2010.
13.5 Data tables
Further data are available in British Citizenship Tables cz.01 to cz.10. In addition to applications and detailed breakdowns of decisions, these include information on citizenship ceremonies attended and renunciations of citizenship.
13.6 About the figures
There are no separate figures for dependants because all applications for citizenship are from individuals treated as main applicants in their own right (including those made on the basis of a relationship with an existing British citizen). The data also reflect the outcome of reconsidered decisions. All figures for 2011 and 2012 are provisional.
Citizenship is granted under the British Nationality Act 1981 which came into force on 1 January 1983, subsequently amended by the Nationality, Immigration and Asylum Act 2002.
The number of applications and decisions made reflect changes over time in levels of those entering the country, as well as policy and legislative changes, which for example may affect the number of people potentially eligible to apply. The availability and allocation of resources within the UK Border Agency can also affect the number of decisions.
The user guide provides further details on this topic including definitions used, how figures are compiled, data quality and issues arising from figures being based on data sourced from an administrative database. For further information on changes to immigration legislation affecting the statistics, see the policy and legislative changes timeline published alongside the User Guide.
13.7 Other related data
Who are the UK’s new citizens?, Centre on Migration, Policy and Society (COMPAS) Breakfast Briefing Summary, July 2011.
14. Removals and voluntary departures
14.1 Introduction
The figures in this topic brief relate to numbers of people, including dependants, leaving the UK either voluntarily when they no longer had a right to stay in the UK or where, in the main, the UK Border Agency (UKBA) has sought to remove individuals. While individuals removed at a port of entry have not necessarily entered the country, their removal requires action by the UKBA, such as being placed on a return flight, and are therefore included unless stated otherwise.
14.2 Key facts
Enforced removals remained steady at 14,823 in the year ending September 2012 as compared with the previous 12 months (14,786).
The number of passengers refused entry at port and who subsequently departed has fallen 15% in the year ending September 2012 to 13,632 from 16,118 for the previous 12 months. This continues an overall fall in these figures since the year ending June 2005 (31,950).
In the year ending September 2012, there was a decrease of 7% in total voluntary departures to 23,184 compared with the previous year (24,925). This category has represented the largest proportion of those departing from the UK since the end of 2009.
Of these voluntary departures, 56% of those departing were categorised as other confirmed voluntary departures, 28% as notified voluntary departures (where a person notifies UKBA that they have departed) and 16% as Assisted Voluntary Returns (where financial assistance is provided). The largest category, other confirmed voluntary departures, are cases where a person has been identified as leaving when they no longer had the right to remain in the UK, either as a result of embarkation controls or by subsequent data-matching on UKBA systems. The retrospective nature of the matching means figures for the latest periods are particularly subject to upward revision (see the section ‘About the figures’).
Removals and voluntary departures by type
Grants and refusals of citizenship
Table Note (1) The figures for total voluntary departures and confirmed voluntary departures will initially be undercounts due to data-matching exercises that take place after the statistics are produced.
14.3 Asylum and non-asylum cases
In the year ending September 2012, there were 5,114 enforced removals who had sought asylum at some stage, down 11% from the previous 12-month period (5,756) and 55% lower than the peak of 11,479 for the year ending September 2006. This decrease in asylum cases departing can be viewed in the context of a general decreasing trend in asylum applications since 2002.
Long-term trends in removals and voluntary departures by type, by quarter
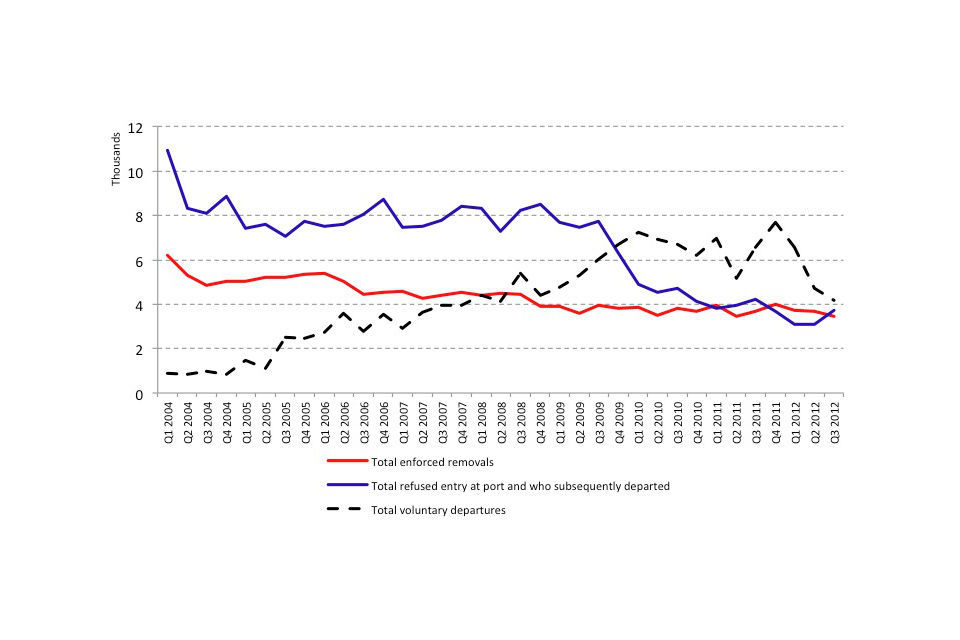
Long-term trends in removals and voluntary departures by type, by quarter
Chart notes
Source: Home Office, Immigration Statistics July– September 2012, Removals table rv.01.q.
The number of those refused entry at port and subsequently removed has decreased since the beginning of the data series. Quarterly figures for the first quarter of 2012 were the lowest since the publication of this data series began. The 42% decrease in the number of passengers refused entry at port and subsequently removed from the third quarter of 2009 (7,751) to the second quarter of 2010 (4,520) has no identified single cause. It is likely to be due to a combination of factors including a decrease in overall passenger volumes and full visa regimes being imposed, for example, for nationals of South Africa (July 2009) and Bolivia (May 2009).
The long-term trend for voluntary departures had been fairly steadily increasing up to the first quarter of 2010, but quarterly figures have since fluctuated. The long-term increases often coincide with the agency improving its contact management with migrants and its ability to track those that are leaving the UK. The data-matching exercises identify those who have overstayed their leave and left the UK without informing UKBA, and allows UKBA to focus its enforcement action on those who remain in the UK. Since the end of 2009, this category represents the largest proportion of those departing from the UK as recorded in this data series. As was mentioned above, the figures for the most recent quarters are likely to be subject to upward revision as checks are subsequently made on travellers following departure.
The numbers of enforced removals has declined since publication of this data series began, but quarterly figures have been fairly steady in recent years.
14.4 Departures by ‘harm’ assessment
The harm matrix was introduced in 2007 for monitoring the Public Service Agreement that then was applied as measurement of performance in removing the most harmful people first. ‘Higher harm’ assessments include people who have committed serious criminal and immigration offences.
In the financial year 2011/12, 14,806 enforced removals and 26,022 voluntary departures were subject to an assessment for a harm rating, of which 22% of enforced removals and 1% of voluntary departures were assessed as ‘higher harm’. In the previous financial year, 26% of enforced removals and 2% of total voluntary departures were assessed as ‘higher harm’.
14.5 Foreign national offenders
During the financial year 2011/12, 4,501 foreign national offenders were removed compared with 5,367 in 2010/11. In 2011/12, the UKBA target for removal of foreign national offenders was 4,700.
During the third quarter of 2012, 1,107 foreign national offenders were removed which represents a fall of 2% in the number of those removed in the third quarter of 2011 (1,129).
14.6 Data tables
Further data on removals and voluntary departures are available in;
- Removals vol. 1: Tables rv.01 to rv.04
- Removals vol. 2: Table rv.04.q
- Removals vol. 3: Tables rv.05 to rv.08
14.7 About the figures
The user guide provides further details on this topic including definitions used, how figures are compiled, data quality and issues arising from figures being based on data sourced from an administrative database.
Other confirmed voluntary departures were previously known as “Other voluntary departures”; the name change is to clearly signpost those departures which are confirmed by either checks at the border or after the departure; further details are available in the user guide. As the data-matching for the other confirmed voluntary departures is undertaken retrospectively this means these figures are particularly subject to greater upward revision than would be the case for other categories of departure. This means that the most recent figures for voluntary departures, and in particular confirmed departures, understate the finalised figures. For example, the 2011 figures for other confirmed voluntary departures were revised upwards in the May 2012 quarterly release from 13,361 to 15,712, an 18% increase. In the light of the greater use of retrospective data-matching to check departures we currently plan to update, as appropriate, figures for previous quarters for our next release in February.
All data include dependants, unless otherwise stated and are provisional for 2011 and 2012.
14.8 Other related data
Information on numbers of people removed upon leaving detention is available in the Detention topic and numbers of non-asylum passengers initially refused entry at port are available in the [Before Entry]https://www.gov.uk/government/publications/immigration-statistics-july-to-september-2012/immigration-statistics-july-to-september-2012#before-entry-1) topic.
Data on the family returns process are published as official statistics by UKBA as part of their performance data, UK Border Agency Our Performance.
15. Detention
15.1 Introduction
The figures in this topic brief relate to the number of people entering, leaving or in detention, solely under Immigration Act powers, at immigration removal centres, short-term holding facilities and pre-departure accommodation.
15.2 Key facts
In the year ending September 2012, 28,705 people entered detention, an increase of 9% compared with the previous year (26,363). Over the same period there was an increase of 8% in those leaving detention (from 26,323 to 28,442). Of those leaving detention, 61% were removed from the UK.
As of the end of September 2012, 3,091 people were in detention, the highest number recorded since publication of the data began in 2001.
In the third quarter of 2012, 48 children entered detention. This follows falls from a peak in the third quarter of 2009 of 322, to a low of 19 in the first quarter of 2011. The rise in quarterly figures for children entering detention show greater use of Cedars pre-departure accommodation which opened in August 2011 in conjunction with a new process to manage the removal of families that began in March 2011.
People entering, leaving and in detention, solely under Immigration Act powers

Removals and voluntary departures by type
In the third quarter of 2012, 7,296 people entered detention, 7% higher than the same quarter of the previous year (6,833).
15.3 Length of detention
Of those leaving detention during the third quarter of 2012 (7,186), 4,796 (67%) had been in detention for less than 29 days, 1,185 (16%) for between 29 days and two months and 731 (10%) for between two and four months. Of the 474 (7%) remaining, 72 had been in detention for between one and two years and 15 for two years or longer.
15.4 Children in detention
In December 2010, the Government announced its commitment to ending the detention of children for immigration purposes. A new UK Border Agency process for managing the removal of families with no right to be in the UK began in March 2011. Integral to this process new pre-departure accommodation located near Gatwick Airport in West Sussex, Cedars, opened in August 2011 and was specifically designed to provide a secure facility for children and their families. Whilst children are detained in Cedars under Immigration Act powers, they are not held in the same conditions as previously in adult detention facilities.
During the third quarter of 2012, 48 children entered detention, an increase of 11 on the third quarter of 2011 (37), the same number as the third quarter of 2010 and a fall from the third quarter of 2009 (322). This is also below the 60 children entering detention in the second quarter of 2012 and the first quarterly decline since the first quarter of 2011.
Of those children entering detention in the third quarter of 2012, 27 were detained in Tinsley House, compared with 20 at Cedars and the remaining one at Morton Hall.
Of the 54 children leaving detention in the third quarter of 2012, 35 were granted temporary admission/release, 16 were removed from the UK and the remaining three left for other reasons. Of those leaving detention, seven had been detained for more than three days.
Children entering detention, solely under Immigration Act powers
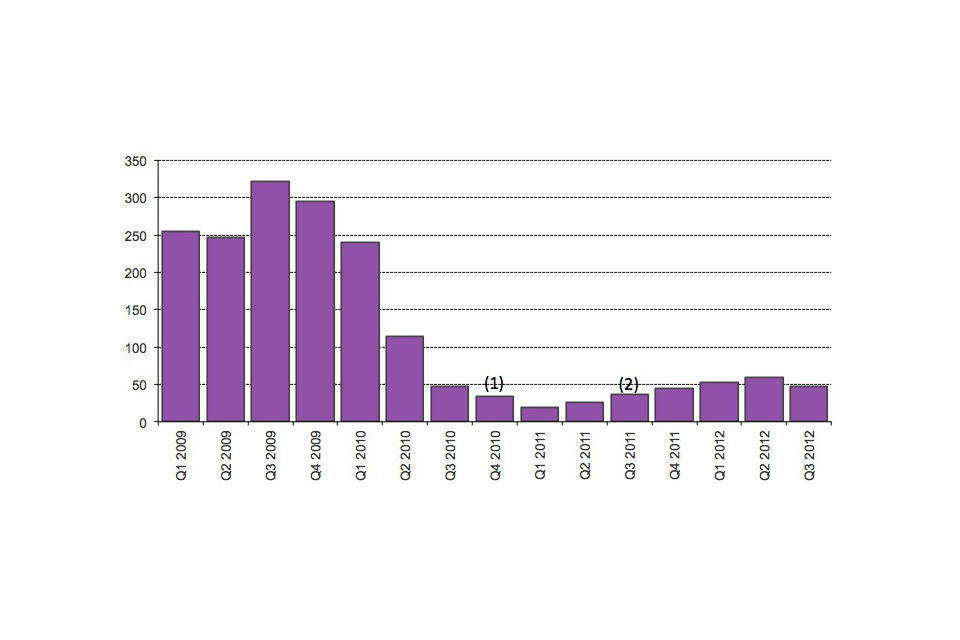
Children entering detention, solely under Immigration Act powers
Chart notes
Source: Home Office, Immigration Statistics July–September 2012, Detention table dt.03.q (1) Oakington Reception Centre closed on 12 November 2010, Yarl’s Wood closed to families with children on 16 December 2010. (2) Cedars pre-departure accommodation opened on 17 August 2011.
15.5 Data tables
Further data are available in Detention Tables dt.01 to dt.12.q
About the figures
Figures presented here do not include those held in police cells, Prison Service establishments, short-term holding rooms at ports and airports (for less than 24 hours) and those recorded as detained under both criminal and immigration powers and their dependants.
The user guide provides further detail on this topic including definitions used, how figures are compiled, data quality and issues arising from figures being based on data sourced from an administrative database.
The user guide also includes information on Cedars pre-departure accommodation.
Children are those recorded as being under 18 years of age. All data for 2011 and 2012 are provisional.
For further information on changes to immigration legislation affecting the statistics, see the policy and legislative changes timeline published alongside the User Guide.
15.6 Other related data
Data on the family returns process are published as Official Statistics by UK Border Agency as part of their performance data, UK Border Agency Our Performance.
16. European Economic Area
16.1 Introduction
The European Economic Area (EEA) consists of countries within the European Union, together with Norway, Iceland and Liechtenstein. Nationals of the EEA and Switzerland have rights of free movement within the UK and are generally not subject to immigration control (though nationals of Bulgaria and Romania have certain restrictions placed on them). Hence there is less information available about EEA nationals from the Home Office’s immigration control administrative systems. This topic briefing brings together the information that is available relating to EEA nationals.
16.2 Key facts
In the year ending September 2012 a large proportion (88%) of those entering the country were British or other EEA nationals who have rights of free movement and are not subject to immigration control (see the admissions data table ad.01.q).
In the year ending March 2012, provisional International Passenger Survey (IPS) estimates based on intentions to stay for at least 12 months indicate that 71,000 more British nationals emigrated than immigrated (74,000 UK nationals immigrating to the UK and 145,000 UK nationals emigrating from the UK i.e. a net migration of -71,000). By contrast, there were a larger number of other EU nationals immigrating to the UK (152,000) than leaving the UK (85,000), i.e. net migration of +67,000.
In 2011 for the EU2 countries (Bulgaria and Romania) there were 2,640 and 23,990 approvals for accession worker cards and for registration certificates, up 1% compared with 2010; whilst approvals under the Sector Based Scheme (SBS) and under the Seasonal Agricultural Workers Scheme (SAWS) have increased respectively by 31% to 787 and 1% to 20,035 in 2011.
In 2011 there were a record 97,982 decisions on applications for residence documents for EEA nationals and non-EEA nationals who were related to EEA nationals. Of these, 47,653 provided an initial recognition of right to reside and 21,159 were issued in recognition of permanent residence, and the remainder were refusals.
Passenger arrivals including estimates of EEA admissions
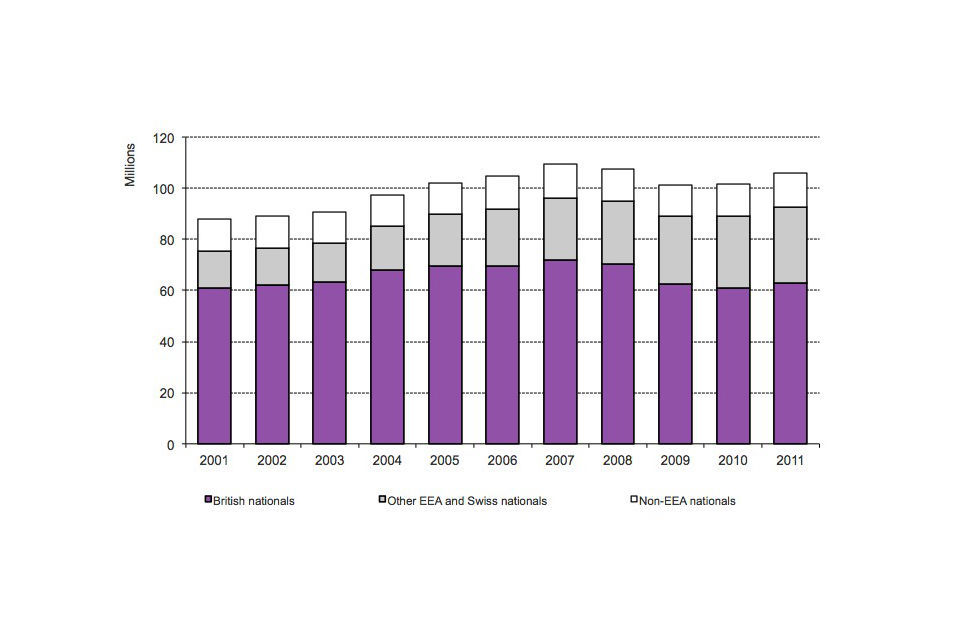
Passenger arrivals including estimates of EEA admissions
Chart notes
Source: Home Office, Immigration Statistics July–September 2012, Admissions table ad.01.
Estimates from IPS provide EU nationals’ reasons for entry. The large majority are either visitors for less than 12 months or individuals returning to the UK (Source: ONS, Travel Trends (Opens in a new window)).
16.3 Data tables
Further data are available in Admissions Table ad.01 and EEA nationals Tables ee.01, ee.01.q and ee.02.
16.4 Admissions of EEA nationals
The number of British passenger arrivals rose from 68.2 million in 2004 to 71.9 million in 2007 and then fell to 60.9 million in 2010 before rising again to 62.8 million in 2011 and 63.0 million in the year ending June 2012 (the latest period for which an estimate is available).
Between 2000 and 2003, the number of EEA passenger arrivals was relatively stable; however, there was an increase in 2004, which coincided with ten countries joining the EU/EEA. The number of EEA passenger arrivals rose from 17.0 million in 2004 to 29.8 million in 2011. These numbers will, additionally, have been boosted from 2007 by nationals of Bulgaria and Romania, following these countries becoming part of the EEA.
16.5 Immigration of EU nationals
Provisional International Passenger Survey estimates define immigrants as individuals who intend to stay for at least a year in the UK (or abroad for emigrants). There were an estimated 152,000 EU national immigrants (excluding British) in the year to March 2012, compared with 149,000 in the previous 12 months.
An estimated 43% of British and 59% of other EU national immigrants came for work-related reasons. By contrast, only 17% of non-EU immigrants came for work while 58% came for study.
Source: ONS, International Passenger Survey
16.6 ‘EU2’ countries – Bulgaria and Romania
Applications for accession worker cards (required for work in the UK) and for registration certificates (that provide proof of residency rights) remained at similar levels in 2011 compared with 2010 (respectively an increase of 1% to 3,330 and a fall of less than 1% to 35,156). The corresponding data on approvals have been revised and show a 1% rise and an 11% fall in the 2011 totals (to 2,640 and 23,990 approvals respectively) compared with previous data indicating a 0% change and a 17% fall. The reasons for revisions of accession worker cards and registration certificates applications and approvals data over time include that:
-
as decisions are made relating to the applications in a quarter, the number of approvals recorded against that quarter’s applications will increase; and
-
as decisions are made, and data are entered on administrative systems, the number of applications recorded on systems can increase slightly.
It is anticipated that the applications and approvals data for the first three quarters of 2012 will be revised upwards.
Approvals under the Sector Based Scheme (SBS) and under the Seasonal Agricultural Workers Scheme (SAWS) have increased respectively by 31% and 1% in 2011, to 787 and 20,035 (previously shown as by 37% and 3% to 822 and 20,456). These revised 2011 totals are a result of corrections to data for the fourth quarter of 2011.
Approvals in Sector Based Scheme applications have fallen from a peak of 1,569 in 2008 to less than 1,000 in each of the last three years. The total for 2011 (787) is higher than 2009 (775) and 2010 (601) but approvals for the first three quarters of 2012 are much lower than the same period of last year.
SAWS approvals rose from 8,058 in 2007 to an annual average of just over 20,000 for 2009 to 2011, with a similar level for the year ending September 2012 (20,569).
16.7 Residence document decisions
Under European law, EEA nationals do not need to obtain documentation confirming their right of residence in the UK.
However, if they want to support an application for a residence card by any of their family members who are not EEA nationals, they must demonstrate that they are residing in the UK in accordance with the Immigration (European Economic Area) Regulations 2006 and are “exercising Treaty rights” in the UK. For more information see the UK Border Agency web site, Residence documents for European nationals.
There were a record 97,982 decisions on applications for EEA residence documents in 2011, 20% higher than 2010, and following a number of measures introduced in 2009 and 2010 by UKBA to improve the quantity and quality of decisions. Just under half (49%) of decisions provided initial recognition of right to reside, and a fifth (22%) provided recognition of permanent residence, similar to the proportions for 2010.
Proportions for refusals were 9% for initial recognition of right to reside and 2% for recognition of permanent residence, falling from 16% and 5% respectively in 2010 largely due to the introduction of a new category of refusal for invalid applications that didn’t provide key information or documentation.
Decisions to issue initial recognition of right to reside documents and those in recognition of permanent residence rose in 2011 (by 7% and 5% respectively), although not for all regions or nationalities. Most notably, recognition of permanent residence fell for family members from Africa by 23% (1,072) from 4,620 in 2010 to 3,548 in 2011.
16.8 About the figures
Nationals of Bulgaria and Romania (the ‘EU2’ countries) currently have certain restrictions placed on them; other nationals of EEA countries can apply for documentation that shows that they have the right of free movement. In the first 12 months of stay, working Bulgarian and Romanian nationals are generally required to hold an accession worker card or apply for one of two lower-skilled quota schemes: the Sector Based Scheme (SBS) or Seasonal Agricultural Workers Scheme (SAWS). Other Bulgarian and Romanian nationals can apply for a registration certificate, giving proof of a right to live in the UK. Data for the first three quarters of 2012 relating to accession worker cards and registration certificates is highly provisional and likely to be revised significantly in future (based on previous experience of these data sources) and has therefore not been used within the commentary.
Figures for admissions and immigration in this briefing are estimates rounded to the nearest thousand. Relevant tables provide unrounded data (except for admissions data and IPS estimates).
All data for 2011 and 2012 are provisional (2011 IPS data are final).
The user guide provides further details on this topic including definitions used, how figures are compiled, data quality and issues arising from figures being based on data sourced from an administrative database or from surveys. For further information on changes to immigration legislation affecting the statistics see the policy and legislative changes timeline published alongside the User Guide.
16.9 Other related data
EEA nationals do not require an entry clearance visa. Just under 500 visas were recorded as issued to EEA nationals in 2011, with 88% of these recorded as Cyprus or from the northern part of Cyprus. The Before Entry data tables and section of the user guide provide more information.
Passenger arrivals figures for 2001 to 2003, referred to in the chart in ‘Key points’ above, can be found in Table 1.2 of Control of Immigration Statistics UK 2009.
Small numbers of EEA nationals seek asylum (21 main applicants and dependants in 2011). A relatively small number of EEA nationals (1,300 enforced removals, 547 non-asylum cases refused entry at port and subsequently departed and 74 voluntary departures) are removed or depart voluntarily. European legislation generally sets higher thresholds for deporting EEA nationals than exist for other foreign nationals.
Croatia is expected to join the European Union (EU) on 1 July 2013. Transitional arrangements will be introduced to restrict Croatian nationals’ access to the UK labour market. Find out more, including the Home Office Statement of Intent relating to Croatian accession to the EU.
17. About this release
The Immigration Statistics quarterly release gives an overview of the work of the UK Border Agency and Border Force. It helps inform users including the Government, Parliament, the media and the wider public, and supports the development and monitoring of policy.
The release includes the following topic briefings: (cross-cutting) Work, Study, Family, (single topic) Before Entry, Admissions, Extensions, Settlement, Citizenship, Asylum (in three parts), Removals and Voluntary Departures, Detention and the European Economic Area. Detailed tables of figures accompany each of the topic briefings, providing data up to the third quarter of 2012 (July to September).
The Immigration Statistics release is a National Statistics output produced to the highest professional standards and free from political interference. It has been produced by statisticians working in the Home Office Statistics Unit in accordance with the Home Office’s ‘Statement of compliance with the Code of Practice for Official Statistics’ which covers our policy on revisions and other matters. The governance arrangements in the Home Office for statistics were strengthened on 1 April 2008 to place the statistical teams under the direct line management of a Chief Statistician, who reports to the National Statistician with respect to all professional statistical matters.
17.1 Changes to topic briefings and tables
There have been the following changes to the following topic briefings and tables in this release:
| Study, Before Entry | New figures and tables have been included based on data from the UKBA Sponsor Management System within the Before Entry and Study topic briefings (cs.01 to cs.10.q). Tables include numbers of sponsored educational institutions on the UKBA register and use of Confirmations of Acceptance for Studies (used in applications for study-related visas and extensions). |
| Asylum | The Removal and Voluntary Departure categories used in the Asylum Cohort table (as.06) have been made consistent with those used in the Removals and Voluntary Departures topic briefing. Tables of figures by nationality have been updated to separate out figures for those designated as ‘Stateless’ and ‘Refugees’. |
| Removals and voluntary departures | Historical data back to 2004 has been revised to use the new categorisation for Enforced Removals and Voluntary Departures (rv.01 to rv.08.q). |
17.2 Revisions to data
There have been revisions to historical numbers of asylum seekers pending an initial decision or an outcome from an appeal in table as.02 (2010 and the fourth quarter of 2010), correcting a computational error. The 2010 annual total for numbers pending has been revised from 15,917 to 14,881, a decrease of 7%.
There has been a correction to historical numbers of withdrawn applications from Unaccompanied Asylum Seeking Children (UASC) in tables’ as.09 and as.09.q, following a computational error. Figures for 2006-2008 contained figures for 2009 and should have been shown as not available.
Data for 2011 for approvals under the Sector Based Scheme (SBS) and under the Seasonal Agricultural Workers Scheme (SAWS) has been revised as a result of corrections to the fourth quarter of 2011 data in tables ee.01 and ee.01.q. Annual totals have been revised to 787 and 20,035, increases of 31% and 1% compared with 2010 (previously shown as 822 and 20,456, increases of 37% and 3% - see EEA topic briefing).
National Statistics Assessment
In autumn 2011, the UK Statistics Authority (UKSA) assessed Immigration Statistics against the Code of Practice for Official Statistics, as part of its routine programme of assessments. The assessment report was published on 2 February 2012, and, subject to meeting the report’s five requirements, this release will be re-designated by the Authority as National Statistics. More information on National Statistics and the Code of Practice for Official Statistics can be found on the UK Statistics Authority website.
The formal requirements of the assessment report broadly relate to improving and clarifying information about data sources, data quality and revisions to data, improving interpretability and clarifying the status of data that were previously labelled as management information.
Following improvements made in the May 2012 and August 2012 editions, UKSA have written to Home Office’s Chief Statistician confirming the designation of Immigration Statistics as National Statistics.
17.3 Future changes
The following changes are planned for the future, subject to data quality and available resources:
- improvement to and updating of figures on Unaccompanied Asylum-Seeking Children (UASCs) and age-disputed cases to ensure that those whose age dispute case has been fully resolved are counted.
- Addition of back data for tables giving entry clearance visas issued by category and country of nationality (tables be.06.w, be.06.s, be.06.f, be.06.d, be.06.o).
17.4 Communications
An email distribution list is available to allow communication between users and producers of migration statistics throughout the year.
Specifically, this is a forum for discussion of migration statistics that allows users to discuss their need for and use of the data and for producers to consult on presentation and changes. The main focus will be on figures for the United Kingdom, but this would not exclude discussion of migration statistics for other countries. Home Office Statistics intends to use this list for communication with users, including data and release developments.
If you wish to join the list, please follow these instructions:
https://www.jiscmail.ac.uk/cgi-bin/wa.exe?SUBED1=MIGRATION-STATS
17.5 User conference
A one-day migration statistics user conference was held on the 18th September 2012 from which Home Office Statistics and other speakers received positive feedback. The conference programme included speakers from Home Office Statistics, the Office for National Statistics and users of the statistics. The presentations from the event are available via the JISCmail list (see above).
Expressions of interest from those willing to help with planning discussions for next year’s event (provisionally scheduled for 17th September 2013), should be made via e-mail to MigrationStatsEnquiries@homeoffice.gov.uk.
Further information and feedback
If you have any questions or comments about this release, please send an email to MigrationStatsEnquiries@homeoffice.gov.uk or write to
The Editor, Immigration Statistics
Migration Statistics
Home Office Statistics
17th Floor Lunar House
40 Wellesley Road
Croydon CR9 2BY
Press enquiries should be made to:
Home Office Press Office
Peel Building
2 Marsham Street
London SW1P 4DF
Telephone: 020 7035 3535
The Home Office Responsible Statistician is David Blunt, Chief Statistician and Head of Profession for Statistics.