Immigration statistics, April to June 2014
Updated 29 August 2014

© Crown copyright 2014
This publication is licensed under the terms of the Open Government Licence v3.0 except where otherwise stated. To view this licence, visit nationalarchives.gov.uk/doc/open-government-licence/version/3 or write to the Information Policy Team, The National Archives, Kew, London TW9 4DU, or email: psi@nationalarchives.gov.uk.
Where we have identified any third party copyright information you will need to obtain permission from the copyright holders concerned.
This publication is available at https://www.gov.uk/government/statistics/immigration-statistics-april-to-june-2014/immigration-statistics-april-to-june-2014
This release presents the latest immigration statistics from Home Office administrative sources, covering the period up to the end of June 2014.
This is not the latest release. View latest release.
Valid: 28 August 2014 to 26 November 2014
1. Summary points: April to June 2014
All data below relate to the year ending June 2014 and all comparisons are with the year ending June 2013, unless indicated otherwise.
1.1 Key points from the latest release
Work
There were 10% more work-related visas granted (up 14,799 to 159,302), largely accounted for by higher numbers for skilled workers (Tier 2, +11,744), and for Youth mobility and temporary workers (Tier 5, +3,992), partially offset by fewer visas granted for high value workers (Tier 1) which fell by 2,090. The 2,090 fall for high value workers (Tier 1) was accounted for by fewer visas in the 2 categories that have now been closed to new entrants: Tier 1 Post-Study (-2,292) and Tier 1 General (-1,283), and partially offset by increases for the Tier 1 Entrepreneur (+836) and Tier 1 Investor (+484) categories.
There were 37% fewer work-related extensions (down to 92,075) also largely due to the closure of Tier 1 Post-Study and Tier 1 General; and 20% fewer permissions to stay permanently (down to 48,492). Work-related admissions data follow a similar trend to visas data and were 10% higher in 2013 than 2012 (up 13,800 to 156,300).
Study
Study-related visas (excluding student visitors) granted have risen 7% (+13,885 to 218,295). The 13,885 increase includes higher numbers for Chinese (+3,979, +7%), Brazilian (+2,649, +115%), Malaysian (+1,852, +23%) and Libyan (+1,550, +64%) nationals. There were falls in study visas granted to Pakistani (-2,511, -35%) and Indian (-1,711, -12%) nationals.
The higher numbers of visas granted corresponded to a 5% increase in university sponsored study visa applications (main applicants) to 167,105. There were falls in applications sponsored by other education sectors. The sponsored applications figures for further education fell 25% to 19,806, English Language schools fell 4% to 3,290 and independent schools fell 5% to 13,091.
Student visitors
There was an 8% increase in student visitor visas granted, to 78,109. Student visitors are normally only allowed to stay for up to 6 months (11 months for English Language schools) and cannot extend their stay. However, the latest data on passenger arrivals, including the majority of student visitors who do not need a visa, showed a fall of 12% in student visitor arrivals (falling 36,100 to 263,000 in 2013).
Asylum
There were 23,479 asylum applications (main applicants), similar to the previous 12 months (23,523), but low relative to the peak in 2002 (84,132). The largest numbers of applications were from Pakistani (3,081), Eritrean (2,115), Iranian (2,041) and Syrian (1,716) nationals.
Visitors
There were 1.91 million (1,907,845) visitor visas granted, an increase of 5% (+99,063). The 99,063 increase was largely accounted for by higher numbers for Chinese (+63,090 or +26%), Kuwaiti (+20,145, +29%) and Saudi Arabian (+14,001, +17%) nationals. By contrast, the largest falls were for nationals of South Africa (-8,897, -10%), United Arab Emirates (-8,565, -27%), Qatar (-5,613, -27%), Russia (-5,008, -3%) and Oman (-4,449, -46%). The falls for United Arab Emirates, Qatari and Omani nationals are likely to reflect the introduction of the Electronic Visa Waiver on 1st January 2014, allowing these countries’ nationals to visit the UK for up to six months without a visa.
The latest data on non-EEA visitors arriving at the UK border, including those who do not need a visa, showed a 13% increase; from 7.7 million in 2012 to 8.7 million in 2013.
1.2 Other points to note
Admissions and refusals at port
There were 110.1 million journeys to the UK, a 2% increase (up 1.8 million). This was accounted for by 0.6 million more journeys by British, other EEA and Swiss nationals (totalling 95.8 million) and 1.2 million more journeys by non-EEA nationals (14.3 million).
The number of passengers refused entry at port rose by 6% to 16,886.
Family
There were 6% more family visas granted (35,762 in the year ending June 2014). Family-related grants to stay permanently fell by 32% to 41,022 continuing the overall downward trend since the year ending March 2010 (75,852).
Extensions
There were 12% fewer (-35,997) grants of extensions, falling to 255,812 grants, accounted for by 37% fewer work-related grants (-53,819), 6% fewer study-related grants of extensions (-6,101) and partially offset by 21% more family-related grants (+6,420).
The fall in work related extensions was accounted for by lower numbers in the Tier 1 General and the Post-Study work categories, both closed to new entrants, slightly offset by increases in Tier 1 Entrepreneur and Tier 2 Skilled worker categories. The increase in family-related extensions was explained by an increase in the new Family Life (10-year) category from 10,163 to 19,398 which was partly offset by a fall for spouses from 20,491 to 17,717.
Permission to stay permanently (settlement)
There were 24% fewer (-36,434) grants of permission to stay permanently (settlement), falling to 117,737, accounted for by falls in work-related (-12,495), family-related (-19,261) and asylum-related grants (-7,167), slightly offset by an increase in grants for other reasons (+2,489).
Detention
The number of people entering detention fell 2% to 29,124. There was a decline, continuing a long term trend, in the proportion of detainees being removed, from 59% in the year ending June 2013 to 56% in the year ending June 2014. There was an increase in the proportion of detainees granted temporary admission or release from 34% to 36% over the same period.
As at the end of June 2014, 3,079 people were in detention, 2% fewer than 12 months earlier (3,142).
In the second quarter of 2014 (April to June), 19 children entered detention in immigration removal centres, short-term holding facilities and pre-departure accommodation, which, together with the figures for the first quarters of 2011 and 2014, is the lowest in the series.
Removals and Voluntary Departures
There were 12% fewer (-1,744) enforced removals from the UK in the year ending June 2014 (12,415), the lowest figure since the series began in 2004.
However there was a much larger, 3,940 increase (+12%) in total voluntary departures, to 37,216. Over the same period the number of passengers refused entry at port and who subsequently departed increased by 3% (+424) to 14,671.
Further, more detailed, analysis can be found below.
2. Data tables
Listing of the data tables included in ‘Immigration statistics, April to June 2014’.
3. Work
Valid: 28 August 2014 to 26 November 2014
3.1 Introduction
This section includes figures on work-related visas granted, passenger arrivals, extensions granted and permissions to stay permanently (settlement) for non-EEA nationals. It also includes figures on long-term immigration to work (i.e. those intending to stay for at least 12 months for work) for non-EU nationals.
This section also includes data previously included in the European Economic Area (EEA) topic, including for Croatian nationals for whom transitional restrictions on their employment remain in place (corresponding arrangements for Bulgarian and Romanian nationals ended on 31 December 2013).
Data include dependants unless stated otherwise.
3.2 Key facts
In the year ending June 2014, there were 10% more work-related visas granted (up 14,799 to 159,302), 37% fewer extensions (down to 92,075) and 20% fewer permissions to stay permanently (down to 48,492) compared with the previous 12 months. Work-related admissions data follow a similar trend to visas data and were 10% higher in 2013 than 2012 (up 13,800 to 156,300).
In the year ending March 2014, there were an estimated 48,000 non-EU long-term immigrants for work, excluding dependants (up 9% from the previous 12 months) based on survey estimates from the International Passenger Survey (IPS).
The 14,799 increase in work-related visas was largely accounted for by higher numbers for skilled workers (Tier 2, +11,744), and for Youth mobility and temporary workers (Tier 5, +3,992), partially offset by fewer visas granted for high value workers (Tier 1) which fell by 2,090. The 2,090 fall for high value workers (Tier 1) was accounted for by fewer visas in the 2 categories that have now been closed to new entrants: Tier 1 Post-Study (-2,292) and Tier 1 General (-1,283), and partially offset by increases for the Tier 1 Entrepreneur (+836) and Tier 1 Investor (+484) categories.
The 37% (-53,819) fall in work-related extensions was accounted for by lower numbers in the Tier 1 General and the Post-Study work categories, both closed to new entrants, and slightly offset by increases in Tier 1 Entrepreneur and Tier 2 Skilled worker categories. Further information is given in the Extensions topic.
In the 12 months since the accession of Croatia on 1 July 2013, 558 applications were received from Croatians for either authorisation to work or for a registration certificate confirming that the applicant was exercising a right to reside in the UK.
In the year ending June 2014, there were 50,619 skilled worker (Tier 2) sponsored visa applications (main applicants), an increase of 16%. The majority of applications were for the Information and Communication (21,893), Professional, Scientific and Technical Activities (9,304), and Financial and Insurance Activities (6,064) sectors.
Work immigration: latest trends
| Year ending June 2013 | Year ending June 2014 | Change | Percentage change | |
|---|---|---|---|---|
| Work-related visas issued | 144,503 | 159,302 | +14,799 | +10% |
| of which: | ||||
| High value (Tier 1) visas | 12,409 | 10,319 | -2,090 | -17% |
| Skilled (Tier 2) visas | 72,905 | 84,649 | +11,744 | +16% |
| Youth mobility and temporary workers (Tier 5) visas | 38,397 | 42,389 | +3,992 | +10% |
| Non-PBS/Other work visas | 20,792 | 21,945 | +1,153 | +6% |
| Year ending March 2013 | Year ending March 2014 | Change | Percentage change | |
| Long-term immigration for work (1), excluding dependants | 44,000 | 48,000 | +4,000 | +9% |
Table notes
Source: Home Office, Immigration Statistics April to June 2014 Visas table vi 04 q, International Passenger Survey, Office for National Statistics Migration.
(1) Immigration for work data are estimates of the number of non-EU nationals intending to change their residence to the UK for at least 12 months based on the International Passenger Survey.
3.3 Long-term trends in work-related immigration
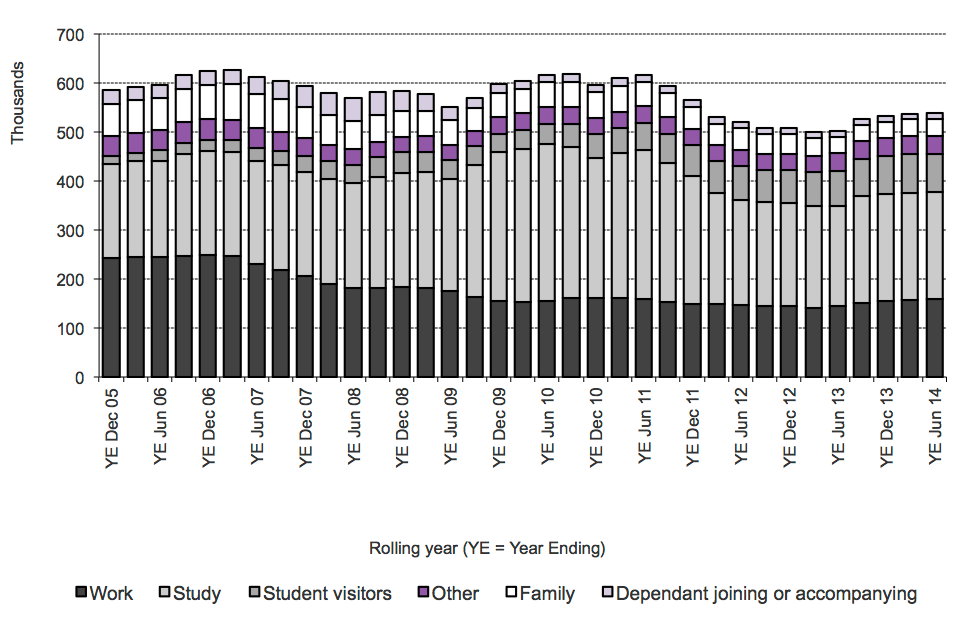
There have been falls in work-related visas granted, admissions and non-EU immigration from 2006 to 2012 and increases more recently (and falls in extensions related to the previous closure of the Tier 1 General and Tier 1 Post Study categories to new applicants: see Extensions topic).
The chart below shows that International Passenger Survey (IPS) estimates of non-EU immigration are substantially lower than work-related visas and admissions. However, the IPS estimates follow a broadly similar trend with falls from 2006. Two reasons why IPS estimates of immigrants for work are lower than figures for work visas granted or passenger arrivals are that the IPS figures exclude any workers who intend to stay for less than a year and exclude dependants. There has been analysis showing that in recent years the number of visas under 1 year duration has increased whilst longer term visas have fallen, see short article ‘Entry clearance visas by length’. Visa length is not the same as the IPS intended length of stay and may be driven by different factors which may account in part for different trends).
Despite the general trend being similar, there are instances where the trends in visas granted, admissions and IPS estimates occasionally diverge. This apparent discrepancy is in part due to the potential for a margin of error that is inherent in sample surveys, together with possible changes in the proportion intending to stay for more than a year and the time difference between a visa being granted and the individual arriving.
Further reasons are described in the user guide. The chart below also shows trends in extensions and permanent stay (settlement) for work reasons.
Long-term trends in work-related immigration
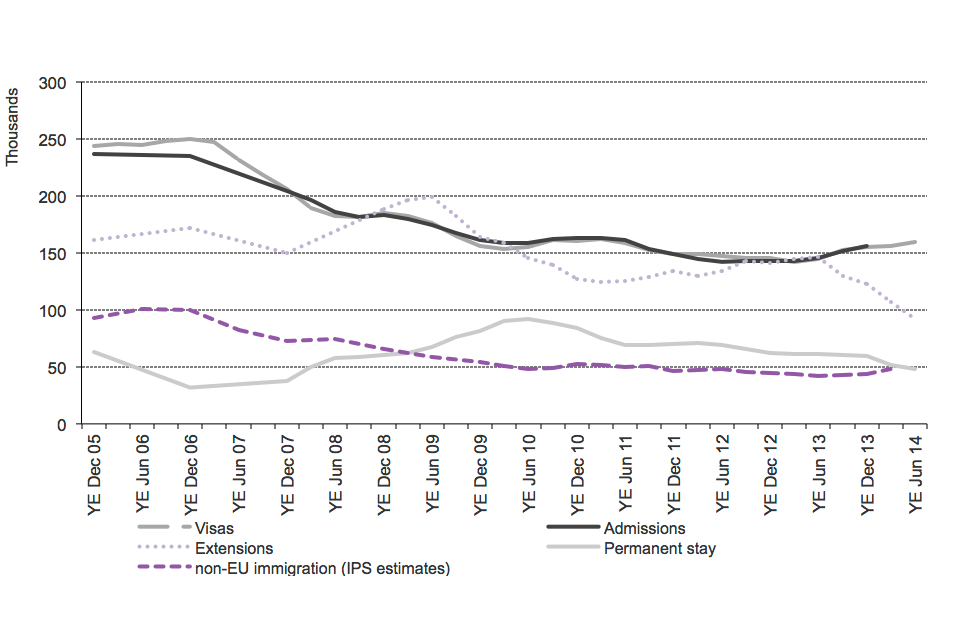
The chart shows the trends for work of visas granted, admissions and International Passenger Survey (IPS) estimates of non-EU immigration, extensions and work-related permissions to stay permanently (settlement) between the year ending December 2005 and
Chart notes
Source: Home Office, Immigration Statistics April to June 2014, Visas tables vi 04 q (Visas volume 1), Admissions table ad 02 q, Extensions table ex 01 q and Settlement table se 02 q; Office for National Statistics Migration.
3.4 Work-related immigration by nationality
Admissions data include both those individuals who require a visa to enter the UK and those who in some circumstances do not (for periods of up to 6 months), known as ‘non-visa nationals’. Work-related admissions data are included in Admissions tables ad 02 to ad 03 and ad 03 w.
For both work-related visas and admissions, the 3 nationalities accounting for the highest numbers were Indian, United States and Australian. In 2013, the top 10 nationalities were the same for both series, apart from a difference in the order. Some of the differences in the ranking between visas and admissions data for 2013 may be due to timing differences; for example, some visas granted in 2012 may be used in 2013. Additionally, some individuals admitted within the Creative and Sporting category (part of Tier 5) do not need a visa. This largely explains the higher number of admissions (estimated at 30,000) of United States nationals compared with the lower numbers of United States nationals granted a visa (14,955).
Top 10 nationalities granted work-related visas, 2013
(Total 154,760)
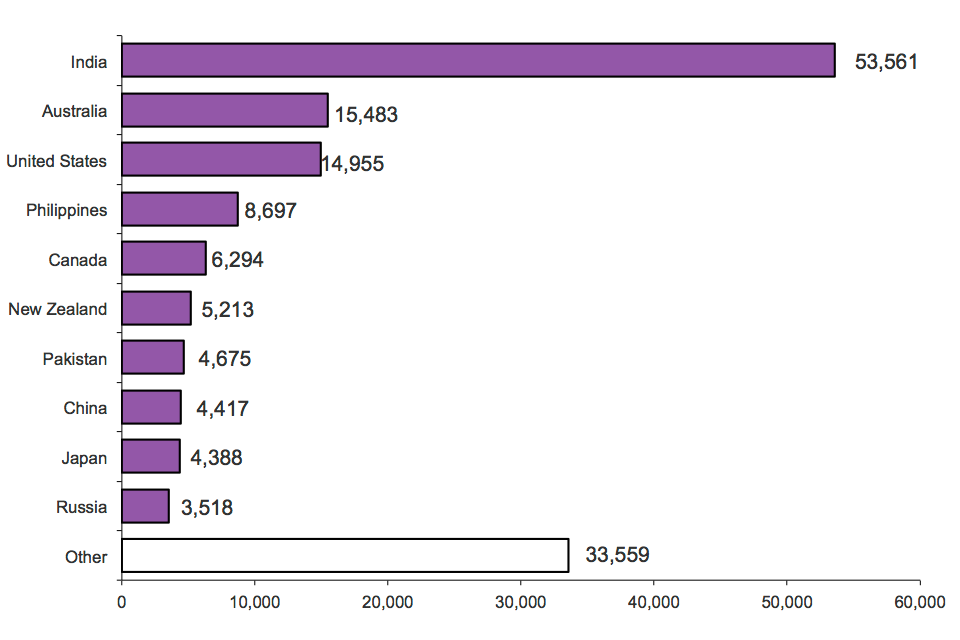
The chart shows work-related visas granted by nationality in 2013. The chart is based on data in Table vi 06 q w.
Chart notes
Source: Home Office, Immigration Statistics April–June 2014, Visas table vi 06 q w.
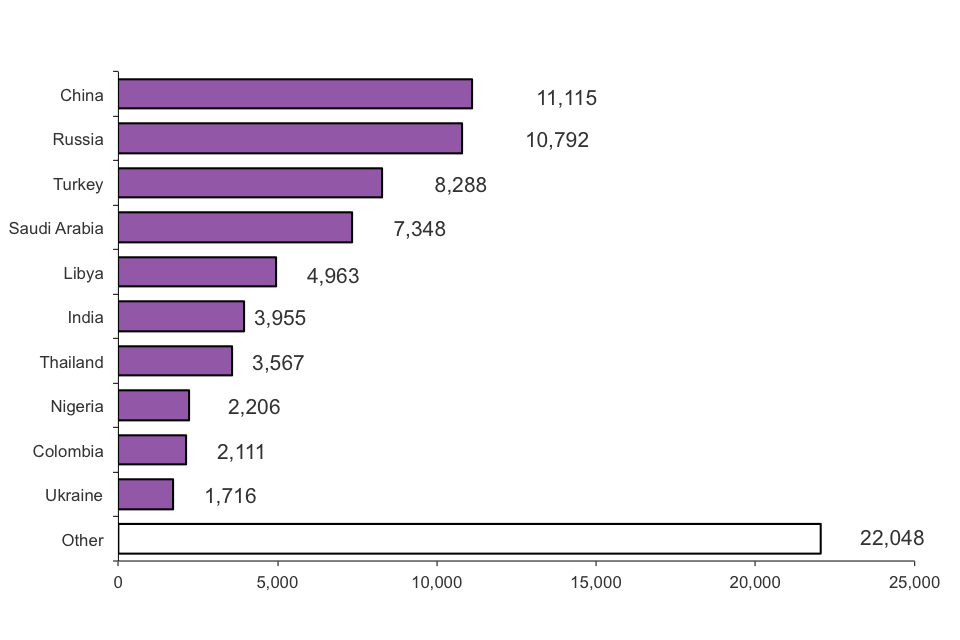
For 2013 data, the latest available admissions data by nationality, the nationality breakdown for those granted extensions for work (see chart below) is in some respects different from the top 10 nationality rankings for admissions and for visas. Nigerian, Turkish, Sri Lankan and Bangladeshi nationals accounted for the sixth, seventh, eighth and tenth highest number of extensions for work, respectively, while not appearing in the top 10 for visa grants or admissions.
Part of the explanation for the difference in the nationality breakdowns is that Turkish nationals have special provision to switch into the ‘work route’ under the European Community Association Agreement with Turkey.
Top 10 nationalities granted an extension to stay for work, 2013
(Total 72,944, excludes dependants)
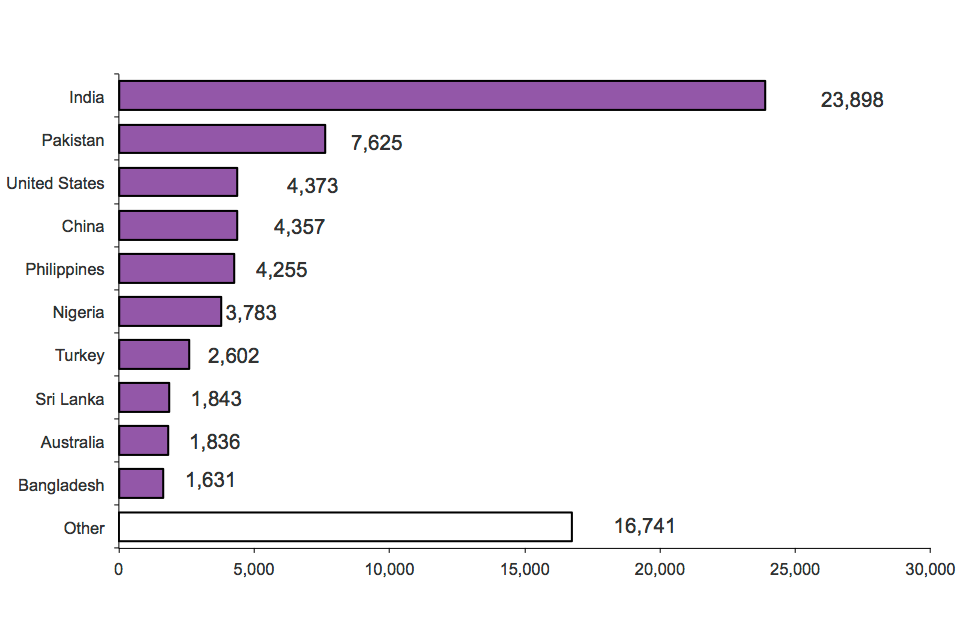
The chart shows grants of extension of stay by nationality in 2013. The chart is based on data in Table ex 02 w.
Chart notes
Source: Home Office, Immigration Statistics April to June 2014, Extensions table ex 02 w.
3.5 Permission to stay permanently (Settlement)
Some individuals who are admitted to the UK to work can become eligible to stay permanently after 5 years.
Work-related grants to stay permanently fell by 20% (down to 48,492) in the year ending June 2014, continuing earlier falls from 92,176 in the year ending June 2010 (see chart on long-term trends above). Before 2010, there had been a broadly rising trend in work-related grants of settlement that had partly reflected an increase in the number of people admitted in work categories 5 years earlier. The dip in the number of work-related grants in 2006 and 2007 reflects a change in the qualifying period from 4 to 5 years, delaying grants that would otherwise have occurred earlier.
The nationality profile for grants of permission to stay permanently in 2013, the latest available data by nationality, differs slightly to the profile for grants of work visas in 2013, with 7 of the top 10 nationalities also in the top 10 nationalities granted visas for work. A notable difference was South Africa, ranked second for permission to stay permanently, but not seen in the top 10 for visas. From detailed data in Settlement table se 03, the most common of the qualifying categories for South Africans was ‘Commonwealth citizens with a United Kingdom born grandparent taking or seeking employment’ (accounting for 1,445 of the 2,806 work-related grants to stay permanently).
3.6 Work-related sponsored visa applications
(Tier 2 skilled workers and Tier 5 Youth mobility and temporary workers)
As part of the application process for visas and extensions for work reasons, main applicants must obtain a certificate of sponsorship from an employer. Sponsorship tables cs 01 q to cs 06 q provide data on the number of employers registered and their sponsor rating, the nationality of main applicants, and the corresponding numbers of main applicants for different industry sectors.
Register of sponsors
An employer may be counted more than once in the total if registered separately to sponsor both Tier 2 and Tier 5 individuals or registered for more than 1 sub-Tier. Altogether there were 28,302 employers on the register on 30 June 2014, 6% more than on 1 July 2013 (26,627).
Skilled individuals (Tier 2)
There were 16% more sponsored visa applications (main applicants) from skilled individuals in the year ending June 2014 compared with the previous year (from 43,484 to 50,619). The majority of the 50,619 certificates used related to the following sectors:
Information and Communication (21,893, up 19%),
Professional, Scientific and Technical Activities (9,304, up 21%),
Financial and Insurance Activities (6,064, up 9%),
Education (2,580, up 8%),
Human Health and Social Work Activities (2,534, up 41%),
Manufacturing (2,516, up 1%).
In the same period there were 2% more sponsored extension applications (main applicants) from skilled individuals compared with the previous year (from 33,265 to 33,857). The majority of the certificates related to the following sectors:
Information and Communication (6,445, down 6%),
Human Health and Social Work Activities (5,677, down 6%),
Professional, Scientific and Technical Activities (5,067, up 9%),
Education (3,767, down 2%),
Financial and Insurance Activities (3,641, up 5%).
Youth mobility and temporary workers (Tier 5)
There were 8% more sponsored visa applications (main applicants) from Youth mobility and temporary workers in the year ending June 2014 compared with the previous year (from 41,207 to 44,575). The large majority of these 44,575 certificates related to the Arts, Entertainment and Recreation (32,122, up 8%) and Education (4,787, up 14%) sectors. There were a total of 581 sponsored applications for extensions for Tier 5, the relatively small numbers reflecting the rules relating to extensions for such workers.
3.7 Croatia
In the 12 months since accession on 1 July 2013, 558 applications were received from Croatians either for authorisation to work (i.e. for an accession registration certificate) or for a registration certificate confirming that the applicant was exercising a right to reside on a basis other than authorised employment. Of these, 234 were for accession worker registration certificates and 324 were for other registration certificates. As at 9 July 2014, 190 of the accession worker registration certificate applications and 275 other registration certificates had been approved.
3.8 ‘EU2’ countries: Bulgaria and Romania
Applications for accession worker cards, required until 31 December 2013 by Bulgarians and Romanians to work in the UK as an employee, and for registration certificates that provide proof of residency rights, fell in 2013, with falls of 22% to 1,905 and 39% to 17,175, respectively. The corresponding data on approvals show falls of 15% to 1,526 and 42% to 13,064. Applications for accession worker cards and registration certificates followed a downward trend since 2011.
European Economic Area data tables ee 01 and ee 01 q show a complete breakdown of decisions by type in applications for EU2 accession worker cards and registration certificates between 2007 and 2013 along with cases outstanding as at 7 July 2014.
3.9 Staying in the UK
The Migrant Journey Fourth Report reported that 33% of migrants granted with skilled work visas (with a potential path to settlement) in 2007 appear to have legally remained in the immigration system (9%) or have been granted permission to stay permanently (settlement) in the UK (25%) after 5 years (percentages may not sum to totals due to rounding).
The 33% of migrants granted with skilled work visas in the 2007 cohort who appear to have legally remained in the immigration system or have been granted permission to stay permanently after 5 years was a fall from 46% of such migrants in the 2004 cohort.
For people granted a skilled worker’s visa in 2004, 31% had gained settlement 5 years later, and a further 16% still had valid leave to remain in the UK.
Comparison of the 2004 cohort to the 3 subsequent cohorts indicates that there has been a rise in the proportion of people whose leave had expired after 5 years, from 54% in 2004 to 67% in 2007. This is reflected in the fall in the proportion of people from these cohorts who had valid leave to remain after 5 years, from 16% in 2004 to 9% in 2007. Some of this difference may be due to the increasing influence of the economic recession over the period analysed, which may have reduced the likelihood of some migrants in the later cohorts choosing to remain longer.
The proportion of skilled non-EEA workers who gained settlement after 5 years was similar for 2004, 2005 and 2006 (31%, 32% and 30% respectively) but was lower for the 2007 cohort (25%). Of the people granted a skilled worker’s visa in 2007, 38% had expired leave after 2 years.
Source: Home Office, Migrant Journey Fourth Report.
3.10 Data tables
Data on immigration for work, sourced from Home Office administrative systems, can be found in the following tables:
- Sponsorship: (tables cs 01 q to cs 06 q)
- Visas: vol. 1 to 3 (tables vi 01 q to vi 04 q and vi 06 q w)
- Admissions (tables ad 01 to ad 03 and ad 03 w)
- Extensions (tables ex 01 to ex 02)
- Settlement (tables se 01 to se 03)
- European Economic Area (tables ee 01, ee 01 q and ee 02)
4. Study
Valid: 28 August 2014 to 26 November 2014
4.1 Introduction
This section includes data for study-related visas granted to non-EEA nationals outside the UK, including trends in applications for different education sectors, and non-EU nationals’ long-term immigration to study (i.e. those intending to stay for at least 12 months to study). It also includes data on study-related passenger arrivals (number of journeys) and extensions of stay in the UK for study.
4.2 Key facts
Study-related visas granted have risen 7% in the year ending June 2014 (+13,885 to 218,295) compared with the previous 12 months.
In the year ending June 2014 there was a 5% increase in study visa applications (main applicants) sponsored by the university sector (to 167,105) and falls for other sectors.
Non-EU long-term immigration for study (main applicants) fell by 6% (to 124,000) in the year ending March 2014, compared with the previous 12 months (132,000).
The 13,885 increase in study-related visas granted (excluding student visitors) includes higher numbers for Chinese (+3,979, +7%), Brazilian (+2,649, +115%), Malaysian (+1,852, +23%) and Libyan (+1,550, +64%) nationals. There were falls in study visas granted to Pakistani (-2,511, -35%) and Indian (-1,711, -12%) nationals.
There was also an 8% increase in student visitor visas granted, to 78,109 in the year ending June 2014. Student visitors are normally only allowed to stay for up to 6 months (11 months for English Language schools) and cannot extend their stay.
Study immigration: latest trends
| Year ending June 2013 | Year ending June 2014 | Change: latest 12 months | Percentage change | |
|---|---|---|---|---|
| Study-related visas issued (excl. Student visitors) | 204,410 | 218,295 | +13,885 | +7% |
| of which: | ||||
| General student (Tier 4) | 193,319 | 206,206 | +12,887 | +7% |
| Child student (Tier 4) | 11,015 | 12,015 | +1,000 | +9% |
| Student visitor visas (main applicants only) | 72,473 | 78,109 | +5,636 | +8% |
| Year ending March 2013 | Year ending March 2014 | Change: latest 12 months | Percentage change | |
| Long-term immigration for study (1), excluding dependants (1) | 132,000 | 124,000 | -8,000 | -6% |
Table notes
Source: Home Office, Immigration Statistics April to June 2014 Visas table vi 04 q, International Passenger Survey (IPS), Office for National Statistics Migration.
(1) Immigration for study data are estimates of the number of non-EU nationals intending to change their residence to the UK for at least 12 months based on the International Passenger Survey.
Long-term trends in student immigration
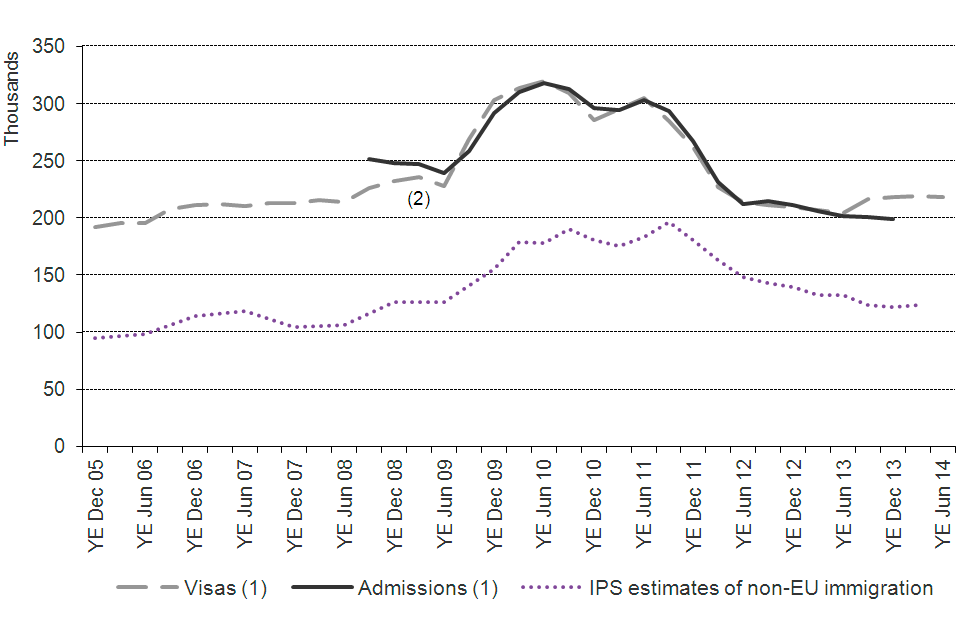
The chart shows the trends of visas granted, admissions and International Passenger Survey (IPS) estimates of non-EU immigration for study between the year ending December 2005 and the latest data published. The data are sourced from Tables vi 04 q and ad
Chart notes
Source: Home Office, Immigration Statistics April to June 2014, Visas tables vi 04 q and Admissions ad 02 q; Office for National Statistics Migration.
(1) Excludes student visitors who are allowed to come to the UK for 6 months (or 11 months if they will be studying an English Language course) and cannot extend their stay.
(2) For periods prior to the year ending September 2008, the count of student admissions is not comparable as there was no specific admissions category for student visitors who may then have been recorded as either students or visitors.
The above chart shows that IPS long-term immigration estimates, while being substantially lower, follow a broadly similar trend to student visas granted and passenger arrivals, with increases in all 3 series during 2009 and decreases after 2011 (and study visas granted increasing more recently). Two of the reasons why IPS estimates of students arriving are lower than figures for student visas granted or passenger arrivals are that the IPS figures exclude the many students who intend to stay for less than a year and dependants of those immigrating for the purposes of study. There has been analysis showing that in recent years the number of visas under 1 year’s duration has increased whilst longer-term visas have fallen, see short article ‘Entry clearance visas by length’. Visa length is not the same as the IPS intended length of stay and may be driven by different factors which may account in part for different trends.
Despite the general trend being similar, there are instances where the trends in visas granted, admissions and IPS estimates occasionally diverge. This apparent discrepancy is in part due to the potential for a margin of error that is inherent in sample surveys, together with possible changes in the proportion intending to stay for more than a year and the time difference between a visa being granted and the individual arriving.
4.3 Latest trends in study visas by nationality
The number of study-related visas granted (excluding student visitors) rose by 7% (+13,885), from 204,410 in the year ending June 2013 to 218,295 in the year ending June 2014. There were notable increases for Chinese (+3,979 or +7%), Brazilian (+2,649 or +115%), Malaysian (+1,852 or +23%) and Libyan (+1,550 or +64%) nationals. The largest falls were for Pakistani (-2,511 or -35%) and Indian (-1,711 or -12%) nationals.
Top 10 nationalities granted study visas (excluding student visitors), year ending June 2014
(Total 218,295)
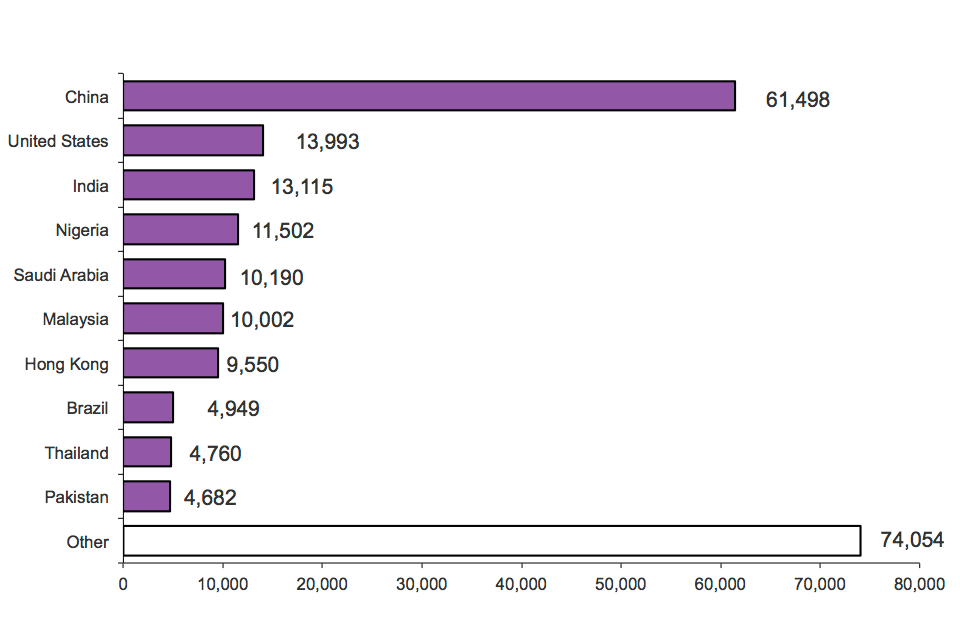
The chart shows visas granted for the purposes of study by nationality for the year ending June 2014. The chart is based on data in Table vi 06 q s.
Chart notes
Source: Home Office, Immigration Statistics April to June 2014, Visas table vi 06 q s.
The top 10 nationalities accounted for two-thirds (66%) of all study visas granted in the year ending June 2014, with the top 5 nationalities (China, United States, India, Nigeria, Saudi Arabia) accounting for over half (51%).
The number of study-related visas granted to Chinese nationals has increased steadily since the year ending December 2005 (18,977) and for the year ending December 2013 was at the highest level recorded (62,532) using comparable data.
By contrast the numbers of study-related visas (excluding student visitors) granted to Indian and Pakistani nationals have fallen since their peaks in the years ending June 2010 (68,238) and June 2011 (42,710) respectively.
4.4 Student visitors
Student visitors are granted with a visa for a maximum of 6 months in duration or in a very small number of cases for 11 months if studying an English Language course. Student visitors are not counted as long-term migrants and cannot extend their stay, so they are not included within the references to study visas in this section.
In the year ending June 2014, 78,109 student visitor visas were granted, 8% more (+5,636) than in the previous 12 months. Most of the 5,636 increase related to African nationals (+2,801) and Asian nationals (+2,409), with the highest increases amongst Libyan (+2,568 or +107%), Chinese (+1,651 or +17%), Thai (+1,019 or +40%), Saudi Arabian (+512 or +7%) and Venezuelan (+391 or +123%) nationals. The largest falls were for Russian (-425 or -4%) and Omani (-453 or -34%) nationals.
The number of visas granted to student visitors has increased steadily since the category was introduced in September 2007.
The increases in study (+64%) and student visitor visas (+107%) granted to Libyans follow a previous drop due to civil unrest in Libya.
Top 10 nationalities granted student visitor visas, year ending June 2014
(Total 78,109, main applicants only)
The chart shows student visitor visas granted by nationality for year ending June 2014. The chart is based on data in Table vi 06 q s.
Chart notes
Source: Home Office, Immigration Statistics April to June 2014, Visas table vi 06 q s.
The top 10 nationalities in the chart above accounted for over two-thirds (72%) of the 78,109 student visitor visas granted in the year ending June 2014.
There were 263,000 student visitor admissions in the calendar year 2013, much higher than student visitor visas granted (77,601 over the same period). This is largely due to many of the top 10 nationalities for student visitor admissions being non-visa nationalities (including the United States and Brazil). Such nationals do not need to obtain a visa if they wish to come to the UK as a student visitor for up to 6 months and so are included in the admissions data but not the visas data.
4.5 Admissions
There were 6% fewer (-12,100) study-related admissions (excluding student visitors) in the calendar year 2013 (199,000) than in 2012 (211,000).
4.6 Immigration for study
In the year ending March 2014, there were an estimated 124,000 non-EU long-term study-related migrants, 6% fewer than in the previous 12 months (132,000).
Source: ONS, Long-Term International Migration.
4.7 Extensions of stay
There were 94,356 study-related grants of extensions, 6% lower (-6,101) in the year ending June 2014 than in the year ending June 2013. This followed a 26% fall from 135,947 in the year ending June 2011 to 100,457 in the year ending June 2013.
The study-related grants of extensions include 755 grants under the new Tier 4 Doctorate Extension Scheme, introduced on 6 April 2013.
Note that student visitors are normally only allowed to stay for up to 6 months (11 months for English Language schools) and cannot extend their stay.
4.8 Study-related sponsored visa applications (students (Tier 4))
On 30 June 2014 there were 1,607 educational institutions on the UK Visas and Immigration register of sponsoring educational institutions. This was 4% lower than the number on 1 April 2014 (1,681), and 7% lower than a year earlier (1 July 2013, 1,724) which continues the falls seen since the published series began in October 2011 (2,370).
The decrease in the number of sponsoring educational institutions is consistent with the introduction of new accreditation criteria and conditions of status for educational sponsors from April 2011.
Study-related sponsored visa applications by sector
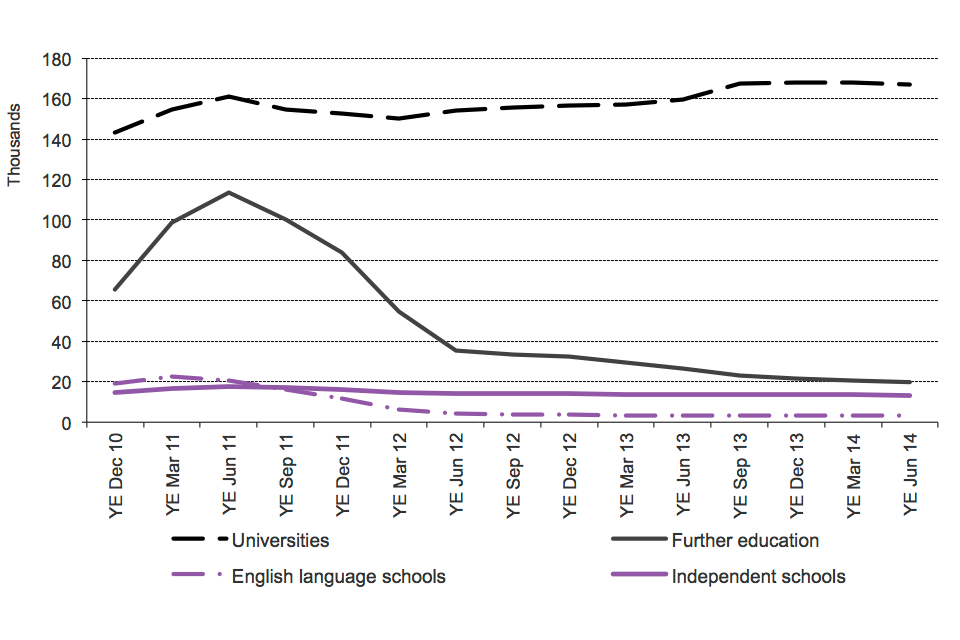
The chart shows the trends in confirmations of acceptance of studies used in applications for visas by education sector since 2010 to the latest data available. The chart is based on data in Table cs 09 q.
Chart notes
Source: Home Office, Immigration Statistics April–June 2014, Sponsorship table cs 09 q.
“Universities” relate to UK-based Higher Education Institutions.
“Further education” relates to tertiary, further education or other colleges.
The number of study-related sponsored visa applications (main applicants) was similar in the year ending June 2014 (206,726) compared to the previous 12 months (206,870). This included different trends for different sectors. In particular there was a 5% rise in sponsored visa applications for the university sector (to 167,105), and falls in the further education sector (to 19,806, -25%), English Language schools (to 3,290, -4%) and independent schools (to 13,091, -5%).
There were 87,535 sponsored applications for extensions (main applicants) in the year ending June 2014, 4% fewer than in the previous 12 months, but, again, the change was not uniform across the education sectors. There were 9% more sponsored applications for extensions in the university sector (to 58,134), and falls in the further education sector (to 25,137, -23%), English Language schools (to 828, - 42%) and independent schools (to 1,714, -29%).
4.9 Staying in the UK
The Migrant Journey Fourth Report reported that 15% of migrants granted student visas in 2007 appear to have legally remained in the immigration system or settled in the UK after 5 years. After 5 years 14% had some form of valid leave to remain and 1% had been granted permission to stay permanently (settlement).
Comparison of the 4 cohort years suggests that there has been a sizable fall in the proportion of student migrants who still had valid leave to remain in the UK 5 years after their arrival, or who had achieved permanent settlement in the UK, from 23% in the 2004 cohort to 15% in the 2007 cohort. This is consistent with the tightening of the Immigration Rules for students since September 2007.
Source: Home Office, Migrant Journey Fourth Report.
4.10 Data tables
Data on student immigration, sourced from Home Office administrative systems, can be found in the following tables:
- Sponsorship: tables cs 07 q to cs 14 q
- Visas vol. 1-3: tables vi 01 q to vi 06 q s
- Admissions: tables ad 02 to ad 03 and ad 03 s
- Extensions: tables ex 01 to ex 02 s
The Office for National Statistics publishes data on student immigration, ONS Migration.
5. Family
Valid: 28 August 2014 to 26 November 2014
5.1 Introduction
The majority of this topic focuses on non-EEA nationals who come to the UK for family reasons. Data on visas, admissions to the UK, extensions of stay, settlement and estimates of immigration to accompany or join others from the International Passenger Survey (IPS) are used to explore immigration for family reasons. The topic also includes information on residence document decisions which covers EEA nationals as well as non-EEA nationals.
There are a number of ways that people can come to the UK for family reasons. The traditional ‘family route’: where people come to join or accompany family members who are either British citizens or settled in the UK, as ‘visitors’: where people come for a short time to visit family members, or as ‘other dependants joining or accompanying’: where people come as dependants of migrants, for example those working or studying in the UK.
The data presented in this topic differentiate between those immigrating to the UK via the ‘family route’ and those coming as ‘other dependants joining or accompanying’ migrants. ‘Visitors’ are excluded from the analysis.
Following a consultation on family migration, a number of changes to the Immigration Rules came into effect in July 2012. Within this analysis it is not possible to separately identify applications made under the previous or new rules. However, it is likely that changes to the Immigration Rules have impacted on the figures. Details of these changes, and more information on the ways that people can come to the UK for family reasons, are included in the family section of the user guide.
5.2 Key facts
In the year ending June 2014, 35,762 family-related visas were granted. This is an increase of 6% compared with the year ending June 2013 (33,710). There was a 7% increase in the number of visas granted to all other dependants (excluding visitor visas) joining or accompanying migrants in the UK (77,489) compared with the previous 12 months (72,239).
The proportion of resolved family-related visa applications that were refused was 25%. This compares with 35% in the previous 12 months.
There were 37,180 extensions of stay for family reasons in the year ending June 2014. Of this total, 19,398 (52%) were granted under the new Family Life (10-year) category and 17,717 (48%) were granted under the spouse category.
Family-related grants to stay permanently fell by 32% to 41,022 from the previous year, continuing the overall downward trend since the year ending March 2010 (75,852). There were notable decreases in grants to spouses (-31% to 34,400).
In the year ending March 2014 (the latest data available), the IPS estimated that 54,000 non-EU nationals immigrated to the UK to accompany or join others, with the intention of staying for a year or more. This is a significant increase in comparison to 37,000 in the year ending March 2013.
Family immigration: latest trends
| Year ending June 2013 | Year ending June 2014 | Change: latest 12 months | Percentage change | |
|---|---|---|---|---|
| Family-related visas granted | 33,710 | 35,762 | +2,052 | +6% |
| of which: | ||||
| Partners | 25,503 | 26,966 | +1,463 | +6% |
| Children | 3,768 | 3,376 | -392 | -10% |
| Other Dependants | 4,439 | 5,420 | +981 | +22% |
| All other dependants (excl. Visitor visas) | 72,239 | 77,489 | +5,250 | +7% |
| Year ending March 2013 | Year ending March 2014 | Change: latest 12 months | Percentage change | |
| Long-term immigration to accompany or join others (1) | 37,000 | 54,000 | +17,000 | +46% |
Table notes
Source: Home Office, Immigration Statistics April to June 2014 Visas table vi 01 q, Office for National Statistics Migration.
(1) Immigration to accompany/join others data are estimates of the number of non-EU nationals intending to change their residence to the UK for at least 12 months based on the International Passenger Survey. Latest 12 months for long-term immigration to accompany or join others data is to the year ending March 2014. Changes are calculated on rounded data.
5.3 Long-term trends in family immigration
IPS estimates of non-EU immigration of those accompanying or joining others in the UK include those arriving on family visas, as well as persons accompanying those who are arriving for other reasons, such as for work or study. In the year ending March 2014, IPS estimates show that 54,000 non-EU nationals immigrated to the UK to accompany or join others.
The chart below shows that IPS estimates of immigration to accompany or join others have followed a broadly similar trend to the total visas granted through the family route and to other dependants, although IPS estimates are substantially lower. A reason for the IPS estimates being substantially lower is that the IPS figures exclude the many people who come to the UK but intend to stay for less than a year; visa figures would include these people (there has been analysis showing that in recent years the number of visas under one year duration has increased, whilst longer-term visas have fallen; see short article ‘Entry clearance visas by length’. Visa length is not the same as the IPS intended length of stay and may be driven by different factors which may account in part for different trends).
These measures of immigration for family reasons/to accompany or join others showed a general downward trend overall since March 2007, albeit with a period of increases around 2010. Visas granted to other dependants have shown a small increase since the year ending June 2013, though not as pronounced as that for the IPS estimates.
The trend for IPS estimates has previously appeared to be broadly similar to figures for family visas alone; however, this is coincidental given that the IPS category includes all migrants intending to stay for a year or more who describe their main reason for migration as to ‘accompany or join’, regardless of the type of visa they hold (so this would tend to include dependants of those arriving as well as dependants who travel subsequent to the main applicant).
Long-term trends in family immigration
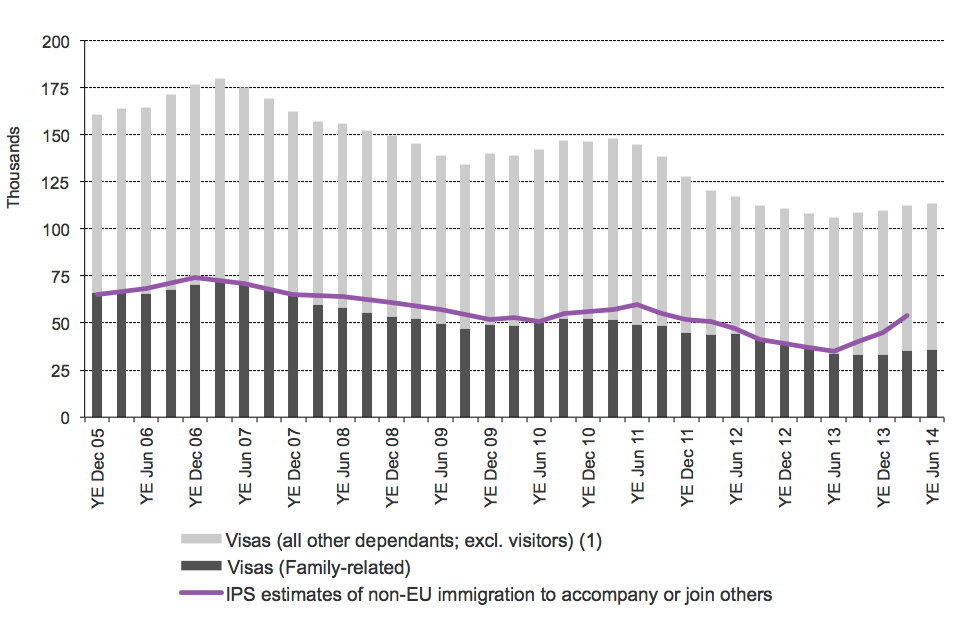
The chart shows the trends in visas granted and International Passenger Survey (IPS) estimates of immigration for family reasons/to accompany or join others between the year ending December 2005 and the latest data published. The visa data are sourced fro
Chart notes
Source: Home Office, Immigration Statistics April to June 2014, Visas table vi 04 q; Office for National Statistics Migration.
(1) Includes all dependants (e.g. dependants for work and study), but excludes visitors.
Despite the general trends having been similar, there are instances, visible from the chart above, where the trend in family visas granted and IPS estimates of non-EU immigration to accompany or join others appear to be different (as for the trend since the year ending June 2013). It is possible that such differences can be accounted for by the inherent variability associated with sample surveys. There is also the possibility that people intending to stay in the UK for a year or more, or who are arriving to accompany or join others, do not state this when interviewed for the IPS. It is also expected that there will be a time lag between an application for a visa and the person arriving in the UK, and that this will feature in the IPS estimates.
5.4 Visas
In the year ending June 2014, 35,762 family-related visas were granted. This is an increase of 6% compared with the year ending June 2013 (33,710).
Nationalities with the highest number of visas granted for family reasons in the year ending June 2014 were Pakistan (14%), India (10%), United States (5%), China (4%) and Sri Lanka (4%). Of these nationalities, there were increases for India (+22%), United States (+28%), China (+20%) and Sri Lanka (+12%) and a decrease for Pakistan (-20%) compared with the previous year.
Of the total visas granted for family reasons, 26,966 (75%) were granted to partners, 3,376 (9%) were granted to children and 5,420 (15%) were granted to other dependants. Compared with the year ending June 2013, the number of family visas granted to partners increased by 6%, visas granted to children fell by 10% and visas granted to other dependants increased by 22%.
A visa application is resolved when a visa has been granted, refused or withdrawn, or when an application has lapsed. In the year ending June 2014, 25% of resolved family-related visa applications were refused. This compares with 35% in the previous year.
Other dependants can be granted with a visa to join or accompany migrants who have not been granted the right to stay permanently in the UK. In the year ending June 2014, 77,489 of these visas (excluding visitors) were granted, an increase of 7% compared with the previous 12 months (72,239). Of the 77,489 visas granted, 60% (46,154) were granted to other dependants of workers, 26% (19,956) to other dependants of students and 15% (11,379) to other dependants accompanying or joining a migrant in the UK.
Despite the increase in visas granted to other dependants joining or accompanying migrants (+7%), the level is over a quarter lower than the peak of around 107,000 in the year ending March 2007 (Table vi 01 q). There was a sharp decrease in the number of visas granted to dependants coming to the UK between the year ending June 2011 and the year ending December 2012 and this was, in part, consistent with changes to the rules governing visas granted to those coming to the UK for work or study and their dependants, from December 2010 and April 2011 respectively.
5.5 Admissions
Admissions for family reasons fell to 21,000 in 2013 (compared with 27,300 in the previous 12 months), continuing the overall trend since 2006.
5.6 Immigration to accompany or join others
The IPS estimate for non-EU nationals accompanying or coming to join family or friends for a year or more was 54,000 in the year ending March 2014. This is higher than the 37,000 granted in the previous 12 months (+46%; a statistically significant increase).
Source: ONS, Long-Term International Migration.
5.7 Extensions of stay
Statistics on extensions of stay relate to people wishing to extend or change the status of their stay in the UK. One of the ways that people can do this is for family reasons, and main applicants and dependants can apply under fiancé(e), spouse, UK-born children, other relative categories and the new Family Life (10-year) route (where partners and parents who apply in the UK are granted leave to remain on a 10-year route to settlement on the basis of their family life. Further information is given in the Extensions topic).
In the year ending June 2014, there were 37,180 grants of extension for family-related reasons. This is an increase from 30,760 in the previous 12 months, which follows year-on-year decreases in each of the previous 3 years.
Of the 37,180 extensions for family reasons, 19,398 (52%) were granted under the Family Life (10-year) route and 17,717 (48%) were granted under the spouse category. Few extensions of stay were granted under the UK-born children, fiancé or other relative categories.
The increase in the number of grants of extensions of stay for family reasons was accounted for by a rise in grants in the new Family Life (10-year) category, from 10,163 to 19,398. There was a fall in grants to spouses, from 20,491 to 17,717.
As well as an increase in the number of grants of extensions of stay, there has also been an increase in the number of refusals of family-related extensions of stay. Refusals of family-related extensions rose from 7,343 in the year ending June 2013 to 17,684 in the year ending June 2014 (32% of all decisions); 14,967 refusals were under the new Family Life (10-year) route.
Dependants of migrants in other routes, for example workers and students, excluding visitors, can also apply to extend their stay in the UK. In the year ending June 2014, 55,563 extensions were granted to dependants, a decrease of 17,305 (-24%) from the previous 12 months.
Analysis of extensions of stay by previous category shows that the 35,771 extensions granted to main applicants in 2013 for family reasons included 8,108 people previously in the family route (23%), 5,941 former students (17%), and 4,900 previously in the work category (14%).
5.8 Settlement
Family-related grants to stay permanently fell by 32%, to 41,022, in the year ending June 2014. This continues the overall downward trend since the year ending March 2010 (75,852).
The majority of settlement grants were for spouses (34,400; 84%), with the remainder for children (5,679; 14%), parents and grandparents (300; 1%) and other or unspecified dependants (643; 2%).
There were decreases in all the family categories: a 31% fall (-15,717) in grants to spouses, a 20% fall (-1,463) in grants to children, a 74% fall (-866) in grants to parents and grandparents and a 65% fall (-1,215) in grants to other or unspecified dependants.
Family-related grants of settlement have recently fluctuated. Trends in settlement are likely to be influenced by resource availability.
5.9 Staying in the UK
Analysis undertaken for the Migrant Journey Fourth Report showed that 67% of migrants granted family visas in 2007 appear to have legally remained in the immigration system after 5 years. Of these, 3% had some form of valid leave to remain and 64% had achieved settlement. This is an increase from 2004 when 60% of migrants granted family visas appeared to have legally remained in the UK. Source: Home Office, Migrant Journey Fourth Report.
5.10 Residence document decisions
Under European law, EEA nationals do not need to obtain documentation confirming their right of residence in the UK. However, if they want to support an application for a residence card by any of their family members who are not EEA nationals, they must demonstrate that they are residing in the UK in accordance with the Immigration (European Economic Area) Regulations 2006 and are “exercising Treaty rights” in the UK.
There were 102,006 decisions on applications for EEA residence documents in 2013, 22% (18,362) more than in 2012.
Grants of permanent residence cards have shown a generally rising trend between 2007 (7,623) and 2013 (22,463). This may reflect the numbers previously issued registration certificates and registration cards and living in the UK under European regulations for 5 years becoming eligible to apply for permanent residence cards. Since 2010 Poland has been the top nationality granted permanent residence cards (4,212 in 2013), with Romanian and Bulgarian nationals rising to second and third in 2012 and 2013 (2,824 to Romanians and 2,402 to Bulgarians in 2013).
Grants of registration certificates and registration cards rose in 2013 (by 20% to 38,736), but have shown a generally falling trend since 2007. Polish nationals were granted the most registration certificates in each year between 2006 and 2011, but in 2012 and 2013 nationals of Portugal received the highest number (3,289 and 4,196 respectively).
The number of applications found to be invalid on receipt by the Home Office in 2013 compared to 2012 fell to 4,099 for registration certificates and registration cards (from 14,438) and to 2,390 for permanent residence cards (from 9,568). This category of decision was introduced in 2011 for applications that didn’t provide key information or documentation but, due to changes in late 2012 to the administration of EEA residence document applications, fewer applications were rejected as invalid in 2013. Applications are either issued or refused instead. Applications refused or found to be invalid may result in an immediate re-application, resulting in a further decision being counted in Table ee 02. The majority of applications recorded as invalid on receipt in 2013 were because the applicant had not included the fee required after 1 July 2013.
5.11 Data tables
Data on family immigration, sourced from Home Office administrative systems, can be found in the following tables:
- Visas volumes 1 and 3: tables vi 01 q, vi 04 q and vi 06 q f
- Admissions: tables ad 02 to ad 03 f
- Extensions: tables ex 01 q and ex 02 f
- Settlement: tables se 02 q
- European Economic Area (table ee 02)
The Office for National Statistics publishes estimates of those coming to join or accompany others, Migration.
6. Visas
Valid: 28 August 2014 to 26 November 2014
6.1 Introduction
The figures in this section relate to applications for and grants of entry clearance visas to individuals outside the UK. Data include dependants unless stated otherwise. Revisions to the data series have been made in this edition; for details, see the user guide.
For further information see About the Figures, the Policy and Legislative Changes Timeline and the user guide.
6.2 Key facts
There were 538,817 visas granted in the year ending June 2014, excluding visitor and transit visas, 7% (+37,209) higher than in the year ending June 2013. This increase was largely accounted for by higher numbers of work (+14,799 of which skilled work accounted for +11,744), study (+13,885), student visitor (+5,636) and family visas (+2,052). The work, study and family categories have grown following recent low points, while the student visitor category has continued to grow steadily.
The number of student visitor visas granted increased by 8% to 78,109 in the year ending June 2014. Student visitor visas are granted for short-term study (up to 6 months or 11 months for English Language courses) and cannot be extended.
There were 1.9 million (1,907,845) visitor visas granted in the year ending June 2014, 5% higher (+99,063) than in the previous 12 months (note these figures do not include the student visitor category). Much of the increase was accounted for by higher numbers granted to Chinese (+63,090 or +26%), Kuwaiti (+20,145 or +29%), Saudi Arabian (+14,001 or +17%), Turkish (+9,658 or +12%) and Philippine (+7,462 or +33%) nationals.
Visas granted by reason
| Year | Total granted (1) | Work | Study | Student visitors (2) | Family | Dependant joining or accompanying | Other |
|---|---|---|---|---|---|---|---|
| Year ending June 2009 | 550,634 | 175,758 | 227,873 | 39,998 | 49,455 | 27,007 | 30,543 |
| Year ending June 2010 | 616,650 | 154,615 | 320,183 | 41,859 | 50,240 | 15,407 | 34,346 |
| Year ending June 2011 | 616,413 | 158,261 | 304,568 | 55,082 | 49,263 | 15,001 | 34,238 |
| Year ending June 2012 | 520,073 | 147,377 | 214,219 | 68,990 | 44,424 | 12,782 | 32,281 |
| Year ending June 2013 | 501,608 | 144,503 | 204,410 | 72,473 | 33,710 | 11,649 | 34,863 |
| Year ending June 2014 | 538,817 | 159,302 | 218,295 | 78,109 | 35,762 | 11,379 | 35,970 |
| Change: latest year | +37,209 | +14,799 | +13,885 | +5,636 | +2,052 | -270 | +1,107 |
| Percentage change | +7% | +10% | +7% | +8% | +6% | -2% | +3% |
Long-term trends in visas granted by reason (excluding visitor and transit visas)
The chart shows the number of entry clearance visas granted, excluding visitor and transit visas, between 2005 and the latest rolling year available. The data are available in Table vi 04 q, Visas vol. 1.
Table and chart notes
Source: Home Office, Immigration Statistics April to June 2014, based on data in Table vi 04 q, Visas vol. 1.
(1) Figures exclude visitor and transit visas.
(2) The student visitor category was introduced in September 2007. Student visitors are allowed to come to the UK for 6 months (or 11 months if they will be studying an English Language course) and cannot extend their stay. The data include those who applied on the ‘Short-term student’ endorsement prior to the introduction of the student visitor category. For consistency and comparability over time student visitor visas have been excluded from study-related totals. For further discussion of study and student visitors see the Study section.
The falls in work, study and family visas granted from 2010 to 2012 are consistent with policy changes which came into effect from the end of 2010. The latest increases for work and study reflect increased levels of applications for particular industry and educational sectors. Detailed briefing on the trends of visas granted for work, study or family reasons (together with dependants joining or accompanying) are available in the Work section, Study section and Family section.
The short article ‘Entry Clearance Visas by length’ indicated that the increase from 2012 to 2013 in visas granted, excluding visitor and transit visas, was accounted for by higher numbers of short-term (less than 1 year) visas.
6.3 Visas granted by nationality
There were 538,817 visas granted in the year ending June 2014, excluding visitor and transit visas, 37,209 higher than in the year ending June 2013 (501,608).
The increase included higher numbers of visas granted to Chinese (+7,177 or +10%), Indian (+6,222 or +8%), Libyan (+4,491 or +86%) and Brazilian (+2,658 or +59%) nationals. The increase for Libyans was mainly accounted for by higher numbers for study (+64%) and student visitor visas following a previous drop due to civil unrest.
Over half of these visas granted in the year ending June 2014 were to nationals of Asian countries (52% or 280,360) with a further quarter granted to nationals of the Americas (13% or 67,944) and of Africa (12% or 64,727). The following map illustrates that 4 of the top 10 nationalities granted visas in the year ending June 2014 were Asian (India, China, Pakistan, Malaysia), 2 European (Russia, Turkey), and 1 nationality each from the Americas (USA), Oceania (Australia), the Middle East (Saudi Arabia) and Africa (Nigeria).
The top 10 nationalities accounted for 59% of the total. Indian nationals were granted the highest number of visas in the year ending June 2014 (82,116, 15%), followed by Chinese nationals (80,972, 15%) and United States nationals (35,713, 7%). China excludes Hong Kong.
6.4 Top 10 nationalities granted visas in the year ending June 2014
(Total 538,817, excluding visitor and transit visas)
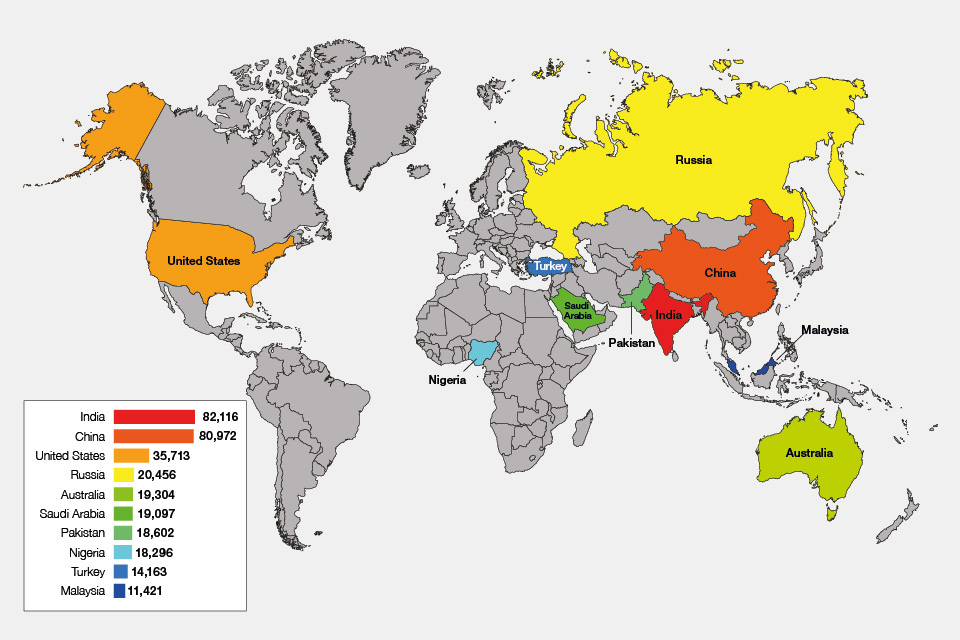
The image shows the number of entry clearance visas granted, excluding visitor and transit visas, for the top 10 nationalities in the year ending June 2014. The data are available in Table vi 06 q, Visas vol. 2.
Chart notes
Source: Home Office, Immigration Statistics April to June 2014, Table vi 06 q, Visas vol. 2.
(1) China excludes Hong Kong.
6.5 Visas granted by reason and nationality
The number of work-related visas granted fell between the year ending March 2011 and the year ending June 2013. Since then, the levels have increased from 144,503 in the year ending June 2013 to 159,302 in the year ending June 2014. Over half of this increase (+14,799) was accounted for by higher numbers for Indian (+6,217, +12%), Australian (+1,568, +11%) and Chinese (+860, +22%) nationals.
The number of study visas granted increased from 191,584 in 2005 to a peak of 320,183 in the year ending June 2010 and then fell to 204,410 in the year ending June 2013. The number then rose to 218,295 in the year ending June 2014, an increase of 13,885 (+7%) compared with the previous 12 months. This increase included higher numbers granted to Chinese (+3,979, +7%), Brazilian (+2,649, +115%), Malaysian (+1,852, +23%), Libyan (+1,550, +64%) and Hong Kong (+830, +10%) nationals. The largest falls in study visas were for Pakistani (-2,511, -35%) and Indian (-1,711, -12%) nationals.
There was a 5,636 (+8%) increase in student visitor visas granted, including higher numbers to Libyan (+2,568, +107%), Chinese (+1,651, +17%), Thai (+1,019, 40%) and Saudi Arabian (+512, +7%) nationals.
In the year ending June 2014 the number of family visas rose by 6% (+2,052, to 35,762), after following a general downward trend since the peak (72,894) in the year ending March 2007. The largest increases occurred for nationals of India (+655, +22%), Syria (+533, +128%) and the United States (+404, +28%). The increase for Syrian nationals is consistent with continuing civil unrest in the country since early 2011. The largest decreases in family visas were for nationals of Pakistan (-1,215, -20%) and Bangladesh (-409, -24%).
There were 1,907,845 visitor visas granted in the year ending June 2014, 5% higher (+99,063) than the previous 12 months. This increase was largely due to higher numbers granted to Chinese (+63,090 or +26%), Kuwaiti (+20,145 or +29%), Saudi Arabian (+14,001 or +17%), Turkish (+9,658 or +12%) and Philippine (+7,462 or +33%) nationals. By contrast, the largest falls were in visas granted to nationals of South Africa (-8,897 or -10%), United Arab Emirates (-8,565 or -27%), Qatar (-5,613 or -27%), Russia (-5,008 or -3%) and Oman (-4,449 or -46%). The large percentage falls in visitor visas granted to nationals of United Arab Emirates, Qatar and Oman may reflect the introduction of the Electronic Visa Waiver on 1 January 2014, which allows nationals of these countries to visit the UK for up to 6 months without a visa.
6.6 Data tables
Further data on entry clearance visas and sponsored visa applications for the work and study routes (described further in the Work and Study topics) can be found in the following tables:
- Visas vol. 1: (tables vi 01 q to vi 05 q)
- Visas vol. 2: (tables vi 06 q and vi 06 q w)
- Visas vol. 3: (tables vi 06 q s to vi 07)
- Sponsorship: (tables cs 01 to cs 14 q)
7. Admissions
Valid: 28 August 2014 to 26 November 2014
7.1 Introduction
The figures in this section relate to the number of journeys made by people entering the UK. Where an individual enters the country more than once, each arrival is counted. For non-EEA nationals who are subject to immigration control, more detailed information is available on their nationality and purpose of their journey.
Total passenger arrival data are available to the year ending June 2014; data on the purpose of journey (e.g. visit, work, study) and data for individual nationalities are available up to the end of 2013.
7.2 Key facts
The total number of journeys increased by 2% to 110.1 million in the year ending June 2014 compared with 108.3 million in the previous 12 months.
The higher number of journeys in the year ending June 2014 (up 1.8 million) was accounted for by 0.6 million more journeys by British, other EEA and Swiss nationals (totalling 95.8 million) and 1.2 million more journeys by non-EEA nationals (14.3 million).
For non-EEA nationals more detailed data by category are less up to date than the totals; however, they do show a comparable increase. There were 14.0 million journeys in 2013, 8% more than in 2012. There was an increase in the work category (+10% or +13,800) and falls for the study (-6% or -12,100), student visitor (-12% or -36,100) and family (-23% or -6,300) categories. The number of visitors increased by 13% (+1.0 million).
The number of passengers refused entry at port rose by 6% to 16,886 in the year ending June 2014 compared with the previous 12 months (15,936).
Admissions by purpose of journey (non-EEA nationals)
| Year | Total admissions (Millions) | Work | Study | Student visitors (1) | Family | Visitors (Millions) | Other (Millions) |
|---|---|---|---|---|---|---|---|
| 2009 | 12.3 | 161,000 | 291,000 | 198,000 | 36,600 | 6.9 | 4.8 |
| 2010 | 12.5 | 163,000 | 296,000 | 240,000 | 37,400 | 7.0 | 4.7 |
| 2011 | 13.3 | 149,000 | 267,000 | 262,000 | 32,300 | 7.9 | 4.7 |
| 2012 | 12.9 | 143,000 | 211,000 | 299,000 | 27,300 | 7.7 | 4.5 |
| 2013 | 14.0 | 156,000 | 199,000 | 263,000 | 21,000 | 8.7 | 4.7 |
| Change: latest year | +1.1 | +13,800 | -12,100 | -36,100 | -6,300 | +1.0 | +0.1 |
| Percentage change | +8% | +10% | -6% | -12% | -23% | +13% | +3% |
Table notes
Source: Home Office, Immigration Statistics April to June 2014, Admissions table ad 02 q.
(1) Student visitors are allowed to come to the UK for 6 months (or 11 months if they will be studying an English Language course) and cannot extend their stay. The student visitor category was introduced in 2007 and may include individuals previously recorded as visitors, so for consistency and comparability over time they have been excluded from study-related totals. For further discussion of study and student visitors see the Study section. For both visitors and student visitors, non-visa nationals do not require a visa for visits of up to 6 months, so total figures for admissions are not directly comparable with total visitor or student visitor visas.
Long-term trends in admissions
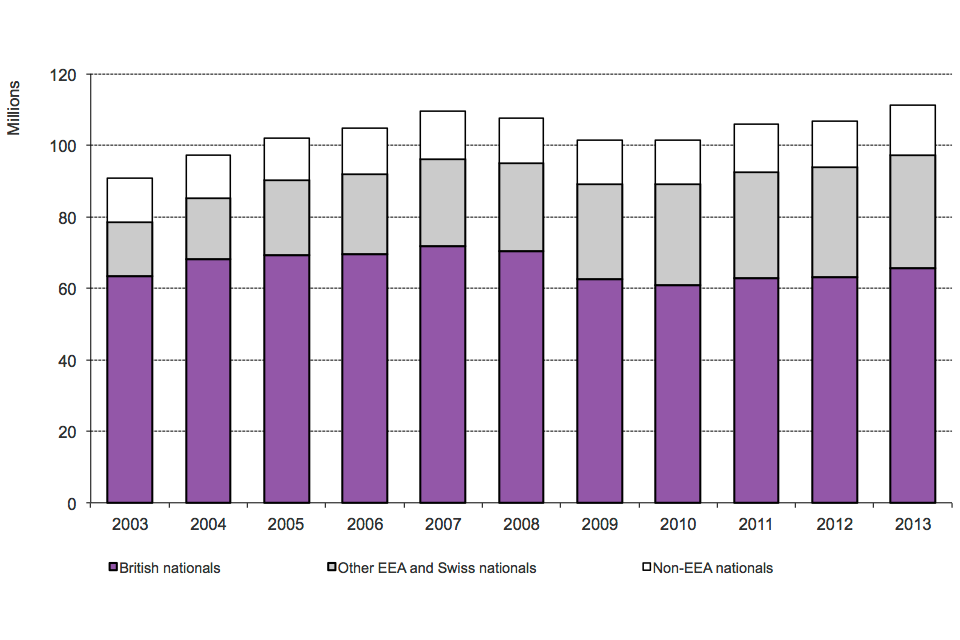
The chart shows the total number of journeys made into the UK by broad nationality between 2003 and the latest calendar year available. The data are available in Table ad 01.
Chart notes
Source: Home Office, Immigration Statistics April to June 2014, Admissions table ad 01.
7.3 Non-EEA nationalities admitted to the UK, 2013
United States nationals accounted for more than a quarter (27%) of the 14.0 million journeys by non-EEA nationalities into the UK. The top 10 nationalities accounted for 68% of all journeys made.
Top 10 non-EEA nationalities admitted, 2013
(Total number of admissions 14.0 million)
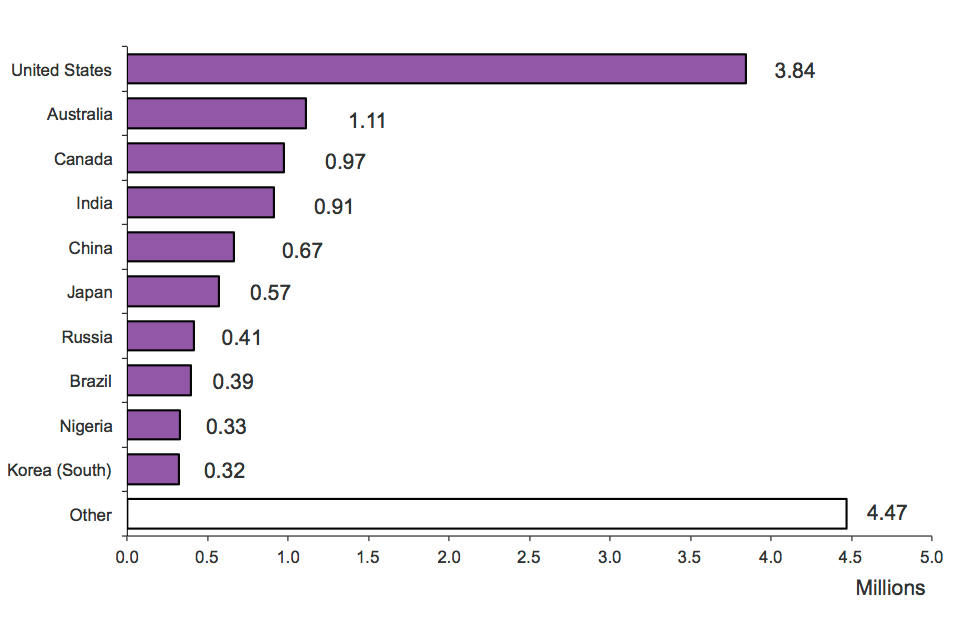
The chart shows admissions by nationality in 2013. The chart is based on data in Table ad 03.
Chart notes
Source: Home Office, Immigration Statistics April–June 2014, Admissions table ad 03.
7.4 Data tables
Further data on admissions and passengers refused entry at port are available in Admissions tables ad 01 to ad 04.
8. Asylum
Valid: 28 August to 26 November 2014
8.1 Introduction
This section covers asylum applications, initial decisions, unaccompanied asylum-seeking children (UASCs), age disputes, support, resettlement and international comparisons.
8.2 Key facts
There were 23,479 asylum applications in the year ending June 2014, a similar level to the previous 12 months (23,523). The number of applications remains low relative to the peak number of applications in 2002 (84,132).
The number of initial decisions on asylum applications has decreased by 26%, to 13,861 in the year ending June 2014. Of these decisions, 37% (5,066) were grants of asylum, a form of temporary protection or other type of grant.
At the end of June 2014, 21,104 of the applications for asylum received since April 2006 from main applicants were pending a decision (initial decision, appeal or further review). This was 45% more than at the end of June 2013 (14,589). The number of decisions outstanding increased during this period due to a decrease in staffing levels following a restructure initiated by the UK Border Agency. The Home Office has recruited over 170 decision makers since January to address this and is continuing to do so.
The HM Courts and Tribunals Service received 6,610 asylum appeals from main applicants in the year ending June 2014, a fall of 24% compared with the previous 12 months (8,754).
At the end of June 2014, 26,720 asylum seekers were being supported while their asylum claim was finally determined (under Section 95). The number of failed asylum seekers and their dependants receiving support (under Section 4) was 4,862. These were up 25% and 9% respectively compared with the previous year.
Asylum applications and initial decisions for main applicants
| Year | Total applications | Total Initial decisions | Granted (1) | Granted as a % of initial decisions | Refused | Refused as a % of initial decisions |
|---|---|---|---|---|---|---|
| Year ending June 2010 | 18,719 | 23,924 | 5,545 | 23% | 18,379 | 77% |
| Year ending June 2011 | 18,823 | 18,935 | 5,365 | 28% | 13,570 | 72% |
| Year ending June 2012 | 19,996 | 16,644 | 5,803 | 35% | 10,841 | 65% |
| Year ending June 2013 | 23,523 | 18,712 | 7,105 | 38% | 11,607 | 62% |
| Year ending June 2014 | 23,479 | 13,861 | 5,066 | 37% | 8,795 | 63% |
| Change: latest year | -44 | -4,851 | -2,039 | - | -2,812 | - |
| Percentage change | 0% | -26% | -29% | - | -24% | - |
Table notes
Source: Home Office, Immigration Statistics April–June 2014, Asylum table as 01.
(1) Granted includes grants of asylum, humanitarian protection, discretionary leave, leave to remain under family life or private life rules, leave outside the rules and UASC leave.
Most applications for asylum are made by those already in the country (89% of applications in the year ending June 2014) rather than by people arriving at port. Applicants tend to be young and male. Of those who applied for asylum in 2013, over three-quarters (78%) were between the ages of 18 and 39, and 73% were male.
Long-term trends in asylum applications
The chart below shows the annual number of asylum applications made since 2001.
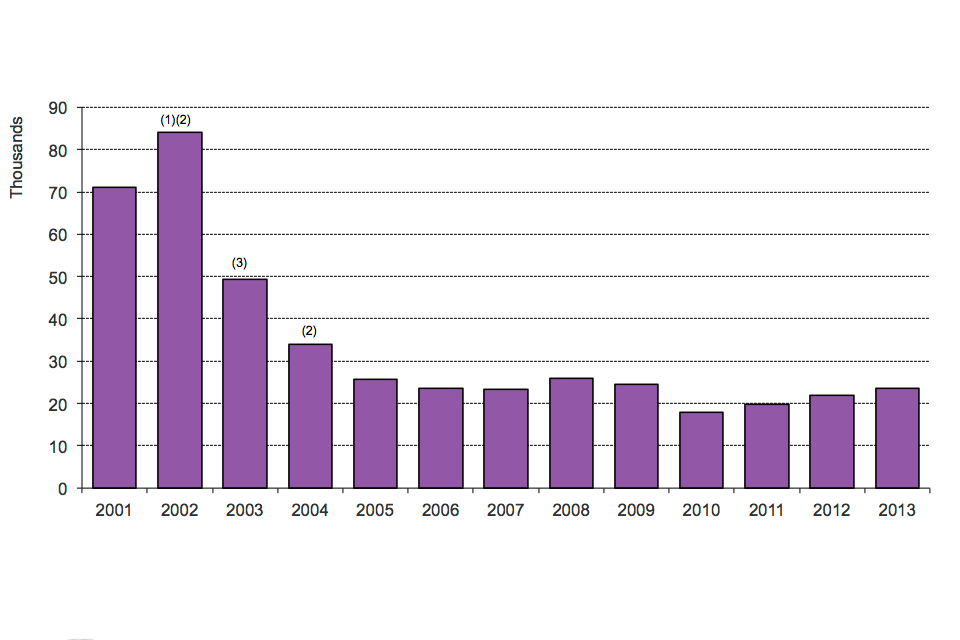
The chart shows the number of asylum applications made between 2001 and the latest calendar year. The data are available in Table as 01.
Chart notes
Source: Home Office, Immigration Statistics April to June 2014, Asylum table as 01.
(1) A process preventing certain nationalities from appealing a decision while in the country (non-suspensive appeals process) was introduced in 2002.
(2) Full overseas immigration controls operated by UK immigration officers (juxtaposed controls) were opened in France and Belgium in 2002 and 2004.
(3) Fast-track facilities for asylum applications were introduced in 2003.
Falls in asylum applications since 2002 coincide with: the introduction of a process preventing certain nationalities from appealing a decision while in the country in 2002; the opening of UK border controls (often termed ‘juxtaposed’ controls) in France and Belgium in 2002 and 2004 respectively; and the introduction of fast-track facilities for asylum applications in 2003.
8.3 Nationalities applying for asylum
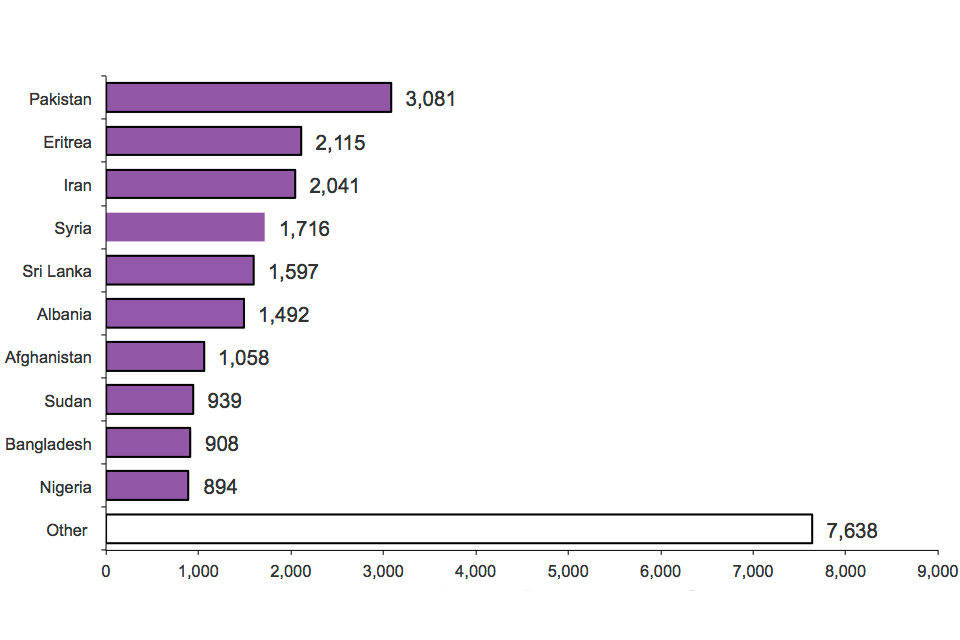
In the year ending June 2014, the largest number of applications for asylum were from nationals of Pakistan (3,081), followed by Eritrea (2,115), Iran (2,041) and Syria (1,716).
World events have an effect on which nationals are applying for asylum at any particular time. For example, there have been increases in the number of applicants from Syria since the outbreak of the Syrian civil war in early 2011. Since the early 90s, increasing numbers of people have sought asylum from Eritrea in the circumstances of international concern over human rights within the country.
Top 10 nationalities applying for asylum, year ending June 2014
(Total number of applications 23,479)
Alternative text not supplied.
Chart notes
Source: Home Office, Immigration Statistics April to June 2014, Asylum table as 01 q.
8.4 Applications pending
At the end of June 2014, 21,104 of the applications received since April 2006 from main applicants were pending a decision (initial decision, appeal or further review), 45% more than at the end of June 2013 (14,589). The increase was largely accounted for by a rise in the number pending an initial decision (+78%). The number of decisions outstanding increased during this period due to a decrease in staffing levels following a restructure initiated by the UK Border Agency. The Home Office has recruited over 170 decision makers since January to address this and is continuing to do so.
8.5 Asylum appeals
The HM Courts and Tribunals Service received 6,610 asylum appeals from main applicants in the year ending June 2014, a fall of 2,144 (-24%) compared with the previous 12 months (8,754). This remains well below the peak in the number of appeals for the year ending June 2010 (16,560) using comparable data available from 2007.
In the year ending June 2014, the proportion of appeals dismissed was 69%, while 26% of appeals were allowed and 6% were withdrawn.
8.6 Unaccompanied asylum-seeking children
There were 1,440 asylum applications from UASCs in the year ending June 2014, an increase of 21% from the year ending June 2013 (1,188). These applications represented 6% of all main applications for asylum. Despite the recent increase in UASC applications, they remain below the peak of 4,060 in the year ending September 2008.
There were 781 initial decisions for UASCs in the year ending June 2014, 18% lower than in the year ending June 2013 (954). Overall, there was a fall in the proportion of decisions that were grants, from 77% of decisions in the year ending June 2013 to 71% in the year ending June 2014.
8.7 Age disputes
The Home Office disputes the age of some asylum applicants who claim to be children.
In the year ending June 2014, 320 asylum applicants had their age disputed and there were 450 recorded as having completed an age assessment. The number of disputes over the ages of applicants does not necessarily relate to the number of age assessments made in the same period.
Of those who completed age assessments in the year ending June 2014, 55% had a date of birth showing that they were over 18 when the age dispute was raised.
8.8 Dependants
Including dependants, the number of asylum applications decreased from 29,770 in the year ending June 2013 to 29,758 in the year ending June 2014. This is an average of 1 dependant for every 4 main applicants.
In the year ending June 2014, 3,902 initial decisions were made relating to dependants. Of these 1,377 (35%) were granted asylum, 213 (5%) were granted a form of temporary protection or other type of grant, and 2,312 (59%) were refused.
8.9 Support
At the end of June 2014, 26,720 asylum seekers and their dependants were being supported under Section 95. At the end of December 2003 (the start of the published data series), there were 80,123 asylum seekers in receipt of Section 95.
There is a high concentration of those supported under Section 95 in a few local authority areas. For example, at the end of 2013 the 5 local authorities with the greatest number (Glasgow, Liverpool, Birmingham, Cardiff and Middlesbrough) accounted for 27% of the total, while 75% of all those seeking asylum and supported under Section 95 were in 30 local authorities. The map below shows the local authorities in England, Scotland and Wales according to the number of asylum seekers and their dependants in receipt of Section 95 support within each.
Asylum seekers and their dependants supported under Section 95, by local authority, in England, Scotland and Wales as at 31 December 2013
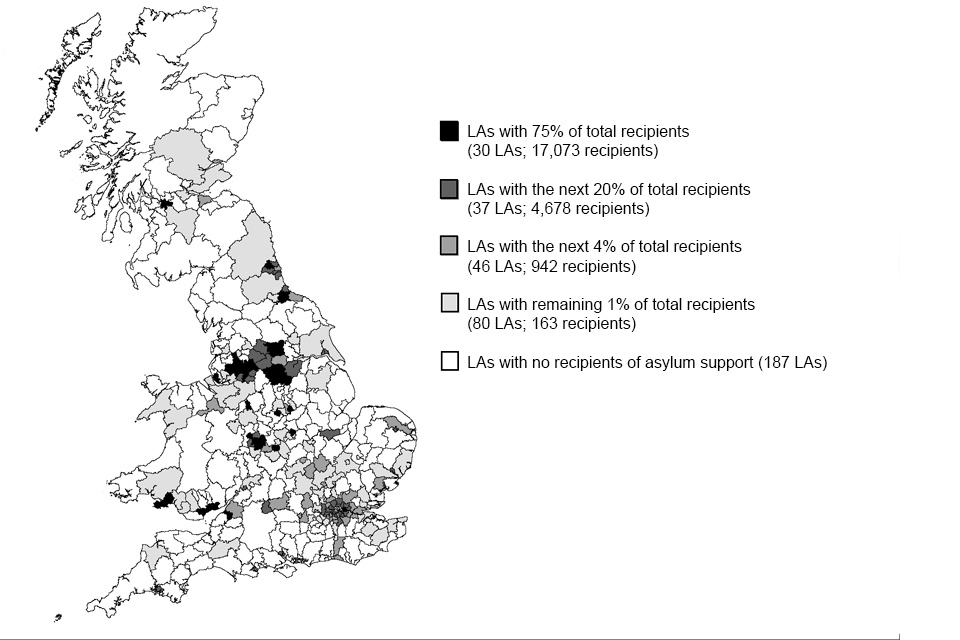
The image shows those in receipt of asylum support under Section 95 by local authority for England, Scotland and Wales as at 31 December 2013. The data are available in Table as 16 q.
Map notes
Source: Home Office, Immigration Statistics April to June 2014, Asylum table as 16 q.
(1) Numbers of those in receipt of Section 95 support excludes those in Northern Ireland and cases where no Unitary or Local Authority geographic location information is available.
The number of failed asylum seekers and their dependants receiving support (under Section 4) at the end of June 2014 was 4,862. Failed asylum seekers (main applicants only) receiving support peaked at the end of September 2009 (12,019).
The overall fall in support applications and numbers receiving support is generally in line with the fall in the number asylum applications since their peak in 2002 (84,132 main applicants) and the clearance of a backlog of asylum cases from the early part of the century.
8.10 Resettlement
In addition to those asylum seekers who apply in the UK, resettlement schemes are offered to those who have been referred to the Home Office by UNHCR (the UN agency for refugees).
In the year ending June 2014, a total of 750 were resettled in the UK through this process. Of these, 50 were granted Humanitarian Protection under the Syrian Vulnerable Persons Relocation Scheme.
8.11 International comparisons
Including dependants, the estimated total number of asylum applications to the EU27 was 409,400 in 2013, an increase of 31% on 2012 when there were 312,400 applications, and the highest since 2002 (from which comparable data are available).
Top 10 EU countries receiving asylum applications, 2013
(Total number of applications 409,400, including dependants)
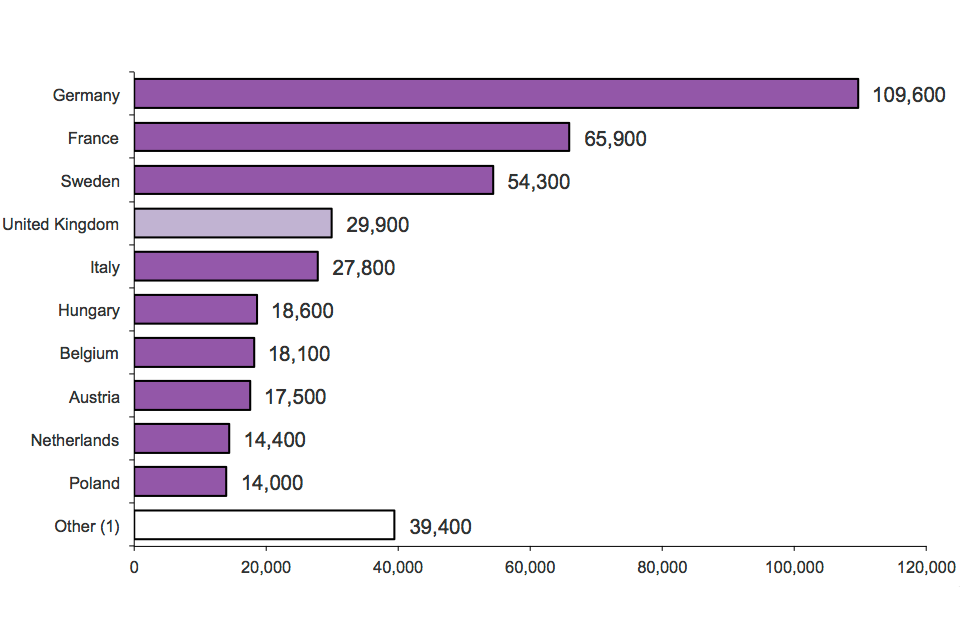
The chart shows the top 10 EU countries receiving asylum applications in 2013. The data are available in Table as 07.
Chart notes
Source: Home Office, Immigration Statistics April to June 2014, Asylum table as 07.
Figures are rounded to the nearest 100 and so may not add up to the total.
(1) Excludes Croatia which joined the EU on 1 July 2013
The UK had the fourth highest number of asylum applications within the EU in 2013, which is unchanged from 2012. In both 2013 and 2012, Germany, France and Sweden had more asylum applicants than the UK. In 2013 Hungary was in the top 10 (at sixth place) of EU countries receiving asylum applications for the first time.
When the relative size of resident populations of the 27 EU countries is taken into account, the UK ranked 16th in terms of asylum seekers per head of the population in 2013, compared with 13th in 2012.
Quarterly and annual statistics for asylum applications and first instance decisions for the EU Member States are also published by Eurostat (the European statistical organisation). Eurostat figures for 2013 show that the top 3 nationalities of those seeking asylum in the EU27 were Syria, Russia and Afghanistan.
Eurostat quarterly asylum figures are published in ‘Asylum applicants and first instance decisions on asylum applications’. The user guide also provides a discussion on the differences between the definition of asylum applications used in this release compared to those published by Eurostat.
8.12 Data tables
Data referred to here can be found in the following tables:
- Asylum vol. 1: tables as 01 to as 02
- Asylum vol. 2: tables as 02 q to as 06
- Asylum vol. 3: tables as 07 to as 13 q
- Asylum vol. 4: tables as 14 to as 19
9. Extensions of stay
Valid: 28 August to 26 November 2014
9.1 Introduction
The figures in this section relate to the number of people, subject to immigration control, who are granted or refused permission to extend or change the status of their stay in the UK. An individual may make more than one application in any given year. Data include dependants unless stated otherwise.
The numbers of decisions made are not always fully comparable over time. This is because as well as reflecting changes in the levels of those entering the UK, the figures are influenced by policy and legislative changes, e.g. when new categories are introduced or when there are changes to the length of leave granted (either for initial entry clearance visas or for subsequent extensions). In addition, the level of decisions made may be affected by the resources available in the Home Office.
For further information see About the figures, the ‘Policy and Legislative Changes Timeline’ and the user guide.
9.2 Key facts
The total number of decisions on extensions fell by 5% (-18,522) to 329,967 in the year ending June 2014. Of the 329,967 decisions there were 255,812 grants and 74,155 refusals (22% of the total), compared with 291,809 and 56,680 (16% of the total) respectively in the previous 12 months.
Work-related grants of extensions were 37% (-53,819) lower in the year ending June 2014 (92,075). This decrease was accounted for by falls in grants in the Tier 1 General and the Post-Study work categories, both closed to new entrants, and slightly offset by increases in Tier 1 Entrepreneur and Tier 2 Skilled worker categories.
There were 94,356 study-related grants of extensions, 6% (-6,101) lower than the previous 12 months.
Family-related grants of extensions rose by 21% (+6,420) to 37,180, accounted for by an increase in the new Family Life (10-year) category from 10,163 to 19,398 which was partly offset by a fall for spouses from 20,491 to 17,717.
Grants of extensions by reason and refusals
| Year | Total decisions | Total grants | Work | Study | Family (1) | Other (1) | Refusals |
|---|---|---|---|---|---|---|---|
| Year ending June 2010 | 387,800 | 321,969 | 145,032 | 134,625 | 22,911 | 19,401 | 65,831 |
| Year ending June 2011 | 361,609 | 304,308 | 125,203 | 135,947 | 18,463 | 24,695 | 57,301 |
| Year ending June 2012 | 308,785 | 270,817 | 134,168 | 93,287 | 16,392 | 26,970 | 37,968 |
| Year ending June 2013 | 348,489 | 291,809 | 145,894 | 100,457 | 30,760 | 14,698 | 56,680 |
| Year ending June 2014 | 329,967 | 255,812 | 92,075 | 94,356 | 37,180 | 32,201 | 74,155 |
| Change: latest 12 months | -18,522 | -35,997 | -53,819 | -6,101 | +6,420 | +17,503 | +17,475 |
| Percentage change | -5% | -12% | -37% | -6% | +21% | +119% | +31% |
Table notes
Source: Home Office, Immigration Statistics April to June 2014, Extensions table ex 01 q.
(1) The introduction of the new Family Life (10-year) route in July 2012 means that the total number of Family and Other grants are not fully comparable over time.
Long-term trends in grants and refusals of extensions of stay
The chart below illustrates longer-term trends in grants and refusals to extend stay by calendar year.
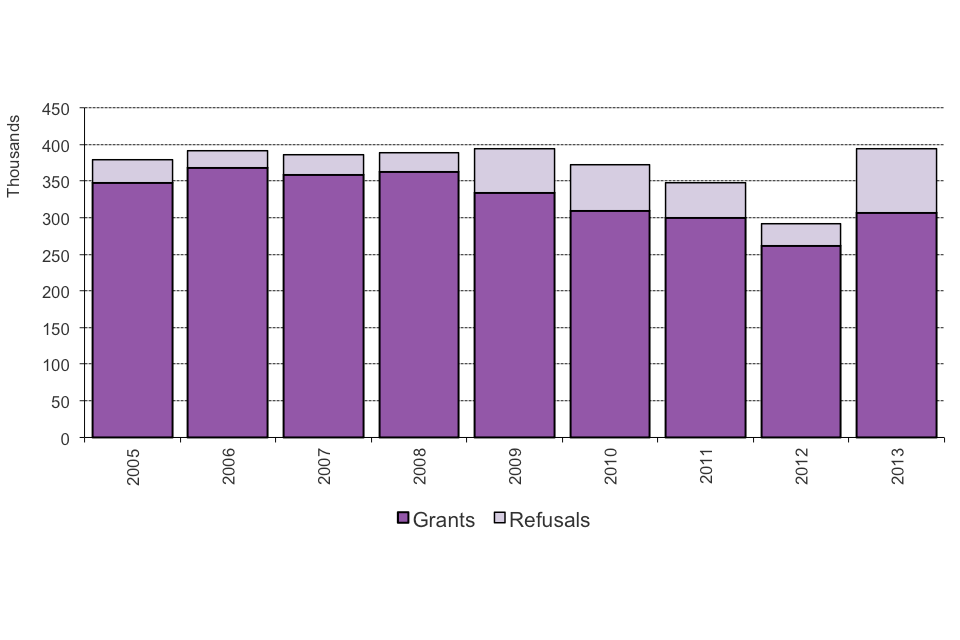
The chart shows grants and refusals of an extension of stay between 2005 and the latest calendar year. The chart is based on data in Table ex 01.
Chart notes
Source: Home Office, Immigration Statistics April to June 2014, Extensions table ex 01.
9.3 Grants of extensions for work
There were 92,075 work-related grants of extensions in the year ending June 2014, 37% lower than the previous 12 months (145,894). Grants in Tier 1 High Value and Tier 2 Skilled Work account for a large majority (81,950) of the 92,075 work-related grants.
Grants of extensions to Tier 1 High Value individuals for work fell from 72,602 to 21,316 (-71%) in the year ending June 2014. Within this route, there were notable falls in 2 categories that had been closed to new entrants: Tier 1 General (from 51,488 to 12,739) and the Post-Study work routes (from 16,730 to 371). There was an increase for the Tier 1 Entrepreneur category (from 3,408 to 6,993).
Grants of extensions for Tier 2 Skilled Workers increased slightly (+182) in the year ending June 2014 to 60,634. There was an increase in grants in the Tier 2 General category, from 40,464 to 42,278, mostly offset by a fall in grants in the Tier 2 Intra-Company Transfers category from 18,507 to 17,002.
Grants of extensions: Tiers 1 and 2
| Category | Year ending June 2013 | Year ending June 2014 | Change: latest 12 months | Percentage change |
|---|---|---|---|---|
| Total Tier 1 & pre-PBS equivalent | 72,602 | 21,316 | -51,286 | -71% |
| of which: | ||||
| Tier 1 Entrepreneurs | 3,408 | 6,993 | +3,585 | +105% |
| Tier 1 General | 51,488 | 12,739 | -38,749 | -75% |
| Tier 1 Post-Study | 16,730 | 371 | -16,359 | -98% |
| Total Tier 2 & pre-PBS equivalent | 60,452 | 60,634 | +182 | 0% |
| of which: | ||||
| Tier 2 General | 40,464 | 42,278 | +1,814 | +4% |
| Tier 2 Intra-Company Transfers | 18,507 | 17,002 | -1,505 | -8% |
Table notes
Source: Home Office, Immigration Statistics April to June 2014, Extensions table ex 01 q.
9.4 Grants of extensions for study
Study-related grants of extensions fell by 6% (-6,101) to 94,356 in the year ending June 2014. The 94,356 extensions include 755 grants under the Tier 4 Doctorate Extension Scheme.
9.5 Grants of extensions for family reasons
Family-related grants of extensions rose by 21%, (+6,420) to 37,180 in the year ending June 2014, after falling from 22,911 in the year ending June 2010 to 16,392 in the year ending June 2012. The increase was accounted for by a rise in grants in the new Family Life (10-year) category from 10,163 to 19,398, which was partly offset by a fall in grants to spouses, from 20,491 to 17,717.
The introduction of the new Family Life (10-year) route, ‘Statement of intent: family migration’, means that the total numbers of Family grants are not fully comparable over time and, since 9 July 2012, follows a new approach to people seeking to remain in the UK on the basis of their family and/or private life.
9.6 Grants of extensions for other reasons
Grants of extensions in other categories more than doubled (+17,503) to 32,201 in the year ending June 2014. This mainly reflected an increase in discretionary leave grants. From 9 July 2012, discretionary leave is no longer considered for new applicants seeking to stay in the UK on the basis of their family and/or private life (see the new approach taken to these cases referred to above). However, individuals granted discretionary leave before 9 July 2012 for family or private life reasons may apply to extend that leave when their period of discretionary leave expires.
9.7 Refusals of extensions by category
There were 74,155 extensions refused in the year ending June 2014, compared with 56,680 in the previous 12 months, mainly reflecting increases in refusals in the Family and Other categories.
There were 17,684 refusals of family-related extensions in the year ending June 2014 compared with 7,343 refusals in the previous 12 months. The increase was accounted for by a rise in refusals in the new Family Life (10-year) category from 2,430 to 14,967, which was partly offset by a fall in refusals to spouses, from 4,903 to 2,712.
There was also an increase in the “other” refusals category from 23,179 to 33,772. Of the 10,593 increase, 6,733 were due to an increase in refusals of an extension under the Private Life category and the remainder are likely to relate mainly to refusals of discretionary leave. The increases are consistent with the tightening of the rules.
These increases were partly offset by falls in work-related refusals of extensions, from 12,888 to 10,602, and refusals of study-related extensions from 13,270 to 12,097.
9.8 Nationalities granted an extension
(excludes dependants)
Of the total 232,213 extensions of stay in 2013, 67% (154,803) were granted to Asian nationals and 15% (34,674) were granted to African nationals.
Top 10 nationalities granted an extension to stay, 2013
(Total number of grants 232,213, excludes dependants)
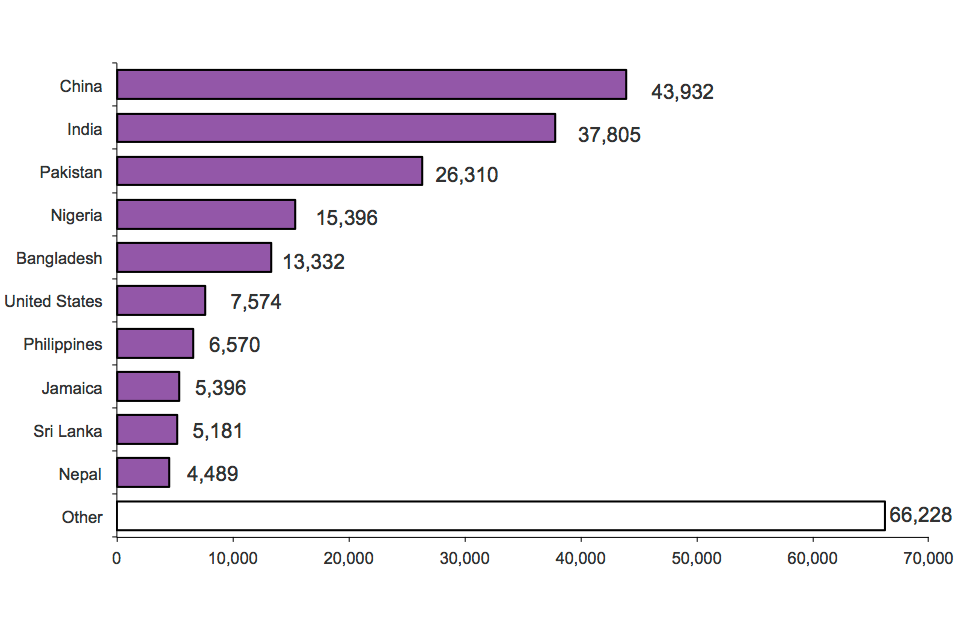
The chart shows grants of extension of stay by nationality in 2013. The chart is based on data in Table ex 02.
Chart notes
Source: Home Office, Immigration Statistics April to June 2014, Extensions table ex 02.
Nine of the top 10 nationalities granted extensions in 2013 were also in the top 10 list for 2012. The exception was Jamaica (displacing Australia) which ranked eighth, with 5,396 grants (of which 2,832 grants were Discretionary leave and 1,666 grants were in the Family Life (10-year route) category).
9.9 Data tables
Further data on extensions are available in Extensions tables ex 01 to expc 01 o.
A short statistical article on ‘Extensions of stay by previous category’ has also been published alongside the ‘Immigration statistics April to June 2013’ release to provide further detailed information.
10. Settlement
Valid: 28 August to 26 November 2014
10.1 Introduction
The figures in this section relate to the number of people, subject to immigration control, who are granted or refused permission to stay permanently in the UK, known as settlement.
10.2 Key facts
The number of people granted permission to stay permanently in the year ending June 2014 fell by 24% (-36,434) to 117,737. The decrease was accounted for by falls in work-related (-12,495), family-related (-19,261) and asylum-related grants (-7,167). Other grants increased by 2,489.
Work-related grants to stay permanently fell by 20% to 48,492 in the year ending June 2014, continuing earlier falls from 92,176 in the year ending June 2010. The 12,495 decrease was accounted for by a decrease in settlement granted after 5 years with a work permit (from 16,136 to 8,130) and grants to Tier 1 High Value individuals (from 29,222 to 24,278).
Family-related grants to stay permanently fell by 32% to 41,022, continuing the overall downward trend since the year ending June 2010 (73,830). There were notable decreases in grants to wives (from 33,346 to 23,063) and husbands (from 16,771 to 11,337).
Asylum-related grants to stay permanently fell by 34% to 13,691 in the year ending June 2014, returning to a similar level to the year ending June 2012 (12,494). The levels of asylum-related grants were relatively high in the first half of 2013 which may reflect additional resource deployed to decision-making.
Grants to stay permanently for other reasons rose by 21%, to 14,532 but remain significantly lower than 3 years ago. The rise was partly driven by an increase in grants under the Long Residency rules.
Grants to stay permanently by reason, and refusals
| Year | Total decisions | Total grants | Work | Asylum (1) | Family | Other (2) | Refusals |
|---|---|---|---|---|---|---|---|
| Year ending June 2010 | 239,426 | 226,084 | 92,176 | 2,813 | 73,830 | 57,265 | 13,342 |
| Year ending June 2011 | 220,047 | 209,761 | 69,563 | 9,636 | 58,822 | 71,740 | 10,286 |
| Year ending June 2012 | 146,401 | 140,911 | 68,967 | 12,494 | 48,310 | 11,140 | 5,490 |
| Year ending June 2013 | 159,130 | 154,171 | 60,987 | 20,858 | 60,283 | 12,043 | 4,959 |
| Year ending June 2014 | 124,781 | 117,737 | 48,492 | 13,691 | 41,022 | 14,532 | 7,044 |
| Change: latest 12 months | -34,349 | -36,434 | -12,495 | -7,167 | -19,261 | +2,489 | +2,085 |
| Percentage change | -22% | -24% | -20% | -34% | -32% | +21% | +42% |
Table notes
Source: Home Office, Immigration Statistics April to June 2014, Settlement table se 02 q.
(1) The low level of asylum-related grants in the year ending June 2010 reflects a rule change in August 2005 that effectively delayed grants for some people. This rule change meant that people given refugee status no longer received a grant immediately, and instead they were given 5 years’ temporary permission to stay.
(2) The high number of grants in the years ending June 2010 and 2011 mainly resulted from a review of the backlog of cases from before March 2007 involving unsuccessful asylum applicants.
Long-term trends in grants to stay permanently
The chart below illustrates longer-term trends in grants to stay permanently for the calendar years back to 2003.
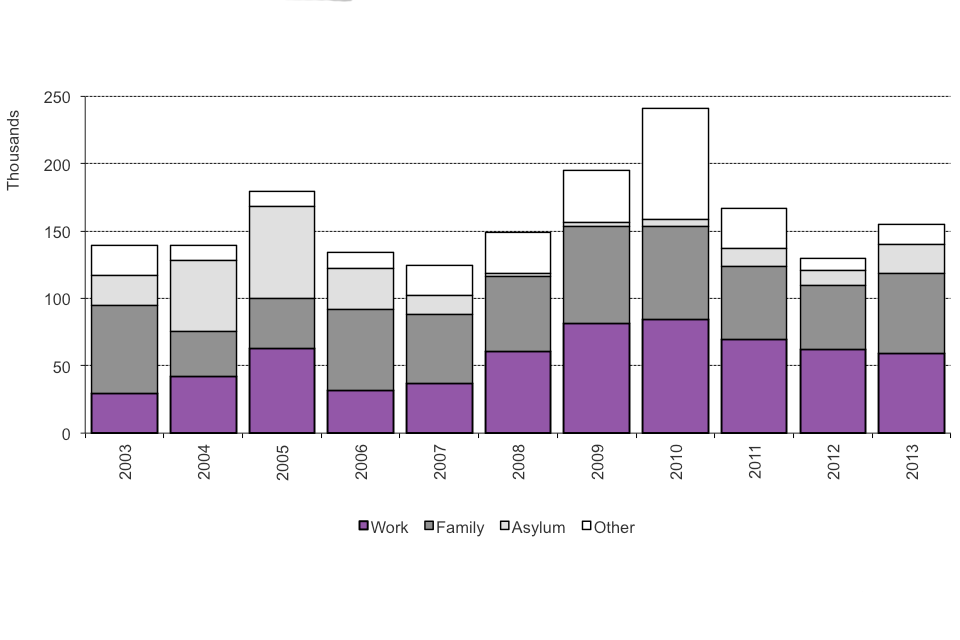
The chart shows the number of people granted settlement by calendar year from 2003. The data are available in Table se 02.
Chart notes
Source: Home Office, Immigration Statistics April to June 2014, Settlement table se 02.
The increase in total numbers of people granted permission to stay permanently from 2001 to 2005 was mainly due to increases in work- and asylum-related grants, which then fell in 2006 and 2007. This reflects changes to rules on how quickly those with refugee status or humanitarian protection were granted settlement and how quickly individuals qualified for work-related settlement. The higher total levels in 2009 and 2010 were due to grants given on a discretionary or other basis resulting from a review of the backlog of cases involving unsuccessful asylum applicants, and the falls in 2011 and 2012 follow the completion of the review. More generally, the numbers of applications and decisions reflect changes over time in levels of those entering the UK, as well as policy and legislative changes. Resources available in the Home Office can also affect the numbers.
10.3 Nationalities granted permission to stay permanently
Of the total 154,689 grants of permission to stay permanently in 2013, around half (51% or 79,651) were to Asian nationals and around a quarter (26% or 39,996) were to African nationals.
Top 10 nationalities granted permission to stay permanently, 2013
(Total 154,689)
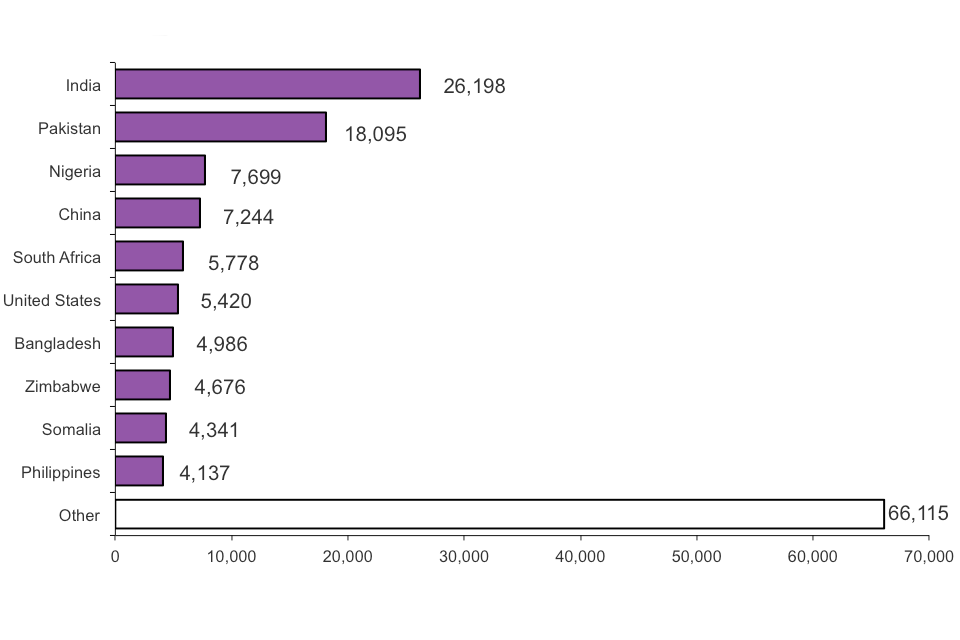
The chart shows grants of settlement by nationality in 2013. The chart is based on data in Table se 03.
Chart notes
Source: Home Office, Immigration Statistics April to June 2014, Settlement table se 03.
Eight of the top 10 nationalities granted settlement in 2013 were also in the top 10 list for 2012. The exceptions were Somalia which ranked 8th, with 4,341 grants and Sri Lanka ranked 10th, with 3,889 grants.
10.4 Data tables
Further data on settlement are available in Settlement tables se 01 to se 06.
11. Citizenship
Valid: 28 August 2014 to 26 November 2014
11.1 Introduction
The figures in this section relate to the number of people who are granted or refused British citizenship.
11.2 Key facts
In the year ending June 2014 there were 189,411 decisions about British citizenship, 11% fewer than in the previous 12 months (211,891). Correspondingly there were 11% fewer people granted British citizenship (down by 23,489 to 181,020).
Applications for British citizenship rose by 3% to 192,705 in the year ending June 2014. A change in language requirements on 28 October 2013 led to an increase in applications before this change. Subsequently grants also increased in the fourth quarter of 2013 as these cases were decided. Grant levels reduced in the second quarter of 2014 as UKVI resources were used to assist HM Passport Office. There was an increase in refusals and withdrawals (up 1,009 to 8,391) in the year ending June 2014, mainly due to failures to meet the requirements that came into force on 28 October 2013.
The 23,489 fall in grants of British citizenship was reflected in lower numbers of people granted citizenship in all broad categories. Grants on the basis of residence fell by 13,139 to 98,454, grants on the basis of marriage fell by 1,346 to 40,712, grants to children fell by 7,860 to 37,921 and grants for other reasons fell by 1,144 to 3,933.
Grants and refusals of citizenship
| Year | Total decisions | Total grants | On basis of residence | On basis of marriage | On basis of children | Other bases | Refusals and withdrawals |
|---|---|---|---|---|---|---|---|
| Year ending Jun 2010 | 206,244 | 197,896 | 95,176 | 49,897 | 47,698 | 5,125 | 8,348 |
| Year ending Jun 2011 | 193,339 | 185,600 | 92,734 | 40,965 | 46,263 | 5,638 | 7,739 |
| Year ending Jun 2012 | 186,113 | 179,697 | 98,310 | 35,443 | 41,127 | 4,817 | 6,416 |
| Year ending Jun 2013 | 211,891 | 204,509 | 111,593 | 42,058 | 45,781 | 5,077 | 7,382 |
| Year ending Jun 2014 | 189,411 | 181,020 | 98,454 | 40,712 | 37,921 | 3,933 | 8,391 |
| Change: latest 12 months | -22,480 | -23,489 | -13,139 | -1,346 | -7,860 | -1,144 | +1,009 |
| Percentage change | -11% | -11% | -12% | -3% | -17% | -23% | +14% |
Table notes
Source: Home Office, Immigration Statistics April to June 2014, Citizenship tables cz 01 q and cz 02 q.
Long-term trends in grants of citizenship
The chart below illustrates longer-term trends in grants of citizenship by calendar year.
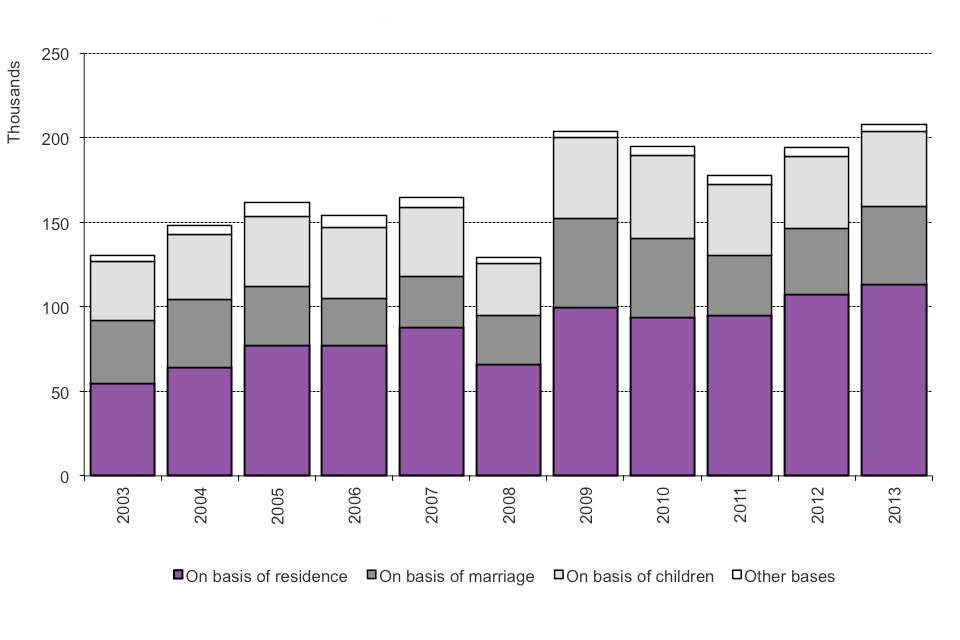
The chart shows the number of grants of British citizenship between 2003 and the latest calendar year. The data are available in Table cz 03.
Chart notes
Source: Home Office, Immigration Statistics April to June 2014, Citizenship table cz 03.
There has been a general increase in grants of citizenship in the last decade, with some fluctuation, that is likely in part to reflect increased grants of permission to stay permanently (known as settlement) up until 2010. After a period of residence those granted settlement become eligible to apply for citizenship.
Grants of citizenship in 2008 were reduced when staff resources were temporarily transferred from decision-making to deal with the administration of new applications. There were 207,989 grants in 2013, more than double the level seen in 2001 (90,282) and the highest comparable annual total since records began in 1962.
Applications have also shown a rising trend since 2001, with notable increases in 2005 (211,911) and 2013 (232,262). The increase in applications made in 2005 may have reflected people anticipating the introduction of the Knowledge of Life in the UK test on 1 November that year. Similarly the increase in 2013 may, in part, have been due to people anticipating the rule change to the English language element of the Life in the UK test as of 28 October 2013. See the ‘Policy and Legislative Changes Timeline’.
11.3 Grants of citizenship by previous nationality
Former Indian and Pakistani nationals have accounted for the largest numbers of grants in almost every year from 1998 to 2013, with the exception of 2007, when former nationals of Pakistan accounted for only the fifth highest number. Together, former Indian and Pakistani nationals accounted for more than a quarter (28%) of grants in 2013.
Top 10 previous nationalities granted citizenship, 2013
(Total number of grants 207,989)
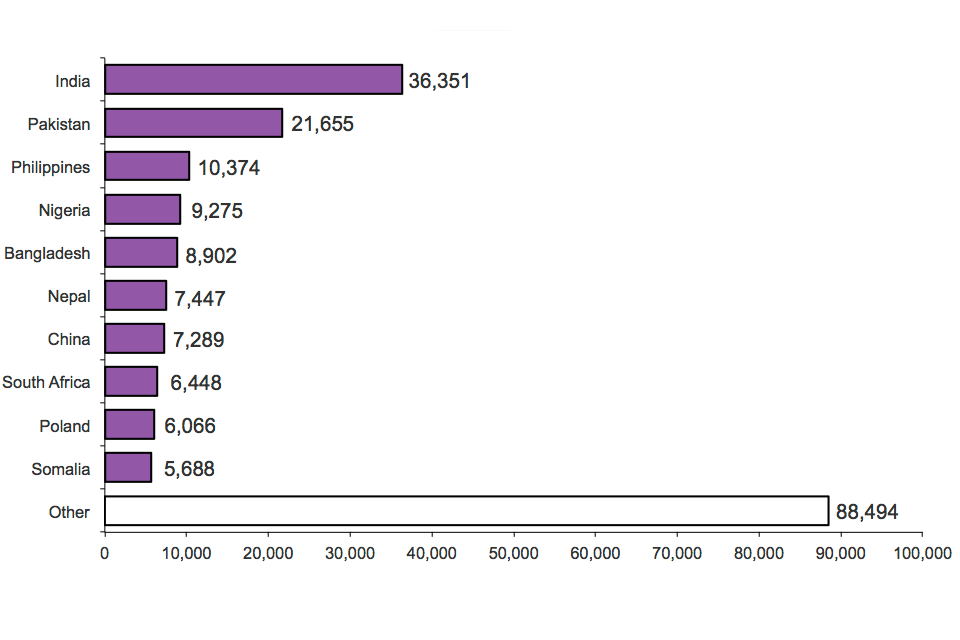
The chart shows grants of citizenship by previous nationality in 2013. The chart is based on data in Table cz 06.
Chart notes
Source: Home Office, Immigration Statistics April to June 2014, Citizenship table cz 06.
Increased grants to former nationals of Nepal and Poland placed them in the top 10 for the first time in 2013 (displacing Sri Lanka and Zimbabwe), reflecting increased grants of settlement to nationals of Nepal since 2005 and the issue of documents in recognition of permanent residence (under the Immigration (European Economic Area) Regulations 2006) to nationals of Poland since 2009.
11.4 Location of citizenship ceremonies
While the total number of ceremonies attended has changed in line with grants, the geographical distribution has remained similar since 2009. The proportion of ceremonies in the London region was 54% in 2005, but fell to 42% by 2009, with increases over the same period in the proportions for the North West, Yorkshire and the Humber, the West Midlands and the South East. However, in 2013 London remained the region with the highest proportion of ceremonies (41%).
11.5 Data tables
Further data on British citizenship are available in Citizenship tables cz 01 to cz 10. In addition to applications and detailed breakdowns of decisions, these include information on refusals, citizenship ceremonies attended and renunciations of citizenship.
12. Detention
Valid: 28 August 2014 to 26 November 2014
12.1 Introduction
The figures in this topic brief relate to the number of people entering, leaving or in detention, solely under Immigration Act powers, at immigration removal centres (IRCs), short-term holding facilities (STHFs) and pre-departure accommodation (PDA).
Key facts
The number of people entering detention in the year ending June 2014 fell to 29,124, down 2% on the previous year (29,708). Over the same period there was a fall of 1% in those leaving detention (from 29,357 to 29,050). The largest fall was in those leaving Campsfield House IRC, -36% (-690), which is likely to relate to the partial closure of the facility due to a major fire on 18 October 2013.
There was a continuing decline in the proportion of detainees being removed from 59% in the year ending June 2013 to 56% in the year ending June 2014. There was an increase in the proportion of detainees granted temporary admission or release, from 34% to 36% over the same period.
As at the end of June 2014, 3,079 people were in detention, 2% fewer than the number recorded at the end of June 2013 (3,142).
In the second quarter of 2014, 19 children entered detention in immigration removal centres, short-term holding facilities and pre-departure accommodation, which, together with the figures for the first quarters of 2011 and 2014, is the lowest in the series.
People entering, leaving and in detention, solely under Immigration Act powers
| Year | Entering detention | Leaving detention | In detention |
|---|---|---|---|
| Year ending June 2011 | 26,301 | 26,411 | 2,685 |
| Year ending June 2012 | 28,239 | 27,887 | 2,993 |
| Year ending June 2013 | 29,708 | 29,357 | 3,142 |
| Year ending June 2014 | 29,124 | 29,050 | 3,079 |
| Change: latest year | -584 | -307 | -63 |
| Percentage change | -2% | -1% | -2% |
Table notes
Source: Home Office, Immigration Statistics April to June 2014, Detention tables dt 01 q, dt 05 q and dt 11 q.
12.2 Length of detention
During the year ending June 2014, 29,050 people left detention. Of these, 17,765 (61%) had been in detention for less than 29 days, 5,401 (19%) for between 29 days and two months and 4,090 (14%) for between two and four months. Of the 1,794 (6%) remaining, 148 had been in detention for between one and two years and 33 for two years or longer.
Just over a third of people leaving detention were detained for seven days or less (10,322). Of these, 6,144 (60%) were removed, 3,887 (38%) were granted temporary admission or release and 92 (1%) were bailed. Of the 181 detained for 12 months or more, 80 (44%) were removed, 54 (30%) were bailed and 43 (24%) were granted temporary admission or release.
12.3 Children in detention
In the second quarter of 2014, 19 children entered detention, compared with 45 in the second quarter of 2013 and 66 in the second quarter of 2012. A focus on encouraging assisted departures for families and long lead in times to secure escorts for family returns may have partially contributed to the decline in numbers. Of the 19 children, nine were initially detained at Tinsley House (Family Unit) IRC, nine at Cedars PDA, and one at Yarl’s Wood IRC.
The number of children entering detention has fluctuated in recent quarters, following a period of consecutive increases from a low point of 19 at the start of 2011 up to 72 in the third quarter of 2013. Cedars PDA was opened during the third quarter of 2011 and has been specifically designed for families, providing, among other facilities, internal and external play areas for children. Subject to a risk assessment and suitable supervision arrangements, some family members may be allowed to undertake recreational activities outside the accommodation location. However, as with those held elsewhere, those entering PDA are detained under Immigration Act powers. Numbers of children entering detention remain well below a previous peak of 322 for the third quarter of 2009 following a change of policy in the third quarter of 2011.
Of the 20 children leaving detention in the second quarter of 2014, 16 were removed from the UK, 3 were granted temporary admission or release and one was released into the care of the local authority Of those leaving detention, 16 had been detained for less than three days, three for between four and seven days and one for between 12 and 18 months. The number of children removed from the UK on leaving detention has ranged from 2 out of 24 (8%) in the first quarter of 2011 to 16 out of 20 (80%) in the latest quarter.
The unusual occurrence of a child who left detention after being detained for between 12 and 18 months involved an age-disputed case where the individual had spent the majority of this time in prison. During the period the Home Office, working with the local authority who conducted an age assessment, concluded that the individual was an adult. However, the individual, considered a foreign national offender, was later issued with emergency travel documentation from his home country which accepted him as a minor allowing him to be released into the care of the local authority.
Children entering detention, solely under Immigration Act powers
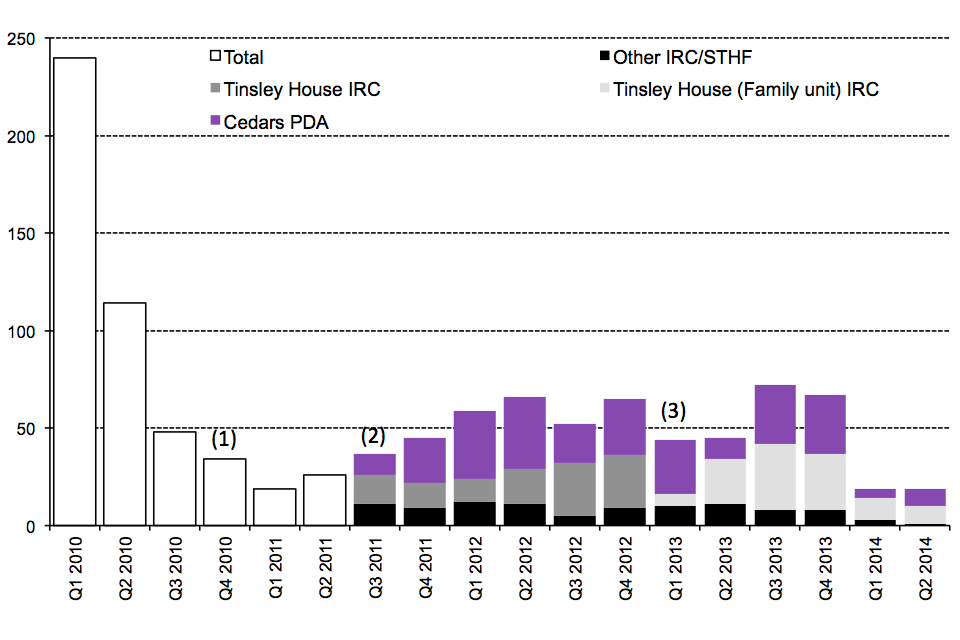
The chart shows the number of children entering detention between the first quarter of 2010 and the latest quarter. The data are available in Table dt 02 q.
Chart notes
Source: Home Office, Immigration Statistics April to June 2014, Detention table dt 02 q.
(1) Oakington Reception Centre closed on 12 November 2010; Yarl’s Wood closed to families with children on 16 December 2010.
(2) Cedars PDA opened on 17 August 2011. From the third quarter of 2011, all child detainees in Tinsley House are shown in Tinsley House IRC. From January 2013 child detainees in Tinsley House IRC, as part of a family, are shown in Tinsley House (Family Unit) IRC; the remainder are shown in Other IRC/STHF.
(3) Tinsley House IRC closed to new entrants from 18 January to 20 March 2013 due to an infectious illness.
12.4 Data tables
Further data on detention are available in Detention tables dt 01 to dt 13 q.
13. Removals and voluntary departures
Valid: 28 August 2014 to 26 November 2014
13.1 Introduction
The figures in this section relate to numbers of people, including dependants, leaving the UK either voluntarily when they no longer had a right to stay in the UK or where the Home Office has sought to remove them. While individuals removed at a port of entry have not necessarily entered the country, their removal requires action by the UK Border Force and Home Office, such as being placed on a return flight, and is therefore detailed below. The numbers of people leaving the UK by the various types of departure (enforced removals; refused entry at port and subsequent departures; and voluntary departures) are given below. The figures for the latest period are provisional and rely upon data matching exercises that may result in upward revision in the next release.
13.2 Key facts
Enforced removals from the UK decreased by 12% to 12,415 in the year ending June 2014 compared with the previous 12 months (14,159). This represents the lowest figure since the series began in 2004.
The number of passengers refused entry at port and who subsequently departed has increased by 3% in the year ending June 2014, to 14,671 from 14,247 for the previous 12 months; however the long-term trends show levels decreasing since 2004.
In the year ending June 2014, there was an increase of 12% in total voluntary departures, to 37,216, compared with the previous year (33,276). This category has represented the largest proportion of those departing from the UK since the end of 2009. The retrospective nature of data-matching exercises that are undertaken in counting for some voluntary departures means that the figures for the latest periods are particularly subject to upward revision (see the section ‘About the figures’).
Removals and voluntary departures by type
| Year | Total enforced removals | Total refused entry at port and subsequently departed | Total voluntary departures (1) | Assisted Voluntary Returns (2) | Notified voluntary departures (3) | Other confirmed voluntary departures (1)(4) | Other confirmed voluntary departures as a % of voluntary departures |
|---|---|---|---|---|---|---|---|
| Year ending June 2009 | 15,867 | 31,859 | 19,894 | 4,756 | 3,805 | 11,333 | 57% |
| Year ending June 2010 | 15,104 | 23,452 | 26,895 | 4,966 | 5,475 | 16,454 | 61% |
| Year ending June 2011 | 14,931 | 16,639 | 25,064 | 3,386 | 6,618 | 15,060 | 60% |
| Year ending June 2012 | 15,110 | 14,236 | 29,234 | 3,618 | 7,519 | 18,097 | 62% |
| Year ending June 2013 | 14,159 | 14,247 | 33,276 | 3,956 | 7,042 | 22,278 | 67% |
| Year ending June 2014 | 12,415 | 14,671 | 37,216 | 3,814 | 9,823 | 23,579 | 63% |
| Change: latest year | -1,744 | +424 | +3,940 | -142 | +2,781 | +1,301 | - |
| Percentage change | -12% | +3% | +12% | -4% | +39% | +6% | - |
Table notes
Source: Home Office, Immigration Statistics April to June 2014, Removals table rv 01 q.
(1) The figures for total voluntary departures and confirmed voluntary departures will initially be undercounts due to data-matching exercises that take place after the statistics are produced.
(2) Assisted Voluntary Return – where financial assistance is provided.
(3) Notified voluntary departure – where a person notifies the Home Office that they have departed.
(4) Other confirmed voluntary departure – where a person has been identified as leaving when they no longer had the right to remain in the UK, either as a result of embarkation controls or by subsequent data matching on Home Office systems.
Of the total voluntary departures in the year ending June 2014, 63% of those departing were categorised as other confirmed voluntary departures, 26% as notified voluntary departures and 10% as Assisted Voluntary Returns (AVRs). The largest category, other confirmed voluntary departures, are cases where a person has been identified as leaving when they no longer had the right to remain in the UK, either as a result of embarkation controls or by subsequent data matching on Home Office systems. This category has been the largest within total voluntary departures since 2007 when it surpassed AVRs. Other confirmed voluntary departures increased from 6,883 in 2007 to 26,313 in 2013 and the latest data shows 23,579 in the year ending June 2014.
Long-term trends in removals and voluntary departures by type, by quarter
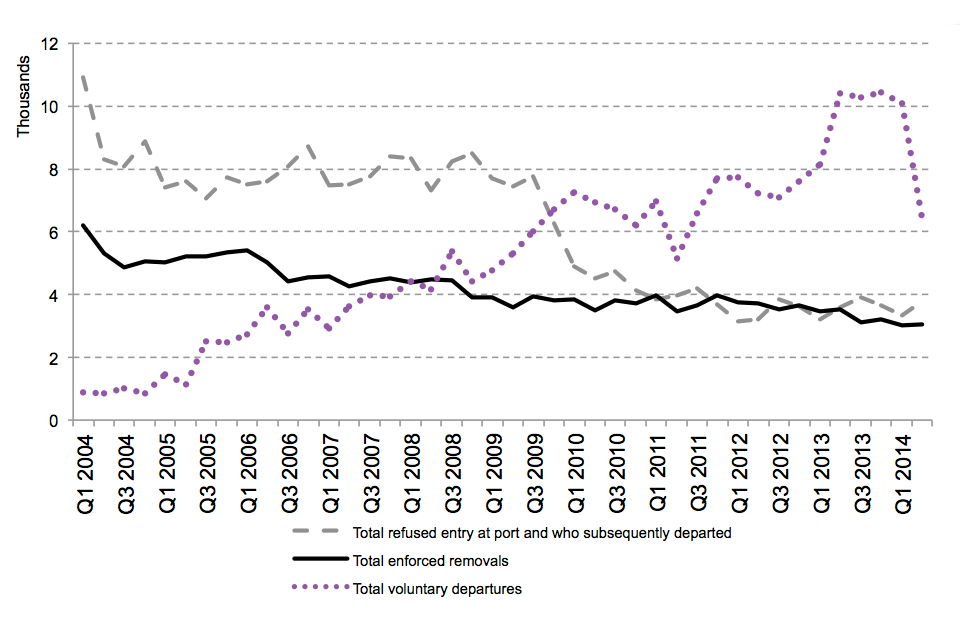
The chart shows the total number of enforced removals, total voluntary departures and total non-asylum cases refused entry at port and subsequently removed between the first quarter of 2004 and the latest quarter. The data are available in Table rv 01 q.
Chart notes
Source: Home Office, Immigration Statistics April to June 2014, Removals table rv 01 q.
The number of people refused entry at port and subsequently departed has decreased since the beginning of the data series in 2004. The 42% decrease from the third quarter of 2009 (7,751) to the second quarter of 2010 (4,520) has no identified single cause, although 26% of the decrease was due to a fall in the number of nationals of Afghanistan being refused entry and subsequently removed (-855). The overall falls are likely to be due to a combination of factors, including tighter screening of passengers prior to travel and changes in visa processes and regimes; for example, South African nationals have been required to have a visa for any length or type of visit to the UK since July 2009. In the past couple of years, the figures have shown small levels of fluctuations.
The long-term trend in voluntary departures increased steadily to the first quarter of 2010, but quarterly figures since 2010 have shown signs of a more gradual upward trend until Q2 2013 despite some fluctuations. The long-term increase over this period coincides with the Home Office improving its contact management with migrants and its ability to track those that are leaving the UK. The figures include individuals who have been identified by administrative exercises as those who have overstayed their leave, and then subsequently left the UK without informing the Home Office. This identification process allows the Home Office to focus its resources on those who remain in the UK. The figure for the second quarter of 2014 is lower than previous quarters. However, due to the retrospective nature of the data matching exercise, these figures are subject to upward revision as matching checks are made on travellers after departure.
The number of enforced removals has steadily declined over time, although this has been more gradual in recent years. The latest annual figure (2013; 13,313) represents the lowest level since the series began in 2004.
13.3 Asylum and non-asylum enforced removals
In the year ending June 2014, there were 4,279 enforced removals of people who had sought asylum at some stage, down 15% from the previous year (5,058). This figure is 64% lower than the peak in 2004 (11,743) when this data series began. This long-term decrease in the enforced removal of those seeking asylum can be viewed in the context of a generally decreasing trend in asylum applications since 2002; although the asylum applications have increased in recent years, they still remain low compared to the peak in 2002.
In the year ending June 2014, 66% of total enforced removals were non-asylum cases (8,136), down 11% from the previous year (9,101) and down 19% from the peak of 10,070 in 2008.
13.4 Removals and voluntary departures by nationality
The highest number of enforced removals in the year ending June 2014 were for nationals of Pakistan (1,747; 14% of the total). The second highest were for nationals of India (1,148; 9% of the total), who have also shown the largest decrease compared with the previous year (-754 or -40%).
The highest number of passengers refused entry at port and subsequently departed involved nationals of the United States (2,086; 14% of the total) who have also shown the largest increase compared with the previous year (+193 or +10%). The second and third highest involved nationals of Albania (989; 7% of the total) and Brazil (828; 6% of the total). Nationals of the United States and Brazil who are not coming to the UK for work or for six months or more do not need to apply for, and be issued with, a visa prior to arrival. The first time that they can be refused entry will therefore be on arrival in the UK.
The highest number of voluntary departures in the year ending June 2014 involved nationals of India (8,165; 22% of the total). The second highest involved nationals of Pakistan with 4,228 voluntary departures.
13.5 Departures by ‘harm’ assessment
The harm matrix was introduced in 2007 for monitoring the Public Service Agreement (PSA) that then was applied to measure performance in removing the most harmful people first. However interest in this topic remains despite PSAs being abolished under the current administration, ‘Higher harm’ assessments include people who have committed serious criminal and immigration offences.
In the year ending June 2014, 12,415 enforced removals and 37,216 voluntary departures were subject to an assessment for a harm rating, of which 17% and 1% respectively were assessed as ‘higher harm’. This is similar to the previous year, when 18% of enforced removals and 1% of total voluntary departures were assessed as ‘higher harm’.
13.6 Foreign national offenders
The Home Office removes foreign national offenders either by using enforcement powers or via deportation. In the year ending June 2014, provisional data show that 4,905 foreign national offenders (FNOs) were removed, an increase of 1% from the previous year (4,870).
13.7 Data tables
Further data on removals and voluntary departures are available in:
- Removals vol. 1: Tables rv 01 to rv 03 q
- Removals vol. 2: Tables rv 04 to rv 04 q
- Removals vol. 3: Tables rv 05 to rv 08 q
14. About this release
The immigration statistics quarterly release gives an overview of work on immigration within the Home Office, including the work of UK Border Force and UK Visas and Immigration. It helps inform users including the Government, Parliament, the media and the wider public, and supports the development and monitoring of policy.
The release includes the following topic briefings: (cross-cutting) Work, Study, Family, (single topic) Visas, Admissions, Extensions, Settlement, Citizenship, Asylum, Removals and Voluntary Departures and Detention. Detailed tables of figures accompany each of the single topic briefings, providing data up to the second quarter of 2014 (April to June).
The ‘Immigration Statistics’ release is a National Statistics output produced to the highest professional standards and free from political interference. It has been produced by statisticians working in the Home Office Statistics Unit in accordance with the Home Office’s ‘Statement of compliance with the Code of Practice for Official Statistics’ which covers our policy on revisions and other matters. The governance arrangements in the Home Office for statistics were strengthened on 1 April 2008 to place the statistical teams under the direct line management of a Chief Statistician, who reports to the National Statistician with respect to all professional statistical matters.
14.1 National Statistics
The UK Statistics Authority has designated these statistics as National Statistics, in accordance with the Statistics and Registration Service Act 2007 and signifying compliance with the Code of Practice for Official Statistics.
Designation can be broadly interpreted to mean that the statistics:
- meet identified user needs
- are well explained and readily accessible
- are produced according to sound methods
- are managed impartially and objectively in the public interest
Once statistics have been designated as National Statistics it is a statutory requirement that the Code of Practice shall continue to be observed.
The assessment report (No. 177) and letter of confirmation as National Statistics can be viewed at UK Statistics Authority Assessment reports.
14.2 Changes to topic briefings and tables
There have been a range of improvements to the following topic briefings and tables in this release:
- Information on aspects of EEA migration that has previously been published in an EEA section, such as passenger arrivals and data regarding Croatian transitional arrangements, is now included in the admissions, Work, Extensions and Family topics. EEA figures on the Sector Based Scheme, the Seasonal Agricultural Workers Scheme, accession worker cards and registration certificates and documentation are published in tables ee 01, ee_01q and ee 02.
- Data on asylum applicants accepted onto the fast-track process, and outcomes of these applications, have been consolidated to show totals rather than being broken down by detention facility. This is to reflect changes to operational procedures which mean that it is not possible to allocate fast-track cases to specific sites.
- The table showing those refused asylum who are eligible for the non-suspensive appeals process (as 13 q) has been redesigned to provide more detailed information and to clarify definitions.
- The Resettlement table has been expanded to include data by quarter and nationality from 2013. It now also includes data on the new Vulnerable Persons Relocation Scheme under which some Syrian nationals have been granted Humanitarian Protection in the UK.
- The Before Entry topic has been renamed as Visas to better reflect the content of this section. Tables on sponsorship for work and study have been separated out and renamed Sponsorship tables and these data are discussed in the Work and Study topics. Tables and data and information on port refusals have been moved to the Admissions tables and topic.
14.3 Revisions to data
Details of revisions to 2013 data for headline series, compared with initial data published at the end of February 2014, are provided in the user guide. As in previous years, revisions remain low for most series.
Within the Removals and Voluntary Departures section there have been revisions relating to the category ‘other confirmed voluntary departures’. Retrospective checks mean that figures for voluntary departures are subject to upward revision. This is particularly so for confirmed voluntary departures that are generated as a result of detailed retrospective checking, but some more limited revision is needed for notified voluntary departures to allow time for recording notifications from those who have departed. In light of this, notified voluntary departures and other confirmed voluntary departures for the first quarter of 2014 have been revised upwards from 2,474 to 2,626 (6% increase) and from 4,023 to 6,468 (61% increase) respectively in this quarterly release.
14.4 Future changes
The following changes are planned, subject to data quality and available resources:
Detention topic: Migration Statistics plan to publish data on people held in prison solely under Immigration Act powers during 2014 but a release date has not yet been finalised.
Migration Transparency Data webpage: A range of key input and impact indicators are currently published by the Home Office on the Migration Transparency Data webpage. We are considering ways in which we could more closely integrate the publication of the National Statistics and Official Statistics on immigration with the transparency data. This would be with a view to providing enhanced coherence, comparability, explanation and accessibility to the full range of data to users of migration statistics. We will keep stakeholders informed of any developments and where appropriate we would seek views through user consultation.
Seeking views of users: The conference of the Migration Statistics User Forum in September 2014 includes a breakout session on ‘What users would like from Home Office statistical releases on migration’ where we will invite users for their views to help develop and improve this publication. We are considering a more formal user consultation with specific proposals. If you are unable to attend the user forum conference but wish to provide comments, we welcome these via our contact details given below.
Geographical regions: For our November release we are planning to update the geographical regions that we use in our tables to broadly reflect the country groupings that ONS consulted on in early 2014, Country Groupings in International Migration Statistics. This will provide a more detailed breakdown of our figures by geographical region and not in any way restrict the information already available at the level of individual country of nationality.
If you have any comments on these plans please contact us via MigrationStatsEnquiries@homeoffice.gov.uk.
14.5 Migration Statistics User Forum
The forum has been established for discussion of migration statistics, allowing users to discuss their need for and use of the data and for producers to consult on presentation and changes. The main focus is on figures for the UK, but this would not exclude discussion of migration statistics for other countries. Home Office Statistics intends to use this list for communication with users, including data and release developments. The Forum is a user-led group, with close to 200 members, that is now affiliated to the Royal Statistical Society.
The list also provides access to contact details for the Home Office’s Migration Statistics team via downloading from MIGRATION-STATS File Area.
The distribution list is available to join through the MIGRATION-STATS JISCmail list.
Copies of the presentations made at the last annual conference of the Forum, held on 17 September 2013, including discussion of the then position on e-borders data, are available from Presentations from the 17 September 2013 conference.
The next annual conference of the Migration Statistics User Forum will be held on 16 September 2014. Details of the planned agenda and how to register for a limited number of remaining places are available via the JISCmail list and on the Royal Statistical Society event website.
14.6 Public Administration Select Committee inquiry
The Public Administration Select Committee (PASC) has examined the topic of migration statistics, as part of a programme of work on statistics and their use in government, and has published a report at Commons Select Committee, Migration statistics. The government’s response to this report is also available at Commons Select Committee, Migration statistics.
Transcript of 26 June 2014 Westminster debate on Migration Statistics.
14.7 Home Office statistical work programme
The Home Office has published its Statistical Work Programme 2014 to 2015 which outlines the most significant outputs, highlights some recent developments and outlines future plans. Pages 3 to 4 of the Work Programme cover our statistics on immigration. Pages 11 to 12 of the Work Programme provide details of how you can provide feedback on the work programme and outputs.
14.8 Further information and feedback
We welcome feedback on Immigration Statistics. If you have any comments, suggestions, enquiries or need assistance in accessing the data, please email them to: MigrationStatsEnquiries@homeoffice.gov.uk
Or write to:
The Editor, Immigration Statistics
Migration Statistics
Home Office Statistics
17th Floor Lunar House
40 Wellesley Road
Croydon
CR9 2BY
Press enquiries should be made to:
Home Office Press Office
Peel Building
2 Marsham Street
London
SW1P 4DF
Tel: 020 7035 3535
The Home Office Responsible Statistician is David Blunt, Chief Statistician and Head of Profession for Statistics. The Home Office Statistics mission statement is:
We produce timely, accurate and objective statistics on immigration, crime and policing to support effective delivery of Home Office objectives and to inform Government, Parliament and the public.
15. About the figures
This section, About the figures, provides extra information designed to assist in the interpretation of this release.
The ‘User Guide to Home Office Immigration Statistics’ additionally provides more detailed information including definitions used, other sources of information, how figures are compiled, data quality and issues arising from figures based on data sourced from an administrative database. The user guide is structured in the same way as About the figures.
For further information on changes to immigration legislation affecting the statistics see the ‘Policy and Legislative Changes Timeline’ published alongside the user guide.
15.1 Work: Study: Family
There are a range of measures that can be used to monitor those who are subject to immigration control and are coming to the UK for work, study or family reasons. These include:
- grants of visas for entry clearance, providing information on those intending to come
- admissions data, providing information on migrants at the border
- estimates on non-EU immigration from the International Passenger Survey (IPS) on migrants intending to stay for at least a year
- extensions of stay for work/study/family purposes providing information on case work relating to migrants in-country
- settlement data, providing information on the number of people who are granted or refused permission to stay permanently (settlement) which is an indicator of longer term migration
- data from the Migrant Journey Analysis on outcomes (5 years later) of those receiving work: study: family visas.
Trends in extensions and in permission to stay permanently will depend on admissions and immigration in previous years.
ONS figures on long-term immigration relate to non-EU nationals whilst other figures (visas, admissions, extensions, permission to stay permanently) relate to non-EEA nationals.
The various statistics and research presented can appear to give different pictures of immigration for work: study: family. Often this is because the latest data for different measures cover different time periods. In addition, they also count different aspects of the immigration process, with some showing intentions or permissions, while others show actual events. The Before Entry section of the ‘User Guide to Home Office Immigration Statistics’ includes a discussion on the differences between the various data sources presented on immigration.
ONS has conducted a review of Quality of Long-Term International Migration Estimates from 2001 to 2011 which predominantly are based on the International Passenger Survey (IPS). The review follows research conducted in light of the results of the 2011 Census for England and Wales, which found that the Census-based mid-year population estimate was 464,000 higher than the mid-year population estimates rolled forward from the 2001 Census base. Several possible causes for the difference were cited but it was considered that the ‘largest single cause is most likely to be underestimation of long-term immigration from central and eastern Europe in the middle part of the decade’, ‘Methods used to revise the national population estimates for mid-2002 to mid-2010’. The review extends this work to compare LTIM estimates to further data from the 2011 Census, as well as a range of other data sources across the decade from 2001 to 2011. IPS figures are compared with visa figures in the topic briefs for work, study and family. However, the IPS estimates used solely relate to non-EU nationals as visas are not required for EU nationals (or other EEA nationals) visiting the UK.
Data include dependants unless stated otherwise.
All data for 2013 and 2014 are provisional. IPS and LTIM figures for 2013 will be finalised in November.
Figures for admissions and immigration are estimates rounded to the nearest thousand. For the family topic, figures for non-EU immigration estimated by the IPS are rounded to the nearest thousand.
Figures for immigration in the study and family topics relate to non-EU nationals whilst other figures (visas, admissions, extensions) relate to non-EEA nationals.
Work: Recent falls for work-related visas, admissions and immigration are likely to be partly due to policy changes that came into effect from 2011. The Post-Study work route was closed to new applications on 6 April 2012 but existing applications continue to be processed after this date. From December 2010, Tier 1 General was closed to applicants who are outside the UK and it was closed to migrants who were already in the UK, in most immigration categories, from April 2011. Details of these policy changes, together with information on changes to immigration legislation affecting the statistics, can be found in the ‘Policy and Legislative Changes Timeline’ published alongside the user guide. Following the accession of Croatia to the EU on 1 July 2013 similar transitional restrictions to those that previously related to Bulgarians and Romanians were placed on Croatians working in the UK. A link to more information on these restrictions can be found in the user guide.
Study: Data for visas and admissions exclude student visitors unless stated otherwise. The student visitor category provides for persons who wish to come to the UK as a visitor and undertake a short period of study. Visa data on student visitors include those who applied on the ‘short-term student’ endorsement prior to the introduction of the ‘student visitor’ endorsement in September 2007. For admissions short-term students may have been classified as visitors prior to September 2007; for consistency and comparability over time they are excluded from study-related totals.
Family: The numbers of applications and decisions made reflect changes in levels of immigration over time, as well as policy and legislative changes, including changes to immigration legislation. The availability and allocation of resources within UK Visas and Immigration can also affect the number of decisions on applications. In July 2012, changes were made to the family Immigration Rules which apply to applications made on or after 9 July 2012. It is not possible to separately identify applications made under the previous and new rules. Spouse, partner and child applications which fall for refusal solely because they do not meet the new minimum income threshold have been subject to a hold on decision making following a High Court judgment in July 2013.
15.2 Visas and Sponsorship
Before travelling to the UK, a person may be required to apply for and be granted an entry clearance visa, depending on their nationality, purpose of visit and intended length of stay. On arrival at UK ports, or UK border controls in France and Belgium (often termed ‘juxtaposed’ controls), all individuals have to satisfy a Border Force officer that they have the right to enter the country before being admitted to the UK.
The data in this section include dependants and exclude those visiting the UK or in transit, unless stated otherwise.
Data for visas prior to 2005 are not comparable. All figures for 2013 and 2014 are provisional.
EEA nationals do not require an entry clearance visa. 414 visas were recorded as granted to EEA nationals in 2013, with 368 of these recorded as nationals of Cyprus, but most likely these people are from the area not under the effective control of the Republic of Cyprus. The ‘Visas’ data tables and section of the ‘User Guide to Home Office Immigration Statistics’ provide more information.
15.3 Admissions
All people admitted are subject to immigration control except British, other European Economic Area (EEA) and Swiss nationals.
Most data in this briefing are rounded to three significant figures. All data include dependants.
For arriving passengers subject to immigration control, who have previously obtained leave to enter, the journey is recorded as ‘returning after a temporary absence abroad’ within the ‘other’ category. Due to the volume of passengers arriving at Heathrow and Gatwick some data are estimated from monthly samples.
Some major components of the total (visitors, passengers returning and passengers in transit) reflect, to a large extent, trends in international tourism. The number of other admissions (for example, for work, study or family reasons) are likely to reflect trends in international migration and related policy and legislative changes affecting those subject to immigration control, for example changes in immigration legislation, enlargement of the European Union, and the introduction of the points-based system for work and study in 2008 and 2009 respectively.
Total passenger arrival data are available up to the year ending June 2014 (Table ad 01 q); data on the purpose of journey (e.g. visit, work, study; Table ad 02 q); and data for individual nationalities are available up to the end of 2013 (Tables ad 02 and ad 03).
Passenger arrivals figures for 2003, referred to in the chart above, can be found in Table 1.2 of ‘Control of Immigration Statistics UK 2009’.
Further information on visitors to the UK is published by the Office for National Statistics in ‘Overseas Travel and Tourism - May 2014’.
The refusal of entry to passengers relates to non-asylum cases dealt with at ports of entry.
15.4 Asylum
This briefing excludes numbers of dependants, unless stated otherwise. One person (the main applicant) can apply for asylum on behalf of themselves and others (dependants).
All data, except data on asylum support, for 2013 and 2014 are provisional.
The method for processing figures for asylum support changed from the first quarter of 2013. Since 2013, figures have been produced using a new method which facilitates access to the data for data quality purposes and improved reconciliation with administrative records. The data source for both new and previous methods remains the same. Caution should be taken when comparing earlier data with figures from the first quarter of 2013 onwards, as the figures are not directly comparable.
The table for Non-Suspensive Appeals been redesigned to provide more detailed information and clarity of definitions. ‘Total eligible for the non-suspensive appeals process’ includes main applicants who have been refused asylum, HP or DL where the refusal was certified as clearly unfounded. Previously this category included a broader definition; main applicants refused asylum, HP or DL.
15.5 Extensions of stay
EEA nationals are not subject to immigration control so are not included in these figures. When a country joins the EU its nationals are no longer included in these figures e.g. Bulgarian and Romanian nationals are not included from 2007 onwards.
The data in this briefing include dependants, except where stated otherwise, and take account of the outcomes of reconsiderations and appeals. All figures for 2013 and 2014 are provisional.
The numbers of applications and decisions made reflect changes over time in levels of immigration, as well as policy and legislative changes, including changes to immigration legislation and changes to the length of leave granted (either for initial entry clearance or for subsequent extensions. The availability and allocation of resources within Home Office can also affect the number of decisions.
Data on migration applications decided within published standards, the cost per decision for all permanent and temporary migration applications are published as Official Statistics by the Home Office as part of their performance data. Details are given at Migration transparency data.
A short statistical article on ‘Extensions of stay by previous category’ has also been published alongside the Immigration statistics April to June 2013 release to provide further detailed information.
15.6 Settlement
EEA nationals are not subject to immigration control and so are not included in these figures. When a country joins the EU its nationals are no longer included in these figures e.g. Bulgarian and Romanian nationals are not included from 2007 onwards.
The numbers of applications and decisions about permission to permanently stay reflect changes over time in levels of those entering the country, as well as policy and legislative changes. These may affect the number of people potentially eligible to permanently stay. The availability and allocation of resources within the Home Office can also affect the number of decisions.
All the figures include spouses and dependants, unless stated otherwise. All data for 2013 and 2014 are provisional.
From 2003 onwards, dependants of EEA and Swiss nationals in confirmed relationships may be shown separately in figures on issues and refusals of permanent residence documents, rather than in figures about settlement. Figures on issues and refusals of permanent residence documentation to EEA nationals and their family members are shown in EEA table ee 02. Further information can be found in the Family topic.
Data on migration applications decided within published standards, the cost per decision for all permanent and temporary migration applications are published as Official Statistics by the Home Office as part of their immigration performance data. Details are given on the Migration transparency data webpage.
Migrant journey analysis is able to look at those who apply for settlement or indefinite leave to remain (ILR) and which visas they used to arrive at that point. This analysis shows that the proportion of settlement grants made to people who initially arrived on a temporary visa rose between 2009 and 2012. For example, those originally entering the UK on a student visa comprised 11% of settlement grants in 2009 and 16% in 2012. Source: Home Office, ‘Migrant Journey Fourth Report’.
15.7 Citizenship
There are no separate figures for dependants because all applications for citizenship are from individuals treated as applicants in their own right (including those made on the basis of a relationship with an existing British citizen). The data also reflect the outcome of reconsidered decisions. All figures for 2013 and 2014 are provisional.
Citizenship is granted under the British Nationality Act 1981 which came into force on 1 January 1983, subsequently amended by the Nationality, Immigration and Asylum Act 2002.
The number of applications and decisions made reflect changes over time in levels of those entering the country, as well as policy and legislative changes, which for example may affect the number of people potentially eligible to apply. The availability and allocation of resources within the Home Office can also affect the number of decisions.
15.8 Detention
Children are those recorded as being under 18 years of age. All data for 2013 and 2014 are provisional.
15.9 Removals and voluntary departures
Numbers of enforced removals include people deported. Deportations are a subset of departures which are enforced either following a criminal conviction or when it is judged that a person’s removal from the UK is in the public’s interest; a person who has received a deportation order is not allowed to return to the UK, unless the order is cancelled. Most illegal immigrants are removed from the UK under administrative or illegal entry powers and not deported. Published information on those deported from the UK is not separately available.
Figures for 2013 and Q1 2014 have been revised in this release.
All data include dependants, unless otherwise stated, are provisional for 2013 and 2014.