ISOSS HIV report (for pregnancies between 1 April 2021 to 31 March 2022)
Published 16 May 2024
Applies to England

© Crown copyright 2024
This publication is licensed under the terms of the Open Government Licence v3.0 except where otherwise stated. To view this licence, visit nationalarchives.gov.uk/doc/open-government-licence/version/3 or write to the Information Policy Team, The National Archives, Kew, London TW9 4DU, or email: psi@nationalarchives.gov.uk.
Where we have identified any third party copyright information you will need to obtain permission from the copyright holders concerned.
This publication is available at https://www.gov.uk/government/publications/idps-isoss-hiv-outcome-report-2023/isoss-hiv-report-2023
1. Introduction
The Integrated Screening Outcomes Surveillance Service (ISOSS) is commissioned by NHS England and is part of the NHS Infectious Diseases in Pregnancy Screening (IDPS) programme. Surveillance is conducted for pregnancies in women with human immunodeficiency virus (HIV), hepatitis B virus (HBV) and syphilis, their babies and other children diagnosed with HIV, vertically acquired HBV and congenital syphilis in England. HIV reporting has been running since 1989. It was previously known as the National Surveillance of HIV in Pregnancy and Childhood (NSHPC) until 2018, when ISOSS was established.
This report focuses on pregnancies to women living with HIV who booked for antenatal care in England from 1 April 2021 to 31 March 2022. All HIV screen positive pregnancies reported to ISOSS with data submitted by the end of September 2023 are included; this includes pregnancies in women with established HIV diagnosis as well as those newly diagnosed through antenatal screening. Data around vertical transmissions also include women who were diagnosed with HIV after delivery. Data presented on vertical transmissions, breastfeeding and trends includes pregnancies reported in previous years.
Previous ISOSS reports (until 2020) covered the whole of the UK and predate current government arrangements. Data reported from 2020 onwards is for England only (with the exclusion of some breastfeeding trend data and spotlight sections). Spotlight sections are part of the report designed to give more in depth analysis on a particular topic and as such include ISOSS data for longer time periods to look at for example, trends. Previous reports presented data based on calendar year. For this and future reports, data is presented in line with national screening programme data reports, that being by financial year.
2. IDPS programme standards summary statistics
Screening standards data are submitted by maternity providers to the IDPS programme. This data is collected separately from ISOSS surveillance and there are differences in the numbers between the two data sources due to data quality issues including duplicate records and following transfers of care.
The most recently published screening standards data is for screening year 2021 to 2022 (1 April 2021 to 31 March 2022).
In screening year 2021 to 2022 in England:
- approximately 635,000 pregnant women entered the antenatal screening pathway
- individual screening coverage for antenatal HIV, HBV and syphilis screening was 99.8%
- 0.11 eligible pregnant women per 1,000 tested received a new HIV diagnosis
Table 1: trends in screen positive rates for HIV in pregnant women, England, screening year ‘2018 to 2019’ to ‘2021 to 2022’
| 2018 to 2019 | 2019 to 2020 | 2020 to 2021 | 2021 to 2022 | |
|---|---|---|---|---|
| Returns included/expected | 144/146 | 140/143 | 139/142 | 142/142 |
| Screen positive women: rate per 1,000 women tested | 1.26 | 1.19 | 0.96 | 0.92 |
| Newly diagnosed women: rate per 1,000 women tested | 0.14 | 0.13 | 0.11 | 0.11 |
Table 1 note 1: known false positive results are not included in the number of screen positives.
Table 1 note 2: the rate for total screen positive women is based on a count that has been rounded to the nearest multiple of 5 for data for 2018 to 2019, 2019 to 2020, 2020 to 2021, and 2021 to 2022 to prevent disclosure by comparison with other published data.
3. HIV reporting to ISOSS
The process and points in time for data collection can be seen in the data collection processes section. Data is reported to ISOSS by 154 different maternity providers, some of which are part of bigger NHS trusts that report their screening standards data in a combined format that is published in antenatal data standards reports.
In 2021 to 2022, 100% (606 of 606) of maternity providers in England submitted their initial notifications (green cards) for women with screen positive results for HIV via the quarterly reporting system on the ISOSS portal, including confirmations from trusts that had no women with screen positive results. Antenatal notification forms were subsequently returned for 99.4% (536 of 539) of pregnancies in women living with HIV (established diagnosis and newly diagnosed), and pregnancy outcome forms returned for 100.0% of these pregnancies.
3.1 HIV overview
There were 536 pregnancies in women living with HIV with a booking date in the 2021-22 screening year, showing a slight decline from 574 pregnancies booked in the 2020-21 screening year. Women with a diagnosis of HIV prior to conception made up 89.0% of pregnancies (477/536). The remaining women were diagnosed during their current pregnancy, with the majority (87.5%) because of the screening programme. The proportion of women with a known HIV diagnosis before pregnancy has increased by approximately 10% in the last 10 years (79.7% in 2010 to 2011) (see figure 1).
Figure 1: timing of maternal diagnosis for pregnancies to women living with HIV in England (2010-2011 to 2021-2022)
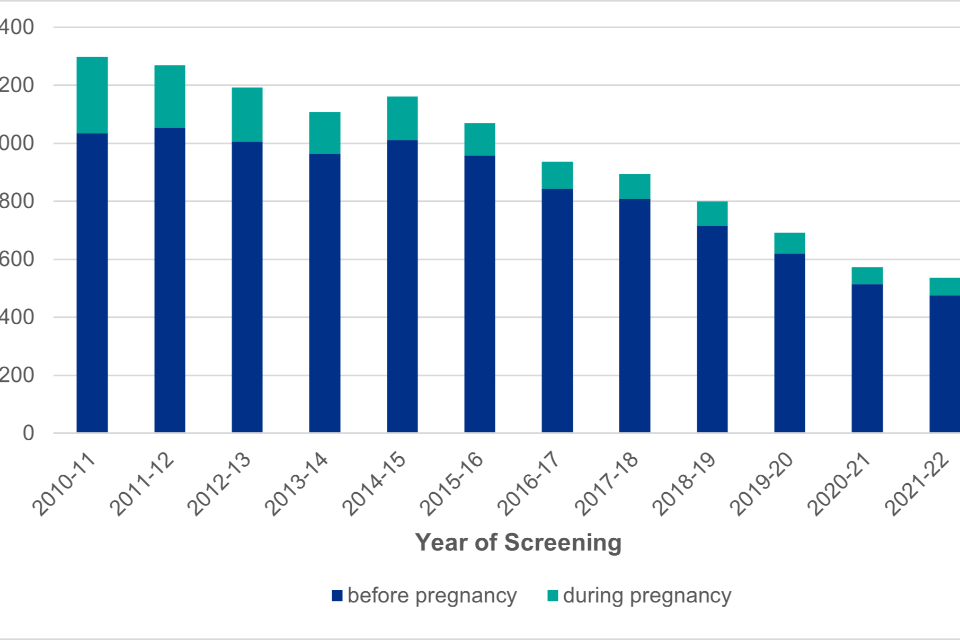
Figure 1 Note 1: data includes 1151 pregnancies with an estimated booking date. Booking date has been collected since 2008 and is a compulsory field since 2020.
Figure 1 is a bar chart showing the number of pregnancies in women living with HIV by timing of maternal HIV diagnosis. The proportion of women being diagnosed with HIV during their current pregnancy, as opposed to before pregnancy, shows an overall decrease over time.
4. Pregnancy management in women with HIV
Approximately half (48.6%) of women with HIV booked before 10 weeks gestation compared to 70.7% in the general population. A small proportion of women (47/536, 8.8%) booked after 20 weeks gestation, of whom almost third booked after 30 weeks gestation (15/47, 31.9%) (table 2). Nearly all women who booked after 30 weeks did so within 7 days of delivery (14/15, 93.3%) and less than 1% of all women (3/536, 0.6%) were unbooked for antenatal care and arrived in labour.
Table 2: gestation at booking
| Gestation at booking | Number of pregnancies | Percentage of pregnancies (%) | General population (%)(NHS Digital maternity statistics 2021 to 2022) |
|---|---|---|---|
| Less than 10+0 weeks | 251 | 46.8 | 70.7 |
| 10+0 weeks to 12+ 6 weeks | 154 | 28.7 | 25.5 |
| 13+0 weeks to 19+6 weeks | 84 | 15.7 | 6.7 |
| Equal to or more than 20+0 weeks (including those unbooked arriving in labour) | 47 | 8.8 | 3.3 |
| Total pregnancies | 536 | 100 | NA |
4.1 Transfers of care
Women who book at one maternity provider for antenatal care and change their maternity service provider during pregnancy (whether by choice or due to clinical need) are considered transfers of care. Among women who booked in 2021-2022, 7.3% (39/536) of women transferred care, compared to 9.1% in 2020-21. This includes women who unexpectedly delivered at another maternity provider, for example following an in-utero transfer with pending delivery for specialist neonatal services. Of the women who transferred care in pregnancy, 64.1% (25/39) were Black African and 15.4% (6/39) were White British. A smaller proportion of women who transferred care were diagnosed during pregnancy than those who were diagnosed before pregnancy (7.7% [3/39] versus 92.3% [36/39]). Between 2010-11 and 2019-20, the proportion of pregnancies where the woman transferred care increased from 5.9% to 10.0%.
4.2 Spotlight on mobility in pregnancy
Residential mobility (changing residential postcode between notification to ISOSS and delivery) and healthcare mobility (changing NHS maternity provider) were assessed to determine potential disruption to care. Between 2009 to 2019, healthcare mobility occurred in 8.1% of pregnancies, and residential mobility occurred in 19.6% of pregnancies. Over this period, residential mobility decreased (from 25.9% in 2009 to 9.3% in 2019), though increases in healthcare mobility have been observed. Women with healthcare mobility in pregnancy were more likely to have been born outside the UK, be diagnosed during pregnancy and have a detectable viral load at delivery. Higher proportions of infants were lost to care following mobile pregnancies than non-mobile pregnancies. Minimising the number of HIV-exposed infants lost to care before diagnosis is an important aspect of HIV prevention and care.
4.3 Region of booking
London continued to have the greatest number of bookings with 31.7% of women booking in the region (table 3), compared to 33.8% in 2020-21. The proportion of pregnancies booked in London has decreased over time with 45.6% booked in London in 2010-11. Concurrently, the proportion of pregnancies booked in the North West and North East regions have increased by 4.0% and 2.9% respectively from 2010-11 to 2021-22.
Table 3: region of booking
| Region of booking | Number of pregnancies | Percentage of pregnancies (%) |
|---|---|---|
| London | 170 | 31.7 |
| Midlands | 104 | 19.7 |
| East of England | 49 | 9.1 |
| North East and Yorkshire | 65 | 12.1 |
| North West | 60 | 11.2 |
| South West | 28 | 5.2 |
| South East | 60 | 11.2 |
| Total pregnancies | 536 | 100 |
Table 3 note 1: total proportion of pregnancies not equal to 100 due to rounding.
5. Maternal demographics
5.1 Maternal age
The median age at delivery was 35 years (interquartile range (IQR): 31 to 39 years), with 1 in 5 pregnancies among women aged 40 years or older in 2021-22 (table 4). This represents an increasing trend in maternal age over time, with 7.9% of all pregnancies in England in 2010-2011 among women aged 40 years or older and 18.1% in 2015-2016.
There were 18 IVF pregnancies in women living with HIV and more than half (10/18) were in women aged 45 years or older.
Table 4: maternal age at expected date of delivery
| Age group | Number of pregnancies | Percentage of pregnancies (%) |
|---|---|---|
| Less than 25 years | 24 | 4.5 |
| 25 to 29 years | 84 | 15.7 |
| 30 to 34 years | 151 | 28.2 |
| 35 to 39 years | 158 | 29.5 |
| 40 to 44 years | 96 | 17.9 |
| Equal to or more than 45 years | 23 | 4.3 |
| Total pregnancies | 536 | 100 |
Table 4 note 1: total proportion of pregnancies not equal to 100 due to rounding.
5.2 Ethnicity and world region of birth
In 2021-2022, most pregnancies were in women from Black African backgrounds (62.6%), a slight increase from 60.2% in 2020-2021 (table 5). Since 2010-2011, the proportion of pregnancies in women from Black African backgrounds had decreased from 76.9%. At the same time, pregnancies in women from White ethnic backgrounds had increased from 14.1% in 2010-2011 to to 21.7% in 2021-2022.
Overall, approximately 1 in 5 pregnancies in 2021-2022 were in women born in the UK (18.8%) which was similar to 2020-2021 (21.3%). Nearly two-thirds of pregnancies were in women who were born in Africa (64.5%) which was a slight increase compared to 2020-21 (61.5%). Women born in Eastern Europe represented 6.5% of pregnancies and they were mainly from Romania (55.6%) and Poland (16.7%) (table 6).
Most women from Black African ethnic backgrounds were born in Africa (95.5%) and most women from Asian ethnic backgrounds were born in Asia (88.2%). Women of Mixed ethnicity were mostly born in Africa (45.5%) and the UK (36.4%), whilst two-thirds of women from other White ethnic backgrounds were born in Eastern Europe (66.0%).
Of the women who were born outside of the UK, 6.8% arrived in the UK during their pregnancy and a further 7.9% in the year prior to conception (table 7). Fewer women arriving in the UK during their pregnancy were on treatment at conception (56.0%) than those who had arrived in the UK 5 years or more prior to conception (92.2%).
Table 5: ethnic origin
| Ethnicity | Number of pregnancies | Percentage of pregnancies (%) |
|---|---|---|
| Asian | 17 | 3.2 |
| Black African | 335 | 62.6 |
| Any other Black background | 34 | 6.4 |
| Mixed | 22 | 4.1 |
| White British | 69 | 12.9 |
| Any other White background | 47 | 8.8 |
| Other | 11 | 2.1 |
| Total pregnancies | 535 | 100 |
Table 5 note 1: data not reported for 1 pregnancy.
Table 5 note 2: total proportion of pregnancies does not equal 100 due to rounding.
Table 6: maternal world region of birth
| World region of birth | Number of pregnancies | Percentage of pregnancies (%) |
|---|---|---|
| Africa | 344 | 64.5 |
| Asia | 26 | 4.9 |
| Eastern Europe | 36 | 6.8 |
| UK | 100 | 18.8 |
| Rest of Europe | 9 | 1.7 |
| Other | 18 | 3.4 |
| Total pregnancies | 533 | 100 |
Table 6 note 1: data not reported for 3 pregnancies.
Table 6 note 2: total proportion of pregnancies does not equal 100 due to rounding.
Table 7: timing of UK arrival
| Timing of UK arrival | Number of pregnancies | Percentage of pregnancies (%) |
|---|---|---|
| Greater than 5 years before conception | 234 | 63.9 |
| 1-5 years before conception | 78 | 21.3 |
| Equal to or less than 1 year before conception | 29 | 7.9 |
| During pregnancy | 25 | 6.8 |
| Total pregnancies | 366 | 100 |
Table 7 note 1: data not reported for 67 pregnancies.
Figure 2: maternal region of birth by year of screening (2010-2011 to 2021-2022)

Figure 2 shows the proportion of pregnancies in women living with HIV by region of birth and screening year. The largest proportion of pregnancies across all years were in women born in Sub-Saharan Africa although this is decreasing over time, whilst the proportion of pregnancies to women born in Europe is increasing.
5.3 Parity
Overall, 76.0% of pregnancies were in women who had one or more previous births (table 8).
Table 8: parity
| Parity | Number of pregnancies | Percentage of pregnancies (%) |
|---|---|---|
| 0 | 125 | 24.0 |
| 1 | 196 | 37.7 |
| 2 or more | 199 | 38.3 |
| Total pregnancies | 520 | 100 |
Table 8 note 1: data not reported for 16 pregnancies.
5.4 Body Mass Index (BMI)
There were 356 pregnancies (68.9%, 356/517) where the woman had both booked by 12 weeks gestation and had a documented BMI. The median BMI at booking for women who booked by 12 weeks was 29.0 (interquartile range (IQR): 25.4 to 32.3). The healthy range for BMI at the start of pregnancy is 18.5-24.9; most women (77.2%) had a BMI of 25 or more where data were available (table 9). Information on other factors that may affect BMI such as level of physical activity are not collected by ISOSS.
Table 9: BMI at booking
| BMI group (kg/m2) | Number of pregnancies | Percentage of pregnancies (%) |
|---|---|---|
| Less than 18.5 | 5 | 1.4 |
| 18.5-24.9 | 76 | 21.4 |
| 25 – 29.9 | 120 | 33.7 |
| 30 – 39.9 | 137 | 38.5 |
| Greater than 40 | 18 | 5.1 |
| Total pregnancies | 356 | 100 |
Table 9 note 1: data restricted to 356 women who had booked for antenatal care by 12 weeks gestation and had height and weight available.
6. Social circumstances
6.1 Adverse social factors
There were socially complicating issues reported for 35.1% (171 out of 487 women with available information) of pregnancies, with multiple issues reported among 82 women (48.0%) (table 10a). Housing concerns affected 14.4% of pregnancies and mental health issues were reported in 13.3% (table 10b). These issues are likely to be underreported and only represent those known to healthcare professionals and/or disclosed by women during pregnancy.
Among women with multiple social or complicating factors reported, social service involvement was a recurring factor, reported for 88.2% of women with drug or alcohol misuse, 76.2% of women with mental health issues, 65.2% of women with housing concerns and 56.5% of women with immigration problems.
Table 10a: socially complicating issues
| Issue | Number of pregnancies | Percentage of pregnancies (%) |
|---|---|---|
| None | 316 | 64.9 |
| One or more social issue | 171 | 35.1 |
| Total pregnancies | 487 | 100 |
Table 10b: socially complicating issues breakdown
| Social / complicating factor | Number of pregnancies | Percentage of pregnancies (%) |
|---|---|---|
| Mental health issues | 65 | 13.3 |
| Housing concerns | 70 | 14.4 |
| Social services involvement | 63 | 12.9 |
| Immigration problems | 31 | 6.4 |
| Intimate partner violence | 27 | 5.5 |
| Drug or alcohol misuse | 21 | 4.3 |
| Sex work | 1 | 0.2 |
| Prison | 1 | 0.2 |
| Other † | 16 | 3.3 |
Table 10b note 1: more than one issue reported for some pregnancies.
Table 10b note 2: other category included known or suspected female genital mutilation (2), trafficking or slavery (2), disability (1), lack of support (3), stress (2).
Nearly two-thirds (62.1%) of women were reported as being employed (table 11). This was an increase from 56.4% of women in 2020-21. Nearly 1 in 5 (18.5%) women were reported as unemployed which was consistent with reported numbers in 2020-21 of 20.9%.
Table 11: employment status in pregnancy
| Employment status | Number of pregnancies | Percentage of pregnancies (%) |
|---|---|---|
| Employed (full or part time) | 316 | 62.1 |
| Home | 76 | 14.9 |
| Student | 18 | 3.5 |
| Sick | 3 | 0.6 |
| Unemployed | 94 | 18.5 |
| Voluntary | 2 | 0.4 |
| Total pregnancies | 509 | 100 |
Table 11 note 1: data not reported for 26 pregnancies
Information on the woman’s main source of support during pregnancy was reported as being a partner for 84.1% (426 out of 507), of which 66.5% (337 out of 507) were cohabiting and 17.6% (89 out of 507) were not cohabiting. Nearly 1 in 10 pregnant women (9.7%, 49 out of 507) were reported to have support from family or friends, whilst 5.7% (29 out of 507) reported having no support in pregnancy.
Table 12: main support in pregnancy
| Main support | Number of pregnancies | Percentage of pregnancies (%) |
|---|---|---|
| Partner (cohabiting) | 337 | 66.5 |
| Partner (not cohabiting) | 89 | 17.6 |
| Family or friend | 49 | 9.7 |
| Other | 3 | 0.6 |
| None | 29 | 5.7 |
| Total pregnancies | 507 | 100 |
Table 12 note 1: data not reported for 18 pregnancies.
Table 12 note 2: total proportion of pregnancies does not equal 100 due to rounding.
6.2 Language
English was spoken by nearly all women (91.4%, 490 out of 536), and was the first language for 258 women (52.7%, 258 out of 490).
Translation services were required for 8.9% (47 out of 527) of pregnant women where information was available. All but one woman who required translation services accepted and received a formal interpreter (97.7%, 43 out of 44), with one woman declining. There were 12 women (27.3%, 12 out of 44) who spoke English but required translation services during their maternity care, all of whom received a formal interpreter.
7. Screening pathway
7.1 Screen positive results
Most women (80.6%) were seen by the screening team within 10 days of the screen positive result being available to maternity services (table 12). This proportion of pregnancies seen within the 10-working day window was slightly lower in 2021-22 compared with 2020-21 (85.9%). A small number of women were seen more than 20 working days after a positive result (8.6%, 41 out of 479):
- 16 women experienced delays associated with COVID-19 including hesitation to attend hospital setting and staff absence/capacity
- 8 women did not attend their appointment
- 7 women requested to be seen face to face on the same day as their dating scan
- 2 women were not seen due to staff absence (unrelated to COVID-19)
Table 13: communication of confirmed screen-positive results
| Time to being seen by screening team | Number of pregnancies | Percentage of pregnancies (%) |
|---|---|---|
| 0 to 10 working days | 386 | 80.6 |
| 11 to 15 working days | 43 | 9.0 |
| 16 to 20 working days | 9 | 1.9 |
| Greater than 20 working days | 41 | 8.6 |
| Total pregnancies | 479 | 100 |
Table 13 note 1: data not reported for 57 pregnancies.
Table 13 note 2: total proportion of pregnancies does not equal 100 due to rounding.
Approximately 9 in 10 pregnant women living with HIV accessing maternity services were already aware of their status before pregnancy (table 14). Of the women diagnosed during pregnancy, 10 were diagnosed in the third trimester and 2 were diagnosed within 7 days of delivery.
Most pregnancies were in women where the reported risk factor for HIV acquisition was sexual (88.8%) (table 15). An increasing proportion of pregnancies were in women who had acquired HIV vertically themselves (see Spotlight on pregnancies to women with vertically acquired HIV, ISOSS HIV report 2022). In 2021-22, this route of maternal HIV acquisition accounted for 7.5% of pregnancies, compared to only 4.0% in 2016-17.
Table 14: timing of maternal diagnosis
| Timing of maternal diagnosis | Number of pregnancies | Percentage of pregnancies (%) |
|---|---|---|
| Before this pregnancy | 477 | 89.0 |
| During this pregnancy | 59 | 11.0 |
| Total pregnancies | 536 | 100 |
Table 15: risk factor for HIV acquisition
| Risk factor for HIV transmission | Number of pregnancies | Percentage of pregnancies (%) |
|---|---|---|
| Sexual | 356 | 88.8 |
| Vertical | 30 | 7.5 |
| Injecting drug use | 3 | 0.8 |
| Other | 12 | 3.0 |
| Total pregnancies | 401 | 100 |
Table 15 note 1: data not reported or not known for 135 pregnancies.
Table 15 note 2: total proportion of pregnancies does not equal 100 due to rounding.
Women were diagnosed through the antenatal screening programme, either in the current pregnancy or a previous pregnancy, in 41.9% of pregnancies (table 16). This was a slight decrease from 2020-21 where this accounted for 44.0% of pregnancies. There has been an increase in women diagnosed abroad from 8.2% in 2016-17 to 10.5% in 2020-21 and 13.9% in 2021-22. Among the 59 women diagnosed during their current pregnancy, information on setting of diagnosis was available for 56 women. Most women were diagnosed antenatally via the screening programme (87.5%, 49/56) and a small proportion were diagnosed via sexual health services (8.9%, 5/56) prior to entering the screening programme.
Table 16: setting of diagnosis
| Setting of diagnosis | Number of pregnancies | Percentage of pregnancies (%) |
|---|---|---|
| Antenatal | 178 | 41.9 |
| Sexual health services | 118 | 27.8 |
| General Practice (GP) | 18 | 4.2 |
| Other hospital department | 41 | 9.7 |
| Tested abroad | 59 | 13.9 |
| Other | 11 | 2.6 |
| Total pregnancies | 425 | 100 |
Table 16 note 1: data not reported for 111 pregnancies.
Table 16 note 2: total proportion of pregnancies does not equal 100 due to rounding.
8. Clinical management
8.1 Timing of antiretroviral therapy (ART)
Women were on ART antenatally in 98.5% (523 of 531) of pregnancies (table 17). Most women who were diagnosed with HIV before pregnancy were on treatment prior to conception (95.1%, 446 out of 469 with available information on both timing of diagnosis and ART) with a small proportion of women commencing or recommencing ART during pregnancy (4.9%, 23 out of 469 pregnancies). Among women already diagnosed and starting treatment in pregnancy, half started in the first trimester with median time of ART start was 11.9 gestational weeks (IQR: 8.7-24). Among women diagnosed during pregnancy, a quarter started ART in the first trimester and median start time was 15.6 gestational weeks (IQR: 12.6-22.7) (table 17). Eight women did not receive ART in pregnancy:6 were miscarriages and 2 terminations of pregnancy. Among these 8 pregnancies, one woman was an elite controller, 3 women were not engaging with care, 3 were early miscarriages/TOPs before treatment could be established and 1 was a maternal HIV-related death where screening was declined and known positive status not disclosed.
Table 17: timing of ART initiation
| All pregnancies | Women diagnosed prior to pregnancy | Women diagnosed during pregnancy | ||||
|---|---|---|---|---|---|---|
| Timing of ART start | Number of pregnancies | Percentage of pregnancies (%) | Number of pregnancies | Percentage of pregnancies (%) | Number of pregnancies | Percentage of pregnancies (%) |
| Prior to pregnancy | 446 | 84.0 | 446 | 94.3 | ||
| First trimester | 29 | 5.5 | 13 | 2.7 | 16 | 27.6 |
| Second trimester | 36 | 6.8 | 7 | 1.5 | 29 | 50.0 |
| Third trimester | 12 | 2.3 | 3 | 0.6 | 9 | 15.5 |
| No treatment | 8 | 1.5 | 4 | 0.8 | 4 | 6.9 |
| Total pregnancies | 531 | 100 | 473 | 99.9 | 58 | 100 |
Table 17 note 1: data not reported for 5 pregnancies.
Table 17 note 2: total proportion of pregnancies does not equal 100 due to rounding.
Figure 3: timing of maternal diagnosis and ART
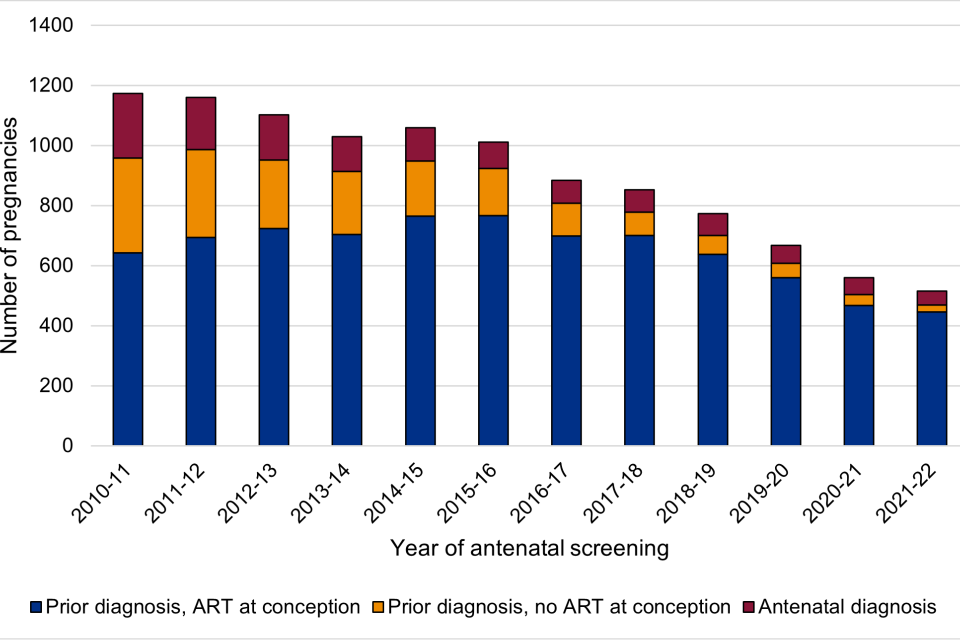
Figure 3 shows the number of pregnancies to women who were diagnosed prior to pregnancy and whether they were on ART at conception or not, and women diagnosed during their current pregnancy.
8.2 Antiretroviral therapy in pregnancy
Among the 98.5% of pregnancies where women were on ART, nucleoside reverse transcriptase inhibitor (NRTI) use was reported in nearly all (97.1%, 510 out of 525 pregnancies with available information). The most common NRTI backbones received were tenofovir disoproxil fumarate (TDF) plus emtricitabine (FTC) and abacavir (ABC) plus lamivudine (3TC).
The most common third agent drug class was integrase inhibitors (INSTI), used in 49.3% (259 out of 525) of pregnancies. A similar proportion of pregnant women received protease inhibitors (PI) (31.2%, 164 out of 525) and non-nucleoside reverse transcriptase inhibitors (NNRTI) (29.1%, 153 out of 525) in pregnancy.
The proportion of pregnancies where women received a PI drug decreased steadily from 68.7% in 2010-11 to 31.2% (164/525) in 2021-22, whilst the proportion of pregnancies to women who received an INSTI drug increased steadily from 4.6% in 2010-11 to 39.3% (226/525) in 2021-22. This is consistent with the trend in the treatment of all adults with HIV. Cobicistat was used in 45 pregnancies, all of which were in women on treatment at conception.
Figure 4: Antiretroviral third agent drugs received during pregnancy (2021-2022)
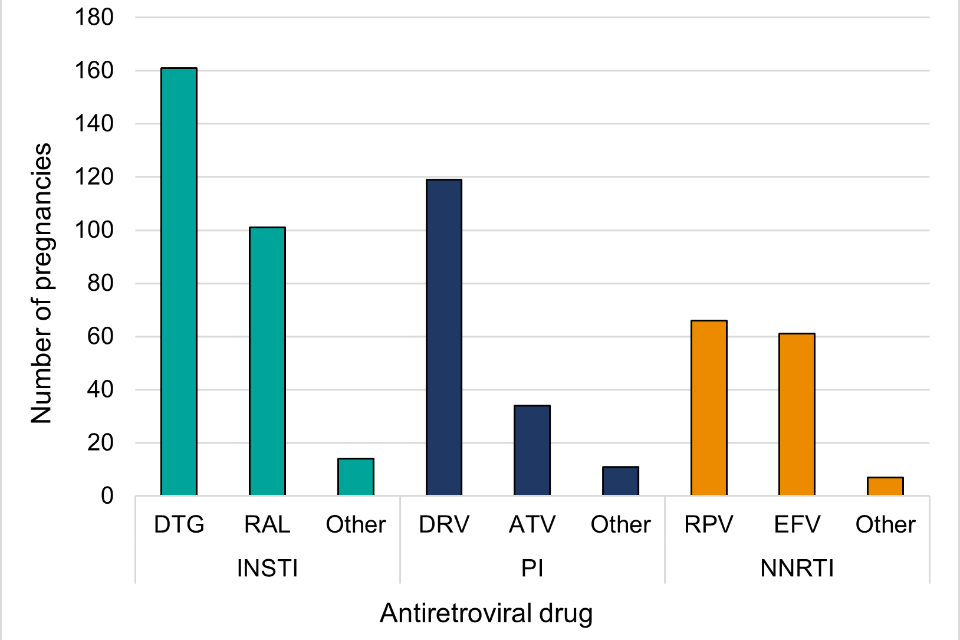
Figure 4 note 1: DTG = dolutegravir; RAL = raltegravir; DRV = darunavir; ATV = atazanavir; RPV = rilpivirine; EFV = efavirenz.
Figure 4 shows antiretroviral third agent drugs received during pregnancy in 2021-2022 by drug class.
8.3 Spotlight on women diagnosed before pregnancy and not on ART at conception.
Between 2016 and 2020, there were 3,586 pregnancies among women with a diagnosis of HIV prior to conception. Of these pregnancies, 87.2% (3,128 of 3,586) conceived on ART, and 11.0% (396 of 3,586) conceived not on ART, and 1.7% (62 or 3,586) where ART use at conception was not known. The overall number of pregnancies to women living with HIV in the UK reduced from 870 in 2016 to 561 in 2020, with an increase in the proportion of pregnancies being conceived on ART from 82.6% in 2016 to 92.2% in 2020 (figure 3). Younger maternal age was associated with an absence of ART use at conception, with women 20-24years of age more likely to conceive whilst not on ART, and those over 40years being more likely to be on treatment (19.5% vs 8.4% not on ART at conception, (p<0.05)). Ethnicity was associated with ART use at conception (p<0.05), with women of Black Caribbean and Black Other ethnicity representing a higher proportion of women not on ART (18.4% of Black Caribbean and 18.4% of Black Other). Women conceiving whilst not on ART accessed antenatal care later in pregnancy with 31.1% (123 of 396) of women not booking until after 13 weeks gestation, compared to only 22.3% (696 of 3128) where women were on ART, (p<0.05). Further work on this topic will be undertaken to include a larger cohort and multivariable analysis.
9. Clinical characteristics
A normal CD4 count is considered to be over 500 cells per mm3. When a CD4 count falls below 200 cells per mm3, there is a risk of opportunistic AIDS defining infections and other illnesses. In general, CD4 monitoring is not required for individuals with a CD4 count above 350 cells/mm3 if on suppressive ART. The recommendation from the British HIV Association Pregnancy guidelines is that a CD4 count is measured in all pregnancies, as a minimum, at the earliest point in pregnancy and at delivery.
There were 430 CD4 counts reported for pregnancies in women who booked 2021-22 and 116 pregnancies (19.8%) where no CD4 count was reported. Of those with a reported CD4 count, 84.0% (361 out of 430) CD4 counts were measured in pregnancy, with the remainder measured within the year prior to conception. The first CD4 count in pregnancy was equal to or more than 500 cells per mm3 for 54.9% of women (table 18), which was consistent with the proportion of pregnancies with a normal CD4 count in 2020 (54.2%) and a small increase from 52.7% in 2016-17. The proportion of pregnant women with a CD4 count <200 cells per mm3 was 12.5% in 2021-22, higher than reported in 2020-21 (7.8%). A higher proportion of women with a CD4 count <200 cells per mm3 in pregnancy were diagnosed before pregnancy compared to during (66.7% versus 33.3%).
Table 18: first CD4 count in pregnancy
| First CD4 count in pregnancy (cells per mm3) | Number of pregnancies | Percentage of pregnancies (%) |
|---|---|---|
| Equal to or more than 500 | 198 | 54.9 |
| 350 to 499 | 78 | 21.6 |
| 200 to 349 | 40 | 11.1 |
| Less than 200 | 45 | 12.5 |
| Total pregnancies | 361 | 100 |
Table 18 note 1: data not reported for 116 pregnancies.
Table 18 note 2: total proportion of pregnancies does not equal 100 due to rounding.
Table 18 note 3: 64 reported CD4 counts were taken pre-pregnancy.
At least one viral load measurement in pregnancy was reported to ISOSS for 97.9% (525/536) of pregnancies. In the remaining 11 pregnancies where a viral load was not reported, 3 women had viral loads done but details from sexual health were not available, 1 woman left the country shortly after booking and 7 women miscarried or terminated the pregnancy before viral loads were taken. Over three-quarters (77.3%) of women had an undetectable viral load (<50 copies/ml) at first measurement in pregnancy, table 19. This proportion was similar to that seen in pregnancies booked in 2020-21 (78.6%). A first viral load greater than or equal to 10,000 copies/ml was reported for 8.2% of pregnant women, with 55.8% (24/43) of these being to women with diagnosed during pregnancy, with this viral load measurement usually occurring before or at the time that ART was started.
Table 19: first viral load in pregnancy
| First viral load in pregnancy (copies per ml) | Number of pregnancies | Percentage of pregnancies (%) |
|---|---|---|
| Equal to or less than 50 | 406 | 77.3 |
| 51 to 399 | 40 | 7.6 |
| 400 to 999 | 11 | 2.1 |
| 1,000 to 9,999 | 25 | 4.8 |
| Equal to or more than 10,000 | 43 | 8.2 |
| Total pregnancies | 525 | 100 |
Table 19 note 1: data not reported for 11 pregnancies.
9.1 Coinfections
Data on concurrent infections were available for almost all pregnancies in 2021-22 (527 out of 536), with 6.3% of pregnant women affected by viral hepatitis or syphilis (33/527) (table 20). Hepatitis B was reported in 3.2% of pregnancies, a slight decrease from 4.0% in 2020-21. Syphilis and hepatitis C were both reported in 1.5% (8 out of 527) of pregnant women respectively.
Table 20: Coinfection in pregnancy
| Coinfections in pregnancy | Number of pregnancies | Percentage of pregnancies (%) |
|---|---|---|
| Syphilis | 8 | 1.5 |
| Hepatitis B | 17 | 3.2 |
| Hepatitis C | 8 | 1.5 |
Table 20 note 1: data not reported for 9 pregnancies.
Table 20 note 2: 2 women had more than one coinfection (hepatitis B and syphilis).
10. Pregnancy outcome
Among the 536 pregnancies booked in 2021-22, 465 (86.8%) resulted in the livebirths of 475 infants (including multiple births), and 4 (0.8%) stillbirths (table 21). The stillbirth rate for bookings in 2021-22 was 8.32 per 1000 births (95% confidence interval: 2.27-21.15 per 1000 births). In the 5-year interval of 2016-17 to 2020-21, the stillbirth rate was 6.3 per 1000 births (95% confidence interval: 4.0-9.5 per 1000 births). ISOSS conduct data linkage with MBBRACE-UK on all stillbirths, neonatal deaths and maternal deaths to ensure comprehensive surveillance, and providing an opportunity to enrich understanding of these cases.
Table 21: outcome per pregnancy
| Pregnancy outcome | Number of pregnancies | Percentage of pregnancies (%) |
|---|---|---|
| Livebirth | 465 | 86.8 |
| Stillbirth | 4 | 0.8 |
| Miscarriage | 47 | 8.8 |
| Termination | 9 | 1.7 |
| Left UK before delivery | 5 | 0.9 |
| Lost to follow-up before delivery | 6 | 1.1 |
| Total pregnancies | 536 | 100 |
Table 21 note 1: miscarriages are restricted to pregnancies where women had booked for antenatal care..
Table 21 note 2: total proportion of pregnancies does not equal 100 due to rounding.
10.1 Mode of delivery
The proportion of women having a vaginal delivery remained stable at approximately 35% since 2015-16. There has been a slight increase in the proportion of emergency caesarean sections since 2015-16 from 22.8% to 26.5% in 2021-22 (figure 5 & table 22).
Figure 5: mode of delivery over time

Figure 5 note 1: data presented for pregnancies resulting in a livebirth or stillbirth. Multiple pregnancies are counted once (per pregnancy, not per infant).
Figure 5 is a stacked area chart showing the mode of delivery for pregnant women by screening year over the last ten screening years.
Table 22: mode of delivery per pregnancy
| Mode of delivery | Number of deliveries | Percentage of deliveries (%) | Percentage of deliveries in the general population in England (2021 to 2022) (NHS Digital Maternity Statistics) |
|---|---|---|---|
| Vaginal | 206 | 44.0 | 62.6 |
| Elective caesarean | 138 | 29.5 | 15.5 |
| Emergency caesarean | 124 | 26.5 | 19.7 |
| Total deliveries | 468 | 100 | NA |
Table 22 note 1: data not reported for one pregnancy on mode of delivery.
Table 22 note 2: data reported for pregnancies resulting in a livebirth or stillbirth (registerable birth). Multiple pregnancies are counted once (per pregnancy, not per infant).
10.2 Pregnancy complications
Data are specifically requested on pre-eclampsia and gestational diabetes on the pregnancy outcome data collection form. Pre-eclampsia was reported in 2.2% of deliveries, which was significantly lower than 2020-21 where 5.6% of deliveries had reported pre-eclampsia. Gestational diabetes was reported for 11.0% of deliveries (table 23), similar to the proportion in 2020-21 (11.6%), but was consistent with an overall increase since 2016-17 from 5.9%). More than half of women with reported gestational diabetes in 2021-22 had a BMI greater than 30 (54%, 27 out of 50 women), which was significantly more than women without reported gestational diabetes (39%, 156 out of 397).
Table 23: pregnancy complications
| Pregnancy complication | Number of deliveries | Percentage of deliveries (%) |
|---|---|---|
| Pre-eclampsia | 10 | 2.2 |
| Gestational diabetes | 50 | 11.0 |
| Total deliveries | 456 |
Table 23 note 1: data not reported for 13 deliveries.
10.3 Viral load at delivery
There were 526 pregnancies (98.1%, 526 out of the 536 pregnancies) where a maternal viral load was reported, and 383 (72.8%, 383/526) of these were in women with viral load measured within 30 days prior to and 7 days after delivery (‘delivery viral load’). BHIVA guidelines state that maternal viral load should be monitored at 36 weeks and delivery to inform decisions around mode of delivery, additional ART in pregnancy and at delivery, and clinical management of the infant (reference BHIVA guidelines). Maternity providers are required to specify if the 36-week viral load test was conducted as a mandatory data point (implemented in 2023).
Of pregnancies with a delivery viral load reported, this was undetectable (≤50 copies/ml) in 91.1% (table 24), which reflects the high coverage of ART in pregnancy. There was a detectable level of virus (9%, 34 out of 383) in approximately 1 in 10 delivery viral load results and 23.5% (8/34) delivered preterm (<37 gestational weeks). Of the women with detectable viral loads, 14 had reported social complicating issues and 6 had booked within 6 weeks of delivery.
Table 24: viral load at delivery
| Number of deliveries | Percentage of deliveries (%) | |
|---|---|---|
| Equal to or less than 50 copies per ml | 349 | 91.1 |
| 51 to 399 copies per ml | 20 | 5.2 |
| Equal to or more than 400 copies per ml | 14 | 3.7 |
| Total deliveries | 383 | 100 |
Table 24 note 1: data not reported for 10 deliveries.
Table 24 note 2: viral load not taken within the reporting timeframe (30 days prior to and 7 days post-delivery) for 143 deliveries.
Table 24 note 3: data only collected on pregnancies resulting in a livebirth or stillbirth.
10.4 ART at delivery
Additional ART was given to women during labour and delivery in 5.2% (23 out of 446, data not reported for 90 deliveries) of pregnancies and of those women who received ART 21.7% (5/23) delivered preterm. Some of the reported indications for additional ART were:
- detectable viral load at delivery (14 deliveries)
- late diagnosis in pregnancy (2)
- concerns around viral load in pregnancy, i.e. detectable in pregnancy (3)
- unknown (4)
Additional ART given included:
- intravenous azidothymidine (IV AZT) in (12)
- IV AZT and nevirapine (5)
- Nevirapine and raltegravir (1)
- Nevirapine and dolutegravir (1)
- not reported (4)
11. Infant outcomes
11.1 Gestation at delivery and birthweight
There were 479 births in 2021-2022 and preterm delivery (less than 37 weeks gestation) occurred in 10.4% of deliveries, with 4.6% of all deliveries occurring before 34 weeks gestation (table 25). Fewer deliveries were preterm in 2021-22 compared to 2020-21 when the preterm delivery rate was 13.0%, however this remains higher than in the general population where the reported rate was 7.6% in 2021 . Among preterm deliveries, the median gestational age was 34 weeks (Q1: 30, Q3: 36 weeks).
The proportion of infants with a low birthweight (less than 2.5 kg) was 10.8% with 3.1% of all infants born to women living with HIV weighing less than 1.5 kg (very low birthweight) (table 26). The proportion of infants with low birthweight was lower in 2021-22 compared to 2020-21 when it was 14.4%.
Table 25: gestational age at delivery
| Gestational age (completed weeks gestation) | Number of infants | Percentage of infants (%) |
|---|---|---|
| Greater than or equal to 37 | 429 | 89.6 |
| Late preterm (33-36 weeks) | 28 | 5.9 |
| Very preterm (28-32 weeks) | 18 | 3.8 |
| Extremely preterm (<28 weeks) | 4 | 0.8 |
| Total infants | 479 | 100 |
Table 25 note 1: table includes all liveborn and still born infants.
Table 26: birthweight
| Birthweight | Number of infants | Percentage of infants (%) |
|---|---|---|
| Equal to or more than 4.0 kg | 23 | 4.8 |
| 2.5 to 3.9 kg | 403 | 84.3 |
| 1.5 to 2.4 kg | 37 | 7.7 |
| Less than 1.5 kg | 15 | 3.1 |
| Total infants | 478 | 100 |
Table 26 note 1: data not reported for 1 infant.
11.2 Congenital conditions
Among livebirths and stillbirths, 18 out of 479 (3.8%, 95% confidence interval: 2.2% to 5.9%) had reported congenital conditions, defined using the International Statistical Classification of Diseases and Related Health Problems 10th revision (ICD-10). Among these, 6 had multiple conditions reported. Among all livebirths, two (0.4%) resulted in a neonatal death within 28 days of birth.
11.3 Infant postnatal prophylaxis (PNP)
BHIVA guidelines state that infant PNP should be started based on a risk stratification system with respect to vertical transmission; two weeks of zidovudine (AZT) for those meeting the criteria for very low risk, 4 weeks of zidovudine for those who are low risk, and triple therapy for those at high risk (BHIVA guidelines, section 9.1). Information on infant PNP is collected on maternity outcome and paediatric notification forms, with duration of infant PNP reported only by paediatric respondents (figure 6).
There were 475 livebirths in 2021-2022, of whom 473 infants were given PNP and 2 infants were not. Data were available on the medications administered as part of PNP for almost all infants (98.7%, 467 out of 473), with duration available for 70.2% (328 out of 467). The majority of infants received oral zidovudine (AZT) (91.8%, 436 out of 475), and of the 436 infants who received oral AZT, duration of treatment was available for 276 infants. Among the 276 infants who received oral AZT and had a reported duration, 188 (68.1%, 188 out of 276) were on treatment for 14 days and 88 (31.9%, 88 out of 276) were on treatment for 28 days. There were 32 infants who received triple therapy as part of infant PNP with most (68.8%, 22 out of 32) receiving a combination of AZT, lamivudine (3TC) and nevirapine (NVP) (figure 6).
Figure 6: breakdown of infant PNP details from maternity and paediatric surveillance

Figure 6 note 1: Acronyms: PNP = postnatal prophylaxis; AZT = Zidovudine; IV AZT = intravenous Zidovudine; 3TC = Lamivudine; NVP = Nevirapine; DTG = Dolutegravir; RAL = Raltegravir; LPV/r = Lopinavir (ritonavir- boosted).
12. HIV and breastfeeding 2012 to 2022
Data on supported breastfeeding among women living with HIV have been collected since 2012. Information is collected on infant feeding plans at booking and at the point of delivery. Breastfeeding is confirmed using linked paediatric reports of children born to women living with HIV, with additional data collection for all cases of confirmed supported breastfeeding.
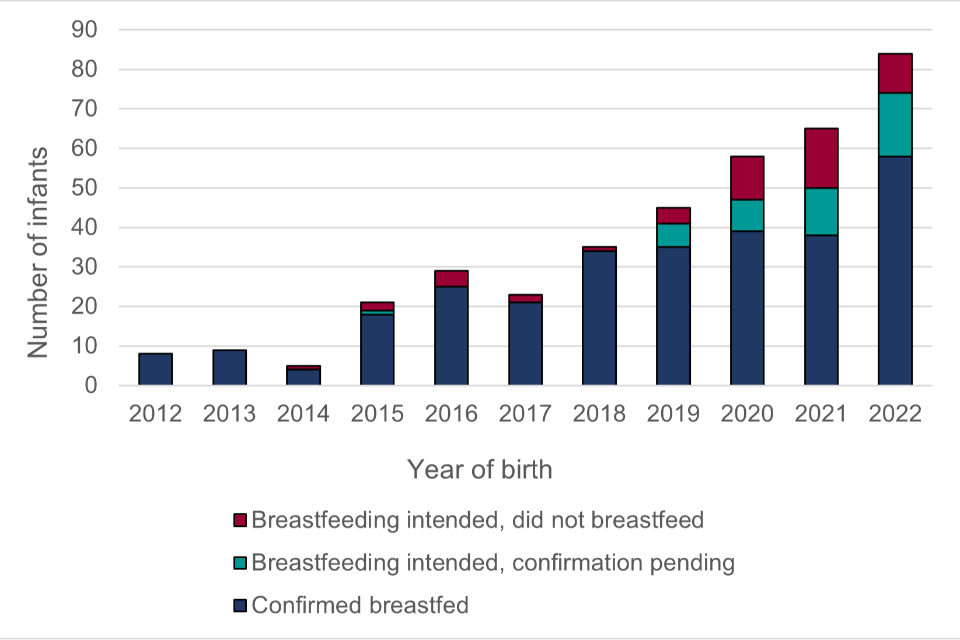
Supported breastfeeding was intended and/or confirmed in 382 infants born in the period 01 January 2012 to 31 December 2022 to women living with HIV and reported to ISOSS by September 2023.
Figure 7 shows the status of the 382 reported infants with intended and/or confirmed supported breastfeeding by year of delivery. By September 2023, supported breastfeeding was confirmed using linked paediatric reporting in 289 out of the 382 infants. Of the remaining 93 infants, 50 were not breastfed despite an intention to breastfeed being indicated at either booking or delivery, and 43 had a reported plan to breastfeed at delivery but confirmation was pending.
Figure 7: Reports of intended and /or confirmed supported breastfeeding, 2012-2022
12.1 Maternal characteristics in supported breastfeeding
Confirmed supported breastfeeding took place following 285 deliveries among 247 women (247 women include those who breastfed in more than one pregnancy and/or twins). Most (94.7%) instances of supported breastfeeding were by women known to be living with HIV prior to pregnancy. Women who were born abroad made up 85.2% of confirmed reports, with the majority born in sub-Saharan Africa. Of those born abroad, 28.9% were born in Nigeria and 24.8% were born in Zimbabwe. The majority (80.5%) of women were black African, and 11.4% were white. The median age at delivery was 36 years (IQR: 32 to 39 years).
Sexual partners (where applicable) were unaware of the woman’s HIV status in 18.1% of pregnancies whilst GPs were unaware in 6.5%.
Reasons for wanting to breastfeed are based on information gathered during routine clinical care. Table 27 shows the reasons reported for pregnancies where women were supported to breastfeed. The most commonly reported reasons were bonding (72.6% of pregnancies) and health benefits (60.1% of pregnancies).
Table 27: Reasons for wanting to breastfeed
| Reason | Number of pregnancies with reason reported | Percentage of pregnancies with reason reported |
|---|---|---|
| Bonding | 175 | 72.6 |
| Health benefits | 146 | 60.1 |
| Family or friends’ expectations or pressure | 63 | 26.1 |
| Disclosure concerns | 70 | 29.1 |
| Previously breastfed since diagnosis | 58 | 24.1 |
| Previously breastfed before diagnosis | 32 | 13.3 |
| Concerns about finance | 11 | 4.6 |
| Other/additional reason | 13 | 5.4 |
| Total pregnancies | 241 | - |
Table 27 note 1: some had multiple reasons reported.
Table 27 note 2: data not reported for 44 pregnancies.
12.2 Feeding patterns, clinical monitoring, and infant outcomes
Breastfeeding was reported to have stopped by September 2023 for 257 out of the 289 confirmed breastfed infants. In other cases, breastfeeding was either ongoing (5), data collection was still in progress (11), or the status was reported to be not known (16).
Where breastfeeding had stopped, the total duration of breastfeeding ranged from less than one day to 2.5 years, with a median duration of 70 days (IQR: 24 to 159) (duration data were missing for 2 instances of supported breastfeeding). Overall, 18.8% (48 out of 255) of infants were breastfed for less than or equal to 7 days, and 87.1% (222 out of 255) were breastfed for less than or equal to 6 months. Breastfeeding stopped following evidence of maternal HIV viraemia in 13 infants.
BHIVA guidelines state that all women supported to breastfeed and their infants should undergo monthly clinical monitoring, regardless of maternal virological suppression. Monthly clinical monitoring per BHIVA guidelines was not applicable for 88 (34.2%) of the 257 mother-infant pairs due to short breastfeeding duration. Table 28 summarises monthly clinical monitoring of the 169 mother-infant pairs where this was applicable. Attendance issues with clinical monitoring (e.g., missed or cancelled appointment(s), overseas travel, etc.) were reported in 44 (72.1%) of the 61 pairs where monthly testing did not occur. Mothers of 10 infants had documented lactational mastitis during the breastfeeding period.
Table 28: Monthly clinical monitoring where applicable (where breastfeeding had stopped)
| Monthly monitoring occurred | Number of pairs | Percentage of pairs (%) |
|---|---|---|
| Yes | 103 | 60.9 |
| No | 61 | 36.1 |
| Not known | 5 | 3.0 |
| Total pairs | 169 | 100 |
Tale 28 note 1: ‘No’ indicates one or more monthly monitoring visits did not occur.
Table 29 summarises infant HIV status by the end of September 2023 where breastfeeding was known to have stopped. To date, there have been no vertical transmissions among mother-infant pairs supported to breastfeed. However, historically, there have been instances of vertical transmission attributed to breastfeeding where clinicians were unaware of the feeding choices/practices.
Table 29: infant infection status (where breastfeeding had stopped)
| Infant HIV infection status | Number of infants | Percentage of infants (%) |
|---|---|---|
| Uninfected | 255 | 99.2 |
| Indeterminate | 2 | 0.8 |
| Total infants | 257 | 100 |
13. Vertical transmissions
Vertical transmission is the passage of a pathogen or infection from woman to infant during pregnancy, at birth or through breastfeeding.
The HIV vertical transmission rate and infant follow-up is presented in 2-year intervals for infants born 2 years prior to the year this report is published. Data are presented in 2-year intervals to reduce the risk of disclosure and are presented by year of birth. This accommodates the confirmatory antibody test used to establish infant infection status at 18 to 24 months of age.
Figure 8: vertical transmission rate by year of birth for infants born to diagnosed women in England

Figure 8 shows the vertical transmission rate for England by infant year of birth for the period 2000 to 2021. The vertical transmission rate has been below 0.4% in England since 2012, reducing from 2.86% (71 of 735) in 2000 to 2001.
There were 3 known vertical transmissions among 841 singleton infants with known HIV status born in the calendar years 2020 and 2021 born to women with a known HIV diagnosis by delivery, with a vertical transmission rate of 0.36% (95% CI 0.07% to 1.0%). Two of these 3 pregnancies were in women diagnosed with HIV before pregnancy and one where there was an antenatal diagnosis. One of the 3 was to a woman who screened negative at booking and then diagnosed later in pregnancy. Both women diagnosed before pregnancy were on treatment at conception but had issues with engagement and adherence during pregnancy. All children living with HIV seen for paediatric care in England are followed up by the Children’s HIV and AIDS Reporting System (CHARS). The first annual CHARS report will be published in 2024 focusing on clinical outcomes and quality of care for children seen for care in 2022.
13.1 Infant follow-up
Among 912 children born to women living with HIV from 1 January 2020 to 31 December 2021 and reported to ISOSS, 3 were diagnosed with HIV (see above) and all were in CHARS follow-up receiving paediatric HIV follow-up care in England.
There were 862 children reported as uninfected. Four of these infants were known to have died.
HIV status is indeterminate for 47 infants (5.2%) at last follow-up. Among these:
- 28 were still in paediatric follow-up pending final antibody report
- 6 were lost to follow-up
- 2 were known to have left the UK
- 4 were discharged without final infection status
- 7 were known to have died (4 were neonatal deaths)
14. HIV vertical transmission clinical expert review panel (CERP)
All children diagnosed with HIV and seen for paediatric care in England are reported to ISOSS. This includes children who have acquired HIV vertically. These children are born to women who are either:
- known to be living with HIV during pregnancy (captured in the routine maternity surveillance)
- diagnosed after their pregnancy (not known to maternity surveillance)
Additional data collection takes place for all HIV vertical transmissions in England, producing anonymised care summaries that are reviewed by the CERP. The panel consists of the NHSE IDPS screening programme team, alongside maternity, laboratory, paediatric, sexual health and other clinical specialists.
The purpose of the panel is to:
- establish the circumstances surrounding the transmission
- identify any contributing factors and learning points
- feed findings into the IDPS advisory group to inform national guidelines and policy
No CERP meeting has been held since November 2022 so there is no update on CERP investigations. To date 156 transmissions have been reported and discussed by the CERP. Two-thirds of children were born to women diagnosed after pregnancy. Contributing factors among recently reported transmissions included seroconversion during pregnancy or breastfeeding following a confirmed negative antenatal test, issues with adherence to treatment, breastfeeding where clinicians were unaware and booking at more than 20 weeks gestation or being unbooked for antenatal care. See last year’s report for an overview of cases.
Figure 9: all reported vertical transmissions (2006 to 2021) by timing of maternal diagnosis and year of birth

Figure 9 shows all 156 vertical transmissions reported to ISOSS to date. Note that reporting may occur years after birth – 108 transmissions were reported by 2014, 35 were reported between 2014 and 2020 and 13 were reported between 2020 and 2021.
15. Summary and next steps
The rate of HIV vertical transmission in England remains low, reflecting effective antenatal screening and clinical management. Findings from CERP discussions show that among cases of vertical transmission, late antenatal booking and poor engagement with care continue to be key issues.
The number of pregnancies in women living with HIV is declining, with the majority of pregnant women already diagnosed before pregnancy and on treatment at conception. Of women diagnosed during pregnancy, most were diagnosed through antenatal screening. Nearly 1 in 5 pregnancies are now to women born in the UK or Ireland. Maternal age is increasing and the average BMI at booking is above the normal range, both of which have implications for clinical management and risk of pregnancy complications. Adverse social factors contributing to inequalities continue to affect some pregnant women living with HIV, with housing concerns, mental health issues and social services involvement being the most frequently reported issues.
Almost all women received ART during pregnancy and 91% had an undetectable viral load at delivery. There have been important shifts in ART regimens used in pregnancy, with a decline in use of PIs in favour of drugs from the INSTI class. Dolutegravir was used in nearly a third of pregnancies in 2021-2022. A high proportion of infants born to women living with HIV received infant PNP regimens for low-transmission risk, reflecting high coverage and effectiveness of antenatal ART. ISOSS will continue to monitor patterns and trends in ART in pregnancy and infant PNP alongside clinical outcomes.
A small but increasing number of women living with HIV are choosing supported breastfeeding over formula feeding, most of whom were born abroad and diagnosed before pregnancy. No transmissions have been reported to date where breastfeeding has been supported, although breastfeeding or follow-up was still ongoing for a number of infants at the time of analysis.
ISOSS continue to monitor key areas of interest, such as mobility in pregnancy, clinical practice around provision of infant PNP, and supported breastfeeding. Additionally, ISOSS data are routinely linked to NHS England data on civil registrations for cancers and deaths to monitor long-term outcomes of infants exposed to HIV and to MBRRACE to understand perinatal, neonatal, and maternal mortality outcomes.
By working closely with valued maternity and paediatric respondents across the country, ISOSS is able to provide high quality and timely data to inform clinical guidelines and the national screening programme.
16. Background
16.1 Data collection processes
ISOSS HIV surveillance has been running for over 30 years, syphilis surveillance commenced in 2020 and hepatitis B in 2021. Figure 6 shows the timeline of data collection by ISOSS during pregnancy and after the baby is born. There are 6 data collection points.
16.2 Data validation
The team who deliver ISOSS conduct detailed matching of data reports across pregnancies and paediatric reports. The data reports consist of complex clinical data and there are a number of data quality checks in place. Validations are in place for incoming reports and data are checked at each stage and queried directly with respondents where inconsistencies are identified, or data are missing.
16.3 Reporting timeline
Figure 6. Reporting timeline for ISOSS data collection for women during pregnancy and infants after birth
- Green Card reporting (from approx. 12 wks. gestation): all HIV, syphilis and hepatitis B screen positive pregnancies booked for antenatal care in the last quarter are reported to ISOSS. The green card can be edited throughout the quarter, but the submission happens at the end of a quarter.
- Pregnancy notification form (from approximately 12 weeks gestation): initial details of pregnant woman, care in pregnancy and pregnancy status. This form is generated for each woman following the submission of the green card.
- Pregnancy outcome form (birth): woman’s delivery details and initial care of the infant recorded and reported. This form is available around the expected date of delivery but can be released earlier on request in cases of premature birth.
- Paediatric notification form (1 to 6 months after birth): initial details and test results of infants seen for HIV (3 to 6 months) and syphilis (1 to 2 months) paediatric follow-up. Generated using maternity reports where possible. *Diagnosed children reported to ISOSS at any age when seen for paediatric care.
- Paediatric syphilis follow up form (3 to 6 months after birth): generated for all infants born to women treated for syphilis in pregnancy and/or infants requiring treatment for syphilis until discharged.
- Paediatric HIV follow up form: generated for all HIV-exposed infants requesting 22-24 month confirmatory antibody test to establish infection status.
- Paediatric HBV follow up (12 to 13 months after birth): data linkage with UK Health Security Agency’s (UKHSA) Immunisation, Hepatitis and Blood Safety team.
17. HIV Clinical Expert Review Panel members
The current IDPS HIV CERP members are:
- Dr Alasdair Bamford, Consultant and Speciality Lead in Paediatric Infectious Diseases, GOSH
- Lisa Bullows, Specialist Screening Midwife, Birmingham Women’s Hospital
- Dr Laura Byrne, Consultant in HIV Medicine, St George’s University Hospitals NHS Foundation Trust, Chair of the BHIVA HIV and Pregnancy Guidelines Writing Group
- Sarah Dermont, IDPS Clinical Projects Coordinator, NHS IDPS programme
- Maria Dowie, Clinical Nurse Specialist, Leeds Teaching Hospitals NHS Trust
- Temi Fayoyin, ANNB Screening and Immunisation Coordinator, Croydon University Hospital
- Kate Francis, ISOSS Coordinator, UCL GOS Institute of Child Health
- Dr Yvonne Gilleece, Honorary Clinical Professor and Consultant in HIV Medicine & Sexual Health, Brighton and Sussex Medical School and University Hospitals Sussex NHS Trust, Lead for HIV and Women, Lead for HIV and Hepatitis, Chair of BHIVA
- Dr Abha Govind, Consultant Obstetrician and Gynaecologist, North Middlesex University Hospital NHS Trust
- Julia Langley, ANNB Screening Specialise Midwife, Portsmouth Hospitals NHS Trust
- Dr Hermione Lyall, Consultant in Paediatric Infectious Disease, Imperial College Healthcare NHS Trust
- Dr Kim McLeod, Consultant Obstetrician, Manchester University Hospitals NHS Foundation Trust
- Dr Paddy McMaster, Consultant in Paediatric Infectious Diseases, North Manchester General Hospital Women and Children’s, Manchester University Hospitals NHS Foundation Trust
- Nadia Permalloo: Head of Quality Assurance Development (Clinical), Screening Quality Assurance Service, NHSE
- Helen Peters, ISOSS Manager, UCL GOS Institute of Child Health
- Dr Luciana Rubinstein, Consultant in GUM, London North West University Health Trust (Northwick Park, Ealing, Hillingdon)
- Laura Smeaton, IDPS Programme Projects Manager, NHSE IDPS programme
- Professor Claire Thorne (Chair), Professor of Infectious Disease Epidemiology, Population, Policy and Practice Department, UCL, Great Ormond Street (GOS) Institute of Child Health
- Rebecca Till: Antenatal Pathway Implementation Lead, NHSE