Health Assessment Channels Trial: technical annex
Published 15 September 2026

© Crown copyright 2026
This publication is licensed under the terms of the Open Government Licence v3.0 except where otherwise stated. To view this licence, visit nationalarchives.gov.uk/doc/open-government-licence/version/3 or write to the Information Policy Team, The National Archives, Kew, London TW9 4DU, or email: psi@nationalarchives.gov.uk.
Where we have identified any third party copyright information you will need to obtain permission from the copyright holders concerned.
This publication is available at https://www.gov.uk/government/publications/health-assessment-channels-trial-2022-to-2023/health-assessment-channels-trial-technical-annex
1. Background and methodology
This technical annex accompanies the Health Assessment Channels Trial (HACT) report and contains methodological detail supporting the published findings.
2. Trial Design and analytical framework
The HACT was conducted between May 2022 and January 2023. Eligible claimants were those undertaking an initial assessment, capable of using all 3 channels and suitable for auto-allocation. Results were assessed using both Intention to Treat (allocated channel) and Per Protocol (attended channel) analytical frameworks.
3. Data sources
Analysis combined assessment provider booking and referral data, the Department for Work and Pensions (DWP) administrative benefit outcome datasets, and customer research evidence. Outcomes include subsequent mandatory reconsideration and appeals, where applicable.
4. Limitations
Attended-channel analysis should be interpreted with caution because channel changing may introduce selection effects.
5. Statistical methodologies
Balance testing used Standardised Mean Differences (SMDs). Award outcomes were tested using chi-square and Fisher exact tests where appropriate. Award lengths and prognosis periods were assessed using independent t-tests. Logistic regression was used for channel change analysis.
Abbreviations
| Abbreviation | Meaning |
|---|---|
| CI | Confidence interval |
| Df | Degrees of freedom |
| pp | Percentage points |
| EXP | Exponentiated Beta Coefficient |
| ICD10 | International Classification of Diseases, Tenth Revision (ICD-10) condition |
| t | t-statistic |
Section A – Standardised Mean Difference tests
SMD tests were used to assess whether claimants allocated to different assessment channels were broadly comparable in terms of observable characteristics prior to the start of the Health Assessment Channels Trial.
SMDs measure the difference in means or proportions between groups, expressed relative to the pooled standard deviation, and are commonly used to assess balance between groups in experimental and quasi‑experimental designs.
For the trial analysis, SMDs were calculated for key demographic, geographic and health‑related characteristics, including age, sex, region, recorded condition groups, and Index of Multiple Deprivation (IMD) domains.
As a rule of thumb, absolute SMD values between -0.1 and 0.1 are generally considered to indicate good balance between groups.
The results presented in this appendix show that, among trial‑eligible claimants who were automatically allocated to a channel, differences across channels were small in magnitude, supporting the assumption that the allocation process did not introduce material population bias and that outcomes can be meaningfully compared across assessment channels.
Figure A.1 IAS IMD scores: Claimants eligible for all channels and auto-allocated

Figure A.2 IAS characteristics: Eligible for all channels and auto-allocated

Figure A.3 IAS IMD scores: Eligible for all channels and auto or manually allocated
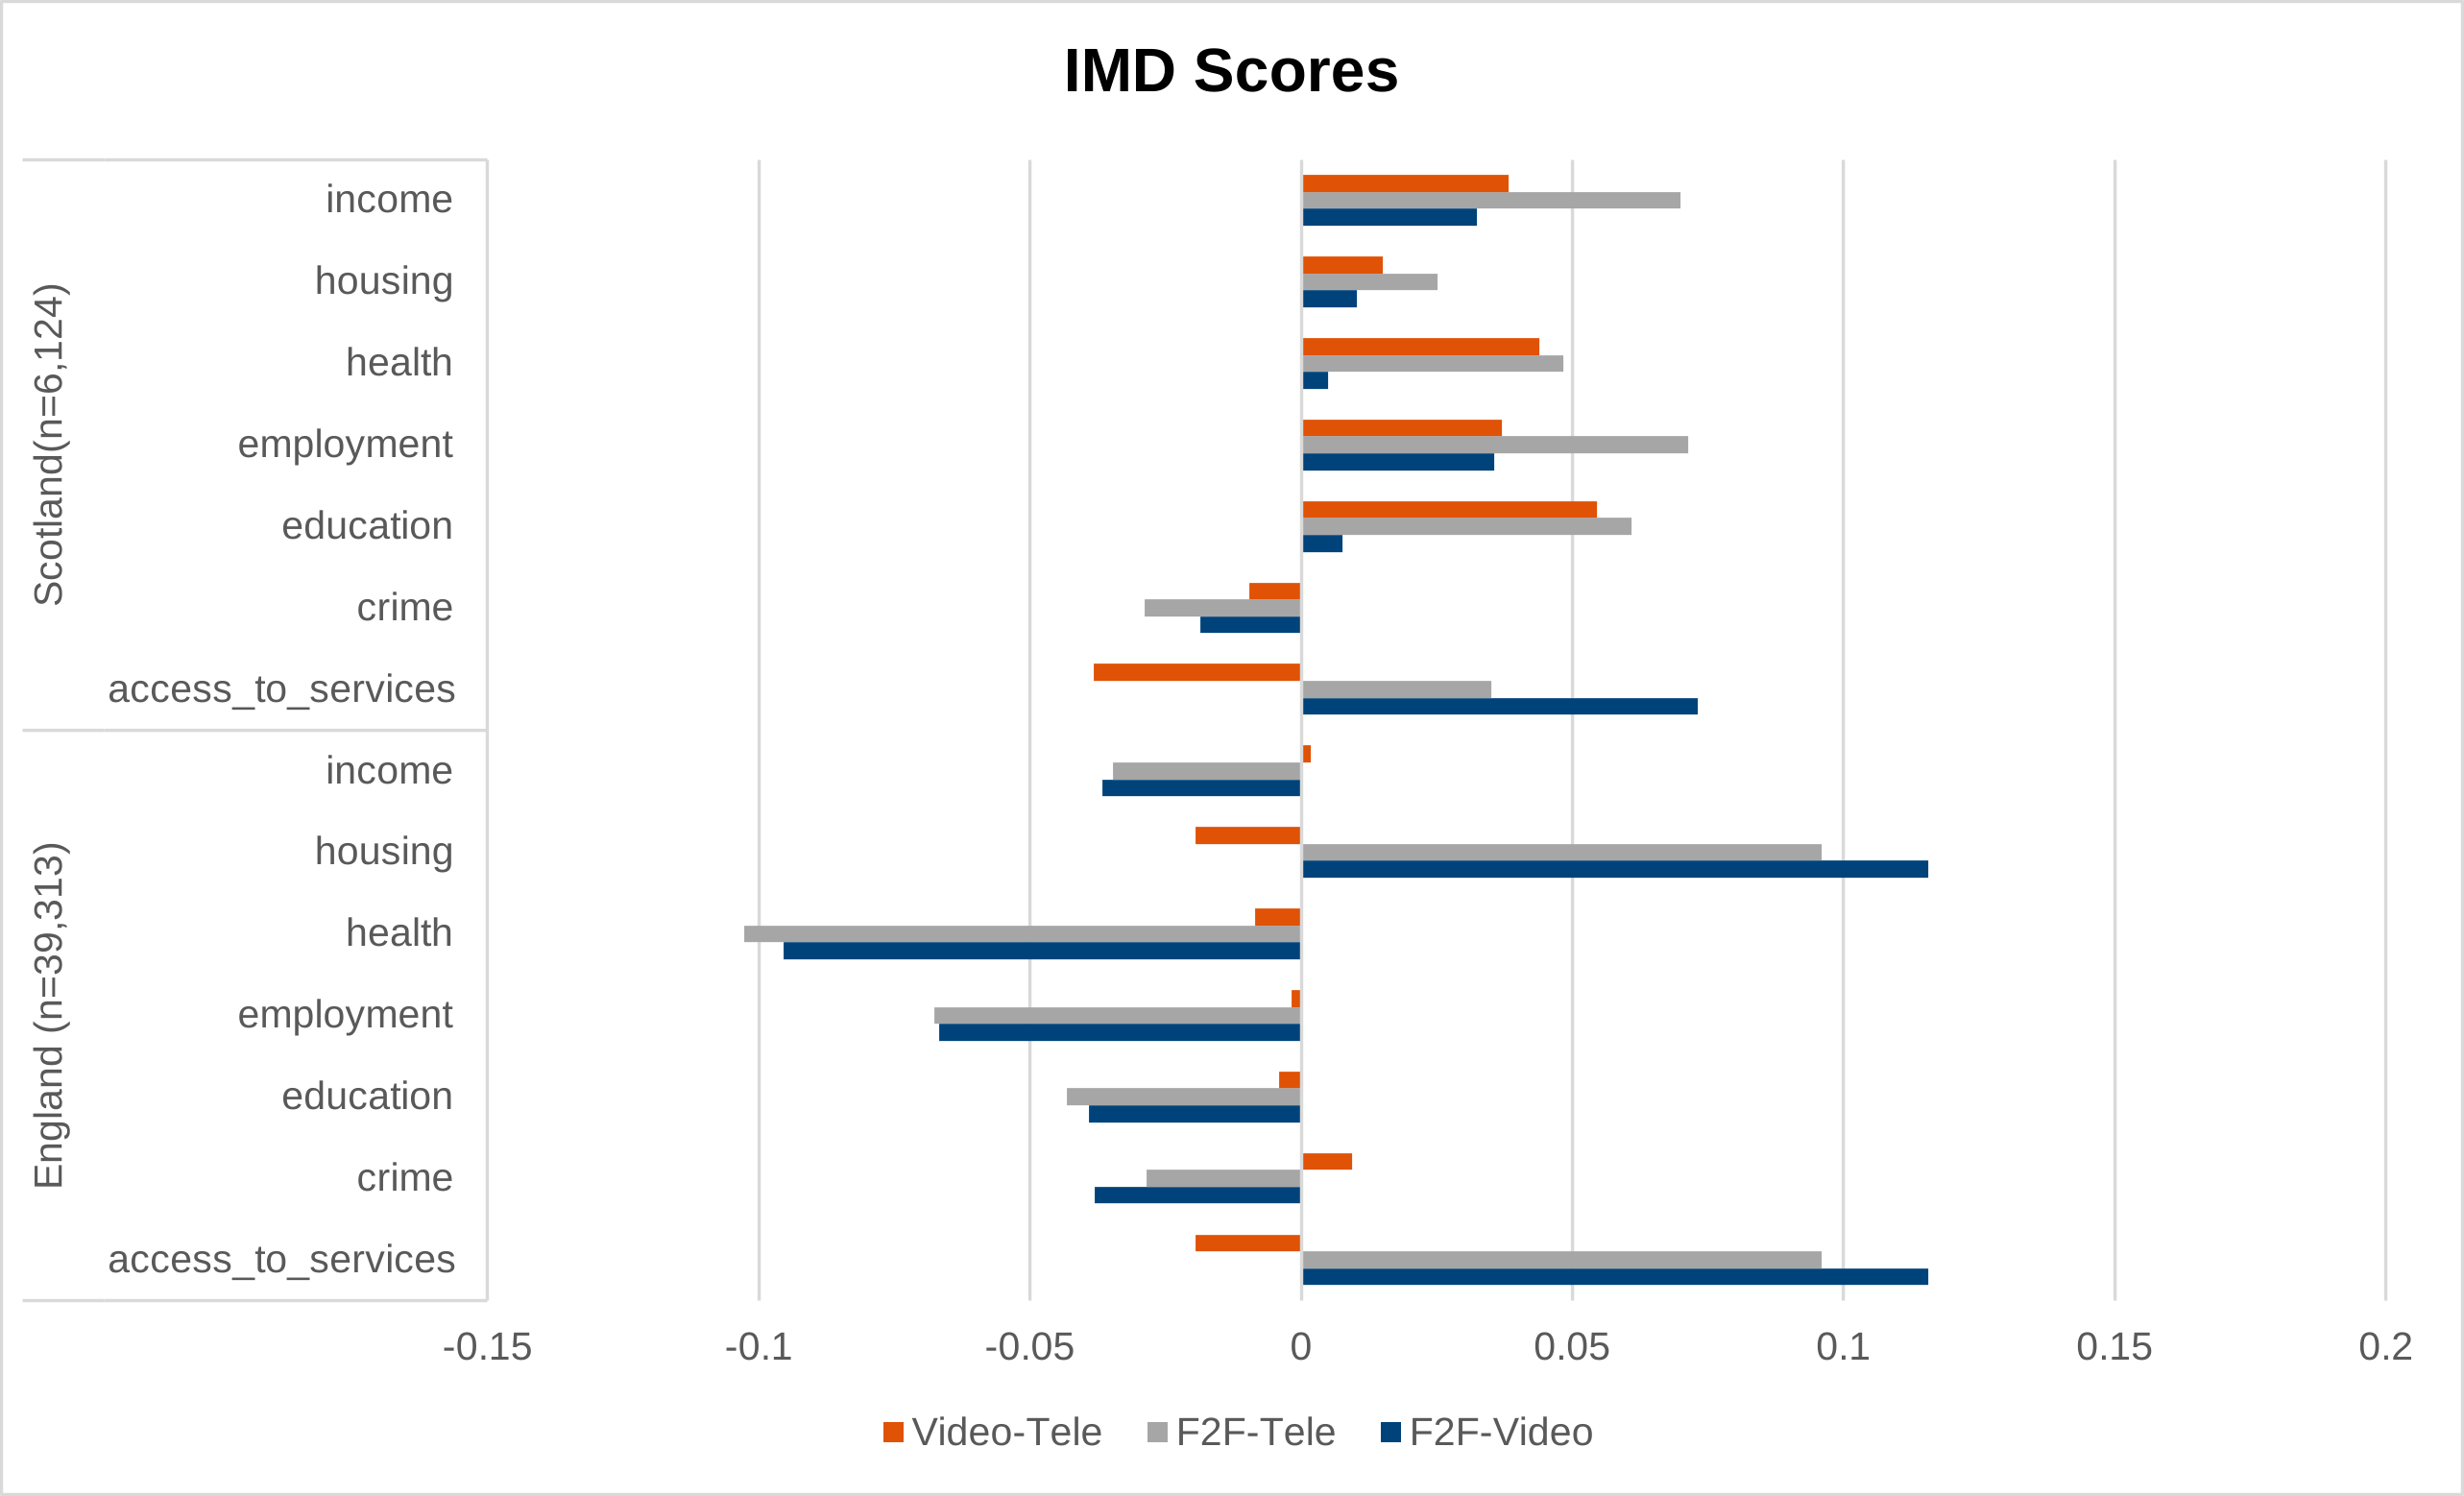
Figure A.4 IAS characteristics: Eligible for all channels and auto or manually allocated

Figure A.5 Capita IMD scores: Eligible for all channels and auto-allocated

Figure A.6 Capita characteristics: Eligible for all channels and auto-allocated

Figure A.7 Capita IMD scores: Eligible for all channels and auto or manually allocated

Figure A.8 Capita characteristics: Eligible for all channels and auto or manually allocated

Figure A.9 Centre for Health and Disability Assessments (CHDA) IMD scores: Eligible for all channels and auto-allocated

Figure A.10 CHDA characteristics: Eligible for all channels and auto-allocated
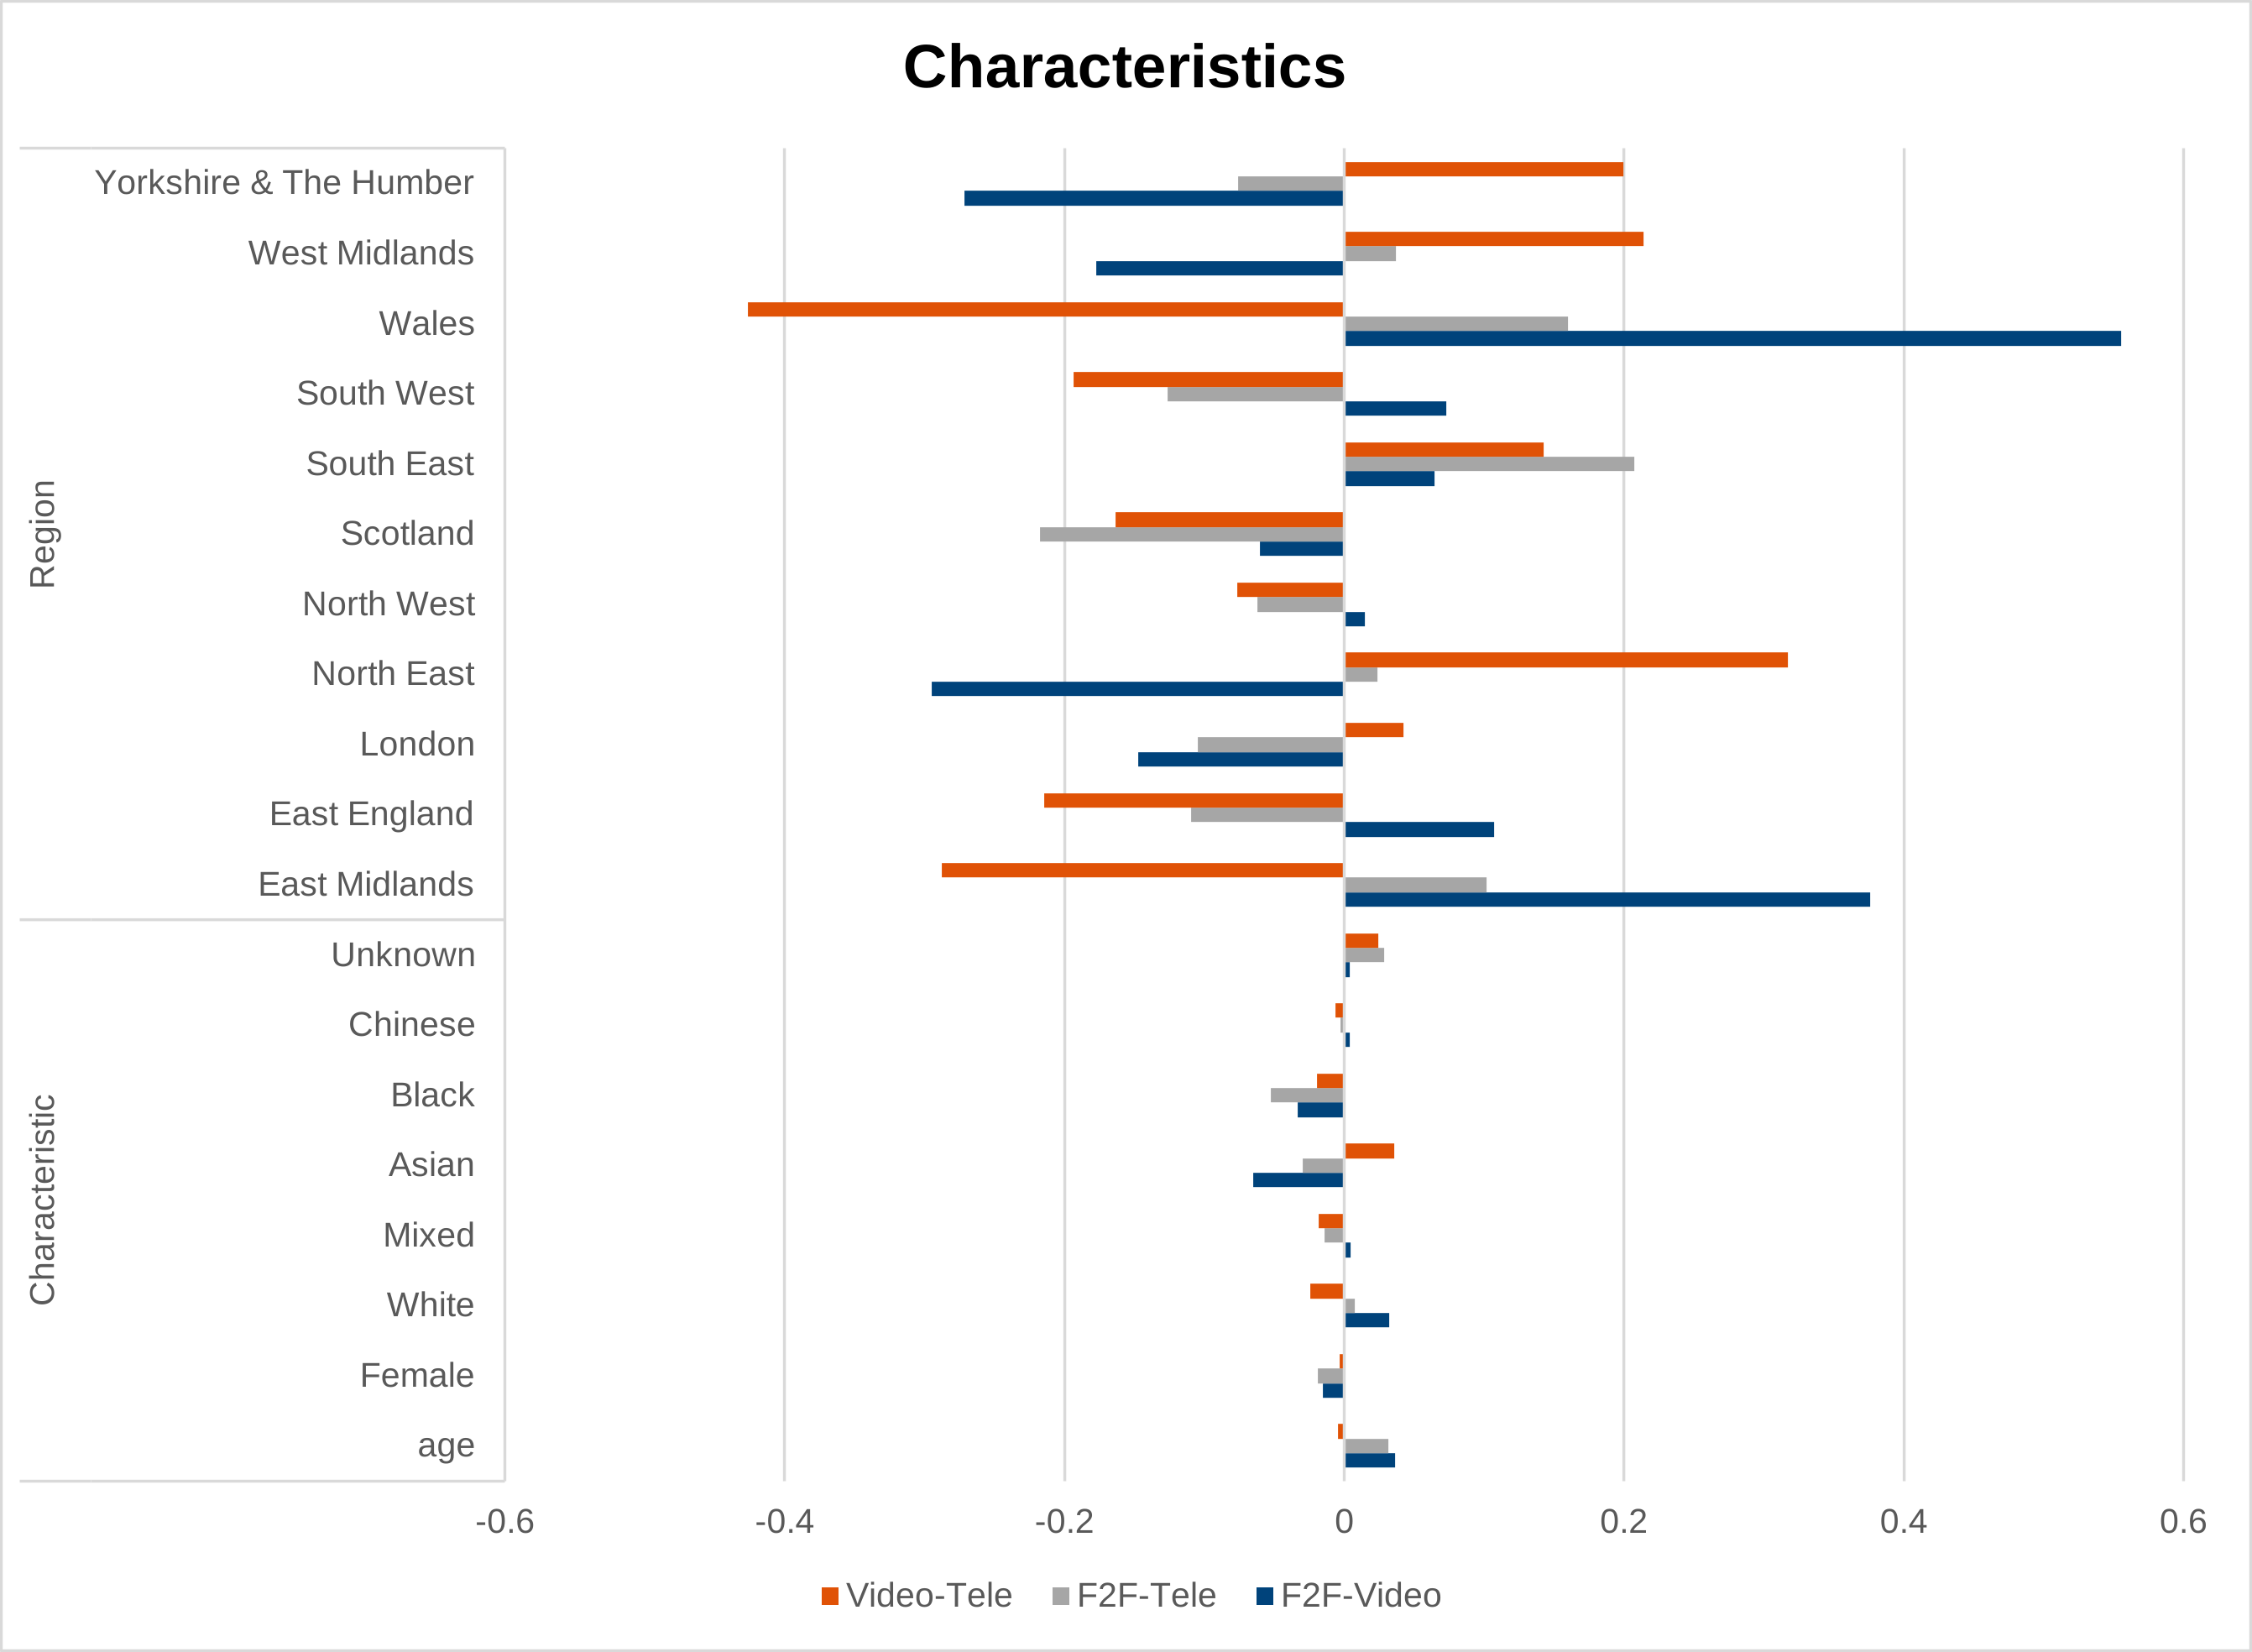
Figure A.11 CHDA IMD scores: Eligible for all channels and auto or manually allocated

Figure A.12 CHDA characteristics: Eligible for all channels and auto or manually allocated

Section B – Personal Independence Payment (PIP) allocated channel analyses
Annex B presents Chi-square tests of association underpinning the analysis of award rates by allocated channel, stratified by recorded primary condition group, gender and age.
Award rates are shown for each channel within each category. Statistical significance is assessed at the 5% level (p ≤ 0.05) and effect sizes are provided using Cramer’s V. Where expected cell counts are small, Chi-square results may be unreliable, and Fisher’s exact test should be used.
Independent t-tests have been used to test association between channel and award length. Statistical significance is assessed at the 5% level (p ≤ 0.05).
Assessments from Scotland and Northern Ireland were excluded from the results due to devolution of powers to the local government, in these regions.
Table B.1 PIP outcomes by allocated channel
| Allocated channel | Awarded | Disallowed | Award rate per cent |
|---|---|---|---|
| F2F | 22,231 | 22,123 | 50.1 |
| VA | 19,207 | 18,877 | 50.4 |
| TA | 84,178 | 86,810 | 49.2 |
Table B.2 Tests of association between PIP award and allocated channel
| Comparison | Test | Statistic | Df | Probability-value |
|---|---|---|---|---|
| F2F vs VA | Pearson chi‑square | 0.7953 | 1 | 0.373 |
| F2F vs VA | Fisher’s exact (two‑sided) | – | – | 0.373 |
| F2F vs VA | Cramer’s V | 0.0031 | – | – |
| F2F vs TA¹ | Pearson chi‑square | 11.1951 | 1 | 0.001 |
| F2F vs TA¹ | Fisher’s exact (two‑sided) | – | – | 0.002 |
| F2F vs TA | Cramer’s V | 0.0072 | – | – |
¹ Result is statistically significant at (or below) the .05 level
Table B.3 PIP outcomes by allocated channel (F2F vs TA) and by primary condition
| Primary condition group | F2F awarded | F2F disallowed | TA awarded | TA disallowed |
|---|---|---|---|---|
| Anxiety and depression | 4,806 | 4,546 | 23,311 | 22,446 |
| Psychiatric disorders excluding anxiety and depression | 721 | 586 | 2,097 | 1,671 |
| Musculoskeletal disease (general) | 4,645 | 3,519 | 16,870 | 13,020 |
| Musculoskeletal disease (regional) | 3,286 | 3,047 | 13,282 | 11,622 |
| Neurological disease | 2,709 | 2,116 | 8,256 | 6,647 |
| Respiratory disease | 1,004 | 1,490 | 3,160 | 5,000 |
| Cardiovascular disease | 808 | 968 | 2,842 | 3,505 |
| Malignant disease | 680 | 626 | 1,270 | 1,163 |
| Autism | 595 | 684 | 1,179 | 1,148 |
| Attention deficit hyperactivity disorder (ADHD) or attention deficit disorder (ADD) | 373 | 660 | 1,211 | 2,456 |
| Endocrine disease | 340 | 752 | 1,461 | 3,044 |
| Gastrointestinal disease | 330 | 820 | 1,345 | 3,657 |
| Learning disability | 132 | 122 | 220 | 266 |
| Unknown | 2 | 7 | 974 | 2,980 |
| All other categories | 1,800 | 2,180 | 6,700 | 8,185 |
Table B.4 Test of association between PIP award and allocated channel (F2F vs TA) by primary condition
| Primary condition group | F2F award rate per cent | TA award rate per cent | Difference (pp) | Probability-value | Cramer’s V |
|---|---|---|---|---|---|
| Musculoskeletal disease (general) | 56.9 | 56.4 | -0.5 | 0.4615 | 0.0038 |
| Musculoskeletal disease (regional)¹ | 51.9 | 53.3 | 1.4 | 0.0395 | 0.0116 |
| Neurological disease | 56.1 | 55.4 | -0.7 | 0.3642 | 0.0065 |
| Malignant disease | 52.1 | 52.2 | 0.1 | 0.9388 | 0.0013 |
| Learning disability | 52.0 | 45.3 | -6.7 | 0.0831 | 0.0637 |
| Anxiety and depression | 51.4 | 50.9 | -0.5 | 0.4329 | 0.0033 |
| Psychiatric disorders excluding anxiety and depression | 55.2 | 55.7 | 0.5 | 0.7595 | 0.0043 |
| Autism¹ | 46.5 | 50.7 | 4.2 | 0.0172 | 0.0397 |
| Cardiovascular disease | 45.5 | 44.8 | -0.7 | 0.5906 | 0.0060 |
| Respiratory disease | 40.3 | 38.7 | -1.6 | 0.1702 | 0.0133 |
| ADHD or ADD | 36.1 | 33.0 | -3.1 | 0.0640 | 0.0270 |
| Endocrine disease | 31.1 | 32.4 | 1.3 | 0.4111 | 0.0110 |
| Gastrointestinal disease | 28.7 | 26.9 | -1.8 | 0.2146 | 0.0158 |
| Unknown† | 22.2 | 24.6 | 2.4 | 0.8668 | 0.0027 |
| All other categories | 45.2 | 45.0 | -0.2 | 0.8092 | 0.0018 |
¹ Result is statistically significant at (or below) the .05 level.
† Where expected cell counts are small, Chi-square assumptions may not hold; Fisher’s exact test should be used and results interpreted cautiously.
Table B.5 PIP outcomes by allocated channel (F2F vs VA) and by primary condition
| Primary condition group | F2F awarded | F2F disallowed | VA awarded | VA disallowed |
|---|---|---|---|---|
| Anxiety and depression | 4,806 | 4,546 | 5,232 | 4,893 |
| Psychiatric disorders excluding anxiety and depression | 721 | 586 | 523 | 394 |
| Musculoskeletal disease (general) | 4,645 | 3,519 | 3,775 | 2,767 |
| Musculoskeletal disease (regional) | 3,286 | 3,047 | 2,899 | 2,434 |
| Neurological disease | 2,709 | 2,116 | 2,026 | 1,558 |
| Respiratory disease | 1,004 | 1,490 | 705 | 1,039 |
| Cardiovascular disease | 808 | 968 | 659 | 743 |
| Malignant disease | 680 | 626 | 297 | 273 |
| Autism | 595 | 684 | 289 | 351 |
| ADHD or ADD | 373 | 660 | 307 | 582 |
| Endocrine disease | 340 | 752 | 395 | 670 |
| Gastrointestinal disease | 330 | 820 | 323 | 764 |
| Learning disability | 132 | 122 | 76 | 64 |
| Unknown | 2 | 7 | 150 | 547 |
| All other categories | 1,800 | 2,180 | 1,551 | 1,798 |
Table B.6 Test of association between PIP award and allocated channel (F2F vs VA) by primary condition
| Primary condition group | F2F award rate per cent | VA award rate per cent | Difference (pp) | Probability-value | Cramer’s V |
|---|---|---|---|---|---|
| Musculoskeletal disease (general) | 56.9 | 57.7 | 0.8 | 0.3250 | 0.0081 |
| Musculoskeletal disease (regional)¹ | 51.9 | 54.4 | 2.5 | 0.0077 | 0.0247 |
| Neurological disease | 56.1 | 56.5 | 0.4 | 0.7256 | 0.0038 |
| Anxiety and depression | 51.4 | 51.7 | 0.3 | 0.6919 | 0.0028 |
| Psychiatric disorders excluding anxiety and depression | 55.2 | 57.0 | 1.8 | 0.3821 | 0.0185 |
| Malignant disease | 52.1 | 52.1 | 0.0 | 0.9879 | 0.0003 |
| Learning disability | 52.0 | 54.3 | 2.3 | 0.6592 | 0.0222 |
| Autism | 46.5 | 45.2 | -1.3 | 0.5718 | 0.0129 |
| Cardiovascular disease | 45.5 | 47.0 | 1.5 | 0.3969 | 0.0150 |
| Respiratory disease | 40.3 | 40.4 | 0.1 | 0.9128 | 0.0017 |
| ADHD or ADD | 36.1 | 34.5 | -1.6 | 0.4714 | 0.0164 |
| Endocrine disease¹ | 31.1 | 37.1 | 6.0 | 0.0035 | 0.0628 |
| Gastrointestinal disease | 28.7 | 29.7 | 1.0 | 0.5962 | 0.0112 |
| Unknown† | 22.2 | 21.5 | -0.7 | 0.9594 | 0.0019 |
| All other categories | 45.2 | 46.3 | 1.1 | 0.3524 | 0.0109 |
¹ Result is statistically significant at (or below) the .05 level.
† Where expected cell counts are small, Chi-square assumptions may not hold; Fisher’s exact test should be used and results interpreted cautiously.
Table B.7 PIP outcomes by allocated channel and by gender
| Gender | Allocated channel | Awarded | Disallowed | Awarded per cent |
|---|---|---|---|---|
| Female | F2F | 13,131 | 12,842 | 50.6 |
| Female | VA | 11,653 | 11,187 | 51.0 |
| Female | TA | 50,727 | 51,042 | 49.8 |
| Male | F2F | 9,100 | 9,281 | 49.5 |
| Male | VA | 7,554 | 7,690 | 49.6 |
| Male | TA | 33,449 | 35,768 | 48.3 |
Table B.8 Test of association between PIP award and allocated channel by gender
| Comparison | Gender | F2F award rate per cent | Comparator award rate per cent | Difference (pp) | Probability-value | Cramer’s V |
|---|---|---|---|---|---|---|
| F2F vs VA | Female | 50.6 | 51.0 | −0.46 | 0.3065 | 0.0046 |
| F2F vs VA | Male | 49.5 | 49.6 | −0.04 | 0.9327 | 0.0005 |
| F2F vs TA¹ | Female | 50.6 | 49.8 | 0.71 | 0.0408 | 0.0057 |
| F2F vs TA¹ | Male | 49.5 | 48.3 | 1.19 | 0.0043 | 0.0096 |
¹ Result is statistically significant at (or below) the .05 level.
Table B.9 PIP outcomes by allocated channel and by age
| Age band | Channel | Awarded | Disallowed | Awarded per cent |
|---|---|---|---|---|
| 16 to 19 | F2F | 750 | 847 | 47.0 |
| 16 to 19 | VA | 578 | 695 | 45.4 |
| 16 to 19 | TA | 2,514 | 2,917 | 46.3 |
| 20 to 24 | F2F | 1,166 | 1,661 | 41.2 |
| 20 to 24 | VA | 1,016 | 1,499 | 40.4 |
| 20 to 24 | TA | 4,635 | 6,665 | 41.0 |
| 25 to 29 | F2F | 1,371 | 1,817 | 43.0 |
| 25 to 29 | VA | 1,375 | 1,849 | 42.6 |
| 25 to 29 | TA | 5,905 | 8,166 | 42.0 |
| 30 to 34 | F2F | 1,851 | 2,241 | 45.2 |
| 30 to 34 | VA | 1,758 | 2,026 | 46.5 |
| 30 to 34 | TA | 7,638 | 9,545 | 44.5 |
| 35 to 39 | F2F | 1,952 | 2,066 | 48.6 |
| 35 to 39 | VA | 1,857 | 2,023 | 47.9 |
| 35 to 39 | TA | 8,225 | 9,183 | 47.2 |
| 40 to 44 | F2F | 1,980 | 2,155 | 47.9 |
| 40 to 44 | VA | 1,944 | 1,874 | 50.9 |
| 40 to 44 | TA | 8,415 | 8,808 | 48.9 |
| 45 to 49 | F2F | 2,233 | 2,082 | 51.7 |
| 45 to 49 | VA | 1,902 | 1,812 | 51.2 |
| 45 to 49 | TA | 8,525 | 8,096 | 51.3 |
| 50 to 54 | F2F | 2,925 | 2,644 | 52.5 |
| 50 to 54 | VA | 2,471 | 2,108 | 54.0 |
| 50 to 54 | TA | 10,683 | 10,018 | 51.6 |
| 55 to 59 | F2F | 3,405 | 2,977 | 53.4 |
| 55 to 59 | VA | 2,794 | 2,274 | 55.1 |
| 55 to 59 | TA | 12,180 | 10,564 | 53.6 |
| 60 to 64 | F2F | 3,808 | 3,023 | 55.7 |
| 60 to 64 | VA | 2,916 | 2,251 | 56.4 |
| 60 to 64 | TA | 12,729 | 10,690 | 54.4 |
| 65 to 69 | F2F | 787 | 610 | 56.3 |
| 65 to 69 | VA | 596 | 466 | 56.1 |
| 65 to 69 | TA | 2,725 | 2,156 | 55.8 |
Table B.10 Test of association between PIP award and allocated channel by age
| Comparison | Age band | F2F awarded per cent | Comparator awarded per cent | Difference (pp) | Probability-value | Cramer’s V |
|---|---|---|---|---|---|---|
| F2F vs VA | 16 to 19 | 47.0 | 45.4 | 1.56 | 0.4055 | 0.016 |
| F2F vs VA | 20 to 24 | 41.3 | 40.4 | 0.85 | 0.5293 | 0.009 |
| F2F vs VA | 25 to 29 | 43.0 | 42.7 | 0.36 | 0.7732 | 0.004 |
| F2F vs VA | 30 to 34 | 45.2 | 46.5 | −1.23 | 0.2760 | 0.012 |
| F2F vs VA | 35 to 39 | 48.6 | 47.9 | 0.72 | 0.5217 | 0.007 |
| F2F vs VA¹ | 40 to 44 | 47.9 | 50.9 | −3.04 | 0.0069 | 0.030 |
| F2F vs VA | 45 to 49 | 51.8 | 51.2 | 0.54 | 0.6305 | 0.005 |
| F2F vs VA | 50 to 54 | 52.5 | 54.0 | −1.44 | 0.1478 | 0.014 |
| F2F vs VA | 55 to 59 | 53.4 | 55.1 | −1.78 | 0.0580 | 0.018 |
| F2F vs VA | 60 to 64 | 55.8 | 56.4 | −0.69 | 0.4514 | 0.007 |
| F2F vs VA | 65 to 69 | 56.3 | 56.1 | 0.22 | 0.9154 | 0.002 |
| F2F vs TA | 16 to 19 | 47.0 | 46.3 | 0.67 | 0.6353 | 0.006 |
| F2F vs TA | 20 to 24 | 41.3 | 41.0 | 0.23 | 0.8260 | 0.002 |
| F2F vs TA | 25 to 29 | 43.0 | 42.0 | 1.04 | 0.2833 | 0.008 |
| F2F vs TA | 30 to 34 | 45.2 | 44.5 | 0.78 | 0.3647 | 0.006 |
| F2F vs TA | 35 to 39 | 48.6 | 47.3 | 1.33 | 0.1272 | 0.010 |
| F2F vs TA | 40 to 44 | 47.9 | 48.9 | −0.98 | 0.2599 | 0.008 |
| F2F vs TA | 45 to 49 | 51.8 | 51.3 | 0.46 | 0.5908 | 0.004 |
| F2F vs TA | 50 to 54 | 52.5 | 51.6 | 0.91 | 0.2242 | 0.008 |
| F2F vs TA | 55 to 59 | 53.4 | 53.6 | −0.20 | 0.7778 | 0.002 |
| F2F vs TA¹ | 60 to 64 | 55.8 | 54.4 | 1.4 | 0.0419 | 0.012 |
| F2F vs TA | 65 to 69 | 56.3 | 55.8 | 0.51 | 0.7368 | 0.004 |
¹ Result is statistically significant at (or below) the .05 level.
Table B.11 PIP award length by allocated channel
| Allocated channel | N | Mean (months) | Standard deviation |
|---|---|---|---|
| F2F | 17,604 | 34.48 | 8.58 |
| VA | 15,623 | 33.56 | 8.09 |
| TA | 68,973 | 33.43 | 7.83 |
Table B.12 Test of association between PIP award length and allocated channel
| Comparison | Test | Mean diff (months) | 95% CI | t | Probability-value |
|---|---|---|---|---|---|
| F2F vs VA¹ | Satterthwaite | 0.92 | 0.75 – 1.10 | 10.11 | <0.0001 |
| F2F vs TA¹ | Satterthwaite | 1.05 | 0.91 – 1.19 | 14.76 | <0.0001 |
¹ Result is statistically significant at (or below) the .05 level.
Section C – PIP attended channel analyses
Annex C presents Chi-square tests of association underpinning the analysis of award rates by attended channel, stratified by recorded primary condition group, gender and age.
Award rates are shown for each channel within each category. Statistical significance is assessed at the 5% level (p ≤ 0.05) and effect sizes are provided using Cramer’s V. Where expected cell counts are small, Chi-square results may be unreliable, and Fisher’s exact test should be used.
Independent t-tests have been used to test for association between channel and award length (PIP). Statistical significance is assessed at the 5% level (p ≤ 0.05).
Assessments from Scotland and Northern Ireland were excluded from the results due to devolution of powers to the local government, in these regions.
Table C.1 PIP outcomes by attended channel
| Attended channel | Awarded | Disallowed | Award rate per cent |
|---|---|---|---|
| F2F | 15,301 | 16,440 | 48.2 |
| VA | 14,378 | 14,551 | 49.7 |
| TA | 95,936 | 96,819 | 49.8 |
Table C.2 Test of association between PIP award and attended channel
| Comparison | Test | Statistic | Df | Probability-value |
|---|---|---|---|---|
| F2F vs VA¹ | Pearson chi‑square | 13.5407 | 1 | 0.0002 |
| F2F vs VA¹ | Fisher’s exact (two‑sided) | – | – | 0.0002 |
| F2F vs VA | Cramer’s V | 0.0149 | – | – |
| F2F vs TA¹ | Pearson chi‑square | 26.7074 | 1 | <0.0001 |
| F2F vs TA¹ | Fisher’s exact (two‑sided) | – | – | <0.0001 |
| F2F vs TA | Cramer’s V | 0.0109 | – | – |
¹ Result is statistically significant at (or below) the .05 level.
Table C.3 PIP outcomes by attended channel (F2F vs TA) and by primary condition
| Primary condition group | F2F awarded | F2F disallowed | TA awarded | TA disallowed |
|---|---|---|---|---|
| Musculoskeletal disease (general) | 3,337 | 2,735 | 19,111 | 14,457 |
| Musculoskeletal disease (regional) | 2,370 | 2,376 | 14,883 | 12,857 |
| Anxiety and depression | 2,950 | 3,023 | 26,613 | 25,100 |
| Psychiatric disorders excluding anxiety and depression | 508 | 439 | 2,489 | 1,941 |
| Neurological disease | 1,909 | 1,594 | 9,497 | 7,491 |
| Respiratory disease | 698 | 1,153 | 3,671 | 5,563 |
| Cardiovascular disease | 543 | 763 | 3,271 | 3,920 |
| Malignant disease | 461 | 453 | 1,567 | 1,392 |
| Autism | 438 | 508 | 1,381 | 1,374 |
| Endocrine disease | 252 | 591 | 1,668 | 3,379 |
| ADHD or ADD | 250 | 458 | 1,396 | 2,756 |
| Gastrointestinal disease | 217 | 622 | 1,532 | 4,018 |
| Learning disability | 103 | 91 | 276 | 317 |
| Unknown | 3 | 9 | 1006 | 3,131 |
| All other categories | 1,262 | 1,625 | 7,575 | 9,123 |
Table C.4 Test of association between PIP award and attended channel (F2F vs TA) by primary condition
| Primary condition group | F2F award rate per cent | TA award rate per cent | Difference (pp) | Probability-value | Cramer’s V |
|---|---|---|---|---|---|
| Musculoskeletal disease (general)¹ | 55.0 | 56.9 | 2.0 | 0.004 | 0.0140 |
| Musculoskeletal disease (regional)¹ | 49.9 | 53.7 | 3.8 | <0.001 | 0.0260 |
| Neurological disease | 54.5 | 55.9 | 1.4 | 0.127 | 0.0110 |
| Anxiety and depression | 49.4 | 51.5 | 2.1 | 0.002 | 0.0130 |
| Psychiatric disorders excluding anxiety and depression | 53.6 | 56.2 | 2.6 | 0.153 | 0.0200 |
| Learning disability | 53.1 | 46.5 | −6.6 | 0.113 | 0.0570 |
| Malignant disease | 50.4 | 53.0 | 2.5 | 0.183 | 0.0210 |
| Autism¹ | 46.3 | 50.1 | 3.8 | 0.042 | 0.0330 |
| Cardiovascular disease¹ | 41.6 | 45.5 | 3.9 | 0.009 | 0.0280 |
| Respiratory disease | 37.7 | 39.8 | 2.0 | 0.100 | 0.0160 |
| ADHD or ADD | 35.3 | 33.6 | −1.7 | 0.380 | 0.0130 |
| Endocrine disease | 29.9 | 33.1 | 3.2 | 0.070 | 0.0240 |
| Gastrointestinal disease | 25.9 | 27.6 | 1.7 | 0.292 | 0.0130 |
| Unknown† | 25.0 | 24.3 | −0.7 | 0.956 | 0.0010 |
| All other categories | 43.7 | 45.4 | 1.6 | 0.100 | 0.0120 |
¹ Result is statistically significant at (or below) the .05 level.
† Where expected cell counts are small, Chi-square assumptions may not hold; Fisher’s exact test should be used and results interpreted cautiously.
Table C.5 PIP outcomes by attended channel (F2F vs VA) and by primary condition
| Primary condition group | F2F awarded | F2F disallowed | VA awarded | VA disallowed |
|---|---|---|---|---|
| Musculoskeletal disease (general) | 3,337 | 2,735 | 2,842 | 2,114 |
| Musculoskeletal disease (regional) | 2,370 | 2,376 | 2,214 | 1,870 |
| Anxiety and depression | 2,950 | 3,023 | 3,786 | 3,762 |
| Psychiatric disorders excluding anxiety and depression | 508 | 439 | 344 | 271 |
| Neurological disease | 1,909 | 1,594 | 1,585 | 1,236 |
| Respiratory disease | 698 | 1,153 | 500 | 813 |
| Cardiovascular disease | 543 | 763 | 495 | 533 |
| Malignant disease | 461 | 453 | 219 | 217 |
| Autism | 438 | 508 | 244 | 301 |
| Endocrine disease | 252 | 591 | 276 | 496 |
| ADHD or ADD | 250 | 458 | 245 | 484 |
| Gastrointestinal disease | 217 | 622 | 249 | 601 |
| Learning disability | 103 | 91 | 49 | 44 |
| Unknown | 3 | 9 | 117 | 394 |
| All other categories | 1,262 | 1,625 | 1,213 | 1,415 |
Table C.6 Test of association between PIP award and attended channel (F2F vs VA) by primary condition
| Primary condition group | F2F award rate per cent | VA award rate per cent | Difference (pp) | Probability-value | Cramer’s V |
|---|---|---|---|---|---|
| Musculoskeletal disease (general)¹ | 55.0 | 57.3 | 2.3 | 0.012 | 0.024 |
| Musculoskeletal disease (regional)¹ | 49.9 | 54.2 | 4.3 | <0.001 | 0.043 |
| Neurological disease | 54.5 | 56.2 | 1.7 | 0.179 | 0.017 |
| Anxiety and depression | 49.4 | 50.2 | 0.8 | 0.374 | 0.008 |
| Psychiatric disorders excluding anxiety and depression | 53.6 | 55.9 | 2.3 | 0.374 | 0.023 |
| Learning disability | 53.1 | 52.7 | −0.4 | 0.949 | 0.004 |
| Malignant disease | 50.4 | 50.2 | −0.2 | 0.943 | 0.002 |
| Autism | 46.3 | 44.8 | −1.5 | 0.568 | 0.015 |
| Cardiovascular disease¹ | 41.6 | 48.2 | 6.6 | 0.002 | 0.066 |
| Respiratory disease | 37.7 | 38.1 | 0.4 | 0.832 | 0.004 |
| ADHD or ADD | 35.3 | 33.6 | −1.7 | 0.497 | 0.018 |
| Endocrine disease¹ | 29.9 | 35.8 | 5.9 | 0.012 | 0.062 |
| Gastrointestinal disease | 25.9 | 29.3 | 3.4 | 0.115 | 0.038 |
| Unknown† | 25.0 | 22.9 | −2.1 | 0.864 | 0.008 |
| All other categories | 43.7 | 46.2 | 2.5 | 0.068 | 0.025 |
¹ Result is statistically significant at (or below) the .05 level.
† Where expected cell counts are small, Chi-square assumptions may not hold; Fisher’s exact test should be used and results interpreted cautiously.
Table C.7 PIP outcomes by attended channel and by gender
| Gender | Attended channel | Awarded | Disallowed | Awarded per cent |
|---|---|---|---|---|
| Female | F2F | 8,782 | 9,251 | 48.7 |
| Female | VA | 8,912 | 8,772 | 50.4 |
| Female | TA | 57,816 | 57,048 | 50.3 |
| Male | F2F | 6,519 | 7,189 | 47.6 |
| Male | VA | 5,466 | 5,779 | 48.6 |
| Male | TA | 38,118 | 39,771 | 48.9 |
Table C.8 Test of association between PIP award and attended channel by gender
| Comparison | Gender | F2F award rate per cent | Comparator award rate per cent | Difference (pp) | Probability-value | Cramer’s V |
|---|---|---|---|---|---|---|
| F2F vs VA¹ | Female | 48.7 | 50.4 | −1.70 | 0.0013 | 0.0170 |
| F2F vs VA | Male | 47.6 | 48.6 | −1.05 | 0.0979 | 0.0105 |
| F2F vs TA¹ | Female | 48.7 | 50.3 | −1.63 | <0.0001 | 0.0112 |
| F2F vs TA¹ | Male | 47.6 | 48.9 | −1.38 | 0.0028 | 0.0099 |
¹ Result is statistically significant at (or below) the .05 level.
Table C.9 PIP outcomes by attended channel and by age
| Age band | Attended Channel | Awarded | Disallowed | Awarded per cent |
|---|---|---|---|---|
| 16 to 19 | F2F | 533 | 639 | 45.5 |
| 16 to 19 | VA | 458 | 594 | 43.5 |
| 16 to 19 | TA | 2,851 | 3,226 | 46.9 |
| 20 to 24 | F2F | 783 | 1,173 | 40.0 |
| 20 to 24 | VA | 829 | 1,260 | 39.7 |
| 20 to 24 | TA | 5,205 | 7,392 | 41.3 |
| 25 to 29 | F2F | 875 | 1,225 | 41.7 |
| 25 to 29 | VA | 1,099 | 1,516 | 42.0 |
| 25 to 29 | TA | 6,677 | 9,091 | 42.4 |
| 30 to 34 | F2F | 1,166 | 1,566 | 42.7 |
| 30 to 34 | VA | 1,403 | 1,702 | 45.2 |
| 30 to 34 | TA | 8,677 | 10,544 | 45.1 |
| 35 to 39 | F2F | 1,238 | 1,455 | 46.0 |
| 35 to 39 | VA | 1,415 | 1,651 | 46.2 |
| 35 to 39 | TA | 9,381 | 10,166 | 48.0 |
| 40 to 44 | F2F | 1,288 | 1,562 | 45.2 |
| 40 to 44 | VA | 1,473 | 1,455 | 50.3 |
| 40 to 44 | TA | 9,578 | 9,820 | 49.4 |
| 45 to 49 | F2F | 1,532 | 1,595 | 49.0 |
| 45 to 49 | VA | 1,454 | 1,401 | 50.9 |
| 45 to 49 | TA | 9,674 | 8,994 | 51.8 |
| 50 to 54 | F2F | 1,998 | 2,027 | 49.6 |
| 50 to 54 | VA | 1,796 | 1,576 | 53.3 |
| 50 to 54 | TA | 12,285 | 11,167 | 52.4 |
| 55 to 59 | F2F | 2,461 | 2,296 | 51.7 |
| 55 to 59 | VA | 2,049 | 1,611 | 56.0 |
| 55 to 59 | TA | 13,869 | 11,908 | 53.8 |
| 60 to 64 | F2F | 2,837 | 2,410 | 54.1 |
| 60 to 64 | VA | 1,996 | 1,490 | 57.3 |
| 60 to 64 | TA | 14,620 | 12,064 | 54.8 |
| 65 to 69 | F2F | 588 | 492 | 54.4 |
| 65 to 69 | VA | 406 | 295 | 57.9 |
| 65 to 69 | TA | 3,114 | 2,445 | 56.0 |
Table C.10 Test of association between PIP award and attended channel by age
| Comparison | Age band | F2F awarded per cent | Comparator awarded per cent | Difference (pp) | Probability-value | Cramer’s V |
|---|---|---|---|---|---|---|
| F2F vs VA | 16 to 19 | 45.5 | 43.5 | −2.0 | 0.3580 | 0.020 |
| F2F vs VA | 20 to 24 | 40.0 | 39.7 | −0.3 | 0.8220 | 0.004 |
| F2F vs VA | 25 to 29 | 41.7 | 42.0 | 0.4 | 0.8030 | 0.004 |
| F2F vs VA | 30 to 34 | 42.7 | 45.2 | 2.5 | 0.0540 | 0.025 |
| F2F vs VA | 35 to 39 | 46.0 | 46.2 | 0.2 | 0.8910 | 0.002 |
| F2F vs VA¹ | 40 to 44 | 45.2 | 50.3 | 5.1 | <0.0001 | 0.051 |
| F2F vs VA | 45 to 49 | 49.0 | 50.9 | 1.9 | 0.1350 | 0.019 |
| F2F vs VA¹ | 50 to 54 | 49.6 | 53.3 | 3.6 | 0.0020 | 0.036 |
| F2F vs VA¹ | 55 to 59 | 51.7 | 56.0 | 4.3 | 0.0001 | 0.042 |
| F2F vs VA¹ | 60 to 64 | 54.1 | 57.3 | 3.2 | 0.0030 | 0.031 |
| F2F vs VA | 65 to 69 | 54.4 | 57.9 | 3.5 | 0.1490 | 0.034 |
| F2F vs TA | 16 to 19 | 45.5 | 46.9 | 1.4 | 0.3670 | 0.011 |
| F2F vs TA | 20 to 24 | 40.0 | 41.3 | 1.3 | 0.2810 | 0.009 |
| F2F vs TA | 25 to 29 | 41.7 | 42.4 | 0.7 | 0.5540 | 0.004 |
| F2F vs TA¹ | 30 to 34 | 42.7 | 45.1 | 2.4 | 0.0150 | 0.016 |
| F2F vs TA¹ | 35 to 39 | 46.0 | 48.0 | 2.0 | 0.0490 | 0.013 |
| F2F vs TA¹ | 40 to 44 | 45.2 | 49.4 | 4.2 | <0.0001 | 0.028 |
| F2F vs TA¹ | 45 to 49 | 49.0 | 51.8 | 2.8 | 0.0030 | 0.020 |
| F2F vs TA¹ | 50 to 54 | 49.6 | 52.4 | 2.7 | 0.0010 | 0.019 |
| F2F vs TA¹ | 55 to 59 | 51.7 | 53.8 | 2.1 | 0.0090 | 0.015 |
| F2F vs TA | 60 to 64 | 54.1 | 54.8 | 0.7 | 0.3380 | 0.005 |
| F2F vs TA | 65 to 69 | 54.4 | 56.0 | 1.6 | 0.3410 | 0.012 |
¹ Result is statistically significant at (or below) the .05 level.
Table C.11 PIP award length by attended channel
| Attended channel | N | Mean (months) | Standard deviation |
|---|---|---|---|
| F2F | 11,915 | 34.70 | 8.81 |
| VA | 11,772 | 33.53 | 8.17 |
| TA | 78,512 | 33.48 | 7.85 |
Table C.12 Test of association between PIP award length and attended channel
| Comparison | Test | Mean diff (months) | 95% CI | t | Probability-value |
|---|---|---|---|---|---|
| F2F vs VA¹ | Satterthwaite | 1.18 | 0.96 – 1.39 | 10.67 | <0.0001 |
| F2F vs TA¹ | Satterthwaite | 1.22 | 1.05 – 1.39 | 14.30 | <0.0001 |
¹ Result is statistically significant at (or below) the .05 level.
Section D – Work Capability Assessment (WCA) allocated channel analyses
Annex D presents Chi-square tests of association underpinning the analysis of health award rates by allocated channel, stratified by first recorded ICD10 medical condition, gender and age.
Decision rates are shown for each channel within condition. Statistical significance is assessed at the 5% level (p ≤ 0.05) and effect sizes are provided using Cramer’s V. Where expected cell counts are small, Chi-square results may be unreliable, and Fisher’s exact test should be used.
Independent t-tests have been used to test for association between allocated channel and prognosis period (WCA). Statistical significance is assessed at the 5% level (p ≤ 0.05).
Assessments from Scotland and Northern Ireland were excluded from the results to ensure consistency between the WCA and PIP.
Table D.1 WCA health award by allocated channel
| Allocated channel | Health award | No health award | Health award per cent |
|---|---|---|---|
| F2F | 16,061 | 4,814 | 76.9 |
| VA | 5,777 | 1,556 | 78.8 |
| TA | 54,805 | 15,379 | 78.1 |
Table D.2 Test of association between health award and allocated channel
| Comparison | Test | Statistic | Df | Probability-value |
|---|---|---|---|---|
| F2F vs VA¹ | Pearson chi‑square | 10.5311 | 1 | 0.0012 |
| F2F vs VA¹ | Fisher’s exact (two‑sided) | – | – | 0.0012 |
| F2F vs VA | Cramer’s V | 0.0193 | – | – |
| F2F vs TA¹ | Pearson chi‑square | 12.3011 | 1 | 0.0005 |
| F2F vs TA¹ | Fisher’s exact (two‑sided) | – | – | 0.0005 |
| F2F vs TA | Cramer’s V | 0.0116 | – | – |
¹ Result is statistically significant at (or below) the .05 level.
Table D.3 WCA health award by allocated channel (F2F vs TA) and first recorded ICD10 condition
| First recorded ICD10 condition | Health award (F2F) | No health award (F2F) | Health award (TA) | No health award (TA) |
|---|---|---|---|---|
| Certain infectious and parasitic diseases | 29 | 13 | 78 | 30 |
| Congenital malformations, deformations and chromosomal abnormalities | 14 | 2 | 40 | 1 |
| Diseases of the blood and blood forming organs and certain diseases involving the immune mechanism | 60 | 14 | 133 | 62 |
| Diseases of the circulatory system | 974 | 294 | 2,709 | 898 |
| Diseases of the digestive system | 459 | 217 | 1,606 | 667 |
| Diseases of the ear and mastoid process | 56 | 25 | 179 | 78 |
| Diseases of the eye and adnexa | 160 | 52 | 407 | 151 |
| Diseases of the genitourinary system | 253 | 85 | 713 | 238 |
| Diseases of the musculoskeletal system and connective tissue | 4,234 | 2,240 | 13,316 | 6,429 |
| Diseases of the nervous system | 674 | 176 | 2,172 | 534 |
| Diseases of the respiratory system | 733 | 155 | 2,515 | 457 |
| Diseases of the skin and subcutaneous system | 77 | 33 | 281 | 122 |
| Endocrine, nutritional and metabolic diseases | 361 | 168 | 1,082 | 513 |
| Factors influencing health status and contact with health services | 48 | 34 | 196 | 203 |
| Injury, poisoning and certain other consequences of external causes | 64 | 25 | 178 | 84 |
| Mental and behavioural disorders | 7,524 | 1,142 | 28,049 | 4,469 |
| Neoplasms | 171 | 40 | 502 | 111 |
| Pregnancy, childbirth and the puerperium | 0 | 0 | 5 | 4 |
| Symptoms, signs and abnormal clinical and laboratory findings, not elsewhere classified | 123 | 57 | 445 | 155 |
| Unknown or claimants without diagnosis on the system | 0 | 0 | 1 | 0 |
Table D.4 Test of association between WCA health award and allocated channel (F2F vs TA) and first recorded ICD10 condition
| First recorded ICD10 condition | F2F health award per cent | TA health award per cent | Difference (pp) | Probability-value | Cramer’s V |
|---|---|---|---|---|---|
| Congenital malformations, deformations and chromosomal abnormalities† | 87.5 | 97.6 | -10.06 | 0.126 | 0.2025 |
| Mental and behavioural disorders | 86.8 | 86.3 | 0.56 | 0.173 | 0.0067 |
| Diseases of the respiratory system | 82.6 | 84.6 | -2.07 | 0.137 | 0.0239 |
| Diseases of the blood and blood forming organs and certain diseases involving the immune mechanism¹ | 81.1 | 68.2 | 12.87 | 0.036 | 0.1277 |
| Neoplasms | 81.0 | 81.9 | -0.85 | 0.783 | 0.0096 |
| Diseases of the nervous system | 79.3 | 80.3 | -0.98 | 0.536 | 0.0104 |
| Diseases of the circulatory system | 76.8 | 75.1 | 1.71 | 0.223 | 0.0175 |
| Diseases of the eye and adnexa | 75.5 | 72.9 | 2.53 | 0.476 | 0.0257 |
| Diseases of the genitourinary system | 74.9 | 75.0 | -0.12 | 0.965 | 0.0012 |
| Injury, poisoning and certain other consequences of external causes | 71.9 | 67.9 | 3.97 | 0.484 | 0.0373 |
| Diseases of the skin and subcutaneous system | 70.0 | 69.7 | 0.27 | 0.956 | 0.0024 |
| Diseases of the ear and mastoid process | 69.1 | 69.7 | -0.51 | 0.930 | 0.0048 |
| Certain infectious and parasitic diseases | 69.1 | 72.2 | -3.17 | 0.700 | 0.0315 |
| Symptoms, signs and abnormal clinical and laboratory findings, not elsewhere classified | 68.3 | 74.2 | -5.84 | 0.123 | 0.0552 |
| Endocrine, nutritional and metabolic diseases | 68.2 | 67.8 | 0.40 | 0.863 | 0.0038 |
| Diseases of the digestive system | 67.9 | 70.7 | -2.76 | 0.170 | 0.0253 |
| Diseases of the musculoskeletal system and connective tissue¹ | 65.4 | 67.4 | -2.04 | 0.003 | 0.0187 |
| Factors influencing health status and contact with health services | 58.5 | 49.1 | 9.42 | 0.120 | 0.0708 |
¹ Result is statistically significant at (or below) the .05 level.
† Where expected cell counts are small, Chi-square assumptions may not hold; Fisher’s exact test should be used and results interpreted cautiously.
Tests for ‘Pregnancy, Childbirth and the puerperium’ and ‘Unknown or claimants without diagnosis on the system’ were not undertaken since there was no comparator to test.
Table D.5 WCA health award by allocated channel (F2F vs VA) and first recorded ICD10 condition
| First recorded ICD10 condition | Health award (F2F) | No health award (F2F) | Health award (VA) | No health award (VA) |
|---|---|---|---|---|
| Certain infectious and parasitic diseases | 29 | 13 | 8 | 2 |
| Congenital malformations, deformations and chromosomal abnormalities | 14 | 2 | 4 | 1 |
| Diseases of the blood and blood forming organs and certain diseases involving the immune mechanism | 60 | 14 | 16 | 5 |
| Diseases of the circulatory system | 974 | 294 | 296 | 97 |
| Diseases of the digestive system | 459 | 217 | 156 | 65 |
| Diseases of the ear and mastoid process | 56 | 25 | 14 | 8 |
| Diseases of the eye and adnexa | 160 | 52 | 55 | 15 |
| Diseases of the genitourinary system | 253 | 85 | 95 | 21 |
| Diseases of the musculoskeletal system and connective tissue | 4,234 | 2,240 | 1,402 | 624 |
| Diseases of the nervous system | 674 | 176 | 284 | 60 |
| Diseases of the respiratory system | 733 | 155 | 250 | 61 |
| Diseases of the skin and subcutaneous system | 77 | 33 | 36 | 12 |
| Endocrine, nutritional and metabolic diseases | 361 | 168 | 127 | 42 |
| Factors influencing health status and contact with health services | 48 | 34 | 27 | 16 |
| Injury, poisoning and certain other consequences of external causes | 64 | 25 | 18 | 7 |
| Mental and behavioural disorders | 7,524 | 1,142 | 2,843 | 468 |
| Neoplasms | 171 | 40 | 52 | 13 |
| Pregnancy, childbirth and the puerperium | 0 | 0 | 0 | 1 |
| Symptoms, signs and abnormal clinical and laboratory findings, not elsewhere classified | 123 | 57 | 52 | 15 |
| Unknown or claimants without diagnosis on the system | 0 | 0 | 0 | 0 |
Table D.6 Test of association between WCA health award and allocated channel (F2F vs VA) and first recorded ICD10 condition
| First recorded ICD10 condition | F2F health award per cent | VA health award per cent | Difference (pp) | Probability-value | Cramer’s V |
|---|---|---|---|---|---|
| Certain infectious and parasitic diseases† | 69.1 | 80.0 | -10.95 | 0.492 | 0.0953 |
| Congenital malformations, deformations and chromosomal abnormalities† | 87.5 | 80.0 | 7.50 | 0.676 | 0.0913 |
| Diseases of the blood and blood forming organs and certain diseases involving the immune mechanism† | 81.1 | 76.2 | 4.89 | 0.621 | 0.0507 |
| Diseases of the circulatory system | 76.8 | 75.3 | 1.49 | 0.541 | 0.0150 |
| Diseases of the digestive system | 67.9 | 70.6 | -2.69 | 0.455 | 0.0250 |
| Diseases of the ear and mastoid process | 69.1 | 63.6 | 5.50 | 0.624 | 0.0483 |
| Diseases of the eye and adnexa | 75.5 | 78.6 | -3.10 | 0.597 | 0.0315 |
| Diseases of the genitourinary system | 74.9 | 81.9 | -7.05 | 0.122 | 0.0726 |
| Diseases of the musculoskeletal system and connective tissue¹ | 65.4 | 69.2 | -3.80 | 0.002 | 0.0343 |
| Diseases of the nervous system | 79.3 | 82.6 | -3.27 | 0.200 | 0.0371 |
| Diseases of the respiratory system | 82.6 | 80.4 | 2.16 | 0.394 | 0.0246 |
| Diseases of the skin and subcutaneous system | 70.0 | 75.0 | -5.00 | 0.522 | 0.0509 |
| Endocrine, nutritional and metabolic diseases | 68.2 | 75.2 | -6.91 | 0.088 | 0.0645 |
| Factors influencing health status and contact with health services | 58.5 | 62.8 | -4.25 | 0.645 | 0.0413 |
| Injury, poisoning and certain other consequences of external causes | 71.9 | 72.0 | -0.09 | 0.993 | 0.0008 |
| Mental and behavioural disorders | 86.8 | 85.9 | 0.95 | 0.170 | 0.0125 |
| Neoplasms | 81.0 | 80.0 | 1.04 | 0.852 | 0.0112 |
| Symptoms, signs and abnormal clinical and laboratory findings, not elsewhere classified | 68.3 | 77.6 | -9.28 | 0.154 | 0.0908 |
¹ Result is statistically significant at (or below) the .05 level.
† Where expected cell counts are small, Chi-square assumptions may not hold; Fisher’s exact test should be used and results interpreted cautiously.
Tests for ‘Pregnancy, Childbirth and the puerperium’ and ‘Unknown or claimants without diagnosis on the system’ were not undertaken since there was no comparator to test.
Table D.7 WCA health award by allocated channel and by gender
| Gender | Allocated channel | Health award | No health award | Health award per cent |
|---|---|---|---|---|
| Female | F2F | 8,254 | 2,346 | 77.9 |
| Female | VA | 3,146 | 762 | 80.5 |
| Female | TA | 29,577 | 7,593 | 79.6 |
| Male | F2F | 7,807 | 2,468 | 76.0 |
| Male | VA | 2,631 | 794 | 76.8 |
| Male | TA | 25,228 | 7,786 | 76.4 |
Table D.8 Test of association between WCA health award and allocated channel by gender
| Comparison | Gender | F2F health award per cent | Comparator health award per cent | Difference (pp) | Probability-value | Cramer’s V |
|---|---|---|---|---|---|---|
| F2F vs VA¹ | Female | 77.9 | 80.5 | −2.63 | 0.0006 | 0.0285 |
| F2F vs VA | Male | 76.0 | 76.8 | −0.84 | 0.3193 | 0.0085 |
| F2F vs TA¹ | Female | 77.9 | 79.6 | −1.70 | 0.0001 | 0.0174 |
| F2F vs TA | Male | 76.0 | 76.4 | −0.44 | 0.3645 | 0.0044 |
¹ Result is statistically significant at (or below) the .05 level.
Table D.9 WCA health award by allocated channel and by age
| Age band | Allocated channel | Health award | No health award | Health award per cent |
|---|---|---|---|---|
| Under 18 | F2F | 45 | 7 | 86.5 |
| Under 18 | VA | 18 | 3 | 85.7 |
| Under 18 | TA | 152 | 19 | 88.9 |
| 18 to 24 | F2F | 1,900 | 251 | 88.3 |
| 18 to 24 | VA | 700 | 103 | 87.2 |
| 18 to 24 | TA | 6,706 | 1,016 | 86.8 |
| 25 to 34 | F2F | 2,702 | 692 | 79.6 |
| 25 to 34 | VA | 1,206 | 267 | 81.9 |
| 25 to 34 | TA | 10,757 | 2,606 | 80.5 |
| 35 to 44 | F2F | 3,075 | 1,076 | 74.1 |
| 35 to 44 | VA | 1,189 | 354 | 77.1 |
| 35 to 44 | TA | 11,155 | 3,377 | 76.8 |
| 45 to 49 | F2F | 1,550 | 519 | 74.9 |
| 45 to 49 | VA | 597 | 167 | 78.1 |
| 45 to 49 | TA | 5,293 | 1,585 | 77.0 |
| 50 to 54 | F2F | 1,955 | 620 | 75.9 |
| 50 to 54 | VA | 623 | 191 | 76.5 |
| 50 to 54 | TA | 6,149 | 1,821 | 77.2 |
| 55 to 59 | F2F | 2,167 | 686 | 76.0 |
| 55 to 59 | VA | 713 | 209 | 77.3 |
| 55 to 59 | TA | 6,626 | 2,065 | 76.2 |
| 60 to 64 | F2F | 2,275 | 774 | 74.6 |
| 60 to 64 | VA | 626 | 203 | 75.5 |
| 60 to 64 | TA | 6,796 | 2,264 | 75.0 |
| 65 and over | F2F | 392 | 189 | 67.5 |
| 65 and over | VA | 105 | 59 | 64.0 |
| 65 and over | TA | 1,171 | 626 | 65.2 |
Table D.10 Test of association between WCA health award and allocated channel by age
| Comparison | Age band | F2F health award per cent | Comparator health award per cent | Difference (pp) | Probability-value | Cramer’s V |
|---|---|---|---|---|---|---|
| F2F vs VA† | Under 18 | 86.5 | 85.7 | 0.83 | 1.0000 | 0.0109 |
| F2F vs VA | 18 to 24 | 88.3 | 87.2 | 1.16 | 0.3886 | 0.0159 |
| F2F vs VA | 25 to 34 | 79.6 | 81.9 | −2.26 | 0.0683 | 0.0261 |
| F2F vs VA¹ | 35 to 44 | 74.1 | 77.1 | −2.98 | 0.0212 | 0.0305 |
| F2F vs VA | 45 to 49 | 74.9 | 78.1 | −3.22 | 0.0753 | 0.0334 |
| F2F vs VA | 50 to 54 | 75.9 | 76.5 | −0.62 | 0.7207 | 0.0061 |
| F2F vs VA | 55 to 59 | 76.0 | 77.3 | −1.37 | 0.3928 | 0.0139 |
| F2F vs VA | 60 to 64 | 74.6 | 75.5 | −0.90 | 0.5974 | 0.0085 |
| F2F vs VA | 65 and over | 67.5 | 64.0 | 3.45 | 0.4083 | 0.0303 |
| F2F vs TA | Under 18 | 86.5 | 88.9 | −2.35 | 0.6437 | 0.0310 |
| F2F vs TA | 18 to 24 | 88.3 | 86.8 | 1.49 | 0.0680 | 0.0184 |
| F2F vs TA | 25 to 34 | 79.6 | 80.5 | −0.89 | 0.2456 | 0.0090 |
| F2F vs TA¹ | 35 to 44 | 74.1 | 76.8 | −2.68 | 0.0003 | 0.0262 |
| F2F vs TA | 45 to 49 | 74.9 | 77.0 | −2.04 | 0.0551 | 0.0203 |
| F2F vs TA | 50 to 54 | 75.9 | 77.2 | −1.23 | 0.1985 | 0.0125 |
| F2F vs TA | 55 to 59 | 76.0 | 76.2 | −0.28 | 0.7568 | 0.0029 |
| F2F vs TA | 60 to 64 | 74.6 | 75.0 | −0.40 | 0.6623 | 0.0040 |
| F2F vs TA | 65 and over | 67.5 | 65.2 | 2.31 | 0.3087 | 0.0209 |
¹ Result is statistically significant at (or below) the .05 level.
† Where expected cell counts are small, Chi-square assumptions may not hold; Fisher’s exact test should be used and results interpreted cautiously.
Table D.11 WCA prognosis period by allocated channel
| Allocated channel | N | Mean (months) | Standard deviation |
|---|---|---|---|
| F2F | 14,665 | 21.02 | 6.57 |
| VA | 5,210 | 20.96 | 6.55 |
| TA | 50,039 | 20.89 | 6.70 |
Table D.12 Test of association between WCA prognosis period and allocated channel
| Comparison | Test | Mean diff (months) | 95% CI | t | Probability-value |
|---|---|---|---|---|---|
| F2F vs VA | Satterthwaite | 0.06 | −0.15 to 0.26 | 0.5 | 0.593 |
| F2F vs TA¹ | Satterthwaite | 0.13 | 0.01 to 0.25 | 2.1 | 0.036 |
¹ Result is statistically significant at (or below) the .05 level.
Section E – Channel change analyses
Logistic regression has been used to assess which key characteristics (independent variables) are statistically related to claimants changing channels.
The tests were used to assess the following characteristics:
- primary PIP condition
- gender
- age
As the independent variables considered are categorical variables, the regression analysis provides an insight into which categories within these key characteristics are more or less likely to have caused someone to change channel.
When using categorical variables in regression analysis one of the categories needs to be specified as the baseline group. The odds ratio, EXP (β) of the baseline category, is set as 1. The odds ratios of the other categories are then calculated relative to the baseline category. Where the odds ratio is greater than 1, this category is more likely to have stayed in their allocated channel, compared with the baseline category. Alternatively, where the odds ratio is less than 1, this category is less likely to have stayed in their allocated channel, compared with the baseline category.
Although logistic regression can be used to explore associations between variables, it does not necessarily imply causation, and results should be treated as indicative, rather than conclusive.
Assessments from Scotland and Northern Ireland were excluded from the results due to devolution of powers to the local government, in these regions.
Table E.1 Logistic regression analysis of PIP channel change by primary condition
| PIP primary condition | Odds ratio | 95% Confidence Interval | Probability-value | |
|---|---|---|---|---|
| Anxiety and depression | Reference category | No data | No data | |
| Psychiatric disorders (excluding anxiety and depression)¹ | 0.771 | 0.712–0.835 | <0.0001 | |
| ADHD or ADD | 1.031 | 0.941–1.129 | 0.5152 | |
| Autism¹ | 0.79 | 0.719–0.868 | <0.0001 | |
| Cardiovascular disease | 1.022 | 0.952–1.098 | 0.547 | |
| Endocrine disease¹ | 1.147 | 1.051–1.252 | 0.0021 | |
| Gastrointestinal disease¹ | 1.218 | 1.117–1.327 | <0.0001 | |
| Learning disability¹ | 0.71 | 0.586–0.861 | 0.0005 | |
| Malignant disease¹ | 0.725 | 0.662–0.793 | <0.0001 | |
| Musculoskeletal disease (general)¹ | 1.121 | 1.076–1.168 | <0.0001 | |
| Musculoskeletal disease (regional)¹ | 1.188 | 1.136–1.241 | <0.0001 | |
| Neurological disease | 0.995 | 0.947–1.045 | 0.8321 | |
| Respiratory disease¹ | 1.097 | 1.028–1.171 | 0.0054 | |
| Unknown¹ | 2.297 | 2.002–2.635 | <0.0001 | |
| All other categories¹ | 1.14 | 1.082–1.201 | <0.0001 | |
| Sample size | 254,023 | No data | No data | |
| Reference category odds ratio set to 1 |
Odds ratios below 1 indicate lower odds of being assessed in the originally booked channel. ¹ The result is significant at (or below) the .05 level.
Table E.2 Logistic regression analysis of PIP channel change by age
| Age | Odds Ratio | 95% Confidence Interval | Probability-value |
|---|---|---|---|
| 16 to 24 | Reference category | No data | No data |
| 25 to 34 | 0.989 | 0.937 to 1.043 | 0.6753 |
| 35 to 44 | 0.951 | 0.903 to 1.002 | 0.0602 |
| 45 to 54¹ | 0.933 | 0.887 to 0.983 | 0.0085 |
| 55 to 64¹ | 0.891 | 0.848 to 0.936 | <0.0001 |
| 65 and over¹ | 0.853 | 0.783 to 0.930 | 0.0003 |
| Sample size | 254,024 | No data | No data |
| Reference category odds ratio set to 1 |
Odds ratios below 1 indicate lower odds of being assessed in the originally booked channel.
¹ The result is significant at (or below) the .05 level.
Table E.3 Logistic regression analysis of PIP channel change by gender
| Gender | Odds Ratio | 95% Confidence Interval | Probability-value |
|---|---|---|---|
| Male | Reference category | No data | No data |
| Female | 0.986 | 0.960 to 1.013 | 0.3166 |
| Sample size | 254,024 | No data | No data |
Reference category odds ratio set to 1.
Odds ratios below 1 indicate lower odds of being assessed in the originally booked channel.