Gender pay gap report 1 April 2024 to 31 March 2025
Published 30 March 2026

© Crown copyright 2026
This publication is licensed under the terms of the Open Government Licence v3.0 except where otherwise stated. To view this licence, visit nationalarchives.gov.uk/doc/open-government-licence/version/3 or write to the Information Policy Team, The National Archives, Kew, London TW9 4DU, or email: psi@nationalarchives.gov.uk.
Where we have identified any third party copyright information you will need to obtain permission from the copyright holders concerned.
This publication is available at https://www.gov.uk/government/publications/gender-pay-gap-report-2024-to-2025/gender-pay-gap-report-1-april-2024-to-31-march-2025
Executive summary
The Competition and Markets Authority (CMA) has prepared this report as part of their legal requirement for public sector authorities to publish their gender pay gap (GPG) on an annual basis.
Since the 2023 to 2024 reporting period, there have been the following changes in the CMA’s GPG for the reporting period of 1 April 2024 to 31 March 2025:
- the median earnings GPG has reduced from 4.1% to 0%
- the mean earnings GPG has reduced from 4.9% to 1.3%
- the median bonus GPG has remained unchanged at 0.0%
- the mean bonus GPG has reduced from 6.4% to -7.8%
The CMA is pleased to report a zero percent median earnings GPG and median bonus GPG - our strongest results since reporting on our gender pay gaps. This outcome reflects our sustained commitment to creating greater gender balance at all levels of our organisation. We note that these figures compare favourably against the wider Civil Service, where the overall median gender pay gap for 2024 to 2025 stood at 6.4% and the median bonus gender pay gap stood at 14.3%.
Earnings GPG
The median pay gap has reduced by 4.1ppt and the mean pay gap has reduced by 3.6 percentage points (ppt). The main driver for the reductions this year is increased representation of women particularly at senior grades, where the proportion of female Senior Civil Servants (SCS) increased from 47.5% in 2023 to 2024 to 52.9% in 2024 to 2025. In our lower grades (AO to grade 6), 49.7% of employees are women. Overall, we have equal representation of males (50%) and females (50%).
Bonus GPG
Our median bonus gap has remained unchanged (0.0%), and we have a negative mean bonus gap this year for the first time (-7.8%). Recognising that a flat organisational award was paid to all eligible AO to Grade 6 employees, the greatest contributor to the mean increase is likely to be the bonus arrangements for SCS, where we follow the central SCS pay practitioner guidance and provide differentiated, pro-rated awards. Of all recipients of the SCS bonus, 54.5% were women and 45.5% were men. Women received a higher mean average bonus of £8,107.30, while men received a mean average bonus of £7,763.10. Recognising that the aspiration is to have zero percent pay gaps, it will be important to monitor this.
Targeted action (contributing to the 2025 figures)
We continued to deliver against the final year of our 2020 to 2024 EDI Strategy, which as per the actions set out in the CMA 2023 to 2024 GPG report focused on strengthening our representation, ensuring more inclusive hiring, and supporting progression and retention – all considered to be key drivers in reducing our gender pay gap. We note that at 31 March 2025, we had achieved our ambition for 51.0% of the overall organisation to be female. We also met our ambition for SCS, with women representing 49% of the population. Looking ahead, our ambition is for women to make up 51% of our SCS by the end of 2027.
Introduction
In 2017, the Government introduced legislation that made it statutory for organisations with 250 or more employees to report annually on their gender pay gap. Government departments are covered by the Equality Act 2010 (Specific Duties and Public Authorities) Regulations 2017, which underpin the Public Sector Equality Duty and require relevant organisations to publish their gender pay gap annually by 30 March.
The gender pay gap shows the difference in the average pay between all men and women in a workforce. If a workforce has a particularly high gender pay gap, this can indicate there may be issues to deal with, and the individual calculations may help to identify what those issues are. Where there is a positive percentage, this means that the average pay of male employees is higher than the average pay of female employees. Where there is a negative percentage, this means that the average pay of female employees is higher than the average pay of male employees. The higher the percentage, the greater the gender pay gap.
The gender pay gap is different to equal pay. Equal pay deals with the pay differences between men and women who carry out the same jobs, similar jobs or work of equal value. It is unlawful to pay people unequally because of their gender.
The CMA supports the fair treatment and reward of all employees irrespective of gender.
This report fulfils the CMA’s statutory requirements under gender pay legislation, analyses the figures in more detail, sets out our progress to date and the work we are doing to reduce the gender pay gap. The reporting period is 1 April 2024 to 31 March 2025 and the figures provided align to the gender pay gap figures published in the annual Civil Service Statistics on 30 July 2025.
Organisational context
The CMA is an independent non-ministerial UK Government department and is the UK’s primary competition and consumer protection authority, with a clear purpose to promote competition and protect consumers with a clear end goal – to drive economic growth and improve household prosperity.
Our Equality, Diversity and Inclusion Strategy 2020 to 2024 describes how equality, diversity and inclusion are essential to the way that we operate, both as the UK’s competition authority and as an employer. To deliver that strategy, we developed a series of action plans. Our final action plan (2022 to 2024) focused on 5 key themes:
- recruitment and ‘growing our own’
- career progression and development
- improving senior representation
- pay and reward
- promoting a culture of inclusivity
We have published reviews of our progress against our strategy, objectives and action plans in April 2021, September 2022 and October 2024 and in July 2025 (in our 2024 to 2025 Annual Report).
The highlights of what has been delivered through this action plan, and how it has supported reducing our pay gaps for the reporting period, can be found in the action planning section of this report.
Organisational structure
The number of people (FTE) employed by the CMA at 31 March 2025 was 1,108.8.
For the purpose of the gender pay report though, and as defined by Regulation 2(1) of the Equality Act 2019 (Specific Duties and Public Authorities) Regulations 2017 and the government’s guidance for calculating the gender pay gaps, in this year’s report:
-
1,118 employees have been established to be in scope for calculation to determine the mean and median earnings pay gaps, meaning in receipt of full pay on 31 March 2025
-
1,155 employees have been established to be in scope for the calculation to determine the gender mean and median bonus gaps, covering the 12-month period between 1 April 2024 and 31 March 2025
Of the 1,118 employees in scope for the earnings pay gaps, 34 employees were based in Belfast, 35 in Cardiff, 21 in Darlington, 105 in Edinburgh, 849 in London and 74 in Manchester.
The breakdown of grades at 31 March 2025, and percentage of men and women are shown in the following table.
Figure 1: Male / Female profile at each grade
| Civil Service grade | Total | Male | Female |
|---|---|---|---|
| AO | 31 | 45% | 55% |
| EO | 77 | 45% | 55% |
| HEO | 205 | 48% | 52% |
| SEO | 110 | 57% | 43% |
| Grade 7 | 303 | 50% | 50% |
| Grade 6 | 254 | 52% | 48% |
| SCS PB1 | 103 | 47% | 53% |
| SCS PB2 and PB3 | 35 | 48% | 52% |
| All employees | 1,118 | 50% | 50% |
Overall, the breakdown of men and women is 50% men and 50% women. The gender proportions have therefore remained the same as reported in 2023 to 2024.
Figure 2: Joiners profile between 1 April 2024 and 31 March 2025
| Civil Service grade | Total employees | Male | Female |
|---|---|---|---|
| AO | 21 | 11 | 10 |
| EO | 19 | 12 | 7 |
| HEO | 40 | 17 | 23 |
| SEO | 21 | 14 | 7 |
| Grade 7 | 60 | 27 | 33 |
| Grade 6 | 28 | 15 | 13 |
| SCS PB1 | 5 | 2 | 3 |
| SCS PB2 and PB3 | 7 | 2 | 5 |
| Total Joiners | 201 | 100 | 101 |
Figure 3: Leavers profile between 1 April 2024 and 31 March 2025
| Civil Service grade | Total employees | Male | Female |
|---|---|---|---|
| AO | 22 | 12 | 10 |
| EO | 4 | 1 | 3 |
| HEO | 16 | 4 | 12 |
| SEO | 5 | 2 | 3 |
| Grade 7 | 44 | 20 | 24 |
| Grade 6 | 22 | 11 | 11 |
| SCS PB1 | 16 | 12 | 4 |
| SCS PB2 and PB3 | 5 | 1 | 4 |
| Total Leavers | 134 | 63 | 71 |
Gender pay gap report
The measures contained in this report are:
- the mean and median gender earnings pay gaps
- the mean and median gender bonus gaps
- the proportion of men and women who received bonuses
- the proportions of men and women employees in each pay quartile
In accordance with the current requirements for reporting on the gender pay gap and the gender classifications provided by His Majesty’s Revenue and Customs (HMRC), our approach involves categorising gender into male and female within our data.
In the context of this report, we have employed the terms ‘gender’, ‘male,’ and ‘female,’ understanding that they typically relate to sex assigned at birth. However, we recognise the importance in acknowledging that for some individuals, these terms may not fully encapsulate their gender identity.
The percentage figures used in this report to represent the pay gaps between male and female employees will show whether there is a positive or negative pay gap.
These figures should be interpreted as follows:
-
a positive pay gap (% more than zero) indicates that male earnings are higher than female earnings
-
a negative pay gap (% less than zero) indicates that female earnings are higher than male earnings
Earnings pay gap
Hourly pay is used to calculate the mean and median earnings gender pay gaps. Hourly pay includes basic pay, any allowances and any bonus payments made as at 31 March 2025. Salary sacrifice amounts are deducted from this value.
The calculation for the mean and median earnings pay only includes ‘full pay relevant’ employees, as described in section 1.
The gender pay gap calculations are based on the number of individual employees, and not on full-time equivalents. This means that each part-time employee counts as one employee.
The following table shows the 2024 to 2025 mean gender pay gap (which is the difference between the average hourly pay between men and women) and median gender pay gap (which is the difference between the median hourly pay of men and women) in the CMA.
Figure 4: Median and mean GPG for the last 3 reporting periods
| Pay gap measure | 2024 to 2025 | 2023 to 2024 | 2022 to 2023 |
|---|---|---|---|
| Median pay gap | 0.0% | 4.1% | 5.9% |
| Mean pay gap | 1.3% | 4.9% | 6.8% |
We have continued to see a reduction in our pay gaps and are pleased to report a zero percent median pay gap – our strongest results since reporting on our gender pay gaps. We note that these figures compare favourably against the wider Civil Service, where the median gender pay gap was 6.4% and the mean gender pay gap was 6.9% in 2024 to 2025.
Bonus pay gap
Bonus pay, which is also calculated as mean and median, is based on bonus payments paid to employees throughout the 2024 to 2025 financial year.
This calculation may include employees who are not ‘full pay relevant’ employees but will not include employees who left the CMA before 31 March 2025.
At the CMA, usually bonus pay includes any performance related pay (PRP). These are payments based on performance management outcomes for the previous financial year. In the case of employees in grades AO to Grade 6, these payments are negotiated annually with our recognised trade unions.
For the 2024 to 2025 pay award year, there continued to be no link between performance and pay. Instead, in recognition of the continuing high performance across the CMA in that period, we paid a flat non – consolidated payment of £982 to all eligible employees in the December 2024 payroll. To be eligible for the £982 payment, individuals needed to have been in post between 1 January and 31 March 2024 and received a CMA 2023 to 2024 performance rating. In addition, we agreed to make a quarter payment of £245.50 to employees who started between 1 January and 31 March 2024 and were still employed by the CMA on 1 December 2024. This award was included in the bonus payments made during the 2024 to 2025 financial year and is therefore included in the bonus gap calculations.
For SCS employees, there are separate arrangements which are centrally set by government each year. SCS Bonus is included in the bonus calculations and is the biggest contributor to changes in the bonus gap every year.
The following table shows the 2024 to 2025 mean bonus gap (which is the difference between the average bonus pay between men and women) and the median bonus gap (which is the difference between the median of the bonus pay of men and women) in the CMA.
Figure 5: Mean and median bonus GPG for the last 3 reporting periods
| Pay gap measure | 2024 to 2025 | 2023 to 2024 | 2022 to 2023 |
|---|---|---|---|
| Mean bonus gap | -7.8% | 6.4% | 5.6% |
| Median bonus gap | 0.0% | 0.0% | 0.0% |
It is noteworthy that the 2024 to 2025 CMA median bonus gap is significantly below the average Civil Service median bonus GPG of 14.3%. The CMA have a negative mean bonus gap for 2024 to 2025 at -7.8%, which means that women received a higher average bonus than men in this reporting year. Recognising that the aspiration is to have zero percent pay gaps, it will be important to monitor this.
Percentage of males and females receiving a bonus in 2025
In the 2024 to 2025 financial year, 77.7% of male employees received a bonus payment compared with 69.3% in 2023 to 2024. 79.3% percentage of female employees received a bonus compared to 69.8% in 2023 to 2024.
Pay quartiles
The pay quartiles show the proportion of male and female employees across each of the quartiles. They are calculated through ranking all salaries from the highest to the lowest paid, in terms of hourly pay and dividing the list into quarters.
Figure 6: Distribution of males and females across the pay quartiles
| Pay quartiles | Male | Female |
|---|---|---|
| Lower quartile | 47.9% | 52.1% |
| Lower middle quartile | 50.5% | 49.5% |
| Upper middle quartile | 52.9% | 47.1% |
| Upper quartile | 48.7% | 51.3% |
| All | 49.5% | 50.5% |
The pay quartile distribution shows that we have a higher proportion of female employees in the lower and upper quartiles. We have a higher proportion of males in the middle quartiles (lower and upper).
Historically, a higher proportion of females have occupied our most junior grades, however, we have seen more balance proportionately by gender across all grades. Overall, the proportion of females is slightly higher (50.5%) than males but this more even distribution is a significant contributor to our reduced pay gaps for 2024 to 2025.
Earnings pay gap analysis
In 2024 to 2025 we reduced our mean pay gap by 3.6ppt and the median pay gap has reduced by 4.1ppt, continuing the decline over recent years as outlined below. This is the smallest pay gap we have seen since reporting began. Our pay gaps remain smaller than the wider Civil Service, which reports a median gender pay gap of 6.4% and a mean gender pay gap of 6.9%. It is also the lowest reported gap for both measures since overall Civil Service reporting began in 2020.
Figure 7: Mean and median GPG for the last 3 reporting periods
| Pay gap measure | 2024 to 2025 | 2023 to 2024 | 2022 to 2023 |
|---|---|---|---|
| Mean pay gap | 1.3% | 4.9% | 6.8% |
| Median pay gap | 0.0% | 4.1% | 5.9% |
The primary reason likely to have contributed to the pay gaps decreasing, is the increase of the proportion of females in higher grades (SCS level) and balancing the representation of males and females across junior grades.
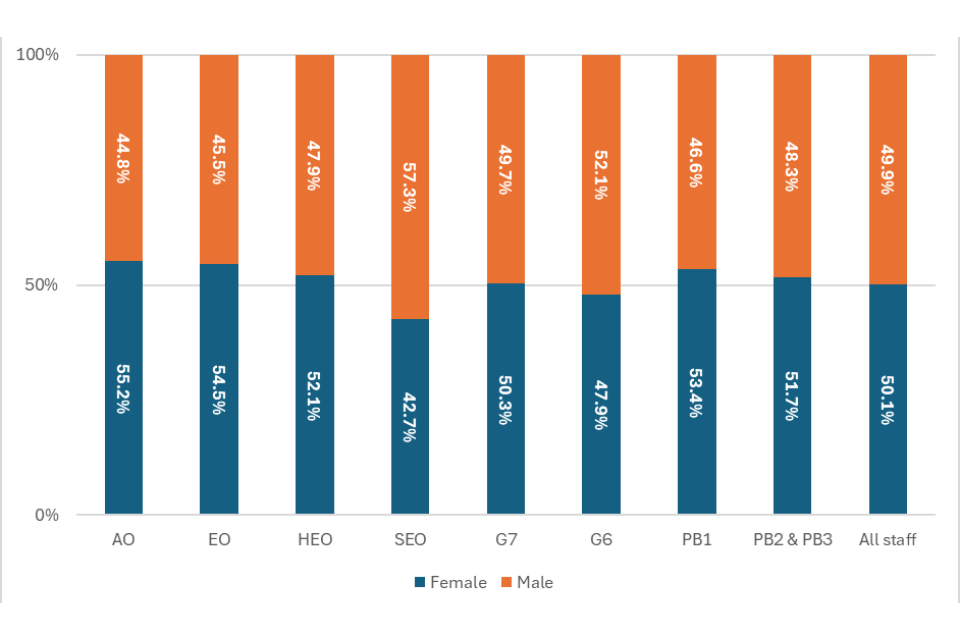
The chart below shows that overall, we have parity of males and females in the organisation. We have higher female representation at AO (52.2%), EO (54.5%), HEO (52.1%) and G7 (50.3%), as well as in our most senior grades SCS PB1 (53.4%) PB2 and PB3 (51.7%). We only have higher proportions of males at SEO (57.3%) and G6 (52.1%). The largest difference is proportions by grade is at SEO.
Figure 8: Gender distribution by grade
There were smaller proportions of females than males recruited in our most junior grades, AO (47.6%) and EO (36.8%). Of the new recruits to the SCS grades in 2024 to 2025, 66.7% were female and 33.3% were male. Given the elevated salary levels of the SCS compared to the AO to G6 salaries, this is also likely to be a contributor to the reduction of our pay gaps.
At SCS level, 61.9% of leavers were male (compared to 47.0% of all levers). This has contributed to the increase in the proportion of women at SCS level, the salary level of the male SCS leavers may have also contributed to the reduction in the pay gaps e.g. if a male leaver on a salary at the top end of SCS PB1 was replaced by a new joiner on at the SCS PB1 minima.
The percentage of women in SCS positions in the CMA has increased from 47.5% in 2023 to 2024 to 52.9% in 2024 to 2025. This is higher than the percentage of women in SCS positions across the wider civil service, at 49.2%.
In addition, whilst it is also positive that we have reduced the earnings pay gaps so significantly, we acknowledge that there still is a marginal difference when looking at the mean pay gap.
We consider the DDAT allowance to be a contributing factor towards, noting that we still have an imbalance in the proportion of recipients by gender, with 70.3% being male and as outlined in Figure 9 further below, we have positive mean pay gaps at the grades where DDAT allowances are applied (for example, SEO, Grade 7 and Grade 6). However, we note that the largest mean pay gap is at the SCS PB1 level, suggesting the largest contributor to our mean gap is likely to be the driven by the differential salaries at this level.
Earnings pay gaps by grade
Looking at the mean (1.3%) and median (0.0%) gender pay gaps by grade; we see very marginal pay gap differentials in 2024 to 2025.
Figure 9: Median and mean GPG by grade
| Civil Service grade | 2024 to 2025 median pay gap | 2024 to 2025 mean pay gap | 2023 to 2024 median pay gap | 2023 to 2024 mean pay gap |
|---|---|---|---|---|
| AO | -1.36% | -0.42% | 0.0% | 0.31% |
| EO | 0.0% | 0.66% | 1.68% | 0.92% |
| HEO | 0.0% | -0.75% | 0.0% | -1.38% |
| SEO | 0.0% | 1.77% | 0.0% | 1.57% |
| Grade 7 | 0.0% | 0.96% | 2.28% | 1.73% |
| Grade 6 | -1.17% | 0.36% | 0.61% | 1.23% |
| SCS PB1 | 0.03% | 1.94% | 0.0% | 1.61% |
| SCS PB2 and PB3 | 1.77% | -0.08% | -0.44% | 1.91% |
| All employees | 0.0% | 1.3% | 4.10% | 4.9% |
Our median pay gaps have reduced or remained at zero across most grades except SCS PB1 (+0.03pp) and PB2 and PB3 which has seen an increase (+2.21pp). The largest reduction has been at Grade 7 (-2.28pp).
Our mean pay gaps have reduced across most grades except HEO (+0.63pp), SEO (+0.20pp) and SCS PB1 (+0.33pp), which have seen marginal increases. The largest reduction has been at SCS PB2 and PB3 (-1.99pp).
Bonus pay gap analysis
For 2024 to 2025, the CMA median bonus gap is 0%, which continues the trend over the two previous reporting periods. This is significantly below the 2024 to 2025 Civil Service median bonus GPG of 14.3%. However, we have seen a significant change in the mean bonus gap, where women received a higher average bonus than men this reporting year. The CMA have a negative mean bonus gap of -7.8%, in stark contrast to the Civil Service mean bonus gender pay gap of 22.5%.
Figure 10: Mean and median bonus GPG for the last 3 reporting periods
| Pay gap measure | 2024 to 2025 | 2023 to 2024 | 2022 to 2023 |
|---|---|---|---|
| Mean bonus gap | -7.8% | 6.4% | 5.6% |
| Median bonus gap | 0.0% | 0.0% | 0.0% |
The reason our median pay gap has remained at 0% is due to the application of our organisational award. There continued to be no link between performance ratings and the organisational award for AO to G6 employees. A flat rate award was paid to eligible employees, with those joining in the last quarter of the performance year receiving a quarter payment (as detailed in section 2.2).
The key reason for the reduction in our mean bonus gap for 2024 to 2025 is due to the SCS bonus distribution. At SCS level, 47.9% of all eligible employees received a bonus based on their individual performance. Of these, 51.2% were women and 48.8% were men. Women also received a higher average award based on their grade and performance rating.
Bonus gaps by grade
Looking at the bonus pay gaps by grade, we have seen a significant change in 2024 to 2025 compared to 2023 to 2024.
Figure 11: Mean and median bonus GPG by grade
| Civil Service grade | 2024 to 2025 median bonus gap | 2024 to 2025 mean bonus gap | 2023 to 2024 median bonus gap | 2023 to 2024 mean bonus gap |
|---|---|---|---|---|
| AO | 0.0% | 20.45% | 0.0% | 2.86% |
| EO | 0.0% | 4.05% | 0.0% | 1.79% |
| HEO | 0.0% | -5.12% | 0.0% | 1.91% |
| SEO | 0.0% | -5.85% | 0.0% | 1.08% |
| Grade 7 | 0.0% | -1.46% | 0.0% | 0.02% |
| Grade 6 | 0.0% | -1.92% | 0.0% | 1.71% |
| SCS PB1 | 0.0% | -5.93% | 5.0% | 12.6% |
| SCS PB2 and PB3 | -12.05% | -12.23% | -5.26% | -0.31% |
| All employees | 0.0% | -7.8% | 0.0% | 6.4% |
In 2024 to 2025, our median pay gaps have remained at 0% for all grades except SCS PB1, where the gap has reduced (-5pp) from 2023 to 2024 to 2024 to 2025. The largest reduction is at SCS PB2 and PB3 (-6.79pp) which has a negative pay gap of -12.05%.
We have a negative mean bonus pay gaps at all grades except AO and EO. The large bonus pay gap seen at AO (20.45%) is due to the proportion of female recipients that received a quarter non – consolidated payment of £245.50 due to starting between 1 January and 31 March 2024. We did not have any male new starters during this period at AO grade, which means all male employees received the full non – consolidated payment of £982.
Targeted action
In 2023 to 2024 we set out a number of actions that would help us to reduce our pay gaps across 2024 to 2025, which were:
Committing to being a diverse and inclusive organisation
2023 to 2024 action: We will communicate to the organisation our ambitions for diversity representation, across women, ethnic minorities, black, disability and our Lesbian, Gay, Bisexual, Other (LGBO) community, for grades AO to G6 and SCS. The ambitions have been centrally set using the UK Census (2021) and we will track progress quarterly.
In 2024 to 2025, we shared our ambitions with the organisation and we use our diversity dashboard to measure and report quarterly on our representation, including women. for grades AO to G6 and SCS. Our ambitions are internal goals to build stronger representation particularly in our SCS and G6 to G7 pipelines.
Reviewing our end-to-end recruitment process
2023 to 2024 action: It is important to us that we ensure our recruitment process is inclusive and therefore we will commission an external review of all our recruitment processes.
In 2024 to 2025, we commissioned an Inclusivity Diagnostic on the impact of our hiring processes through 9 candidate diversity lenses. The review included qualitative analysis, user feedback and candidate impact research, and provided a set of actionable recommendations based on best practice from industry and academic research.
In response to the feedback, we have developed new interactive candidate packs which share more information on the CMA, the role being recruited to, and the benefits of working in our organisation. Other improvements include refreshing our LinkedIn Life pages, spotlighting areas of our work.
Retaining our employees
2023 to 2024 action: This is critical in maintaining our representation, and continuing to reduce our pay gaps, therefore we will continue to deliver our existing development programmes as well as review where we have any gaps to enable us to achieve our ambitions, and to improve representation, particularly in SCS roles.
In 2024 to 2025, our career development programme focussed on building leadership capability and supporting colleague progression through a range of targeted initiatives. We continued to offer career development programmes such as Aspire and Crossing thresholds which support confidence, career planning and overcoming barriers to progression, with 1:1 coaching provided to all participants.
Leadership development was further supported through Whitehall & Industry Group programmes, including the Women’s leadership programme and the Civil Service Future Leaders programme, which offers tailored modules for employees from protected backgrounds. In addition coaching and mentoring remained available to support employees to develop skills, navigate challenges and progress their careers.
Our future plans
In April 2025, we published our EDI and Wellbeing priorities for 2025 to 2026. Our work aligned to our Equality objectives and our success measures as outlined below.
Equality objectives
- strategic objective 1 – building a Diverse and Inclusive Workforce that reflects and understands the public we serve
- strategic objective 2 – ensuring all employees are valued and can contribute to our success
- strategic objective 3 – empowering and enabling all our employees to thrive and prosper
Success measures
A representative workforce. We are clear on our representation ambitions, helping us to:
- maintain the improvement and/or further address where the gender pay gaps are not zero, for which maintaining our representation of women in senior roles is a significant contributing factor
- continue to reduce inequality in performance and development.
- improve our Inclusion and Wellbeing indexes
Our next GPG report will be published by March 2027, for the period of 1 April 2025 to 31 March 2026, and we will report further on the progress that we have made in that period.
Declaration
We confirm that data reported by the CMA is accurate and has been calculated according to the requirements and methodology set out in the Equality Act 2010 (Specific Duties and Public Authorities) Regulations 2017.