Fraud and Error in the Benefit System 2019 to 2020
Updated 29 May 2020
Applies to England, Scotland and Wales

© Crown copyright 2020
This publication is licensed under the terms of the Open Government Licence v3.0 except where otherwise stated. To view this licence, visit nationalarchives.gov.uk/doc/open-government-licence/version/3 or write to the Information Policy Team, The National Archives, Kew, London TW9 4DU, or email: psi@nationalarchives.gov.uk.
Where we have identified any third party copyright information you will need to obtain permission from the copyright holders concerned.
This publication is available at https://www.gov.uk/government/statistics/fraud-and-error-in-the-benefit-system-financial-year-2019-to-2020-estimates/fraud-and-error-in-the-benefit-system-2019-to-2020
1. Introduction
The Department for Work and Pensions (DWP) pays welfare benefits to around 20 million people. ‘Fraud and Error in the Benefit System’ estimates how much money the department incorrectly pays, either by paying people too much benefit – overpayments – or by not paying enough benefit – underpayments. We calculate this as a percentage of the total amount of benefit we pay – expenditure.
Overpayments and underpayments happen as a consequence of fraud, claimant error and official error (processing errors or delays by DWP, a Local Authority, or Her Majesty’s Revenue and Customs (HMRC)).
Most estimates in this publication relate to reviews carried out October 2018 to September 2019 (August 2018 to July 2019 for Personal Independence Payment and May to December 2019 for Carer’s Allowance). The rates found are then applied to the expenditure for 2019 to 2020 to estimate the monetary amount of fraud and error. The benefit expenditure figures used are consistent with Spring Budget 2020, and do not include any rises in benefit expenditure in late March due to claims made as a result of the Coronavirus (COVID-19) pandemic.
Due to changes we have made to our methodology, estimates for 2019 to 2020 and 2018 to 2019 can be compared, but comparisons cannot be made to earlier years (see section 6 of the background and methodology document) for more information about this.
2. Main stories
2.4% of benefit expenditure was overpaid in 2019 to 2020:
- it amounted to £4.6 billion of overpayments
- the overpayment rate has increased from the 2018 to 2019 rate of 2.1%
1.1% of benefit expenditure was underpaid in 2019 to 2020:
- it amounted to £2 billion of underpayments
- the underpayment rate has remained the same as in 2018 to 2019
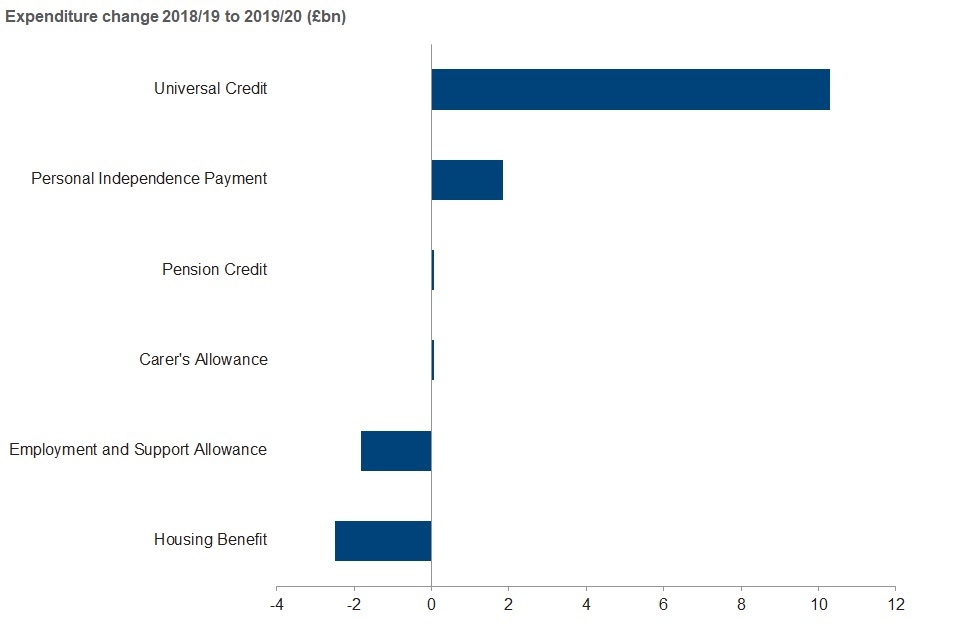
The overpayment rate has risen because more people are now on Universal Credit:
- the expenditure on Universal Credit more than doubled between 2018 to 2019 and 2019 to 2020
- Universal Credit has the highest rate of overpayments of all benefits (9.4%)
3. What you need to know
This document contains estimates of the level of fraud and error in the benefit system. The main measure we use is the percentage of benefit expenditure that is overpaid or underpaid. We also show this as an amount in pounds. The amount in pounds could go up, even if the percentage stays the same, if the amount of benefit we pay out in total goes up. The amounts in pounds are not adjusted for inflation. When comparing over time, we recommend comparing percentage rates rather than monetary amounts for these reasons.
We measure fraud and error so we can understand the levels, trends and reasons behind it. This understanding supports decision making on what actions DWP can take to reduce the level of fraud and error in the benefit system. The National Audit Office takes account of the amount of fraud and error when they audit DWP’s accounts each year.
Published tables and data
The figures in this document are a selection from the reference tables accompanying this release. The tables contain further breakdowns of the results presented in this report by different characteristics, with time series data back to 2005 to 2006 for some benefits.
How we measure fraud and error
We take a sample of benefit claims from our administrative systems (we sampled around 16,000 in 2019 to 2020, equating to 0.1% of benefit claimants). DWP’s Performance Measurement team look at the data we hold on the systems and then contact claimants to arrange a review. We either visit claimants or phone them. As part of the review we ask them to provide evidence such as identity, bank account details and other information that could affect their benefit claim (for example, childcare costs). We assess if the claim is correct or not. If the claim is not correct, we look at the amount of money the claim is wrong by and classify it as fraud, claimant error or official error (Read more about definitions of fraud, claimant error and official error).
We don’t measure all of the benefits that DWP pays. For 2019 to 2020 we measured Universal Credit, Housing Benefit, Employment and Support Allowance, Personal Independence Payment, Pension Credit and Carer’s Allowance. For the others, we use historical rates or proxy measures. For more information, see Appendix 3 of the background and methodology document.
Methodology changes
A number of methodology changes have been made to this year’s estimates of fraud and error in the benefit system. Revised figures for 2018 to 2019 using the new methodology are included in this publication, and are used when making comparisons between 2018 to 2019 and 2019 to 2020. Comparisons should not be made to years prior to 2018 to 2019.
Further details on the changes are available in this publication and in section 6 of our background and methodology document. Changes to the assumption for ‘Cannot Review’ cases have the largest impact on the estimates. More details on this can be found in Appendix 3 of this publication.
Statistical significance and confidence intervals
These estimates are based on a sample of benefit claims receiving a monetary payment. Choosing a different sample might give us a different estimate. The figure we quote is the central estimate. We also show a range around the central estimate, called a Confidence Interval. A simplified view of this is that we are 95% sure that the true value lies within this interval (for a more detailed explanation see our variance and confidence intervals document).
Statistical significance is an expression that says whether an estimated value is likely to have arisen only from variations in the sampling. It is most often used when talking about a change or a difference: a significant change or difference is one that is not likely to be due only to the sampling, and is therefore likely to be a real change or difference. In this publication we note when changes since the previous year are statistically significant.
4. Total Estimates of fraud and error across all benefit expenditure
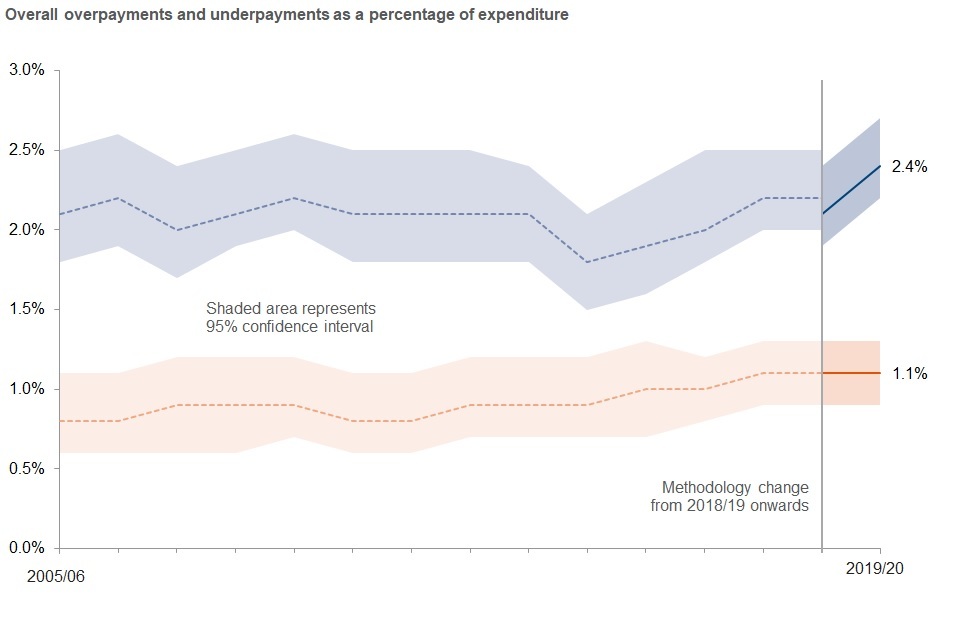
Total overpayments in 2019 to 2020 were 2.4% and total underpayments were 1.1%. The total overpayment and underpayment rates are estimates of fraud and error across all benefit expenditure.
The estimate of the total rate of overpayments in 2019 to 2020 was 2.4%, an increase from 2.1% in 2018 to 2019. The confidence interval around the 2019 to 2020 estimate of 2.4% means we think the true value lies between 2.2% and 2.7%. The rise in the total rate of overpayments from 2.1% in 2018 to 2019 was not statistically significant.
The estimate of the monetary value of overpayments was £4.6billion. This compares to £3.9 billion for overpayments in 2018 to 2019. Benefit expenditure increased from £183.7 billion in 2018 to 2019 to £191.7 billion in 2019 to 2020.
Overpayments on benefits reviewed in 2018 to 2019 and 2019 to 2020
| Benefit | Expenditure (2018 to 2019) | Overpayment Rate (2018 to 2019) | Monetary Value (2018 to 2019) | Expenditure (2019 to 2020) | Overpayment Rate (2019 to 2020) | Monetary Value (2019 to 2020) |
|---|---|---|---|---|---|---|
| Universal Credit | £8.1 billion | 8.7% | £700 million | £18.4 billion | 9.4% | £1,730 million |
| Housing Benefit | £20.8 billion | 6.3% | £1,300 million | £18.3 billion | 6.0% | £1,090 million |
| Employment and Support Allowance | £15.3 billion | 3.5% | £540 million | £13.4 billion | 4.1% | £550 million |
| Personal Independence Payment | £10.6 billion | 3.1% | £330 million | £12.5 billion | 1.5% | £190 million |
| Pension Credit | £5.1 billion | 4.2% | £210 million | £5.1 billion | 5.3% | £270 million |
| Carer’s Allowance | Not measured | Not measured | Not measured | £2.9 billion | 5.2% | £150 million |
The total rate of overpayments has risen due to the increase in expenditure on Universal Credit (which has more than doubled between 2018 to 2019 and 2019 to 2020) and because Universal Credit has a higher rate of overpayments than any of the other benefits we measure. The increase in the overpayment rate for Universal Credit from the 2018 to 2019 rate has a marginal impact; if the overpayment rate for Universal Credit had remained at 8.7%, the total rate of overpayments for 2019 to 2020 would have risen to 2.3%.
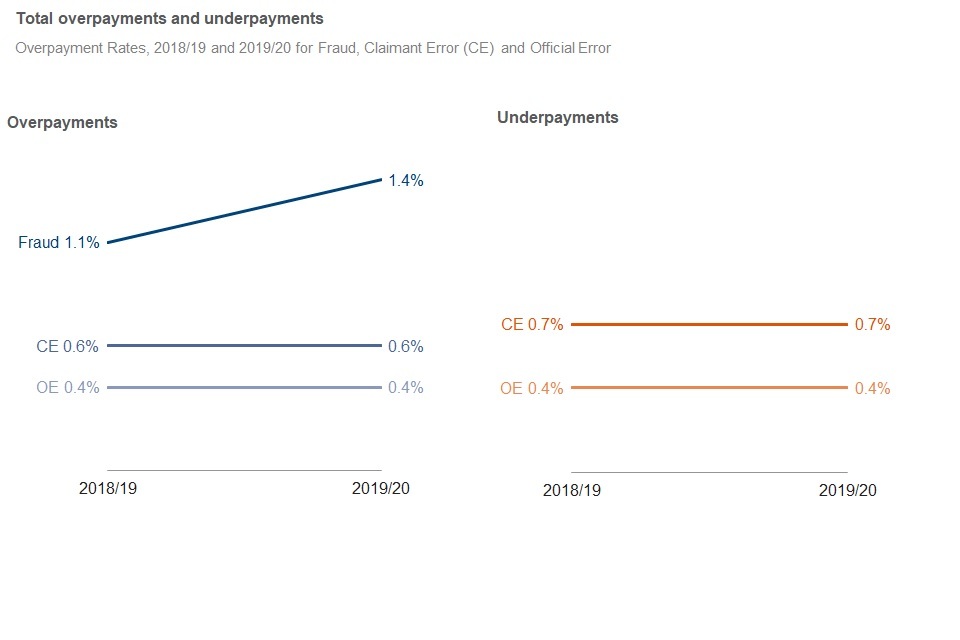
Fraud overpayments rose from 1.1% in 2018 to 2019 to 1.4% in 2019 to 2020.
This increase was not statistically significant. The rise was mainly due to an increase in fraud overpayments on Universal Credit.
Official Error and Claimant Error overpayment rates were the same as in 2018 to 2019.
State Pension is the benefit with the highest expenditure (£98.8 billion in 2019 to 2020; over half the total) but has the lowest rate of overpayments (0.1%). Only the rate of Official Error was measured for State Pension in 2019 to 2020, with the rates for Fraud and Claimant Error rolled forward from when they were last measured in 2005 to 2006.
The estimate of the total rate of underpayments in 2019 to 2020 was 1.1%, with the estimate of their monetary value being £2billion.
Both the rate and monetary value are the same as in 2018 to 2019.
Note: There has been a change in the methodology used to calculate these fraud and error estimates, which means that comparisons cannot be made to figures prior to the 2018 to 2019 figures. Read more details about methodology changes.
Net loss from overpayments
DWP can recover overpayments from people – this means not all of the £4.6 billion is lost, and we can describe a net loss figure which deducts recoveries from total overpayments. In 2019 to 2020, we recovered £1 billion of overpayments (£0.6billion Housing Benefit and £0.4 billion other DWP benefits), a slight fall from £1.1 billion in 2018 to 2019.
The net rate of loss from overpayments in 2019 to 2020 was 1.9%, or £3.6 billion. This has increased from the 2018 to 2019 rate of 1.5% (£2.8 billion).
5. Universal Credit overpayments and underpayments
Universal Credit overpayments and underpayments remained broadly the same.
Universal Credit (UC) is a payment to help with living costs for people who are in work on a low income, or for those who are out of work. Eligibility for Universal Credit depends on individual circumstances and location. Advances for UC are not included in UC totals; see section 5 of the background and methodology document.
As UC is made available to more families, workers and people with housing costs, the amount of UC paid to claimants is changing. This is reflected in the types of error found and the overall average amount paid incorrectly. Differences between the 2019 to 2020 estimates and figures for previous years may in part be due to this change in the makeup of cases on the benefit. The expenditure on Universal Credit increased from £8.1 billion in 2018 to 2019 to £18.4 billion in 2019 to 2020. This means that the monetary values of fraud and error cannot be directly compared year on year. In addition, continued roll out of UC has seen an increase in the size and complexity of the caseload, so like-for-like comparisons cannot be made between related benefits or previous time periods.
Total Universal Credit overpayments increased from a rate of 8.7% in 2018 to 2019 to 9.4% in 2019 to 2020. This change was not statistically significant.
This was mainly due to an increase in fraud overpayments, which went from 6.0% to 7.6%. This rise in fraud was because a higher proportion of UC cases had a fraud overpayment. The proportion of UC cases with fraud overpayments increased from 14 in 100 cases in 2018 to 2019 to 17 in 100 cases in 2019 to 2020, which was a statistically significant increase. Fraud capital errors were the biggest reason for the rise in the Fraud overpayment rate; this went from 1.7% to 2.8%. This was statistically significant.
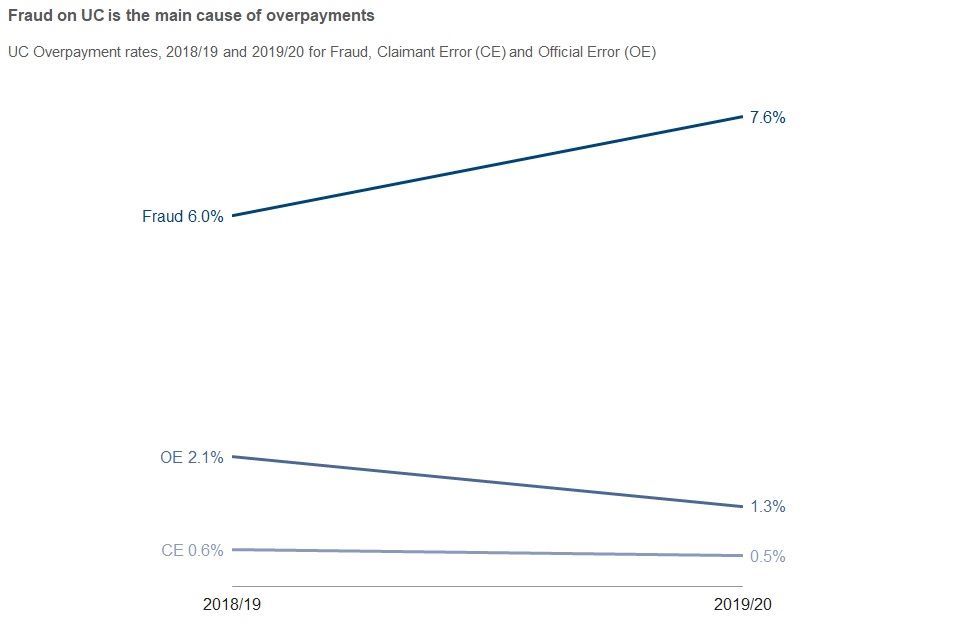
Official Error overpayments have reduced from 2.1% to 1.3%. The proportion of UC cases with official error overpayments decreased from 6 in 100 cases in 2018 to 2019 to 4 in 100 cases in 2019 to 2020, a statistically significant decrease. The main driver behind the fall in Official Error is a reduction from 1.2% to 0.3% (change was statistically significant) in Conditions of Entitlement Official Errors. This reduction was expected – previously, most of these errors were due to DWP staff accepting the Claimant Commitment. The department has been going through the cases in payment, identifying and correcting errors of this type, as well as issuing communications to staff to raise awareness and reduce the chance of future errors of this type occurring.
Claimant Error overpayments have slightly decreased, from 0.6% to 0.5%.
Underpayments on Universal Credit remained broadly the same, with there being a small (not statistically significant) decrease from the 2018 to 2019 rate of 1.3% to 1.1% in 2019 to 2020.
The main reason for this was a reduction in Claimant Error underpayments, from 0.7% to 0.6%. The main contributor to this is Housing Cost errors, which have decreased from 0.3% to 0.2%.
Official Error underpayments remained broadly the same as in 2018 to 2019.
6. Housing Benefit overpayments and underpayments
Housing Benefit overpayments and underpayments remained broadly the same.
People get Housing Benefit (HB) to help pay rent if they are on a low income. How much they get depends on their income and circumstances. Unemployed, working, or retired people can apply for Housing Benefit, as can people who are ill or disabled. HB expenditure decreased from £20.8 billion in 2018 to 2019 to £18.3 billion in 2019 to 2020.
The published HB estimates are split into working age and pension age. These 2 groups can be further broken down into “passported” and “non-passported”, meaning that HB is made up of 4 groups. Only 2 of these 4 groups were reviewed in 2019 to 2020. For the other 2 groups, the rates found in 2018 to 2019 were applied to the 2019 to 2020 expenditure. The groups combine to produce the estimates on this page. For more information, see section 3 of the background and methodology document.
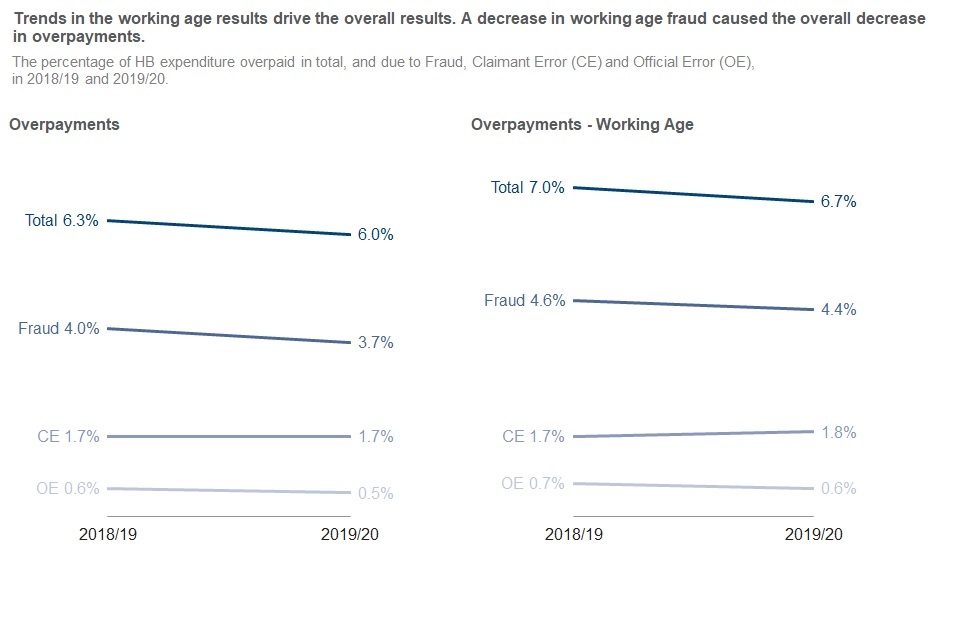
Overpayments on Housing Benefit remained broadly the same, with the decrease from the 2018 to 2019 rate of 6.3% to 6.0% in 2019 to 2020 not being statistically significant.
The monetary value of overpayments fell from £1,300 million to £1,090 million, partially due to the fall in overpayments and partially due to the fall in expenditure. HB expenditure is decreasing as some claimants are now on Universal Credit instead.
Overpayments fell due to a decrease in Fraud, from the 2018 to 2019 rate of 4.0% to 3.7% in 2019 to 2020. This was because a lower proportion of cases had Fraud overpayments. The proportion of HB cases with Fraud overpayments decreased from 9 in 100 cases in 2018 to 2019 to 7 in 100 cases in 2019 to 2020, a statistically significant decrease.
There was also a decrease in Official Error, from the 2018 to 2019 rate of 0.6% to 0.5% in 2019 to 2020.
Claimant Error remained the same as in 2018 to 2019.
HB is paid to people of both working age and pension age, with almost £7 in every £10 of HB expenditure being paid to working age claimants. Overpayments were higher for the working age group, at 6.7% of expenditure (£840 million of the total £1,090 million overpaid in 2019 to 2020), compared to 4.3% for pension age claimants. This is because the main cause of overpayments on Housing Benefit is incorrect information about earnings and employment (for example, people not telling us what they have been paid), which mainly applies to working age people.
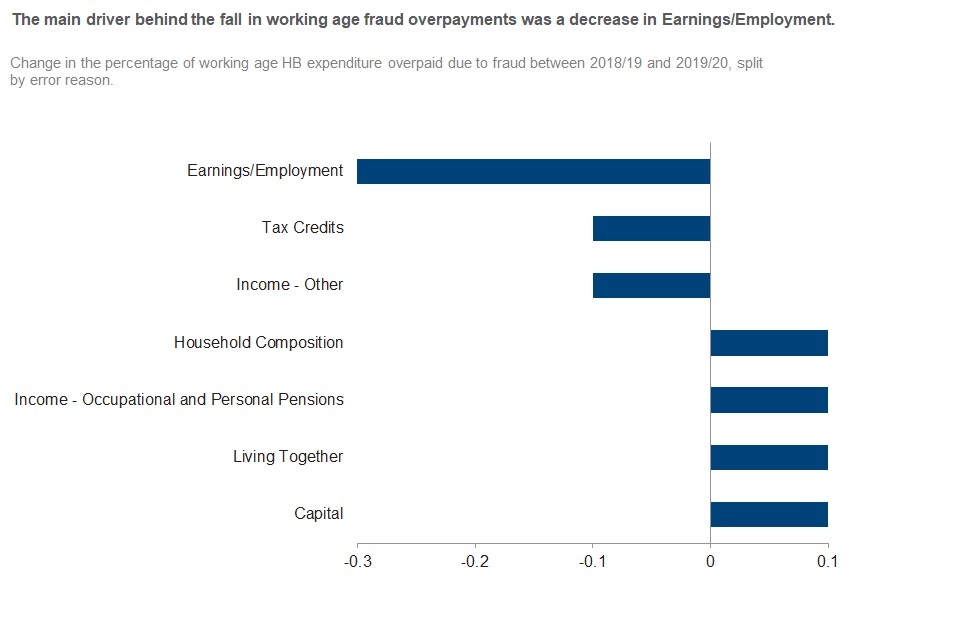
Working age overpayments decreased from the 2018 to 2019 rate of 7.0% to 6.7% in 2019 to 2020, due to a fall in fraud overpayments.
Fraud fell due a decrease in incorrect information being provided about earnings and employment, which decreased from the 2018 to 2019 rate of 2.4% to 2.1% in 2019 to 2020. This was due to a statistically significant decrease in Fraud related to incorrect information about earnings for employees, which fell from 2% in 2018 to 2019 to 1.6% in 2019 to 2020.
Note that Earnings/Employment errors for HB are split into 2 groups: employees and self-employed.
This led to a statistically significant decrease in overall overpayments related to incorrect information about earnings for employees (because most HB expenditure is paid to working age claimants), which caused the decrease in total HB overpayments.
Underpayments on Housing Benefit remained broadly the same, with the increase from the 2018 to 2019 rate of 1.5% to 1.7% in 2019 to 2020 not being statistically significant.
The monetary value of underpayments in 2019 to 2020 was £310 million.
Underpayments increased due to an increase in Claimant Error, from 1.1% in 2018 to 2019 to 1.3% in 2019 to 2020.
Official Error remained the same as in 2018 to 2019.
7. Employment and Support Allowance overpayments and underpayments
Employment and Support Allowance overpayments and underpayments remained broadly the same^.
Employment and Support Allowance (ESA) is paid in support of people who have limited capability to work due to disability or illness. ESA provides personalised help to return to work for claimants with sufficient capability.
The expenditure on ESA for the 2019 to 2020 financial year is £13.4 billion. This has decreased by £1.9 billion from the 2018 to 2019 expenditure of £15.3 billion.
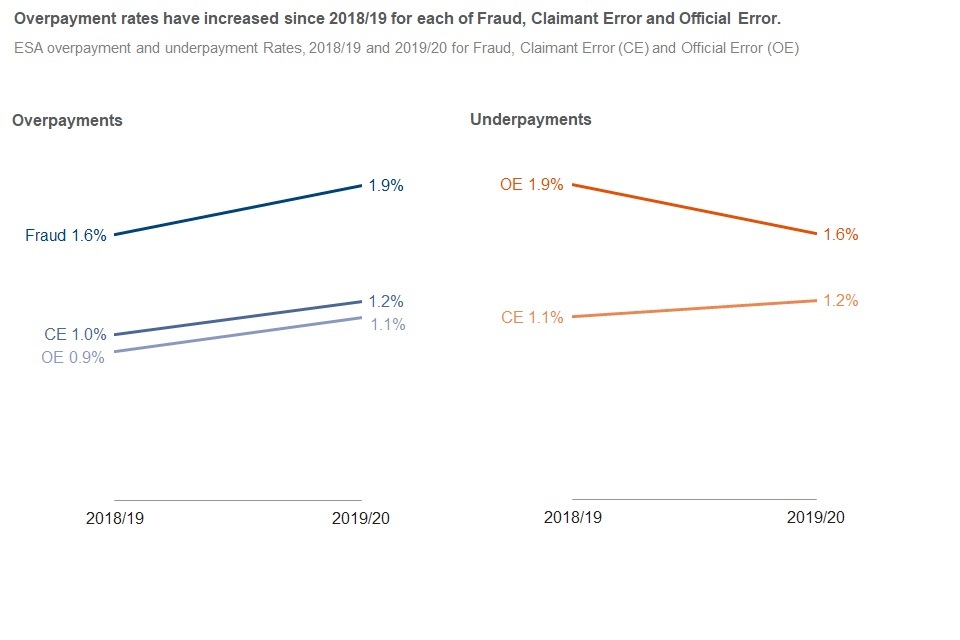
The total ESA overpayment rate has increased from 3.5% (£540 million) in 2018 to 2019 to 4.1% (£550 million) in 2019 to 2020. This change is not statistically significant. This has resulted from increases in the rates of overpayment for Fraud, Claimant Error and Official Error between 2018 to 2019 and 2019 to 2020.
Fraud accounts for 45% of all ESA expenditure overpaid. The rate of fraud overpayments has increased from 1.6% (£250 million) in 2018 to 2019 to 1.9% (£250 million) in 2019 to 2020.
Claimant Error and Official Error overpayment rates have both increased by 0.2 percentage points between 2018 to 2019 and 2019 to 2020.
The increase in ESA overpayments is the cumulative effect of small changes within the error categories. There do not appear to be any specific categories that are driving the upward trends in ESA overpayments.
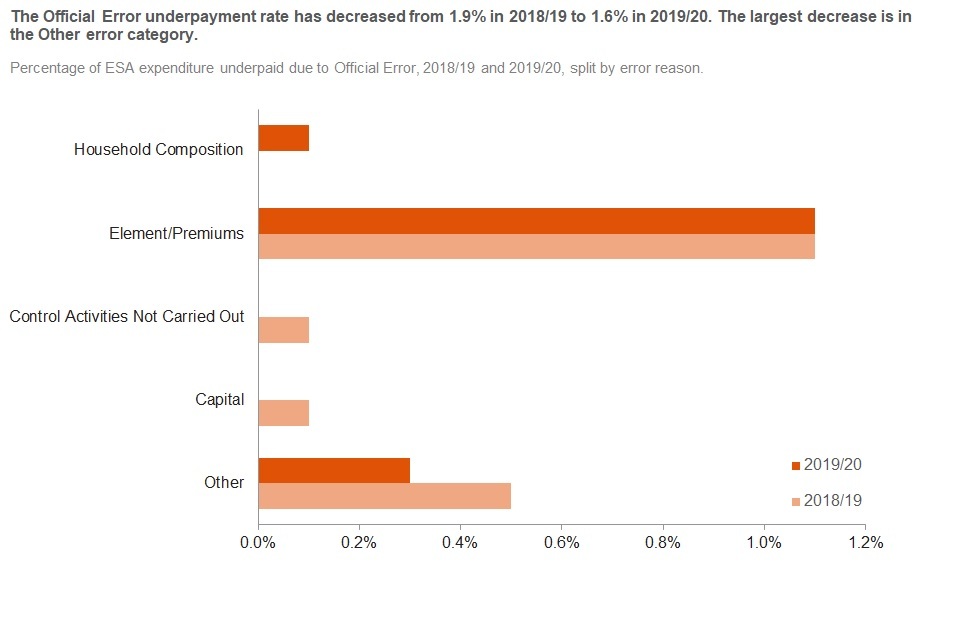
The total ESA underpayment rate has decreased from 3.1% (£470 million) in 2018 to 2019 to 2.8% (£380 million) in 2019 to 2020. This change is not statistically significant. This has resulted from a decrease in the Official Error underpayment rate from 1.9% (£290 million) in 2018 to 2019 to 1.6% (£220 million) in 2019 to 2020.
The largest change in Official Error underpayment rates is a decrease in the Other error category, from 0.5% (£76 million) in 2018 to 2019 to 0.3% (£41 million) in 2019 to 2020. This is due to a reduction in the number of Incapacity Benefit (IB) reassessment errors found, relating to when claimants were transferred to ESA from IB. In both 2018 to 2019 and 2019 to 2020, the vast majority of the expenditure in Other Official Error related to errors occurring during migration from IB to ESA. The department has been correcting past underpayments of ESA, which arose while reassessing IB claims, through an exercise that commenced in December 2017.
Premiums remains as the error category with the highest rate of Official Error underpayments. Premiums are extra amounts of money that people can be paid on some benefits – for example, people may receive premiums because of disability. The underpayment rate of 1.1% (£172 million) in 2018 to 2019 is unchanged for 2019 to 2020 (£151 million). Premiums accounted for almost 70% of all Official Error underpayments in 2019 to 2020.
8. Personal Independence Payment overpayments and underpayments
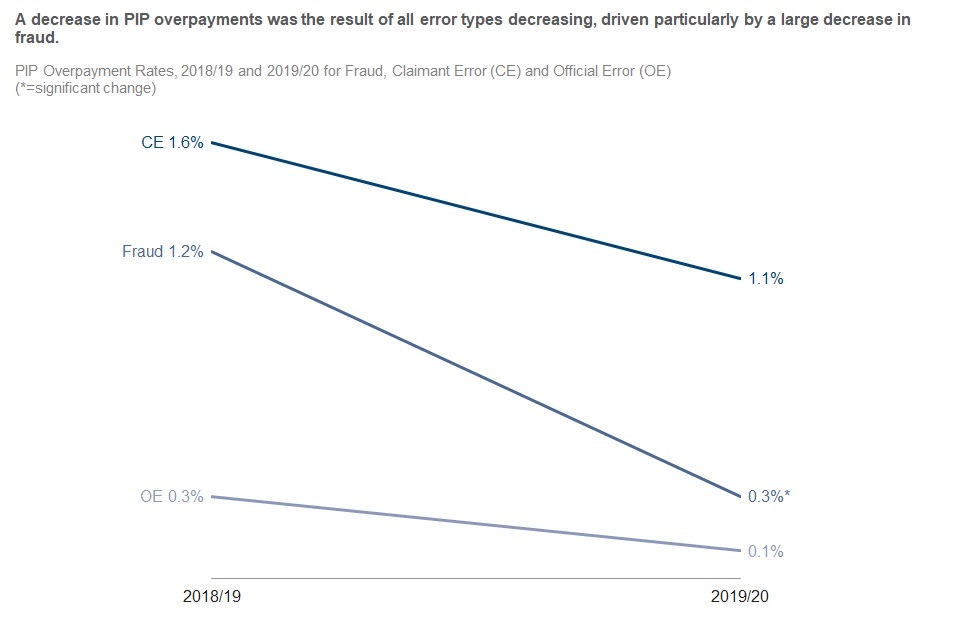
Personal Independence Payment overpayments decreased from 3.1% to 1.5% (change was statistically significant), driven mainly by a decrease in fraud. Total underpayments remained the same.
Personal Independence Payment (PIP) helps with extra costs caused by long-term disability or ill-health. From April 2013 PIP started to replace Disability Living Allowance (DLA) for people of working age (Note that PIP estimates are not directly comparable with DLA due to different assumptions and length of time since DLA fraud and error was measured; see the Technical Appendix for more details). PIP expenditure has increased from £10.6 billion in 2018 to 2019 to £12.5 billion in 2019 to 2020.
The rate of overpayments on PIP was 1.5% in 2019 to 2020, a statistically significant decrease from 3.1% in 2018 to 2019. The monetary value of overpayments in 2019 to 2020 was £190 million.
There was a lower proportion of cases with overpayments. The proportion of PIP cases with overpayments decreased from 5 in 100 cases in 2018 to 2019 to 2 in 100 cases in 2019 to 2020; this was a statistically significant decrease.
The drop in the rate of overpayments was mainly due to a statistically significant drop in fraud, from 1.2% to 0.3%, with Claimant Error also falling, from 1.6% to 1.1%. Official Error decreased from 0.3% to 0.1%.
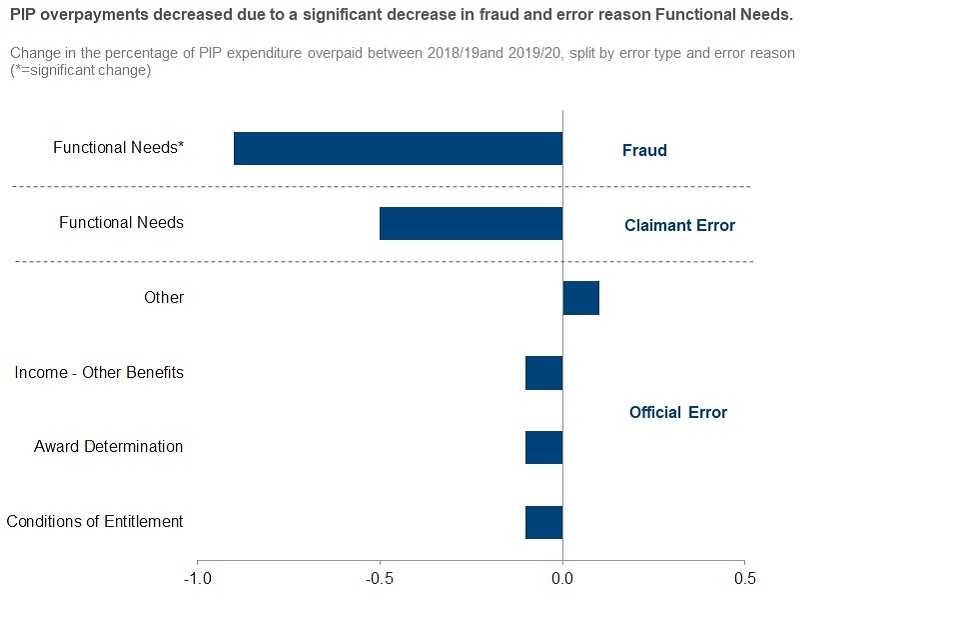
The decrease in fraud was due to a drop in errors categorised as Functional Needs, from 1.2% to 0.3% (change was statistically significant), which accounted for all PIP fraud overpayments. These errors occurred when the claimant failed to inform the department of an improvement to their needs, resulting in fraudulent receipt of their award amount.
Functional Needs was the primary reason for all PIP overpayments (around 90% of the total), and the total overpayment rate for Functional Needs had a statistically significant drop from the 2018 to 2019 figure of 2.9% to 1.4% in 2019 to 2020. It is recorded where the claimant’s needs have improved, but this change hasn’t been reported (either fraudulently or in error).
Claimant Error estimates decreased from 1.6% to 1.1%, due to a drop in error reason Functional Needs, which is not statistically significant. All Claimant Error in 2019 to 2020 was in this category.
Note: 3.4% of PIP expenditure was excluded from Claimant Error overpayment estimates; an increase from the 2018 to 2019 rate of 2.4% which was not statistically significant. These are errors where an improvement to a claimant’s functional needs results in overpayment, but we would not reasonably expect them to know to report the change. This is in line with legislation (see the Technical Appendix for more details). Taking these cases into account, there was an increase in the overall Claimant Error rate.
PIP underpayments remained at 3.8%; a monetary value of £470 million of PIP expenditure underpaid.
The vast majority of underpayments were due to error reason Functional Needs, due to claimants failing to report a deterioration in their functional needs. This accounted for 83% of total PIP underpayments, which was the same as the 2018 to 2019 rate, and all were Claimant Error.
Official Error at 0.7% was made up mainly of reason Award Determination at 0.6% (errors made in the assessment to benefit, for example, benefit awarded with insufficient justification provided), and a very small amount in the Other category.
9. Pension Credit overpayments and underpayments
Pension Credit overpayments and underpayments remained broadly the same.
Pension Credit (PC) provides support to people who have reached State Pension age. Guarantee Credit tops up any other income to a ‘standard minimum guarantee’ amount and additional amounts may be payable in certain circumstances, for example, severe disability. Savings Credit is an extra payment for those who have made some additional provision for their retirement through, for example, an occupational pension or savings. Those reaching State Pension age from 6 April 2016 are not eligible for Savings Credit. The expenditure on PC for 2019 to 2020 financial year has remained at £5.1 billion, the same as in 2018 to 2019.
Overpayments on Pension Credit have increased, from 4.2% in 2018 to 2019 compared to 5.3% in 2019 to 2020. This change is not statistically significant.
The total monetary value overpaid on Pension Credit was £270million, up from £210 million in 2018 to 2019.
There was a higher proportion of cases with overpayments. The proportion of PC cases with overpayments increased from 18 in 100 cases in 2018 to 19 to 24 in 100 cases in 2019 to 2020; this was a statistically significant increase.
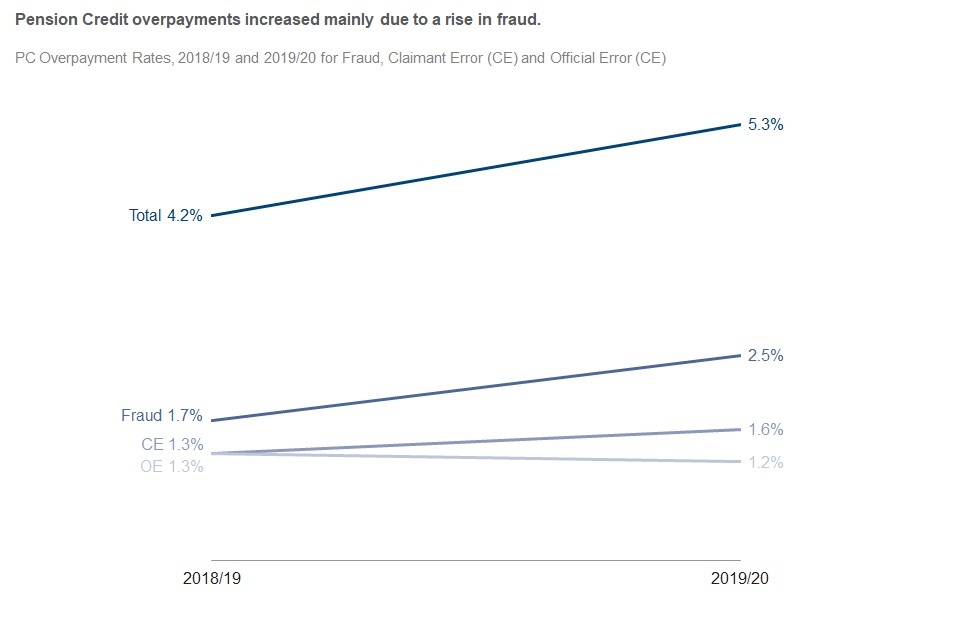
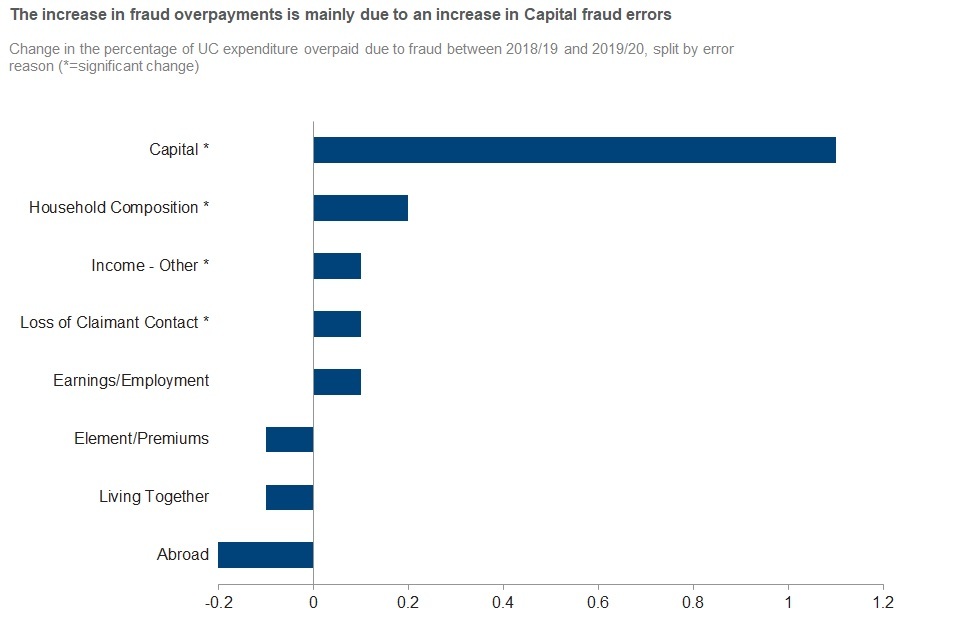
Pension Credit overpayments increased mainly due to a rise in fraud, from 1.7% (in 2018 to 2019) to 2.5%. Claimant Error also rose when compared to the 2018 to 2019 estimate, from 1.3% to 1.6%. Official Error remained broadly the same as in 2018 to 2019.
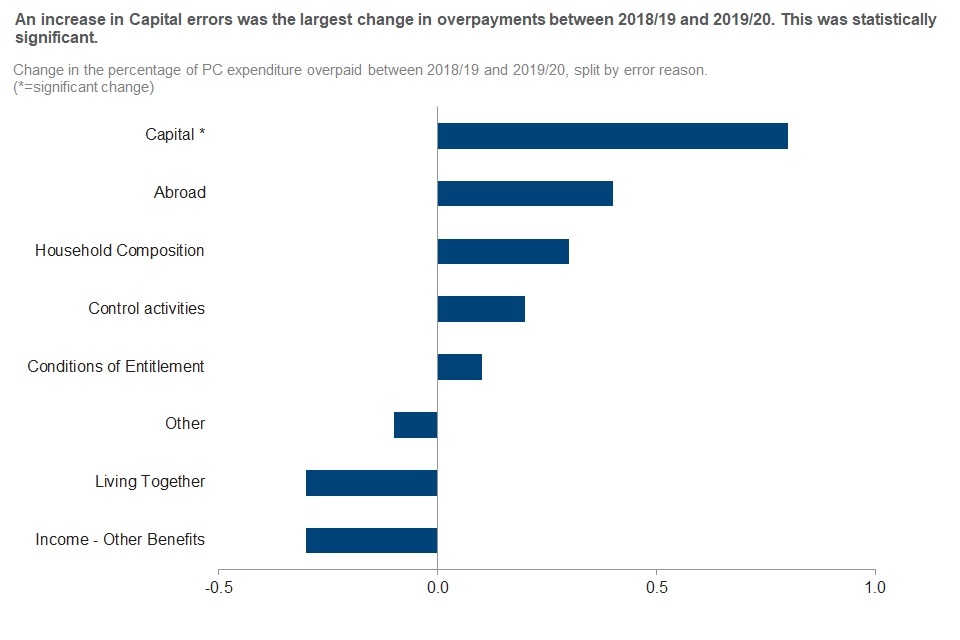
The increase in overpayments was driven by a statistically significant increase in Capital errors. This may be due to a change in policy, meaning claimants now have to declare any changes in capital as soon as they occur. These errors accounted for 1.7% (change was statistically significant) of expenditure overpaid (£86million) in 2019 to 2020, an increase from 0.9% (£45 million) in 2018 to 2019.
Abroad Fraud was also a reason for the increase in overpayments. This increased, following the fluctuations of the past couple of years, from 0.5% (£23 million) in 2018 to 2019 to 0.9% (£45 million) in 2019 to 2020. The errors are due to people being abroad for longer than the rules on the benefit allow.
Underpayments on Pension Credit decreased slightly from 2018 to 2019. The estimated rate was lower, at 2.2% in 2019 to 2020 compared to 2.4% in 2018 to 2019. This change is not statistically significant.
The monetary value of underpayments remained at £120million.
Claimant Error underpayments accounted for 1.2% of expenditure – a decrease from 1.4% in 2018 to 2019 – with the rest being due to Official Error (1.1%). The largest change in Claimant Error was due to income from other benefits, which decreased from 1.0% to 0.6%.
There was an increase in Capital underpayments, from 0.1% (£6 million) in 2018 to 2019 to 0.3% (change was statistically significant) (£13 million) in 2019 to 2020. This may be due to the same policy change mentioned above for capital overpayments
10. Carer’s Allowance overpayments and underpayments
Carer’s Allowance overpayments were 5.2%, with 3.0% due to fraud. There were no underpayments found.
Carer’s Allowance (CA) provides support to carers aged 16 and over who care for someone at least 35 hours a week. The disabled person must already receive a qualifying benefit (such as Personal Independence Payment or Attendance Allowance) and the carer must meet other eligibility criteria – for example, earning below a set weekly amount. This is first time Carer’s Allowance has been measured since 1996 to 1997, when it was called Invalid Care Allowance (ICA) – read the ICA differences.
Fraud was the leading error type, accounting for around 6 in 10 errors. Claimant Error made up around 4 in 10 errors.
Proportion of CA Error Type 2019 to 2020
| Fraud | Claimant Error | Official Error |
|---|---|---|
| 59% | 39% | 3% |
Note: may not sum to 100% due to rounding
Total expenditure overpaid was estimated at 5.2%; a monetary value of £150 million.
CA Expenditure overpaid by error type and error reason, 2019 to 2020
| Error type or reason | Fraud (£millions) | Fraud (%) | Claimant Error (£millions) | Claimant Error (%) | Official Error (£millions) | Official Error (%) | Total (£millions) | Total (%) |
|---|---|---|---|---|---|---|---|---|
| Conditions of Entitlement | 39 | 1.3 | 38 | 1.3 | 4 | 0.1 | 81 | 2.8 |
| Earnings/Employment | 42 | 1.4 | 18 | 0.6 | - | - | 60 | 2.1 |
| Abroad | 8 | 0.3 | - | - | - | - | 8 | 0.3 |
| Other | - | - | 3 | 0.1 | - | - | 3 | 0.1 |
| Totals | 90 | 3 | 60 | 2 | 0 | 0.1 | 150 | 5.2 |
| CA Expenditure | - | - | - | - | - | - | 2,900 |
Note: may not sum to totals due to rounding
Fraud was the highest error type at 3.0% (£90 million), followed by Claimant Error at 2.0% (£60 million) then a small amount of Official Error at 0.1%.
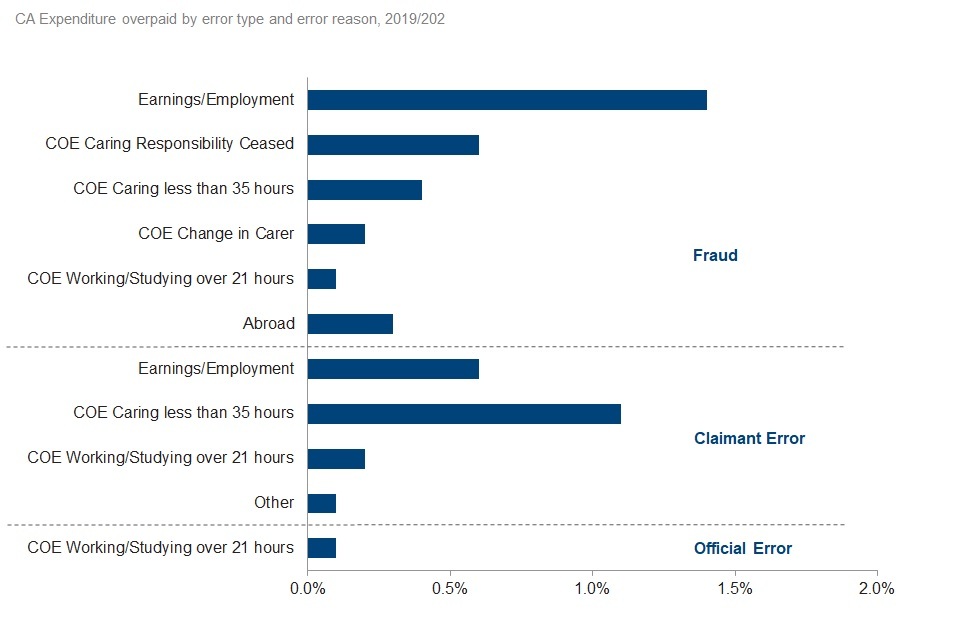
The largest error type was Conditions of Entitlement (COE), estimated at 2.8% and accounting for over half of all CA fraud and error. COE has several sub-categories of how claimants breached eligibility conditions for CA, of which Caring less than 35 hours had the highest fraud and error rate, at 1.5%. COE accounted for all Official Error, over 60% of Claimant Error and over 40% of Fraud.
Earnings and employment was the next largest error reason at 2.1%, where claimants failed to declare earnings over the weekly limit; the majority (1.4%) were Fraud.
No CA underpayments were found in the sample. In the majority of claims, CA is awarded as one possible weekly amount. This makes an underpayment unexpected, as an existing claimant receiving this amount would not be able to receive a higher award without unusual circumstances (for example, being in receipt of an overlapping benefit).
Differences from 1996 to 1997 Invalid Care Allowance (ICA) measurement
The latest CA estimates are not directly comparable with ICA measured in 1996 to 1997, due to sampling and measurement differences. For example:
- 1996 to 1997: all age groups sampled, 2019 to 2020: working age only
- 1996 to 1997: carers were visited, 2019 to 2020: telephone reviews
- 1996 to 1997: visits were un-notified, 2019 to 2020: pre-notification given
- methodology changes (for example, Cannot Review adjustment applied; see Appendix 3
Note about rounding
Monetary estimates are rounded to the nearest £1 million.
Fraud, Claimant Error and Official Error totals are rounded to the nearest £10million
Expenditure is rounded to nearest £100 million.
11. Interpreting these statistics
Definitions of fraud, claimant error and official error
In this publication we classify incorrect claims as follows:
-
Fraud: cases where all 3 of the following conditions apply:
- the conditions for receipt of benefit, or the rate of benefit in payment, are not being met
- the claimant can reasonably be expected to be aware of the effect on entitlement
- benefit stops or reduces as a result of the review
-
Claimant Error: the claimant has provided inaccurate or incomplete information, or failed to report a change in their circumstances, but there is no evidence of fraudulent intent on the claimant’s part
-
Official Error: Benefit has been paid incorrectly due to a failure to act, a delay or a mistaken assessment by the DWP, a Local Authority or HMRC to which no one outside of that department has materially contributed, regardless of whether the business unit has processed the information
Fraud and error – rates and monetary values
For benefits measure every year, the monetary value of fraud and error is calculated using the percentage of fraud and error found in our sample: (Percentage of fraud and error) x (Benefit expenditure)
Even if the rate of fraud and error is increasing, if the benefit expenditure is decreasing, we could see a lower monetary value; and vice versa.
For example The rate of underpayments on Universal Credit decreased from 1.3% to 1.1% between 2018 to 2019 and 2019 to 2020, but expenditure increased from £8.1 billion to £18.4 billion. 1.3% of £8.1 billion is £110 million. 1.1% of £18.4 billion is £200 million.
This is why it is usually better to compare rates of overpayments and underpayments rather than monetary values, and why statistically significant changes to monetary values are not highlighted.
Methodology changes since the 2018 to 2019 publication
A number of methodology changes have been made to this year’s estimates of fraud and error in the benefit system.
The changes have been made because some of the assumptions had been in place for a number of years, and following a request from the National Audit Office (NAO) to review certain assumptions in recommendations relating to their audit of the Department for Work and Pensions 2018 to 2019 annual report and accounts. The changes have resulted in improved accuracy of these fraud and error statistics. The changes are:
- applying a consistent assumption for ‘Cannot Review’ cases, in line with the assumption developed for Universal Credit
- removing the Arrears Advance adjustment for Housing Benefit cases
- changing how multiple errors on Housing Benefit that are linked are dealt with, to more accurately attribute the errors across type and reason
- splitting multiple whole award errors equally between error reasons
- removing the Net Programme Value adjustment
- netting off Official Error from Claimant Fraud and Claimant Error on Housing Benefit, Employment and Support Allowance, Pension Credit and Jobseekers Allowance
- standardising grossing, with all benefits now grossed on a monthly basis at a national level
- changing the expenditure data used in the estimates to match published benefit expenditure figures
Further details on the changes and their impact on the statistics are available in section 6 of the background and methodology document.
Changes to the assumption for ‘Cannot Review’ cases have the largest impact on the estimates. More details on this assumption can be found in Appendix 3 of this publication.
Revised figures for 2018 to 2019 using the new methodology are included in this publication, and are used when making comparisons between 2018 to 2019 and 2019 to 2020.
It has not been possible to apply the methodology changes to data prior to 2018 to 2019 due to the amount of resource required. This means that a back series beyond 2018 to 2019 has not been produced. As a result, comparisons should not be drawn between 2019 to 2020 or 2018 to 2019 and any previous years.
12. About these statistics
All the information underlying the charts and figures featured in this document is included in the accompanying reference tables.
The tables show the rates and monetary values of overpayments and underpayments for each benefit, split by fraud, claimant error and official error. The tables also show the net loss of overpayments measure with a time series and a breakdown by benefit.
For the benefits we measure all the time, we can also show more detail about the cause of the error (for example, incomes, savings and who lives in the house) and the demographics of the claimants. We also estimate the percentage of cases that are incorrect, and the amount of money that is incorrectly paid.
The background and methodology information note provides further information on how we calculate ‘Fraud and Error in the Benefit System’ statistics and gives a glossary of the causes of fraud and error used in this document and the reference tables. It also contains further details on a number of methodological changes which have been introduced. Some of these are mentioned on pages for the individual benefits in this publication.
The technical appendix gives more detail about the data manipulation process.
Interactive information and charts illustrating the fraud and error data are available.
We will continue to review our publication content, and welcome user comments, which should be sent to caxtonhouse.femaenquiries@dwp.gov.uk
National Statistics status
National Statistics status means that our statistics meet the highest standards of trustworthiness, quality and public value, and it is our responsibility to maintain compliance with these standards.
The continued designation of these statistics as National Statistics was confirmed in December 2017 following a compliance check by the Office for Statistics Regulation. The statistics last underwent a full assessment against the Code of Practice for Statistics in February 2012. Since the latest review by the Office for Statistics Regulation, we have continued to comply with the Code of Practice for Statistics, and have made the following improvements:
- conducted a user consultation on the frequency of the publication, the benefits measured and on the breakdowns used within the publication. This has resulted in us changing from a bi-annual to an annual publication, and beginning to measure fraud on error on benefits that have not been measured at all or for a long time
- we have made some methodological changes, resulting in better understood methodologies and assumptions, improved accuracy of the fraud and error statistics, and more consistency across benefits
- we have made a number of changes to improve the relevance and accessibility of our statistics. For example, we have: moved away from using the same wording and charts for all the benefits in our publication to instead focus on the key messages for each benefit, updated the categories of error we report in our publication based on user needs, and made the data from our publication available to analysts within DWP to conduct their own analysis. We have also created an online tool to allow users to explore our fraud and error statistics
Other National and Official Statistics
Details of other National and Official Statistics produced by the Department for Work and Pensions can be found using the following links:
- a list of DWP statistical summaries;
- a schedule of statistical releases over the next 12 months and a list of the most recent releases;
In addition, users can find links to additional DWP statistical analyses that have not been included in our standard publications.
If you would like to receive occasional e-mails from DWP to directly inform you of documents seeking the views of users, please email general.statistics@dwp.gov.uk giving details of the DWP publications you use.
13. Contact information
Lead Statistician: Richard Goulsbra
Comment? Feedback is welcome at consumer.queries@fca.org.uk
DWP Press Office: 020 3267 5144
Report Benefit Fraud: 0800 854 4400
Appendix 1: Overpayment rates and monetary values by benefit
| Benefit | Expenditure | Total Rate | Total Value | Total Fraud | Total Fraud Value | Claimant Error Rate | Claimant Error Value | Official Error Rate | Official Error Value | When reviewed | |
|---|---|---|---|---|---|---|---|---|---|---|---|
| Universal Credit | £18.4bn | 9.4% | £1,730m | 7.6% | £1,390m | 0.50 | £90m | 1.3% | £250m | Oct 18-Sep 19 | |
| Housing Benefit | £18.3bn | 6% | £1,090m | 3.70% | £680m | 1.7% | £310m | 0.5% | £90m | Oct 18-Sep 19 | |
| ESA | £13.4bn | 4.1% | £550m | 1.9% | £250m | 1.2% | £160m | 1.1% | £150m | Oct 18-Sep 19 | |
| PIP | £12.5bn | 1.5% | £190m | 0.30% | £30m | 1.1% | £140m | 0.1% | £20m | Aug 18-Jul 19 | |
| Pension Credit | £5.1bn | 5.3% | £270m | 2.5% | £130m | 1.6% | £80m | 1.2% | £60m | Oct 18-Sep 19 | |
| Carer’s Allowance | £2.9bn | 5.2% | £150m | 3% | £90m | 2.0% | £60m | 0.1% | £0m | May 19-Dec 19 | |
| JSA | £0.7bn | 4.6% | £30m | 3.1% | £20m | 0.3% | £0m | 1.2% | £10m | Oct 17-Sep 18 | |
| Income Support | £1.4bn | 3.9% | £50m | 2.4% | £30m | 1.0% | £10m | 0.4% | £10m | Oct 13-Sep 14 | |
| Incapacity Benefit | £0.0bn | 2.4% | £0m | 0.3% | £0m | 0.9% | £0m | 1.2% | £0m | Apr 09-Mar 10 | |
| DLA | £7.2bn | 1.9% | £140m | 0.5% | £40m | 0.6% | £40m | 0.8% | £60m | Apr 04-Mar 05 | |
| State Pension | £98.8bn | 0.1% | £120m | 0.0% | £0m | 0.1% | £80m | 0.0% | £30m | Apr 05-Mar 06 | |
| Interdependencies | £40m | £10m | £10m | £20m | |||||||
| Never reviewed | £12.9bn | 1.8% | £230m | 0.8% | £100m | 0.5% | £70m | 0.5% | £70m | ||
| Total | £191.7bn | 2.4% | £4.6bn | 1.4% | £2.8bn | 0.6% | £1.1bn | 0.4% | £0.8bn | ||
| Range | (2.2,2.7) | (4.2,5.1) | (1.3,1.7) | (2.5,3.2) | (0.5,0.7) | (0.9,1.3) | (0.3,0.5) | (0.6,1.0) |
Notes:
- Certain cases are removed from the headline overpayments estimates for DLA and PIP estimates. Based on 2019 to 2020 expenditure the DLA figure is now estimated to be £520 million (+£160 / -£130 million). The amount of PIP excluded is estimated to be £420 million (+£100 / -£90 million) for 2019 to 2020.
- Monetary values associated with Incapacity Benefit are displaying zeroes due to rounding.
- Official Error estimates for State Pension (SP) are derived from a continuous review exercise which covered the period October 2018 to September 2019. SP Fraud and Claimant Error estimates have been produced based on a National Benefit Review exercise carried out in 2005 to 2006, applied to the latest 2019 to 2020 expenditure.
- The ‘Never reviewed’ category includes benefits which were not previously reviewed and have not been historically reviewed in a particular year.
- Rows and columns may not sum to totals due to rounding.
- A number of cases are removed from the headline overpayment estimates for each benefit. This is due to a review not being completed and categorised as ‘Inconclusive’. These cases are estimated to have a monetary value of £470 million in total (£40 million Carer’s Allowance, £40 million Employment and Support Allowance, £80 million Housing Benefit, £20 million Pension Credit, £40 million Personal Independence Payment and £250 million Universal Credit). See Appendix 3 for more information.
- Approximate 95% confidence intervals are given for the totals in the row above. These also allow for non-sample error in occasionally reviewed benefits and the additional uncertainty that comes from the use of older measurement periods.
Appendix 2: Underpayment rates and monetary values by benefit
| Benefit | Expenditure | Total Rate | Total Value | Claimant Error Rate | Claimant Error Value | Official Error Rate | Official Error Value | When reviewed |
|---|---|---|---|---|---|---|---|---|
| Universal Credit | £18.4bn | 1.1% | £200m | 0.6% | £100m | 0.5% | £90m | Oct 18-Sep 19 |
| Housing Benefit | £18.3bn | 1.7% | £310m | 1.3% | £230m | 0.4% | £80m | Oct 18-Sep 19 |
| Employment and Support Allowance | £13.4bn | 2.8% | £380m | 1.2% | £160m | 1.6% | £220m | Oct 18-Sep 19 |
| Personal Independence Payment | £12.5bn | 3.8% | £470m | 3.1% | £390m | 0.7% | £80m | Aug 18-Jul 19 |
| Pension Credit | £5.1bn | 2.2% | £120m | 1.2% | £60m | 1.1% | £60m | Oct 18-Sep 19 |
| Carer’s Allowance | £2.9bn | 0.0% | £0m | 0.0% | £0m | 0.0% | £0m | May 19-Dec 19 |
| Jobseeker’s Allowance | £0.7bn | 1.5% | £10m | 0.3% | £0m | 1.2% | £10m | Oct 17-Sep 18 |
| Income Support | £1.4bn | 0.8% | £10m | 0.4% | £10m | 0.3% | £0m | Oct 13-Sep 14 |
| Incapacity Benefit | £0.0bn | 0.7% | £0m | 0.0% | £0m | 0.7% | £0m | Apr 09-Mar 10 |
| Disability Living Allowance | £7.2bn | 2.5% | £180m | 2.4% | £170m | 0.1% | £10m | Apr 04-Mar 05 |
| State Pension | £98.8bn | 0.1% | £150m | 0.0% | £0m | 0.1% | £150m | Apr 05 - Mar 06 |
| Never reviewed | £12.9bn | 1.7% | £220m | 1.4% | £190m | 0.2% | £30m | |
| Total | £191.7bn | 1.1% | £2.0bn | 0.7% | £1.3bn | 0.4% | £0.7bn | |
| Range | (0.9,1.3) | (1.7,2.5) | (0.6,0.9) | (1.1,1.7) | (0.3,0.5) | (0.6,0.9) |
Notes:
- A small number of Fraud underpayments are included in the total column, but are not shown in a separate column in the table above. Fraud underpayments can be recorded on Living Together cases, where the claimant commits fraud because they do not tell the Department that their partner has moved in with them. Although this causes an underpayment for the individual, the circumstances of the partner (for example, their income) cause overpayments for the claim as a whole, which results in an overall overpayment.
- A new legislation ruling for PIP means that some claimants may qualify for higher benefit awards than they were given at their assessment. Cases categorised since August 2018 will include this judgement which means that prior to this date we may be underestimating official error underpayments.
- Carer’s Allowance estimates are zero as no underpayment cases were found in the sample
- Monetary values associated with Incapacity Benefit are displaying zeroes due to rounding
- Official Error estimates for State Pension (SP) are derived from a continuous review exercise which covered the period October 2018 to September 2019. SP Fraud and Claimant Error estimates have been produced based on a National Benefit Review exercise carried out in 2005 to 2006, applied to the latest 2019 to 2020 expenditure.
- The ‘Never reviewed’ category includes benefits which were not previously reviewed and have not been historically reviewed in a particular year.
- Rows and columns may not sum to totals due to rounding.
- Approximate 95% confidence intervals are given for the totals in the row above. These also allow for non-sample error in occasionally reviewed benefits and the additional uncertainty that comes from the use of older measurement periods.
Approximate 95% confidence intervals are given for the totals in the row above. These also allow for non-sample error in occasionally reviewed benefits and the additional uncertainty that comes from the use of older measurement periods.
Appendix 3: Cannot Review adjustment
Previously this adjustment was only applied to Universal Credit. However, we have now applied this to all benefits that have been reviewed within the last year. For more information on this adjustment, please see section 6 of the background and methodology document.
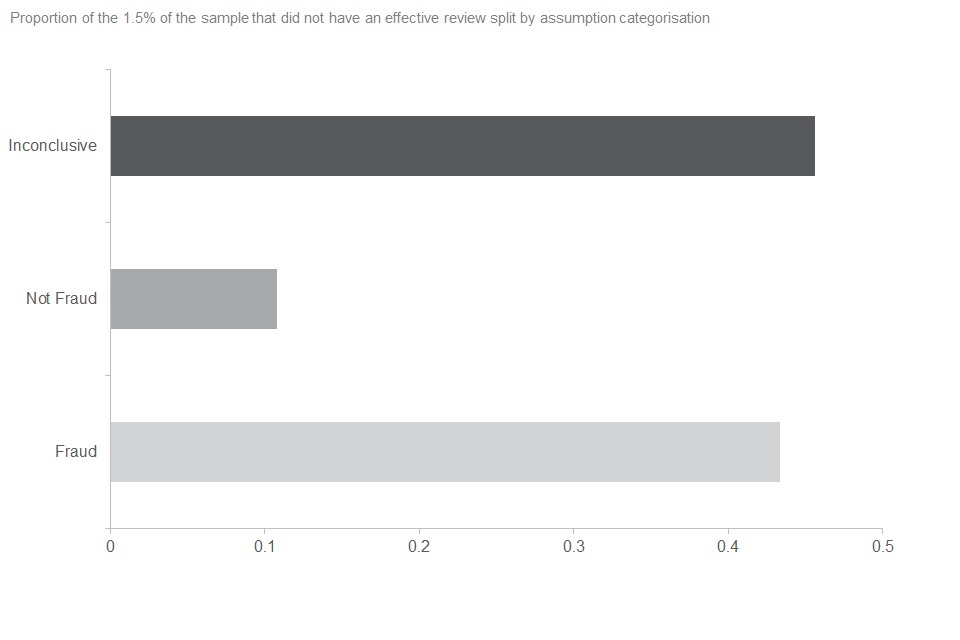
Of those benefits reviewed in 2019 to 2020, 1.5% of sample cases did not have an effective review. This was primarily due to the claimant not engaging in a review, resulting in their benefit claim being suspended and then later terminated. Additionally, it included cases where the claimant withdrew their claim to Universal Credit following notification of a review. The monetary value of fraud and error on these cases was around £900million (1.3% of expenditure on these benefits).
These cases are referred to as ‘Cannot Review’ and the department holds very little evidence of their current circumstances and their reasons for failing to engage.
Given the lack of evidence available for these cases, a set of assumptions are applied to categorise them for reporting purposes as follows:
-
Fraud – where a case has a suspicion of fraud raised following initial data gathering prior to review, these cases are assumed to be fraud in the reported estimates
-
Not fraud – If there is no information to suggest a suspicion of fraud, where a claimant reclaims benefit at a similar rate within four months of their original award being terminated, these cases are assumed not to be fraud. Any other errors such as official error would remain on the case, so they may not be entirely benefit correct
-
Inconclusive – where there is no information to suggest a suspicion of fraud or that the claimant has reclaimed benefit, these are recorded as inconclusive and no assumptions are made on these cases. These cases are taken out of the headline reported estimates, since there is insufficient evidence to categorise as fraud or not. The expenditure for these cases is estimated and reported separately within the publication and supplementary tables
Approaching 5 in 10 Cannot Review cases were categorised as inconclusive.
Cannot Review cases accounted for around £900 million of expenditure, with the majority of the expenditure coming from Universal Credit and Housing Benefit.
Breakdown of the cases in the sample that did not have an effective review split by benefit and assumption categorisation
| Benefit | Cannot Review Assumption Category | % of expenditure | Monetary Value |
|---|---|---|---|
| Carer’s Allowance | Fraud | 0.8% | £20m |
| Carer’s Allowance | Not Fraud | 0.7% | £20m |
| Carer’s Allowance | Inconclusive | 1.3% | £40m |
| Employment and Support Allowance | Fraud | 0.4% | £50m |
| Employment and Support Allowance | Not Fraud | 0.1% | £20m |
| Employment and Support Allowance | Inconclusive | 0.3% | £40m |
| Housing Benefit | Fraud | 0.8% | £150m |
| Housing Benefit | Not Fraud | 0.2% | £40m |
| Housing Benefit | Inconclusive | 0.4% | £80m |
| Pension Credit | Fraud | 0.7% | £40m |
| Pension Credit | Not Fraud | 0.0% | £0m |
| Pension Credit | Inconclusive | 0.3% | £20m |
| Personal Independence Payment | Fraud | 0.0% | £0m |
| Personal Independence Payment | Not Fraud | 0.0% | £0m |
| Personal Independence Payment | Inconclusive | 0.3% | £40m |
| Universal Credit | Fraud | 0.4% | £80m |
| Universal Credit | Not Fraud | 0.0% | £0m |
| Universal Credit | Inconclusive | 1.4% | £250m |
| Total | Fraud | 0.5% | £350m |
| Total | Not Fraud | 0.1% | £80m |
| Total | Inconclusive | 0.7% | £470m |