Fostering in England 2017 to 2018: main findings
Updated 21 September 2020

© Crown copyright 2020
This publication is licensed under the terms of the Open Government Licence v3.0 except where otherwise stated. To view this licence, visit nationalarchives.gov.uk/doc/open-government-licence/version/3 or write to the Information Policy Team, The National Archives, Kew, London TW9 4DU, or email: psi@nationalarchives.gov.uk.
Where we have identified any third party copyright information you will need to obtain permission from the copyright holders concerned.
This publication is available at https://www.gov.uk/government/statistics/fostering-in-england-1-april-2017-to-31-march-2018/fostering-in-england-2017-to-2018-main-findings
This release contains:
- the numbers of foster carers and foster places and placements, in both local authority (LA) and independent fostering agencies (IFA)
- data relating to types of foster care, registrations, de-registrations, to fostered children, and a range of other subjects
- the period between 1 April 2017 and 31 March 2018
There has been a further small decrease in the number of approved fostering households.
The slow decline in numbers of approved fostering households has continued. On 31 March 2018, there were 43,475 fostering households; a decrease of 1% compared to 31 March 2017.
Fewer places were vacant for children who need foster care.
Despite an increase in approved fostering places, there has been a decrease in the number of places vacant for children. Filled places increased more than approved places increased, leading to a 5% decrease in vacant places.
The number of children in foster care has increased further this year.
On 31 March 2018, just over 53,000 children and young people were placed with foster carers. This is an increase of around 1,000 compared with 31 March 2017.
The gap in the proportion of young people in LAs Staying Put compared with those in IFAs has reached its largest in recent years.
The proportion of fostered young people Staying Put increased to 1,695 (49%) in 2017–18 compared with 1,570 (46%) last year. Those Staying Put with IFA carers increased by 2 percentage points (to 40%) and LA carers by 6 percentage points (to 58%).
The proportion of unplanned endings that resulted in the child moving within 24 hours has increased since last year.
In 2017–18, over 6,000 children and young people experienced unplanned endings. Of these children and young people, 25% were moved within 24 hours. This is an increase of four percentage points since last year, when 21% of unplanned endings resulted in the child moving within 24 hours.
Children placed with IFAs who went missing were less likely to receive a return home interview than children placed with LAs.
In 2017–18, only 40% of IFA placed children who went missing received a return home interview compared with 68% of children placed with LAs.
Introduction
This statistical release covers local authority (LA) fostering agencies and independent fostering agencies (IFA) in England in the year 1 April 2017 to 31 March 2018. It includes data about fostered children, foster carers, recruitment, and capacity of providers. Fostered children represented nearly three quarters of all children in care, but less than one percent of all children in England.
This release uses data returned to Ofsted by the agencies, and so may reflect both changes that have happened in the sector and changes that have happened in how this is being recorded and reported by the agencies. The data collected is unique to Ofsted; it helps inform fostering policy and serves as a point of reference for all fostering agencies in the country.
As the data collection does not indicate the location of foster carers and children, IFAs cannot be neatly attached to regions; therefore, any regional analysis refers only to LA fostering agencies within that region.
Main findings
Fostering capacity
The slow decline in total number of approved fostering households continued. While the overall number of households decreased, there were some fostering types which increased in number of households and there were notable differences between LAs and IFAs.
Numbers of households, by type
The number of fostering households in England has continued to decline. At 31 March, there were 43,475 approved fostering households, a decrease of 1% from last year (43,935).
Three types of fostering accounted for 89% of fostering households’ primary placement offers. The largest proportion of these households (44%) offered non-permanent fostering, according to their primary placement offer. Approximately one in three households were permanent fostering and one in seven were family and friends (31% and 14% respectively).
Non-permanent fostering as a primary offer has increased 6% (1,060 households) compared to last year. All of the increase in non-permanent fostering was attributed to IFA services, whereas among LAs non-permanent fostering decreased by 1%.
The number of households with permanent fostering as their primary offer decreased by 9% (1,290 households) compared to last year. Decreases were seen among both LA and IFA services (10% and 7% respectively).
The number of family and friends fostering households also decreased by 5% (325 households).
All of the other types of fostering combined, account for 10% of fostering households. The most notable changes in numbers of households across these types were:
-
the number of households with emergency fostering as their primary offer has doubled – from 190 to 385. All of this increase was found among IFA services.
-
fostering to Adopt households have increased by a quarter, an increase of 75 households.
Households which offered a range of foster care
Looking at the range of care offered by households, more than half (53%) offer multiple types of foster care. Of the 43,475 approved fostering households in England, 29% were approved for two types of care, 11% were approved for three types of care and 13% offered four or more types of care.
Among IFAs, the proportion of households approved for multiple types of care was much higher than among LAs: 88% compared to 35%. Family and friends households partly contribute to the difference between the sectors because this type of foster care is much less likely to be approved to offer other types of foster care.[footnote 1]
As it is common practice to approve fostering households for multiple types of care, the numbers of households approved for particular types of foster care are much higher when taking into consideration all approval types (primary offer and additional offer). The table below shows the numbers of households by type of foster care, spilt by primary offer only or all approval types.
Table 1: Types of foster care offered by households [footnote 2]
| Primary offer | Primary offer | Within all approval types | Within all approval types | |
|---|---|---|---|---|
| Type of fostering | Number | Percentage | Number | Percentage |
| Not permanent | 19,195 | 44 | 30,305 | 70 |
| Permanent | 13,595 | 31 | 20,890 | 48 |
| Short breaks | 1,480 | 3 | 11,145 | 26 |
| Emergency | 385 | 1 | 8,635 | 20 |
| Family and Friends | 6,100 | 14 | 6,220 | 14 |
| Parent and child | 355 | 1 | 2,335 | 5 |
| Other | 325 | 1 | 2,185 | 5 |
| Shared care short breaks | 680 | 2 | 1,260 | 3 |
| Multi-dimensional treatment | 650 | 1 | 780 | 2 |
| Fostering to adopt | 365 | 1 | 625 | 1 |
| Remand | 25 | 0 | 310 | 1 |
| Not known | 125 | 0 | 295 | 1 |
The types of foster care that were much more likely to be additional offers, rather than primary offers, were short breaks and emergency foster care. Very few fostering households offer emergency care as their primary offer (1%) whereas a fifth of all households are approved for emergency care (20%). Similarly, only 3% of households have short breaks as their primary offer, but overall a quarter of households (26%) are approved to offer short breaks care.
Fostering household sizes
The highest proportion of households (36%) were approved for 2 children (15,540). Compared to last year, there has been a shift in provision towards larger households, with an increase in those approved for 3 children (from 28% to 31%) and a slight decrease in those approved for one child (from 35% to 33%).
Figure 1: Fostering household sizes, as at 31 March 2018 by sector
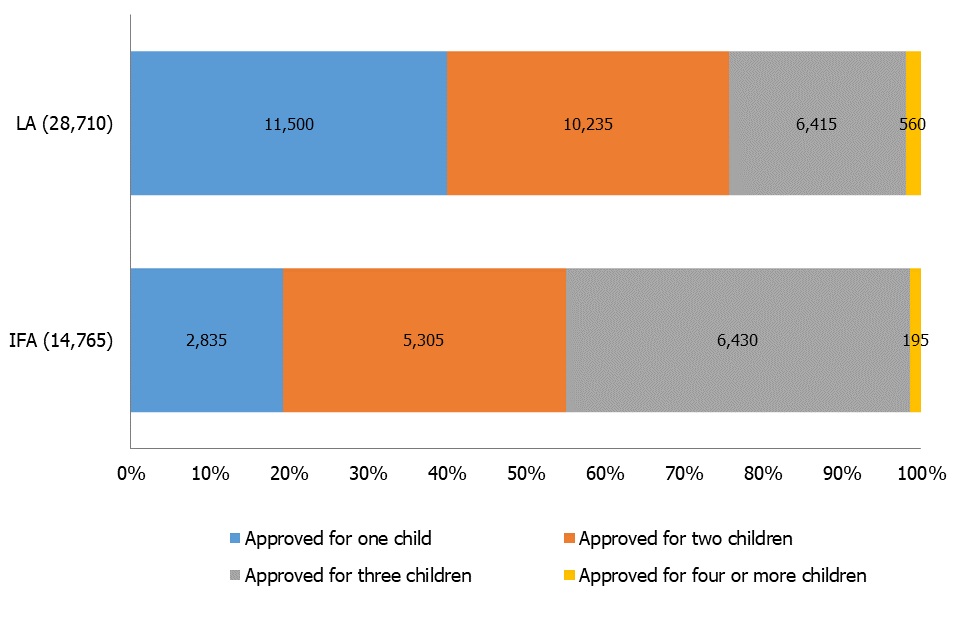
A larger proportion of IFA households are approved for three children compared with LA households
Similar to last year, IFAs were again more likely to have larger households than LAs: 45% of IFA households were approved for 3 children or more compared with 24% of LA households. Both IFAs and LAs saw an increase in number of larger households from the previous year, from 42% and 22% respectively.
Of the newly approved households in 2017–18, there was very little variation in the number of IFA households approved for one child (30%), 2 children (36%), or 3 children or more (35%). Compared to last year, there was also a shift towards larger sized households among newly-approved households: with a 3 percentage point decrease among IFA households for one child and a 5 percentage point increase among IFA households for 3 or more children. This mirrors the shift seen across all households.
In the LA sector, newly approved households were almost twice as likely to be approved to look after smaller numbers of children – 61% of households approved in year were for one child, compared with 30% among IFAs.
Fostering capacity
The number of fostering places has increased slightly, however, the increase in children in foster care has meant that there were fewer places vacant for children who need a foster placement. Furthermore, as the small increase in overall capacity is being driven by approval for larger sized households, rather than an increase in total number of households, this may be leading to an increase in ‘not available’ places.
Changes in numbers of places
In total, across all fostering placement types, there were 87,120 approved fostering places in England on 31 March 2018. This represented a 1% increase from the same point in the previous year (85,935).
The number of approved places increased by 8% in IFAs (from 31,130 to 33,540), a larger increase than last year.
In contrast, the number of approved places decreased by 2% among LAs, from 54,805 to 53,575.
As a result of these changes, the proportion of approved places offered by IFAs has increased from 36% on 31 March 2017 to 39% on the same date in 2018. The majority of places are still offered by LAs (61%).
Occupancy of places
On 31 March 2018, 62% of fostering places were filled (53,205) and 20% were vacant (17,150).[footnote 3] The remaining 18% were ‘not available’ (15,645).
The percentage of places that were filled has increased compared to the previous year, by one percentage point (from 61% to 62%). The percentage of vacant places decreased by one percentage point and unavailable places remained the same (18%) as 31 March 2017.
Figure 2: Proportion of fostering places, by occupancy status on 31 March, 2014 to 2018
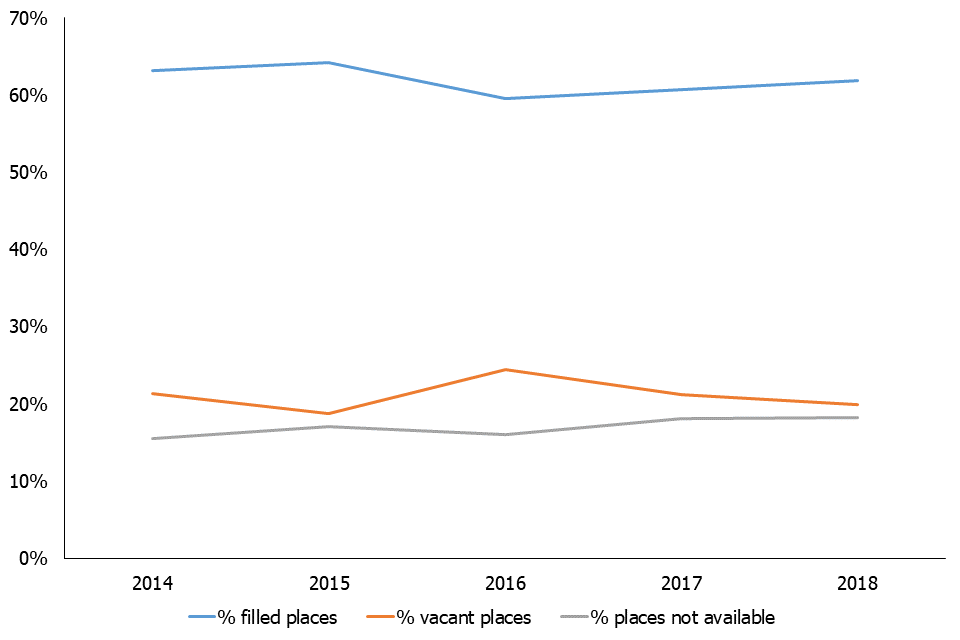
Between 31 March 2017 and 31 March 2018 the percentage of places that were filled increased and the percentage of places vacant decreased
Despite the overall increase in approved fostering places, there has actually been a decrease in the number of vacant places for children. This was mainly because the increase in filled places has outstripped the increase in approved places, resulting in less capacity as vacant places. The approved places increased by 1%, filled places increased by 3% and, therefore, the vacant places decreased by 5%. There were 17,150 vacant places on 31 March 2018, a decrease from 17,980 the previous year.
Unavailable fostering places
On 31 March 2018, the total number of places reported as ‘not available’ increased by 2%, compared to the previous year.
Almost one in 5 (18%) approved fostering places in England were reported as ‘not available’ on 31 March 2018 (15,645 places).
There were 7,605 unavailable places among IFAs and only a slightly higher number among LAs (8,040). Of the total approved places, IFAs had a higher proportion of not available places compared with LAs – 23% compared to 15%.
Table 2: Reasons why fostering places were unavailable on 31 March 2018
| England | IFA | LA | |
|---|---|---|---|
| Reason for not available place | % of not available places | % of not available places | % of not available places |
| Carer reasons (other) | 21 | 22 | 19 |
| Carer(s) taking a break/pending resignation | 20 | 16 | 24 |
| Needs of child not otherwise stated | 18 | 22 | 14 |
| Only available if sibling group placed | 14 | 17 | 12 |
| Staying Put | 8 | 7 | 10 |
| Reason unknown/other | 7 | 7 | 7 |
| Carer(s) under investigation | 4 | 3 | 5 |
| Reserved for pending placement | 3 | 3 | 4 |
| Reserved for shared care placement | 3 | 1 | 5 |
The number of places reported as being used for Staying Put increased by 6% compared to last year – from 1,240 places to 1,320 places. All of the increase was accounted for by IFAs.
However, Staying Put places were only 8% of ‘not available’ places and so it is not a large contributor to the ‘not available’ places overall.
Recruitment and retention
Recruitment of fostering households hasn’t kept pace with the increase in children in care.
Recruitment
There were 117,335 initial enquiries in 2017–18; this is an increase of 3% compared with the previous year (114,425).
Similarly to last year, the increase in enquiries was attributable to the IFA sector. However the rise was smaller at 5%: from 78,585 in 2016–17 to 82,685 in 2017–18. The LA sector again saw a small decrease (3%) from 35,840 to 34,650.
The number of applications rose again this year (11%), in part due to the increase in IFA applications (from 5,935 in 2016–17 to 7,675 in 2017–18). LAs reported 6,675 applications in 2017–18, compared with 6,520 in 2016–17.
In total, there were 7,790 fostering households approved in the year. Two thirds (66%) of these households were approved by LAs and one third (34%) were approved by IFAs. The table below shows the primary offer type of the newly approved households, by sector.
Table 3: Types of foster care offered by newly approved households, by sector
| IFA | IFA | LA | LA | |
|---|---|---|---|---|
| Number of households | Percentage | Number of households | Percentage | |
| Permanent | 960 | 37 | 345 | 7 |
| Non permanent | 1,340 | 51 | 1,440 | 28 |
| Emergency | 25 | 1 | 10 | 0 |
| Family and friends | 0 | 0 | 2,870 | 56 |
| Parent and child | 40 | 1 | 25 | 0 |
| Multi-dimensional foster care treatment | 105 | 4 | 15 | 0 |
| Remand | 0 | 0 | 0 | 0 |
| Other | 25 | 1 | 20 | 0 |
| Fostering to adopt | 40 | 2 | 200 | 4 |
| Short breaks | 80 | 3 | 140 | 3 |
| Short breaks: shared care | 5 | 0 | 50 | 1 |
| Not known | 15 | 0 | 15 | 0 |
Foster carers
As with households, the number of foster carers continued its long-term slow decline this year. The ethnicity data shows that there continues to be a difference between the proportions of foster carers who are from non-white minority ethnic backgrounds and the proportion of fostered children who are from non-white minority ethnic backgrounds. The proportion of carers from non-white minority ethnic backgrounds is lower than the proportion of children and young people.
Approved foster carers
The number of approved foster carers continued the trend of the previous 2 years and decreased, from 74,135 on 31 March 2017 to 73,530 on 31 March 2018; a decrease of 1%.
Ethnicity
Most foster carers were White (84%)[footnote 4]. This proportion was slightly below the national level among the adult (aged 25 and older) population (88%).
Similar to last year, there was a greater proportion of foster carers from non-white minority ethnic groups in IFAs than in the LA sector. In IFAs, 79% of foster carers were White and 20% were from non-white minority ethnic groups. In LAs, however, 86% were White and 11% were from other minority ethnic groups.[footnote 5]
Ofsted collected the ethnicity of all foster carers and fostered children. As mentioned later in this report, 23% of fostered children were from non-white minority ethnic groups, on 31 March 2018, compared with 15% of all foster carers.
Figure 3: Ethnicity of foster carers by sector, as at 31 March 2018 and approved during 2017–18

On 31 March 2018 there were 61,430 white carers and 10,690 carers from non-white minority ethnic backgrounds
Of all foster carers approved in 2017–18, 81% were White and 14% were from non-white minority ethnic groups.[footnote 6]
In the LA sector, 83% of newly approved carers were White, in comparison with 76% in IFAs. Conversely, 10% were from non-white minority ethnic groups compared with 23% in IFAs.
Children and young people
Number of children fostered[footnote 7]
In total, agencies reported 53,040 children and young people (CYP) in placement on 31 March 2018. This is an increase of just over 1,000 children compared with 31 March 2017. Figures published by the Department for Education (DfE) reported slightly higher numbers of children in foster care (55,200), which could be explained by slight differences in collection methodology).
The majority of children were in LA fostering places (66% or 35,145), and the remainder (34% or 17,890) were placed through IFAs, in line with 2017 figures.[footnote 8] DfE reported higher numbers in both LA and IFA placements but showed the same proportions.
Characteristics of children
The proportion of fostered children from non-white minority ethnic backgrounds remains the same as in 2017. However the number of carers from non-white minority ethnic backgrounds continues to be lower, as mentioned previously.
Of all children fostered, IFAs reported a higher proportion of disabled children and young people compared with LA agencies.
Ethnicity
White children accounted for 76% of all fostered children still placed on 31 March 2018, in line with 2017. Twenty-three percent of children belonged to non-white minority ethnic groups and the remaining 1% of children had ethnic group unknown.
Children from non-white minority ethnic groups were therefore slightly over-represented compared with the national figures (according to the 2011 census, 21% of children in England are from non-white minority ethnic groups).
Figure 4: Children and young people in foster care in England, by ethnicity and sector
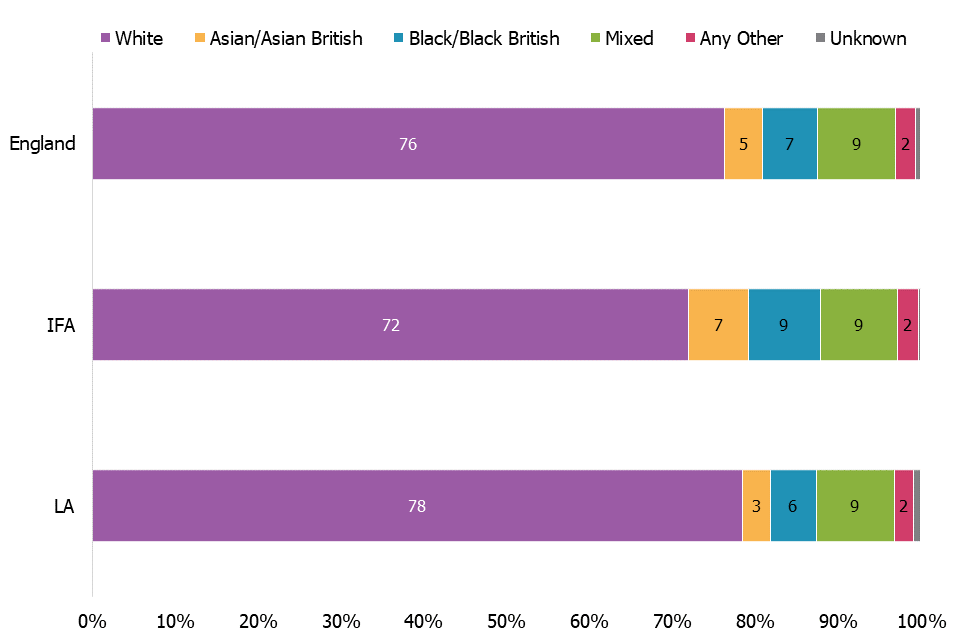
Just over three quarters of children and young people in care on 31 March 2018 were white
Disability
Of all children in a placement on 31 March 2018, 9% children were reported to be disabled, the same as last year. IFAs reported a slightly higher proportion of disabled children (10% or 1,780) compared with LAs (8% or 2,830).
Children’s experiences
One in four children who were subject to an unplanned ending were moved within 24 hours of the decision to end the placement. This is an increase compared to last year where one in five were subject to a moved within 24 hours of the decision to end the placement.
The Staying Put initiative was introduced to give stability and support to young people when they turned 18. Young people placed with LA agencies were more likely to stay with their carers’ after they turned 18, compared with those placed with IFAs. The percentage gap between LAs and IFAs is now the largest it has been in recent years.
Placement stability
In 2017–18, 6,240 (8%) fostered children experienced unplanned endings, of these 57% were placed in LAs when their unplanned ending occurred.
Of the children who experienced an unplanned ending in 2017–18, around a quarter (1,565) had at least one move within 24 hours of the decision to end the placement early.
Of all the children who experienced unplanned endings, almost a third stayed with the same agency. The majority of these children (77% or 1,570 children) were placed with LA fostering agencies at the time of the unplanned ending.
Staying Put[footnote 9]
Of the 3,435 children who turned 18 during 2017–18, just under half (49% or 1,695) continued to live with their foster carers. This is an increase of three percentage points since 2017 (46%, 1,570) but remained lower than 2015–16, when 54% stayed living with foster carers after turning 18. Figures published by the DfE present slightly higher proportions of children Staying Put (55%). This is likely due to DfE including Staying Put data for some care leavers beyond the age of 18.
The proportion of young people Staying Put with IFA carers increased by 2 percentage points from the previous year. The proportion who stayed living with LA carers also rose, by 6 percentage points. This widens the percentage gap between LAs and IFAs to 18 percentage points, the largest gap in recent years.
A recent survey by The Fostering Network reported over a third of foster carers surveyed had wanted to provide a Staying Put arrangement in the past but had been unable to. In almost a quarter of all instances, where a young person did not remain in placement after turning 18, carers said they were unable to afford the drop in income that providing a placement would induce.
Figure 5: Percentage of care leavers who remained with former foster carers after turning 18, by sector, 2012 to 2018
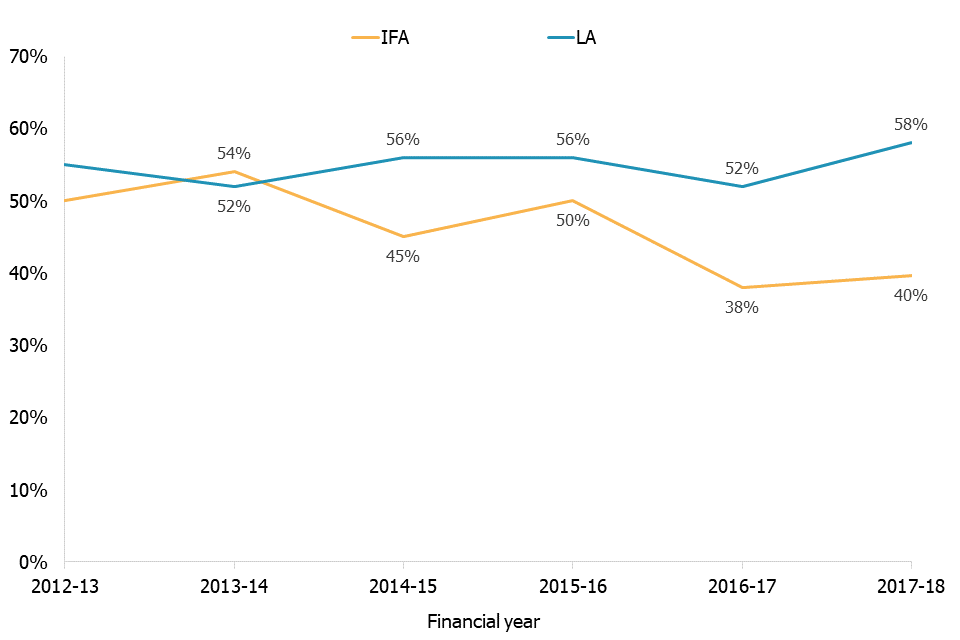
In 2017 to 18, a higher proportion of young people turning 18 in LA sector were Staying Put compared with those placed in IFAs
Safeguarding
DfE statutory guidance states children and young people who go missing from foster care should always be offered a return home interview (RHI) on their return.[footnote 10] In 2017–18, over half of missing children and young people received a RHI. This is an increase compared to 2016–17.
Children and young people at risk of child sexual exploitation were far more likely to go missing than those not deemed at risk of child sexual exploitation (CSE). This could be due to children going missing regularly being considered to be at risk of CSE.
Children going missing
In 2017–18, a total of 6,835 children (8% of all fostered children) went missing, a total of 30,615 times, in line with last year. The average number of missing incidents per missing child also remains at 4 instances per child. DfE publish data for the number of missing incidents (20,690) and number of instances children were away from placement without authorisation (3,390) during 2017–18.[footnote 11]
Over half of all missing children (3,595 or 53%) went missing primarily due to contact, including avoiding contact, with family and friends. The proportion of children going missing for unknown reasons has increased slightly since last year, from 16% to 18%. The majority of those missing (79% or 5,410) were missing for less than one week, in line with last year.
Of the 6,835 children who went missing, 3,870 (57%) received a return home interview, an increase of 2 percentage points since 2016–17 (55%). The majority of children who went missing at least once and had no RHI were placed with IFAs (57% or 1,695).
Child sexual exploitation
During 2017–18, there were 3,090 (4%) children and young people placed in foster care who were considered to be at risk of child sexual exploitation and 835 (1%) considered to be subject to child sexual exploitation. Although the percentages are in line with 2017 and 2016, the numbers of children reported to be at risk or subject to child sexual exploitation have continued to decrease.
Of the children at risk of child sexual exploitation, 64% were placed with LAs and 36% were placed with IFAs.
Missing children and child sexual exploitation
Not all children at risk of sexual exploitation went missing during the year. Though some, having gone missing in the previous year, will have been identified as being at risk because they went missing.
Table 5: Children and young people at risk of sexual exploitation, by instances of going missing, 2017–18
| CYP at risk of CSE | CYP at risk of CSE | CYP not at risk of CSE | CYP not at risk of CSE | Unknown risk of CSE | Unknown risk of CSE | |
|---|---|---|---|---|---|---|
| Number | Percentage | Number | Percentage | Number | Percentage | |
| Total CYP | 3,090 | 100 | 79,250 | 100 | 265 | 100 |
| Missing | 1,610 | 52 | 5,210 | 7 | 20 | 7 |
| Missing and received at least one RHI | 1,110 | 69 | 2,750 | 53 | 10 | 61 |
| Missing and received no RHI | 500 | 31 | 2,460 | 47 | 5 | 39 |
| Not missing | 1,480 | 48 | 74,040 | 93 | 250 | 93 |
Fifty-two percent of children at risk of child sexual exploitation had at least one missing incident, compared with 7% of children not at risk.
A higher proportion of children who went missing and were at risk of child sexual exploitation received a return to home interview compared with children not at risk (69% vs. 53%).
Restraint
In 2017–18, there were 1,205 incidents of physical restraint, which is a 6% decrease compared with last year. The number of children affected (630) is also lower than last year (650). The average number of incidents per child who experienced restraint remained similar.
The majority of incidents of physical restraint were reported within the IFA sector (81% of all instances). The large difference between sectors may reflect the level and nature of needs that children placed with IFAs have and could also be affected by variations in reporting processes between IFAs and LAs.
Allegations of abuse[footnote 12]
During 2017–18, there were 2,445 allegations of abuse made against foster carers. Just under two thirds of these (1,595) were made by fostered children, a similar proportion to last year.
Although the total number of allegations decreased by 3% (from 2,525 to 2,445) since 2017, it has returned to be in line with 2016.
Figure 6: Number and percentage of allegations against foster carers, by source, 2015 to 2018
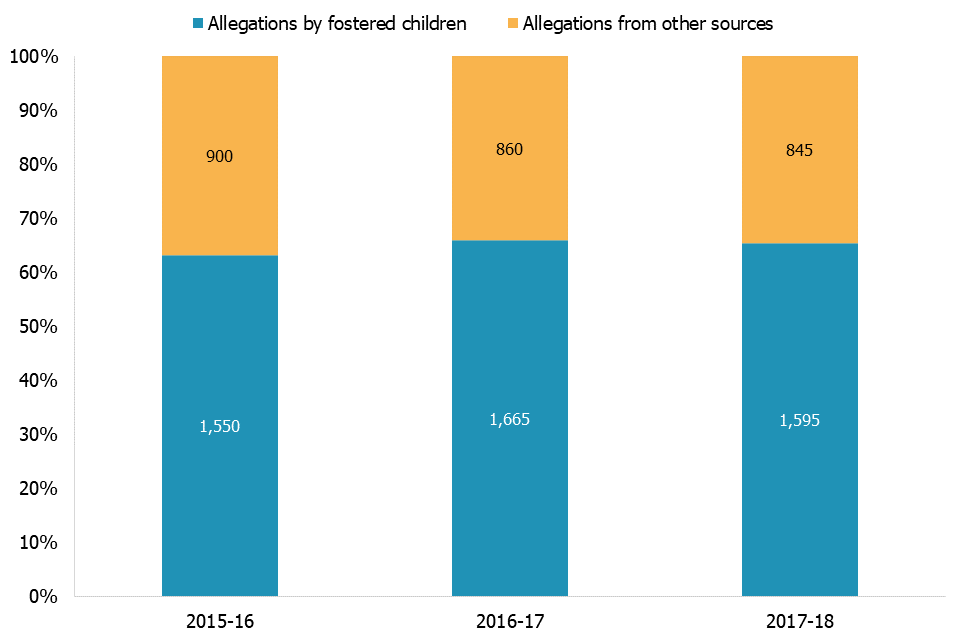
The majority of allegations of abuse came from children in 2017 to 2018, similar to the previous two years
In line with last year, more allegations (59%) were made in the LA sector compared with IFAs.
Fifty-eight per cent of all allegations were related to physical abuse, with allegations of sexual abuse being least common, showing a similar picture as 2017. The number of allegations of emotional abuse has slightly risen to 19%, from 18% in 2017.
In the same way as last year, continued monitoring of foster carers was a more common outcome for LAs (20%) than for IFAs (14%).[footnote 13]
Forty-three per cent of all LA investigations took less than 21 working days compared with 55% of investigations conducted by IFAs. For LAs, this is a decrease of 4 percentage points (from 47% in 2017).
Reasons for children and young people leaving fostering agencies
Data about reasons for leaving fostering agencies was collected for the first time in 2016–17 and this is the first year we have been able to make comparisons.
In 2017–18, 29,355 children and young people left foster agencies (36% of all children placed in the year).
The largest proportion of children and young people who left a foster agency’s care left due to no longer being Looked After (37%). This is a 4 percentage point decrease compared with last year, when 41% of children who left did so due to no longer being Looked After.[footnote 14]
Six per cent of children who left foster care (1,695) left due to Staying Put during 2017–18. This in line with 2015–16 after a slight drop last year. The number of children who turned 18 and no longer lived with foster carers remained at 6%.
Figure 7: Children and young people who left foster care during 2017–18, by reason
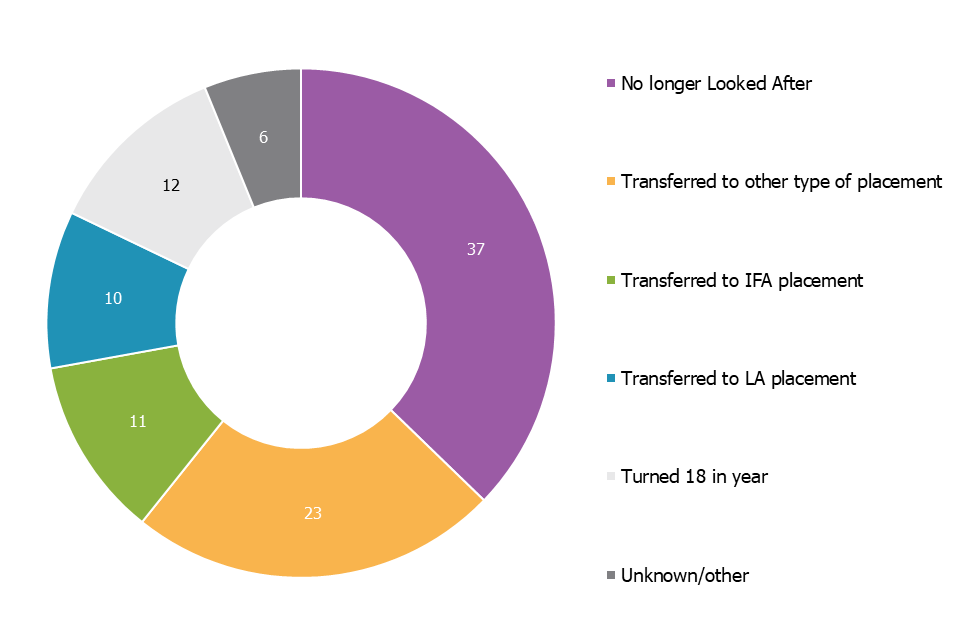
The highest proportion of children left foster care due to no longer being looked after, followed by transfer to other type of placement
Revisions to previous release
This is the first release of this data for the period 1 April 2017 – 31 March 2018. This data is fixed point in time data and will not be revised.
Notes
The Fostering in England 1 April 2017 to 31 March 2018 page also includes:
-
aggregated data at England, total LA, total IFA levels and at individual LA and regional total levels in Excel format
-
an accompanying quality and methodology report, which provides an explanation about key uses of this data, further contextual information, the arrangements for quality assurance and information about strengths and limitations of the statistics
Acknowledgements
Thanks to the following for their contribution to this statistical release: Jade Price-Stephens and Kathryn Kaal.
Glossary
A full definition of the terms below is available within the Dataset Excel file.
Approved foster carers
These are individual foster carers who were currently approved by a fostering service on 31 March 2018.
At risk (of child sexual exploitation)
This is any child where there is a concern that they will become subject to child sexual exploitation at some point, but this exploitation has not yet happened. The risk does not need to have been confirmed by other professionals.
Child sexual exploitation
A form of child sexual abuse occurring when an individual or group takes advantage of an imbalance in power to coerce a child into sexual activity in exchange for something the victim needs or wants, or to increase the status or financial advantage of the perpetrator.
Disabled
Section 6 of the Equality Act 2010 defines a disabled person as someone who has a physical or mental impairment which has a substantial and long term adverse effect on his or her ability to carry out normal day to day activities.
Exemption
An exemption is required in the specific situation in which a foster carer is asked to look after more than three children who are not all part of a sibling group, under sections 63(12) and Schedule 7(2) of the Children Act 1989.
Family and friends foster care
Foster care provided for a looked after child(ren) by a relative or friend who is approved by a fostering service to foster that particular child(ren).
Fostering agencies
Fostering agencies recruit, prepare, assess, train and support foster carers; they can be local authority, or independent (private companies or charities).
Foster places
Foster places refers to the total number of places that foster carers are approved to provide, whether occupied or not; it relates to the capacity of foster care in England.
Foster placements
Foster placements refers to arrangements made for children to be looked after, in this context living with foster carers.
Missing
In this context refers to children up to the age of 18 who have run away from their foster placement, have been abducted, or whose whereabouts are unknown; it does not include unauthorised absence where a child’s whereabouts are (thought to be) known.
Multi-dimensional treatment foster care (MTFC) under the Department for Education scheme
MTFC is a highly structured behavioural programme, providing wraparound multi-professional support and including daily communication between carers, the team and school aimed at diverting young people from anti-social peers.
No longer looked after
It refers to children who have ceased to be looked after (in care). They might have returned to live with their parents or other family member, or become subject to a Special Guardianship Order, or been adopted.
‘Not available’ places
These are foster care places in which no children are currently placed, but which are ‘not available’ for a child to be placed in. Among other reasons, this might be because a household is approved to provide additional places only to siblings and there are no siblings in placement, a former foster child is still living with the family under Staying Put arrangements after turning 18, or any placed children have been removed, or placements cannot be made, after an allegation against the carer(s).
Physical restraint
Stopping a foster child/young person from doing something they appear to want to do by physical means including to stop them hurting themselves.
Primary placement offer
Fostering households may be approved to offer multiple types of foster care. Data was collected about the usual or main type of care offered by each household (coded as ‘Primary placement offer’) and also about any other additional types of care households may be approved to provide.
Return home interview
An in-depth discussion of their reasons for running away offered to all children who go missing, by an independent person, usually the local authority, to try to prevent further missing episodes.
Staying Put
A duty on LAs to facilitate and support fostered young people remaining with their former foster carers, if this is what both parties want.
Subject to (child sexual exploitation)
This refers to any child considered to have experienced child sexual exploitation. This does not have to have been confirmed by other professionals.
Unplanned endings
This is a placement which ended earlier than the original planned end date; unplanned endings within 24 hours refers to when a child moves within 24 hours of the decision to end the placement early.
Withdrawn
Applications which are stopped by the applicant or by the service (after a decision prior to panel that the applicant is not suitable).
Further information
If you have any comments or feedback on this publication, please contact Adam King on 03000 130020 or socialcaredata@ofsted.gov.uk
-
Family and friends households only partly explain the difference between IFA and LA households approved for multiple types of care as a gap still exists when family and friends households are excluded (88% IFA households compared with 44% LA households) ↩
-
Households can be approved to offer multiple types of foster care, therefore percentages will not add to 100. ↩
-
The DfE reported 55,200 children in care in foster placements at 31 March 2018. Children looked after in England including adoption: (DfE), 2018 ↩
-
This figure includes 2,180 foster carers who are White ethnic minorities (White Irish; White Other; White Irish Traveller; White Roma/Gypsy/Traveller). These carers represent 4% of White carers and 3% of all carers. ↩
-
Two percent of all foster carers approved at 31 March 2018 had an ethnicity of ‘unknown’ recorded. As such, the percentages relating to ethnic groups do not always add up to 100%. ↩
-
Five percent of new carers were reported, the majority by LA agencies, with ethnicity marked as ‘unknown’. ↩
-
The 2017–18 fostering dataset collection asked for data on all children still in placement on 31 March 2018, looking back at the 12 months before this date (or whatever portion of the year the child was in placement with the agency). ↩
-
As not all agencies provided matching data for their numbers of fostered children and numbers of fostering places, the overall number of fostered children and number of fostering places does not match. ↩
-
Please refer to the glossary for a full definition of the Staying Put scheme. ↩
-
An RHI is designed to give the child and the placing LA a chance to discuss why the child went missing and agree actions to try and prevent further instances of going missing. ↩
-
This was slightly lower than the 11% for children in care reported by the DfE; however, their figure is likely to be impacted by including all types of placements. DfE data on children missing from foster placements is ‘not available’. The DfE also reported a higher average number of incidents per missing child (6.1). ↩
-
Data on complaints received, including source and whether they were upheld, is available in the underlying data tables. ↩
-
Under continued monitoring, the accused foster carer is monitored by the agency for a specified time. During this time they may receive additional training, such as de-escalation or behaviour management. Once the specified time has elapsed, the outcome is reviewed and either referred to panel (if concerns remain) or resolved. ↩
-
Children might have returned to live with their parents or other family member, or become subject to a Special Guardianship Order, or been adopted. ↩