Food Statistics in your pocket 2017: Prices and expenditure
Updated 9 October 2018

© Crown copyright 2018
This publication is licensed under the terms of the Open Government Licence v3.0 except where otherwise stated. To view this licence, visit nationalarchives.gov.uk/doc/open-government-licence/version/3 or write to the Information Policy Team, The National Archives, Kew, London TW9 4DU, or email: psi@nationalarchives.gov.uk.
Where we have identified any third party copyright information you will need to obtain permission from the copyright holders concerned.
This publication is available at https://www.gov.uk/government/statistics/food-statistics-pocketbook-2017/food-statistics-in-your-pocket-2017-prices-and-expenditure
2.1: UK trend in food and non-alcoholic beverage prices in real terms, January 1998 to March 2018
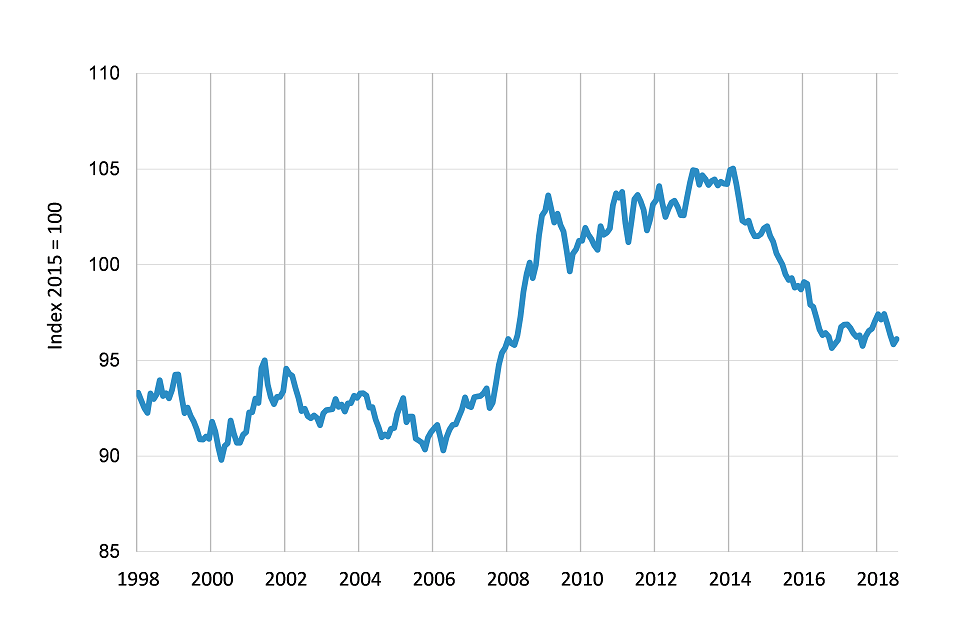
UK trend in food and non-alcoholic beverage prices in real terms, January 1998 to July 2018
Food and non-alcoholic beverage prices1 rose 9.3% in real terms between 2008 and their peak in February 2014 as measured by the Consumer Price Index. Gradual price reductions since 2014 have resulted in a 3.4% decrease compared to 2008.
Food and non-alcoholic beverage price inflation in real terms has fallen by 0.2% since 12 months ago. In 2018 prices have fluctuated after a long period of negative inflation.
Successive spikes in the price of agricultural commodities since 2007 have led to higher retail food prices. They have not returned to the low price levels of pre-2007.
Oil prices also rose over this period, and inflation was higher than historically, but food prices have risen above inflation.
Those on lower incomes tend to buy different food items to those on average or high incomes but food prices for these different shopping baskets have risen at about the same rate.
A rise in food prices is more difficult for low income households to cope with because those on low incomes spend a greater proportion of their income on food - a rise in food prices has a disproportionately large impact on money available to spend elsewhere.
Source: Consumer Price Indices, (ONS)
1 Excludes catering.
National Statistics.
2.2: Trend in share of spend going on food and non-alcoholic beverages in low income and all UK households, 2004-05 to 2016
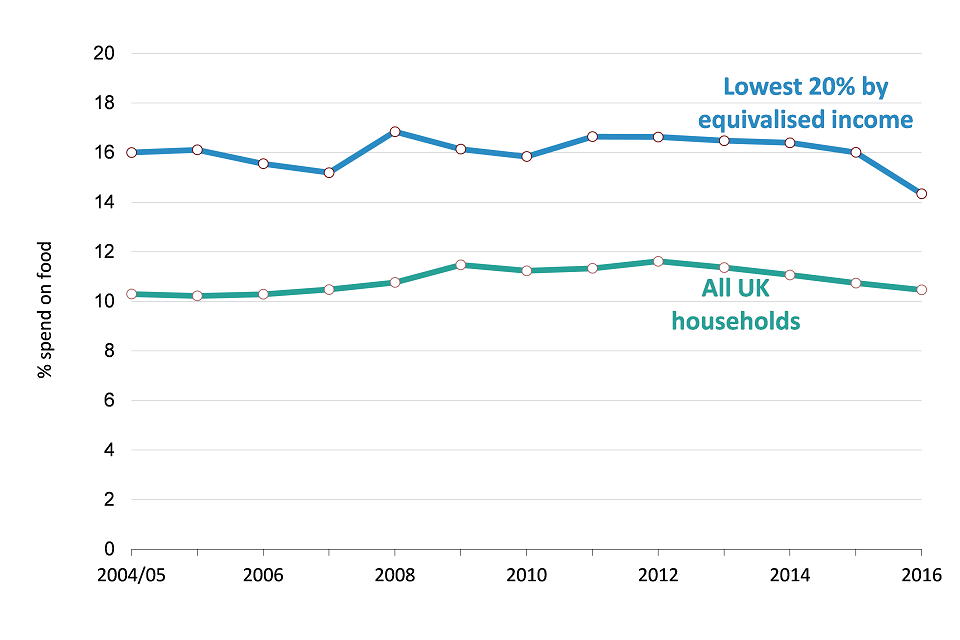
Trend in share of spend going on food and non-alcoholic beverages in low income and all UK households, 2003-04 to 2016
The relative affordability of food can be measured by the share of the household budget that goes on food. Low income households are of particular concern as they tend to have a greater percentage of spend going on food.
Food is exerting greater pressure on household budgets since 2007 when food prices started to rise in real terms.
Averaged over all households 10.5% of spend went on food in 2016, the same as the 2007 level.
For households in the lowest 20% by equivalised income2 14% of spend went on household food, 5.6 percentage points below 2007.
Source: Living Costs and Food Survey (Defra/ONS), Family Spending table 3.1e (ONS)
2 See Glossary for definition of equivalised income.
National Statistics.
2.3: Household income (after housing costs) and food prices in real terms (UK) 2016-17
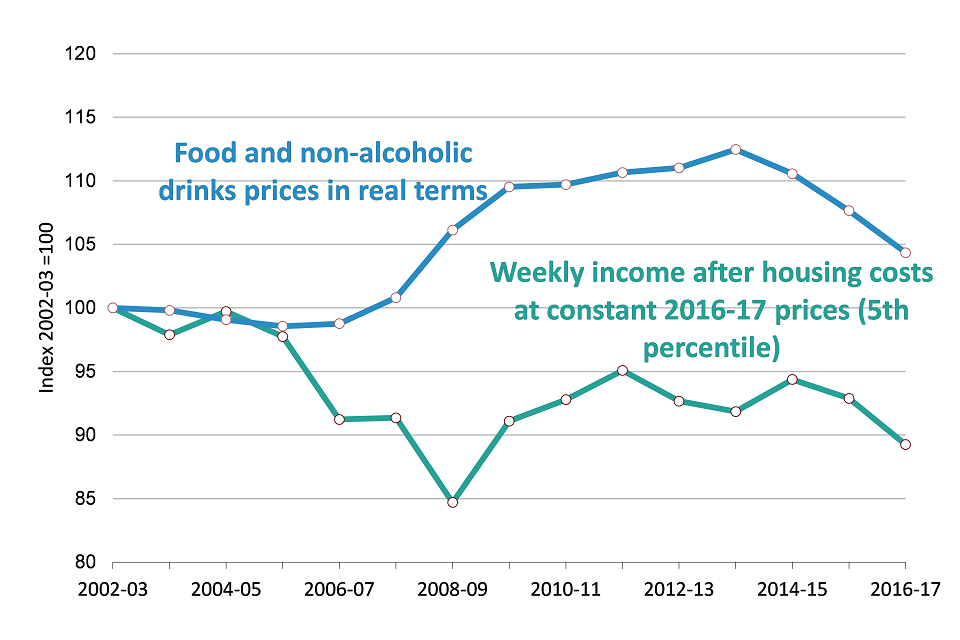
Household income (after housing costs) and food prices in real terms (UK) 2016-17
Income after housing costs fell 10.7% between 2002-03 and 2016-17 for low income 3 (5th percentile) households. Over the same time period, food prices (in real terms) increased 4.3%. In 2008-09 the income for low income households reached its lowest level, 15.3% below that of 2002-03. Small decreases between 2012-13 and 2013-14 were partially reversed in 2014-15 when income increased by 2.7%, coinciding with a 1.7% fall in food prices.
2008-09 saw the biggest increase of 5.3% in the price of food and non-alcoholic drink. 2016-17 saw the largest decrease of 3.1%. The biggest change since 2002-03 was in 2013-14 when there was an increase of 12.5%.
In 2016-17, the 5th, 80th, 85th and 90th percentiles, saw falls in income, with the 5th percentile seeing the highest decrease of 3.9%. All but the lowest income group 4 were above the 2002-03 level with the 95th percentile group seeing the highest increase of 13.0% while the 5th percentile group saw a 10.7% decline.
Source: Living Standards, Poverty and Inequality in the UK, 2016; Institute for Fiscal Studies
3 See Glossary for definition of Low income.
4 Households Below Average Income, DWP June 2016.
2.4: UK retail price changes by food group, 2007 to 2017
| Food group | % change between 2007 and 2017 |
|---|---|
| CPIH (overall index) | 24% |
| Milk, cheese and eggs | 19% |
| Vegetables including potatoes and tubers | 21% |
| Alcoholic beverages | 21% |
| Mineral waters, soft drinks and juices | 22% |
| Meat | 28% |
| Food and non-alcoholic beverages | 31% |
| Bread and cereals | 32% |
| Catering services | 34% |
| Coffee, tea and cocoa | 42% |
| Fish | 42% |
| Sugar, jam, syrups, chocolate and confectionery | 43% |
| Fruit | 44% |
| Oils and fats | 47% |
All food and non-alcoholic beverage groups have risen in price since 2007 (the start of the recession), with rises ranging from 19% to 47%. Coffee, tea and cocoa, fruit, sugar, jam and confectionery, fish and oils and fats have all risen in price by 35% or more since 2007. Rising prices seen up to 2014 have begun to fall over the last couple of years. From 2016 to 2017 prices rose in all food groups with the exception of mineral waters, soft drinks and juices which fell by 1.6% Catering increased by 2.8%.
Milk, cheese and eggs saw the greatest rise between 2016 and 2017 at 8.6% followed by oils and fats at 6.1%. Sugar, jam, syrups, chocolate and confectionery had the smallest rise at 1.5%.
Food price rises have a strong effect on food shopping for low income households. Since 2014 households in decile 1 (lowest income group) have bought less lamb, beef, fish, potatoes and vegetables, but more fruit, pork, soft drinks, poultry, eggs, cheese, bread and cakes and biscuits.5
Source: Consumer Price Index including owner occupiers’ housing costs (CPIH) (ONS)
5 Family Food 2016-17, Defra, April 2018.
National Statistics.
2.5: Percentage change in food purchases 2014-2016/17, in low income households and all households (UK)
| Change in quantity purchased between 2007 to 2015 | Income decile1 | All households |
|---|---|---|
| Alcoholic drinks | 49% | 4% |
| Tea | -42% | -1% |
| Bread | 0% | -4% |
| Biscuits & cakes | 13% | 3% |
| Beef | -19% | 0% |
| Lamb | -44% | -37% |
| Pork | 0% | -13% |
| Poultry | 2% | 2% |
| Fish | -23% | -5% |
| Milk | -5% | -2% |
| Vegetables | -9% | 3% |
| Fruit | 6% | 2% |
In 2016/17 the lowest income households (equivalised income 6 decile 1) purchased more fruit, poultry and biscuits and cake than in 2014, while purchases in all other categories fell with the exception of bread and pork which remained the same. Purchases of vegetables by all households rose 3% but low income households purchased 9% less than in 2014. Purchases of fruit by all households rose 2% compared to a rise of 6% in low income households since 2014.
Low income households saw a larger decrease in purchases of lamb, fish, beef and alcoholic drinks than all households. In 2016/17, low income households purchased 44% less lamb than in 2014, and all households purchased 37% less, the largest decreases in both groups. This is despite lamb prices falling 0.1% in this period.
In 2016/17, average UK households purchased 0.6% more food than in 2014 while spending 0.3% more. Households in income decile 1 (lowest income group) spent 4.1% less on food in 2016/17 than in 2014 and purchased 1.1% less.
Food is the largest item of household expenditure for low income households after housing, fuel and power costs.
Source: Family Food 2016-17, Defra
6 See Glossary for definition of equivalised income
National Statistics.
2.6: Attitudes towards British food purchases in the UK (2016)
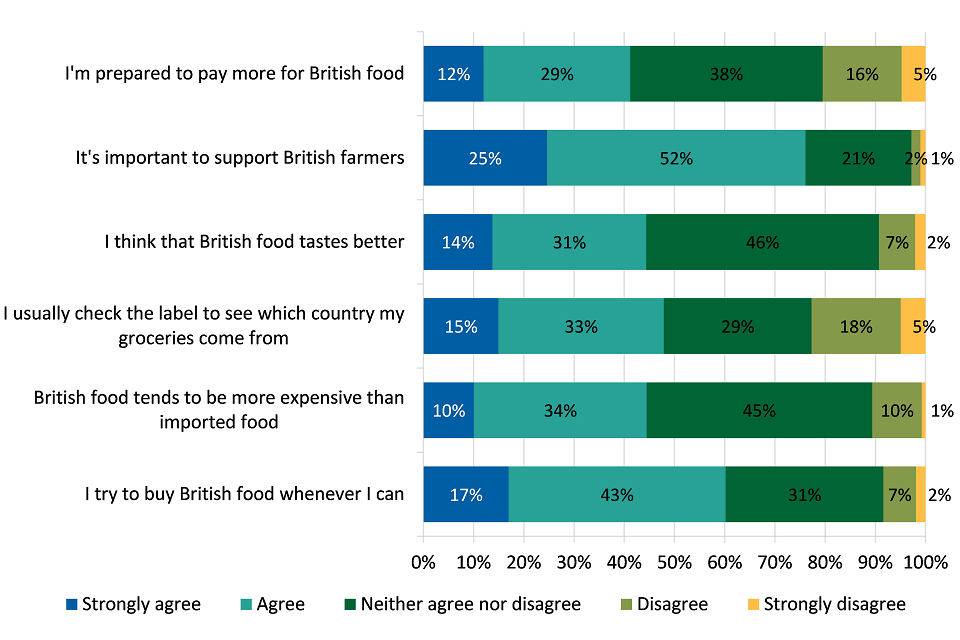
Attitudes towards British food purchases in the UK (2016)
When surveyed, 60% of shoppers agree that they try to buy British food whenever they can while 8% disagree. 76% agree that it is important to support British farmers while only 3% disagree.
However, 44% think that British food is more expensive than imported food and 41% are prepared to pay more for British food. 21% aren’t prepared to pay more while 11% disagree when asked if British food is more expensive.
According to the survey 45% think that British food tastes better while 9% disagree.
52% were undecided as to whether it is important to support British farmers while only 29% were undecided when asked whether they were prepared to pay more for British food.
Source: Lightspeed GMI/Mintel
2.7: UK trend in sales of ethical produce
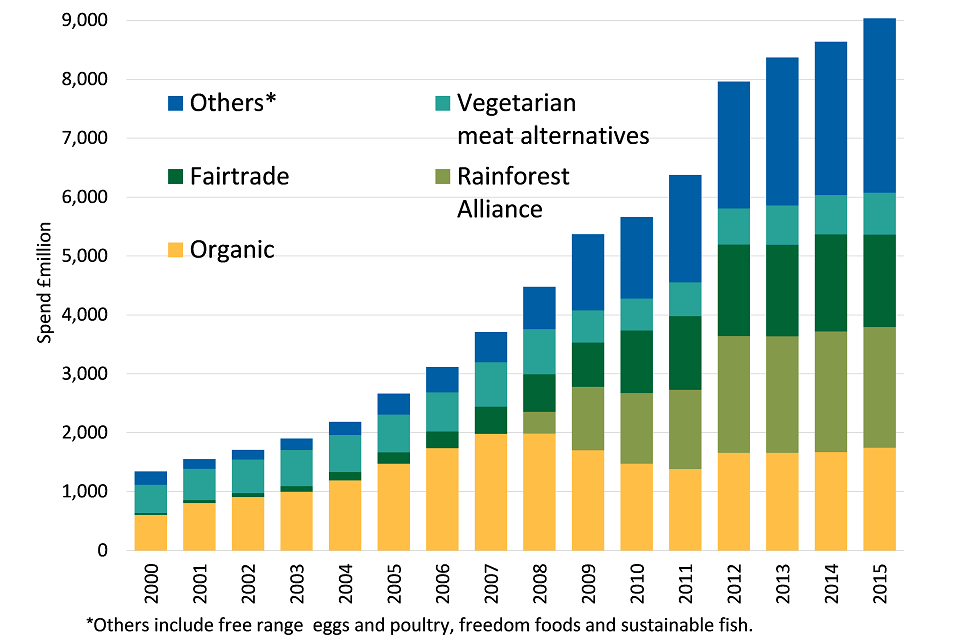
UK trend in sales of ethical produce
Sales in ethical food and drink, including organic, fair-trade, free range and freedom foods rose to £9 billion in 20157, 9.4% of all household food sales.
Sales of ethical produce have increased year on year since 2007, despite the economic downturn.
Rainforest Alliance made up the largest single share in 2015, accounting for 23% of the total ethical food sector at £2.0 billion; unchanged from 2014. Organic products are the next largest contributors at 19% (£1.7 bn) followed by fairtrade at 17% (£1.6 bn).
Sales of organic food and drink have been steady in the last few years, although still 12% down on their peak in 2008.
Sales of freedom foods rose by 29% in 2015 to £1.6 bn while free range poultry fell by 5% to £0.3 bn.
Figures are determined by the Ethical Consumer Market Report by The Ethical Consumer Research Association based on administrative data held by ethical labelling organisations, trade associations and market research data.
Source: Ethical Consumer Market Report 2015, Ethical Consumer Research Association
7 Excludes food and drink boycotts.
Go to Summary section
Go to Food chain section
Go to Global and UK supply section
Go to home page for downloadable data for charts
Contact
Enquiries to: familyfood@defra.gov.uk
Lead statistician: David Lee
Tel: 0208 026 3006
You can also contact us via Twitter: @DefraStats
Food Statistics team
Department for Environment, Food and Rural Affairs
Foss House, Kings Pool
1-2 Peasholme Green
York YO1 7PX
Glossary
Economic Definition of food and agri-food sector
The UK food sector is defined as food manufacturing, food wholesaling, food retailing and non- residential catering. In terms of the standard industrial classification (SIC 2007) it is defined as:
| Category | SIC codes |
|---|---|
| Food Manufacturing | 10 + 11 |
| Food Wholesaling | 46.3 (excluding 46.35) + 46.17 |
| Food Retailing | 47.2 (excluding 47.26) + 47.11 + 47.81 |
| Non-residential Catering | 56 |
The deductions are to remove non-food items as far as possible.
The agri-food sector is the food sector plus agriculture and fishing. Agriculture and fishing are shown in several charts for comparison.
Net capital expenditure
This is calculated by adding to the value of new building work, acquisitions less disposals of land and existing buildings, vehicles and plant and machinery.
Gross Value Added (GVA)
GVA is the difference between output and intermediate consumption for any given sector / industry. This is the difference between the value of goods and services produced and the cost of raw materials and other inputs which are used up in production.
Total Factor Productivity (TFP)
Productivity measures the efficiency at which inputs are converted into outputs. Total Factor Productivity provides a comprehensive picture of growth.
Low income
The most commonly used threshold to determine relative low income is having an income which is less than 60% of the median in that year. Absolute low income is considered to be having an income which is less than 60% of the median in that year, adjusted for inflation.
Equivalised income
The income a household needs to attain a given standard of living will depend on its size and composition. Equivalisation is a means of adjusting a household’s income for size and composition so that the incomes of all households are on a comparable basis.
Small and Medium Enterprises (SMEs)
Outside of these statistics, the definition of a SME can depend upon several factors, including turnover. For these statistics, a ‘small’ business is a private sector business with fewer than 50 employees. A ‘medium’ business is a private sector business with between 50 and 249 employees. A ‘micro’ business is a private sector business with between 1 and 10 employees, which, for the purpose of these statistics is incorporated within the ‘small’ category.