Food Statistics in your pocket 2017 - Global and UK supply
Updated 9 October 2018

© Crown copyright 2018
This publication is licensed under the terms of the Open Government Licence v3.0 except where otherwise stated. To view this licence, visit nationalarchives.gov.uk/doc/open-government-licence/version/3 or write to the Information Policy Team, The National Archives, Kew, London TW9 4DU, or email: psi@nationalarchives.gov.uk.
Where we have identified any third party copyright information you will need to obtain permission from the copyright holders concerned.
This publication is available at https://www.gov.uk/government/statistics/food-statistics-pocketbook-2017/food-statistics-in-your-pocket-2017-global-and-uk-supply
Please answer 4 short questions (opens in Google Forms) to help us make the pocketbook better for you.
3.1 Origins of food consumed in the UK 2017
| Region | Percentage supplied to the UK |
|---|---|
| UKa | 50% |
| EU | 30% |
| Africa | 4% |
| North America | 4% |
| South America | 4% |
| Asia | 4% |
| Rest of Europe | 2% |
| Australasia | 1% |
a UK origin consists of UK domestic production minus UK exports
Sourcing food from a diverse range of stable regions, in addition to domestically, enhances food security1.
Based on the farm-gate value of unprocessed food in 20172, the UK supplied just under half (50%) of the food consumed in the UK. The leading foreign supplier of food consumed in the UK were countries from the EU (30%). Africa, Asia, North and South America esch provided a 4% share of the food consumed in the UK.
The three largest value imported commodity groups (at 2017 prices) were fruit & vegetables, meat and beverages (see 3.4).
Source: Chapter 14, Agriculture in the United Kingdom, Defra
1 UK Food Security Assessment, January 2010 (Defra).
2 2017 figures are provisional.
3.2 UK Food production to supply ratio 1988 to 2017
UK Food production to supply ratio 1988 to 2017
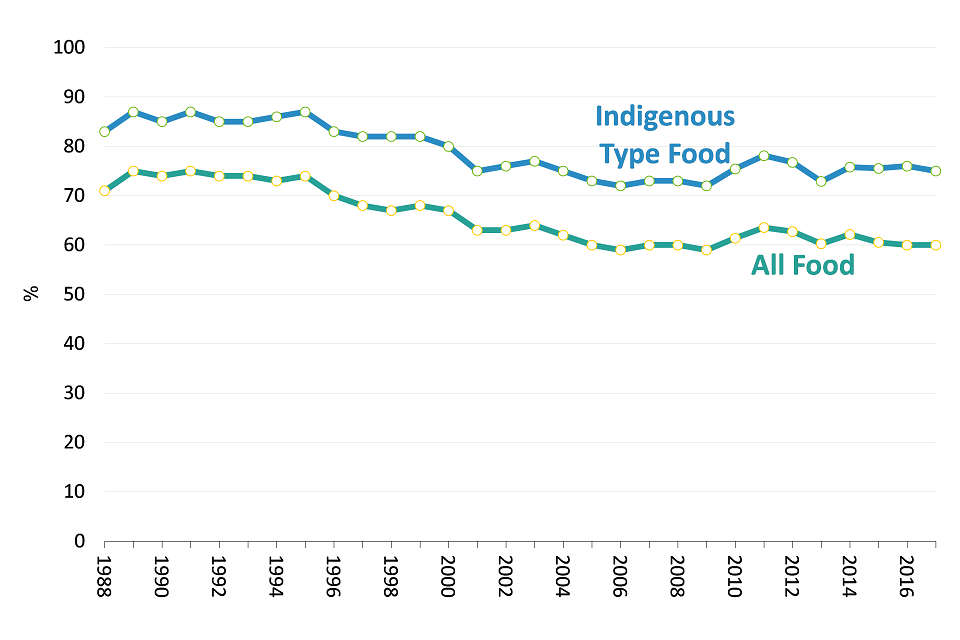
Food Production to Supply Ratio is calculated as the farm-gate value of raw food production (including for export) divided by the value of raw food for human consumption. It provides a broad indicator of the ability of UK agriculture to meet consumer demand.
A high production to supply ratio fails to insulate a country against many possible disruptions to its supply chain. The ratio in 2017 was 60% for all food and 75% for indigenous type food. This compares with 60% and 76% respectively in 2016 showing very little change between the years.
Source: Chapter 14, Agriculture in the United Kingdom, Defra
3.3 Trends in UK food production and final output at market prices
Trends in UK food production and final output at market prices
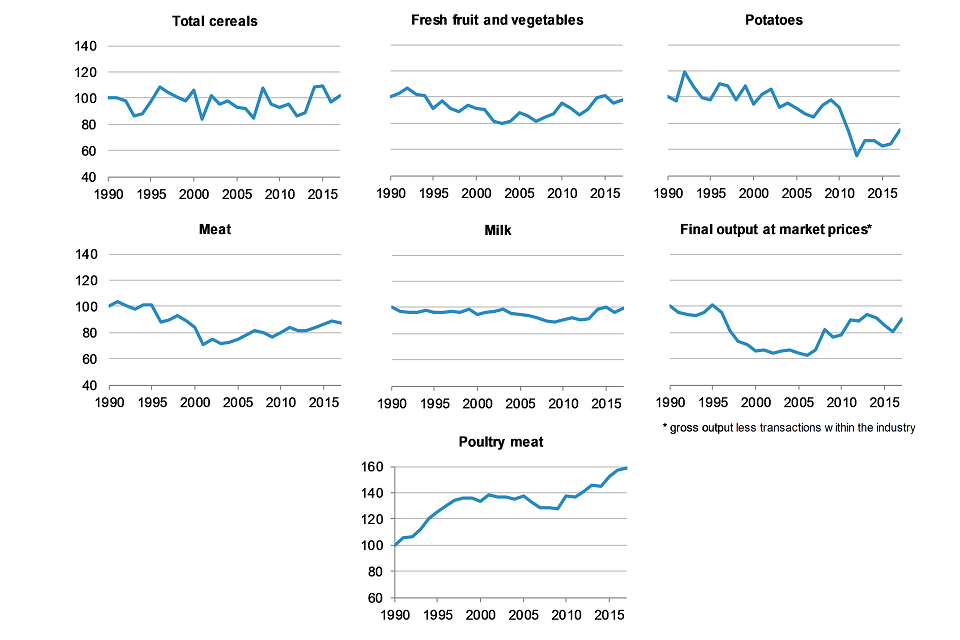
Final output3 of UK agriculture is a proxy for UK food production. The volume of all outputs rose by 12% between 2016 and 20174.
Total UK cereal production has fluctuated, with significant dips in 2001, 2007, 2012 and 2013, linked to adverse weather conditions in those years. There was an 5% rise in 2017 compared to 2016 reflecting the above average yields recorded in 2015.
Since 1990 there have been large increases in production levels of poultry meat, part of a longer term upward trend since the late 1970’s. Although production dipped during the second half of the 2000’s it increased significantly in 2010 and has remained high. Following a slight fall in 2014, total production of poultry has resumed an upward trend and increased by 1% to a record level in 2017.
Red meat production showed a downward trend through much of the 1990’s, driven by a combination of factors including the beef export ban. Since 2005 there has been a slight upward movement but levels still remain lower than those in the 1990’s.
Source: Chapters 7 and 8, Agriculture in the United Kingdom, Defra
3 Gross output less transactions within the industry.
4 2017 figures are provisional.
3.4 UK trade in different food groups, 2017
| 2017 | exports £billion | imports £billion |
|---|---|---|
| Fruit and veg | 1.2 | 11.1 |
| Meat | 1.8 | 6.7 |
| Beverages | 7.4 | 5.7 |
| Cereals | 2.1 | 3.9 |
| Dairy & eggs | 1.8 | 3.2 |
| Fish | 1.9 | 3.2 |
| Misc | 2.0 | 3.2 |
| Coffee, tea, cocoa etc. | 1.5 | 3.8 |
| Animal feed | 1.4 | 2.2 |
| Oils | 0.6 | 2.1 |
| Sugar | 0.4 | 1.3 |
In 20175 the value of imports was greater than the value of exports in each of the broad categories of food, feed and drink except ‘Beverages’ which had a trade surplus of £1.71 bn, largely due to exports of Scotch Whisky.
Beverages are the largest export category by far with an export value of £7.4 bn in 2017, up by 6% on 2016.
Cereals is the second largest export group with a value of £2.1 bn, followed by the meat and fish categories at around £1.8 bn each (excluding the miscellaneous category).
‘Fruit and vegetables’ has the largest trade deficit. In 2017 imports were £11.1 bn while exports were worth £1.2 bn, giving a trade gap of £9.8 bn.
The second largest groups in terms of imports in 2017 were meat and beverages with imports of £6.7 and £5.7 bn respectively.
Source: HMRC.
5 2017 figures are provisional.
3.5 Trend in exports of food, feed and drink
| Year | £ billion |
|---|---|
| 2000 | 11.9 |
| 2001 | 11.5 |
| 2002 | 11.8 |
| 2003 | 12.8 |
| 2004 | 12.2 |
| 2005 | 12.2 |
| 2006 | 12.5 |
| 2007 | 13.3 |
| 2008 | 15.0 |
| 2009 | 15.9 |
| 2010 | 17.7 |
| 2011 | 19.9 |
| 2012 | 19.6 |
| 2013 | 20.0 |
| 2014 | 19.6 |
| 2015 | 18.8 |
| 2016 | 20.1 |
| 2017 | 22.0 |
The total value of food and drink exports increased in 20176 to £22 billion, £1.9 billion more than the previous peak of £20.1 billion in 2016.
Beverages had the greatest value increase at £441 million (6%). Exports of dairy products and birds eggs increased by £386 million (28%) and exports of fish and fish preparations increased by £228 million (14%). Cereals and cereal preparations had the only reduction in value falling by £216 million (9%).
The trade deficit in food, feed and drink increased in 2017 to a new record high of £24.2 billion, up from £22.8 billion in 2016.
Source: HMRC
6 2017 figures are provisional.
3.6 World agricultural commodity prices to March 2018
World agricultural commodity prices to March 2018
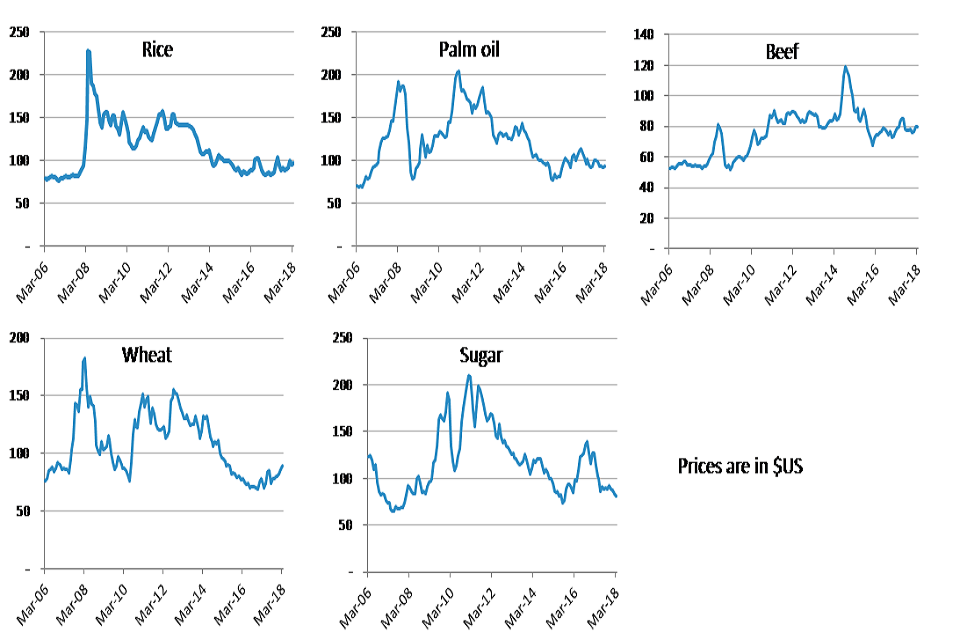
Rice prices rose sharply in April 2008 to double what they had been in March. This was due to a shortage, a weak US dollar and rising production costs.
Beef prices peaked in September 2014, having risen 50% over the previous year due to a shortage of cattle.
In the 11 years of data rice has shown the biggest variation of prices with the lowest price in 2006 only being 33% of the highest price in 2008. Beef has shown the smallest variation in prices with the lowest price in 2009 being 44% of the highest price in 2014.
Sugar prices have varied, but peaked in 2010/11, while palm oil and wheat prices have fluctuated over the period.
Source: UNCTAD
3.7 World grains stocks to consumption ratio to 2017-2018
World grains stocks to consumption ratio to 2017-2018
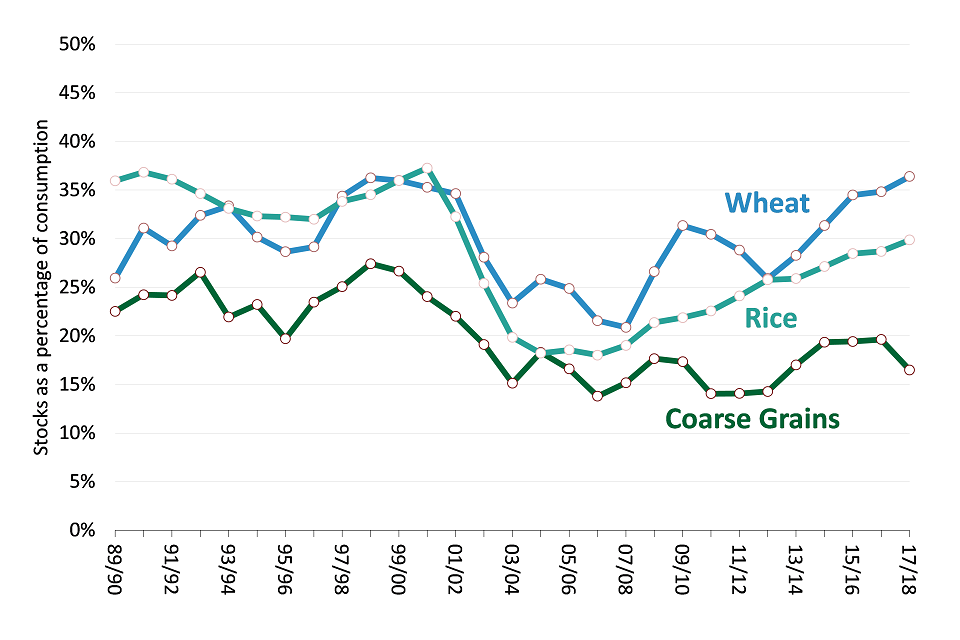
Stocks to consumption ratios7 are an indicator of global resilience to food shortages and price stability. With low stocks, markets become sensitive to further supply shortfalls, which magnifies the price response.
Wheat and Coarse Grain stocks have been on a rising trend in recent years, starting with the 2012-13 crop year8.
Rice stocks have been on an upward trend since the 2006/07 harvest.
Rice consumption (the denominator) is also on a gradually rising trend, leaving the indicator largely unchanged since crop year 2014-15.
Source: International Grains Council (IGC), United States Department of Agriculture (USDA)
7 From August 2013, Production, Supply and Distribution (PSD) numbers for “European Union” reflect the addition of Croatia to the former EU-27. Croatia data no longer exists in the PSD after 1998/99; therefore, comparisons to data, including World Totals, will differ from those published prior to July 2013.
8 USDA projections.
3.8 Retailer warehouse stock levels - 5 year change
| 2016 | Retailers | Suppliers |
|---|---|---|
| Increased by 10% or more | 2 | 12 |
| Increased by between 5-10% | 3 | 3 |
| Increased by up to 5% | 25 | 7 |
| Stayed the same | 40 | 26 |
| Fallen by up to 5% | 17 | 16 |
| Fallen by between 5-10% | 3 | 13 |
| Fallen by 10% or more | 10 | 23 |
In the 5 years to 2015, 52% of suppliers reduced their distribution centre stock levels while only 22% increased their stock. 26% of suppliers had no change in stock levels.
In the same period, 40% of retailers had no change in stock levels, while 30% of suppliers increased stock levels and the same proportion saw a decrease.
The majority of retail supply chains have between one and four weeks of stock, with suppliers tending to hold higher levels of stock than retailers. For fresh produce, stock levels can sometimes be only 24 hours or less. As retail supply chains become more responsive, lead times9 are reducing and order frequencies are increasing.
Retailers are increasingly moving products into their stockless networks, managing products from across their ranges in the same way as the fresh and produce categories.
The impact of the current economic climate on consumer spending has helped drive this change as retailers look at ways of funding price cuts; supply chain operating costs and working capital tied up in inventory has provided such an opportunity.
Source: IGD Research, 2015.
9 The time between an order being placed and delivery.
Go to Summary section
Go to Food Chain section
Go to Prices and expenditure section
Go to home page for downloadable data for charts
Contact
Enquiries to: familyfood@defra.gov.uk
Lead statistician: David Lee
Tel: 0208 026 3006
You can also contact us via Twitter: @DefraStats
Food Statistics team
Department for Environment, Food and Rural Affairs
Foss House, Kings Pool
1-2 Peasholme Green
York YO1 7PX
Glossary
Economic Definition of food and agri-food sector
The UK food sector is defined as food manufacturing, food wholesaling, food retailing and non- residential catering. In terms of the standard industrial classification (SIC 2007) it is defined as:
| Category | SIC codes |
|---|---|
| Food Manufacturing | 10 + 11 |
| Food Wholesaling | 46.3 (excluding 46.35) + 46.17 |
| Food Retailing | 47.2 (excluding 47.26) + 47.11 + 47.81 |
| Non-residential Catering | 56 |
The deductions are to remove non-food items as far as possible.
The agri-food sector is the food sector plus agriculture and fishing. Agriculture and fishing are shown in several charts for comparison.
Net capital expenditure
This is calculated by adding to the value of new building work, acquisitions less disposals of land and existing buildings, vehicles and plant and machinery.
Gross Value Added (GVA)
GVA is the difference between output and intermediate consumption for any given sector / industry. This is the difference between the value of goods and services produced and the cost of raw materials and other inputs which are used up in production.
Total Factor Productivity (TFP)
Productivity measures the efficiency at which inputs are converted into outputs. Total Factor Productivity provides a comprehensive picture of growth.
Low income
The most commonly used threshold to determine relative low income is having an income which is less than 60% of the median in that year. Absolute low income is considered to be having an income which is less than 60% of the median in that year, adjusted for inflation.
Equivalised income
The income a household needs to attain a given standard of living will depend on its size and composition. Equivalisation is a means of adjusting a household’s income for size and composition so that the incomes of all households are on a comparable basis.
Small and Medium Enterprises (SMEs)
Outside of these statistics, the definition of a SME can depend upon several factors, including turnover. For these statistics, a ‘small’ business is a private sector business with fewer than 50 employees. A ‘medium’ business is a private sector business with between 50 and 249 employees. A ‘micro’ business is a private sector business with between 1 and 10 employees, which, for the purpose of these statistics is incorporated within the ‘small’ category.