Flood Guidance Statement: information and user guide
Updated 16 June 2026
Applies to England and Wales

© Crown copyright 2026
This publication is licensed under the terms of the Open Government Licence v3.0 except where otherwise stated. To view this licence, visit nationalarchives.gov.uk/doc/open-government-licence/version/3 or write to the Information Policy Team, The National Archives, Kew, London TW9 4DU, or email: psi@nationalarchives.gov.uk.
Where we have identified any third party copyright information you will need to obtain permission from the copyright holders concerned.
This publication is available at https://www.gov.uk/government/publications/flood-forecasting-centre-services-flood-guidance-statement/flood-guidance-statement-user-guide
1. Overview
Introduction to the Flood Guidance Statement
Summary
The Flood Guidance Statement (FGS) is a daily flood risk forecast for England and Wales. It assists with strategic, tactical and operational planning decisions for:
-
the UK and Welsh governments
-
other organisations involved in emergency and flood response
The FGS:
-
is produced by the Flood Forecasting Centre (FFC) with the Met Office and local Environment Agency and Natural Resources Wales flood forecasting teams
-
is issued by the FFC every day by 11.00am and at other times if the flood risk assessment changes
-
shows the forecast level of flood risk for the coming 5 days for surface water, river, groundwater and coastal flooding - based on a reasonable worst case scenario
-
uses a detailed risk matrix approach - based on a combination of likelihoods and impacts
-
forecasts at a local authority scale
-
shows an advisory badge signalling a heightened risk of rapid flooding - when the Rapid Flood Guidance (RFG) service is operational
-
provides a summary forecast for the 6 to 10 day period where necessary
Contacting the FFC
You can discuss the content of the FGS with a hydrometeorologist on 0330 135 4400.
The FFC operates a 365 day, 24 hour service.
2. Signing up
You can sign up to receive the FGS directly from the FFC.
It is also available through:
-
Hazard Manager - a Met Office service
-
Resilience Direct - as a PDF when the overall flood risk is coloured yellow or above
-
an Application Programming Interface (API) for developers
Personal information for Hazard Manager and email users is managed in line with the Met Office privacy policy.
Email and text message
Signing up for the FGS by email allows you to:
-
receive the FGS as a PDF each day into your inbox
-
select which local authority areas you are interested in
-
select whether you wish to receive the FGS at different flood risk levels - we advise signing up for all risk levels so you receive all the information available in the lead up to any floods
-
sign up for the FGS text message service
We encourage individuals to register rather than using generic accounts so we can:
-
maintain contact details
-
circulate service messages
-
keep you up to date with training and other support available
Hazard Manager
Signing up for the FGS through Hazard Manager allows you to:
-
view the FGS clearly on computer, tablet or mobile
-
view county and risk areas maps interactively
-
use other features, such as filtering by flood source or setting your personalized map views
-
access the PDF version if required
-
access Met Office weather and warnings and other hazard advice and services in one portal
Separate user guides and videos to help you get started on Hazard Manager are available at the Hazard Manager Help Centre.
Resilience Direct
The FGS can be downloaded in PDF version from Resilience Direct.
If you have a Resilience Direct account, these can be viewed on the Flood Forecasting Centre group page.
Currently, the FGS is uploaded to Resilience Direct:
-
when the overall flood risk is coloured yellow or above
-
some time after the FFC issue time – to get the FGS and updates as soon as they are issued, we recommend using the Hazard Manager or email options
Application Programming Interface (API) for developers
The FGS is available as Open Data through an API.
All parts of the FGS are available in a digital format, including:
-
thumbnail maps
-
trends
-
text
-
flood risk areas
-
public 5-day flood risk forecast
For more information, visit our API documentation.
Versions 1 and 2 of the API will be decommissioned after 30 June 2026. All users will need to have migrated to Version 3 on or before this date to maintain access to the API.
3. Providing feedback
We always welcome your views on the Flood Guidance Statement. Please direct any thoughts to our feedback portal.
4. Training and support
Further support to help you understand FFC services include:
-
short training videos
-
drop in webinars
-
bespoke training and materials for your organisation
Find out more about FFC training and support
5. Flood risk matrix
The FGS assesses the flood risk for each local authority area in England and Wales, for all sources of flooding.
The risk is based on a combination of likelihood and impact and presented in a 4x4 matrix.
The matrix has:
- 4 levels of impact on the horizontal axis – minimal, minor, significant, severe
- 4 levels of likelihood on the vertical axis – very low, low, medium, and high
The combination of likelihood and impact gives the overall flood risk – very low, low, medium and high.
The overall flood risk is represented by a colour:
-
green for very low
-
yellow for low
-
amber for medium
-
red for high
This is also shown in Table 1 and Figure 1.
Table 1: Flood risk matrix
| High likelihood | Very low risk (green) | Low risk (yellow) | Medium risk (amber) | High risk (red) |
| Medium likelihood | Very low risk (green) | Low risk (yellow) | Medium risk (amber) | Medium risk (amber) |
| Low likelihood | Very low risk (green) | Very low risk (green) | Low risk (yellow) | Medium risk (amber) |
| Very Low likelihood | Very low risk (green) | Very low risk (green) | Low risk (yellow) | Low risk (yellow) |
| Minimal impact | Minor impact | Significant impact | Severe impact |
Figure 1: Flood risk matrix
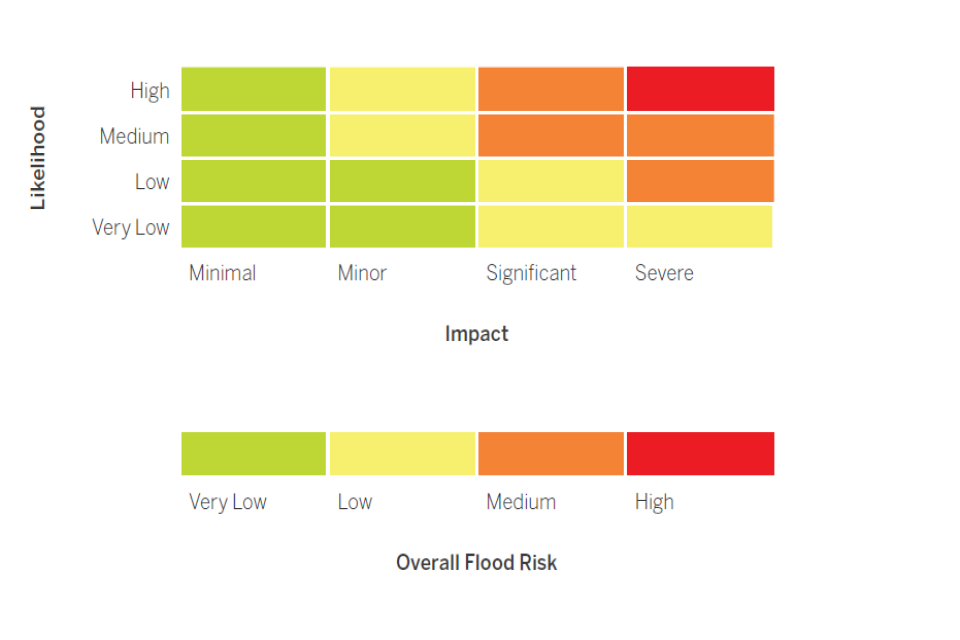
Picture of flood risk marix
5.1 Flood risk matrix guidance on impacts
Table 2 shows examples of impacts from flooding for each level in the matrix – minimal, minor, significant and severe.
Impacts are assessed at the local authority level.
Table 2: Flood impacts table
| Minimal impacts | Minor impacts | Significant impacts | Severe impacts | |
|---|---|---|---|---|
| Risk to life | Not expected | Individual risk for the more vulnerable or for those making decisions in unfamiliar situations | Danger to life from fast flowing/deep water/wave overtopping/wave inundation and physical hazards (for example, getting stuck in water) | Danger to life from fast flowing/deep water/wave overtopping/wave inundation and physical, chemical or utility hazards (for example, electrocution) |
| Communities | Isolated and localised flooding of low-lying land and roads | Localised flooding of land and roads | Some communities temporarily inaccessible due to flooded access routes | Communities cut off |
| Communities | Isolated instances of spray/wave overtopping on coastal promenades | Localised flooding (inc. waves) affecting individual properties | Flooding affecting properties and parts of individual or multiple communities | Widespread flooding affecting large numbers of properties and whole communities |
| Communities | Not expected | Local damage due to age and/or condition of structure | Damage to buildings/structures | Extensive damage to and/or collapse of buildings/structures |
| Transport | Little disruption to travel although wet roads and fords could lead to difficult driving conditions | Local and short term disruption to travel | Widespread or long duration disruption to travel. Damage to transport network (some route closures) | Widespread and long duration disruption to travel. Motorists becoming stranded. Widespread damage to transport network and widespread route closures |
| Utilities | Not expected | Localised and short term disruption to utilities and services | Disruption to utilities and services | Widespread/prolonged disruption through loss of utilities and services |
5.2 Flood risk matrix guidance on likelihood
Table 3 shows examples of how the likelihood of impacts might be described in the FGS.
Table 3: Flood likelihood table
| Very Low | Low | Medium | High | |
|---|---|---|---|---|
| Possible but not expected | Possibly / Possible | Probably / Probable | Expected | |
| Examples | Minor impacts are possible but not expected due to high river levels in… | Minor surface water flooding impacts are possible from further heavy rain in… | Significant flooding impacts due to high river levels are probable across the north east of England… | Minor surface water flooding impacts are expected from further heavy rain in… |
5.3 Using the flood risk matrix
When using the flood risk matrix, it is important to assess the combination of likelihood and impact, rather than the overall risk level and colour.
This is because different flood risk assessments can share a common flood risk level and colour.
For instance, a low overall flood risk (colour yellow) could, for example, be one of the following:
-
a medium likelihood of a minor impact (quite commonly forecast - minor impacts are probable)
-
a low likelihood of a significant impact (fairly commonly forecast - a low likelihood event, but significant flooding impacts are possible)
-
a very low likelihood of a severe impact (rarely forecast - a potentially severe event is possible but not expected – often highlighted at longer lead times to give useful early notice)
Similarly, a very low overall flood risk (colour green) could, for example, be one of the following:
-
a very low likelihood of minimal impacts (very frequently forecast)
-
a low likelihood of minor impacts (very frequently forecast – minor impacts are possible but the likelihood is too low to increase the overall flood risk)
Again, a medium overall flood risk (colour amber) could, for example, be one of the following:
- a medium likelihood of a significant impact (a more unusual forecast - significant flood impacts are probable)
- a low likelihood of a severe impact (severe impacts are possible but not expected)
High overall flood risk is only forecast when there is:
- a high likelihood of severe impacts
Each of these risk profiles might result in a different response.
6. Service features
The main features of the PDF version of the FGS are:
Issue time and date
At the top left of the front page.
Daily maps by local authority areas
At the top the front page. Maps of England and Wales show the overall flood risk from any flood source for each of the next 5 days.
RFG advisory badge
Under the daily maps. The advisory badge is added to the FGS for days where is a heightened risk of rapid flooding (summer service only). For more information please see our Rapid Flood Guidance user guide.
Trend arrow
Below each map. The trend arrow gives a national overview of the forecast trend direction for that day, compared to the previous FGS issue.
The trend can be increased, decreased or steady.
Headline
Below the maps. The headline shows:
- the overall flood risk
- the highest overall flood risk in the forecast, when there are numerous possible events
This enables users to understand rapidly the scale of any action which may be required.
Amendments in this update
An optional section when an updated FGS is issued. It provides the reason for the update, for example to:
- amend a forecast
- add extra information
- correct a mistake
Specific area of concern maps
One or more detailed maps are included as needed, even for very low risk situations when minor impacts are possible. Each flood risk area is labelled with a letter (A, B, C…..) and shows the:
- impact
- likelihood
- flood source
- duration
- position in the flood risk matrix
- any additional information
When there are sources of flooding with different risk levels within an area, this is shown in the matrix.
Assessment of flood risk
A text summary of:
- the flood risk for surface water, river, coastal/tidal and groundwater flooding
- additional useful information not shown on the area of concern maps - for example, extra geographical details or underlying causes of flood risk
The colour of the bar (green, yellow, amber, red) above each summary represents the highest risk level for that source of flooding.
6 to 10 day forecast
Description of any significant or severe flood impacts forecast in this period will be included as needed.
Next statement due
Note of when the next planned FGS is due each day. This is particularly useful in periods of heightened flood risk when multiple statements may be issued.
Contact details
Contact details to discuss the content of the FGS with a hydrometeorologist.
For detailed local discussion we advise you to use your local Environment Agency, Natural Resources Wales and Met Office Civil Contingency Advisor contacts.
Summary flood risk matrix and potential impacts
At the end of the statement. This contains, for easy reference:
-
the flood risk matrix
-
description of potential minimal, minor, significant and severe impacts
7. Forecasting glossary
The key concepts we use in preparing the FGS are:
-
risk is a combination of likelihood and impact
-
certainty and uncertainty exist in forecasting both likelihood and impact
-
confidence is used to qualify our forecasts - it is usually described as low, medium or high, taking uncertainty into account
The main definitions we use are:
Impact
The effects of flooding on people and the environment. For flooding we categorise impacts as minimal, minor, significant or severe.
Likelihood
The chance of something happening, normally in terms of very low, low, medium or high likelihood.
These are often described as possible but not expected, possible, probable and expected.
Risk
The combination of likelihood and impact.
Scenario planning
A method used to plan for the future based on agreed scenarios. For flood forecasting we use 2 scenarios:
-
best estimate scenario (what should happen) - a forecaster’s assessment of the middle range of rainfall, river or groundwater levels or coastal conditions and impacts that may occur
-
reasonable worst-case scenario (what could happen) - a forecaster’s assessment of the upper range of rainfall, river or groundwater levels or coastal conditions and impacts that may occur
The scenario presented in the FGS is the reasonable worst-case. This means events will often be less severe in reality than forecast in the FGS, especially where there is a lot of uncertainty.
The likelihood of either scenario occurring changes over time. We describe likelihood in terms of possible but not expected, possible, probable or expected.