Social Impacts
Published 1 October 2026

© Crown copyright 2026
This publication is licensed under the terms of the Open Government Licence v3.0 except where otherwise stated. To view this licence, visit nationalarchives.gov.uk/doc/open-government-licence/version/3 or write to the Information Policy Team, The National Archives, Kew, London TW9 4DU, or email: psi@nationalarchives.gov.uk.
Where we have identified any third party copyright information you will need to obtain permission from the copyright holders concerned.
This publication is available at https://www.gov.uk/government/publications/final-evaluation-of-bduk-legacy-vouchers-schemes/social-impacts
1. Summary of key findings
This report addresses the research question: “What outcomes and impacts have vouchers generated for households?”. It focuses specifically on the monetisable wellbeing benefits of the broadband upgrade rather than the qualitative benefits which were explored at length in the 2023 report.
The analysis shows that vouchers have generated substantial wellbeing benefits for households that gained access to gigabit-capable broadband. Building on the method developed in the 2023 evaluation, we estimate that households receiving a voucher experience annual wellbeing gains valued at between £2,443 and £4,199 per household in 2024 prices. Applying this to the most recent Building Digital UK(BDUK) data on the number of residential vouchers issued under Rural Gigabit Connectivity(RGC) and Gigabit Broadband Voucher Scheme(GBVS) totals at16,421, and gives gross annual wellbeing benefits of between £40.1 million and £65.1 million. Of this total, the majority is attributable to RGC, reflecting the larger number of residential vouchers issued through this scheme, with estimated annual wellbeing benefits of around £41.2 million compared with £24.0 million for GBVS.
To move from gross to net additional benefits, we apply a series of adjustments:
-
Deadweight: survey evidence suggests that a share of households would have upgraded without a voucher, reducing the estimated annual benefit to between £23.6 million and £38.6 million. Deadweight is higher for GBVS households (49%) than for RGC (36%).
-
Persistence: analysis of broadband performance shows that households in voucher areas continue to enjoy faster speeds for at least three years. Applying this assumption gives cumulative net additional wellbeing benefits of between £70.7 million and £115.7 million over a three-year period.
-
Indirect benefits: voucher projects also extended access to nearby premises. We estimate that an additional 31,200 households subscribed to gigabit-capable broadband in uncommercial areas as a result. Including these households increases the cumulative wellbeing benefits to between £217 million and £367 million over three years.
On this basis, the estimated net additional wellbeing benefits over three years are between £86 million and £142 million for GBVS, and between £131 million and £225 million for RGC.
2. Purpose of report
The 2023 evaluation looked in depth at the nature of benefits for households, including how they used their upgraded connections and the types of improvements they experienced in daily life. These findings were based on a large-scale residents survey and are not repeated here.
The main focus of this report is to update the estimates of the impact of vouchers on household wellbeing set out in the 2023 report. This draws on the latest available data from BDUK on the number of vouchers issued to households and applies additional assumptions and adjustments that were not possible in the earlier study. These include modelling the persistence of benefits for households over time, as well as capturing wider benefits for households that gained access to gigabit-capable broadband through voucher-funded projects without receiving a voucher themselves.
The aim is to provide a more robust and comprehensive estimate of the wellbeing benefits generated by the voucher schemes, expressed in monetary terms so that they can be incorporated into the overall cost–benefit analysis.
3. Methodology
In this study, we draw directly on the findings of the 2023 evaluation, which estimated the average gross wellbeing benefit per household connected through a voucher. These estimates were based on evidence of how broadband improvements affect life satisfaction and related aspects of wellbeing.
To update the analysis, we apply the 2023 estimates to the most recent vouchers data provided by BDUK. This gives us a starting point for the overall scale of wellbeing benefits. We then refine these figures through a series of adjustments to ensure the estimates reflect additional benefits that can reasonably be attributed to the programme:
-
Deadweight adjustment – reducing the estimates to account for households that would likely have upgraded their broadband without a voucher, using evidence from the residents survey.
-
Persistence adjustment – applying assumptions about how long the benefits of improved connectivity last, drawing on evidence of the longer-term effects of vouchers.
-
Indirect benefits adjustment – capturing the wider impacts for households that did not receive a voucher directly but gained access to upgraded broadband because they were covered by a voucher-funded project. This is based on BDUK data on the number of additional premises passed.
Together, these steps provide an updated estimate of the total wellbeing benefits of the voucher schemes, expressed in monetary terms and suitable for inclusion in the cost–benefit analysis.
4. Summary of the method and key findings from the 2023 study
The 2023 study established the method for estimating how improvements in broadband connectivity translate into changes in life satisfaction and reductions in loneliness. The full technical method is set out in Chapter 5 of the 2023 report; here we provide a short summary of the approach to give context for the updated modelling presented in this report.
The evaluation used Wellbeing-Adjusted Life Years (WELLBYs) as the core metric. This is an HM Treasury Green Book compliant method for estimating wellbeing improvements based on subjective assessments of life satisfaction: one WELLBY represents a one-point increase on a 0–10 life satisfaction scale for one person, sustained for one year. These improvements can then be monetised using values established in national studies.
A key limitation for the 2023 study was that we did not have baseline data on the life satisfaction of voucher recipients (i.e. before their broadband upgrade). Retrospectively asking households to recall their past wellbeing would have introduced recall bias, so it was not possible to directly measure change in life satisfaction from the resident survey.
Instead, the modelling drew on two main sources of evidence. The first was a study by Simetrica (2018), commissioned as part of the evaluation of the BDUK Superfast Broadband Programme, which estimated the impact of gaining access to superfast broadband on households’ subjective wellbeing and placed a monetary value on these improvements. This provided a set of benchmarks for the expected gains in life satisfaction that could be applied to voucher beneficiaries. The second source was the residents survey carried out for the 2023 evaluation, which offered direct insights into how households used their upgraded connections and highlighted the groups most likely to report benefits such as higher life satisfaction.
The modelling proceeded in three main steps:
1. Benchmarking life satisfaction improvements: We applied estimates from the Simetrica study that had modelled the average increase in life satisfaction associated with improved broadband access.
2. Adjusting benchmarks using survey evidence: Findings from our resident survey were used to refine these benchmarks. For example, survey evidence highlighted that younger households were more likely to report improvements in life satisfaction as a result of their upgrade than older households. These differences were used to adjust the published benchmarks so they better reflected the profile and experiences of voucher beneficiaries.
3. Converting into WELLBYs and monetised benefits: The adjusted estimates of life satisfaction improvement were converted into WELLBYs and then monetised using established Treasury guidance on the economic value of a WELLBY. This allowed us to produce an aggregate estimate of the total wellbeing benefit attributable to the schemes.
To account for the uncertainty inherent in this modelling approach, the analysis generated both a low and a high estimate of the annual WELLBY value per household. In 2019 prices, these estimates ranged from £1,984 to £3,410, which is equivalent to £2,443 to £4,199 when expressed in 2024 prices.
5. Vouchers included in report
The wellbeing analysis focuses only on residential vouchers, that is, vouchers used by households rather than by businesses. In the 2023 report, the data available at the time indicated that 24,978 households had received a voucher by 2021. However, the most recent data provided by BDUK shows that the actual number of households supported through the schemes was 16,421 with 6,617 through GBVS and 9,804 through RGC.
The main reason for this difference is that a large number of vouchers originally issued under the RGC scheme from 2020 onwards were subsequently reallocated to the UK Gigabit Voucher(UKGV) scheme, which is outside the scope of this evaluation. This reallocation explains why the number of vouchers included in the current analysis is lower than the figure reported in 2023.
It should be noted that these vouchers do not capture home-based businesses that may have received a business voucher and experienced similar personal wellbeing benefits; however, these cases cannot be reliably identified in the data and are expected to represent a relatively small share.
6. Gross effects on wellbeing
The table below shows the gross effects of vouchers on wellbeing. By gross effects, we mean the total improvement in wellbeing across all households that received a voucher, before making any adjustments for factors such as deadweight, persistence, or indirect benefits.
The estimates were calculated by applying the average annual increase in wellbeing per household, as established in the 2023 evaluation, to the latest BDUK data on the number of residential vouchers. Using this approach, we estimate that vouchers generated a gross wellbeing benefit of between £40.1 million and £65.1 million per year.
The same per-household figure has been applied to households supported through both GBVS and RGC. This is justified by evidence from the 2023 resident survey, which found that the proportion of households reporting an improvement in life satisfaction following a broadband upgrade was similar regardless of which scheme provided the voucher.
Gross increase in wellbeing per annum for BDUK vouchers (£000, 2024 prices)
| Number of residential vouchers | Gross increase in wellbeing p.a. (£000) | |||
|---|---|---|---|---|
| Lower estimate | Central estimate | Upper estimate | ||
| GBVS | 6,617 | 16,166 | 20,059 | 23,952 |
| RGC | 9,804 | 23,952 | 32,560 | 41,167 |
| Total | 16,421 | 40,117 | 52,618 | 65,119 |
| Source: GC Insight |
7. Net-additional effects on wellbeing
The next stage of the analysis is to move from these gross estimates to net additional effects. This involves adjusting the results to take account of deadweight, persistence, and indirect effects. In the sections that follow, we explain each adjustment in turn, setting out the rationale and the assumptions on which they are based.
7.1 Adjusting for deadweight
In evaluation terms, deadweight refers to the proportion of benefits that would have occurred even without the intervention. In the context of vouchers, this means considering the households that would have upgraded their broadband connection anyway, either to the same standard or to a lower speed connection at a later date. Any wellbeing benefits these households would have realised without the support of a voucher cannot be attributed to the scheme and must therefore be deducted from the gross effects.
As in the 2023 evaluation, we have based our estimates of deadweight on the findings of the residents survey, which asked households what they would have done in the absence of a voucher. We assumed that households who said they would have upgraded to the same speed represent 100% deadweight, as they would have achieved the same wellbeing gain without the voucher. For those who reported they would have upgraded at a later date or to a lower speed, we assumed 50% deadweight, on the basis that they would have realised some, but not all, of the improvement in life satisfaction.
As in the 2023 evaluation, this approach provides the most direct evidence available of counterfactual behaviour. However, we recognise its limitations. There is uncertainty in how households interpreted the survey question, and in the assumptions needed to translate their responses into quantified deadweight estimates. Some respondents may not have been fully aware of the cost or availability of equivalent services, which means that actual deadweight could be lower than reported.
The 2023 study applied a single overall deadweight rate, but in this final evaluation we distinguish between GBVS and RGC vouchers. The residents survey showed that GBVS households more likely to report that they would have upgraded without support. This makes sense, given that RGC vouchers were more rural and less likely to be connected by commercial build, meaning it would potentially be harder for them to upgrade on their own. As a result, a higher deadweight rate has been applied to GBVS households compared with RGC households. The assumptions used are shown in the table below. Based on these assumptions, we estimate deadweight at 49% for GBVS households and 36% for RGC households.
Deadweight assumptions for GBVS and RGC households
| Scheme | What would the household have done about their broadband if vouchers had not been available | Deadweight assumption | |
|---|---|---|---|
| Would have upgraded to the same speed | Would have upgraded to lower speed or at a later date | ||
| GBVS | 28.0% | 41.1% | 48.6% |
| RGC | 18.7% | 34.9% | 36.0% |
| Source: Hatch (2021): BDUK Vouchers Evaluation: Impacts and Value for Money Assessment |
After adjusting for deadweight, the estimated wellbeing benefits of vouchers reduce substantially compared with the gross figures above. For households supported through GBVS, the total annual wellbeing benefit is estimated at between £8.2 million and £12.2 million. This is equivalent to between £1,246 and £1,846 per household. For households supported through RGC, where deadweight is lower, the benefits are between £15.3 million and £26.3 million per year. This is equivalent to between £1,564 and £2,687 per household.
Taken together, this gives a total estimated annual wellbeing benefit of between £23.6 million and £38.6 million once deadweight has been accounted for, with per household figures ranging from £1,436 to £2,348. The results highlight that RGC makes the larger contribution to net wellbeing benefits, both because more households were supported through this scheme and because the deadweight rate is lower.
Estimated annual wellbeing benefits of vouchers after adjusting for deadweight (£000s)
| Deadweight | Wellbeing benefits after adjusting for deadweight (£000) | |||
|---|---|---|---|---|
| Lower estimate | Central estimate | Upper estimate | ||
| GBVS | 49% | 8,244 | 10,230 | 12,215 |
| RGC | 36% | 15,329 | 20,838 | 26,347 |
| Total | 23,574 | 31,068 | 38,562 | |
| Source: GC Insight |
7.2 Adjusting for persistence
The wellbeing estimates presented so far represent the annual effect of vouchers on households. Persistence is concerned with how many years these benefits last.
In the 2023 study, there was little direct evidence on how long the benefits of vouchers lasted. Instead, we relied on modelled assumptions using BDUK’s F-score model, which estimates the cost of connecting a premise to gigabit-capable broadband and whether it is likely to be covered by the commercial rollout. From this, we inferred how long it might have taken households to gain access without a voucher.
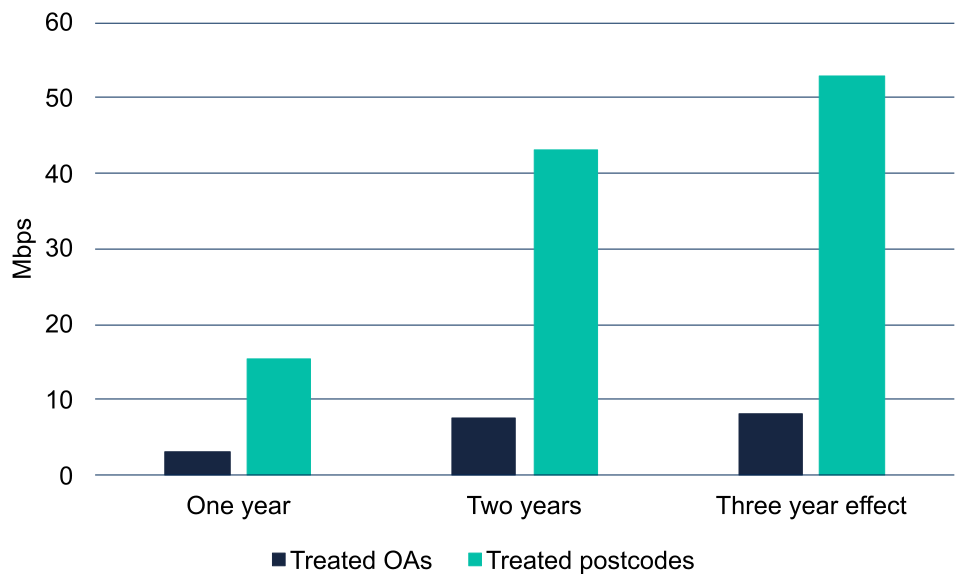
For this study, we are able to use stronger evidence. Report 1 of this final evaluation shows whether areas that received vouchers continue to experience faster average download speeds than comparator areas up to three years after the intervention. The chart below summarises this analysis by showing the weighted average additional change in download speeds across all treatment years, both at output area and postcode level. The weights were calculated by multiplying the number of treated areas in each year by the median additional change for that year, summing these across treatment years, and dividing by the total number of areas.
The chart shows a clear pattern: the additional effect of vouchers on download speeds increases over time. At postcode level, voucher-supported areas experience an additional improvement of 15.4 Megabits per second(Mbps) after one year, rising to 52 Mbps after three years. The effects are smaller at output area level, but this reflects the dilution caused by including households that were not supported by vouchers in the averages. Importantly, the results indicate that households in voucher areas continue to enjoy a speed premium, with no evidence that control areas catch up over time.
Additional change in average download speeds in voucher-supported areas, one to three years after connection
Source: analysis by GC Insight, using Belmana findings
It is important to stress that the upward trend in download speeds does not mean that the benefits of vouchers are increasing year by year. Rather, average download speeds rise across the market due to growing demand for bandwidth. What the analysis shows is that voucher-supported households continue to have faster speeds relative to similar areas, even three years after receiving support.
On this basis, we assume that the wellbeing benefits of vouchers persist for at least three years. This should be regarded as a conservative assumption: the evidence suggests that benefits could last longer, but we cannot demonstrate this with the data currently available. We also find no evidence that persistence differs between GBVS and RGC vouchers. For example, output areas supported through GBVS vouchers in 2018 and 2019 saw average download speeds continue to increase over three years, much like areas supported through RGC. We therefore apply a three-year persistence period consistently across both schemes.
There is some uncertainty in linking evidence on the persistence of faster broadband speeds directly to the persistence of wellbeing benefits. However, for the purposes of this evaluation, persistence is assumed to reflect the length of time households would otherwise have waited to receive a comparable connection through the market. The Subjective Wellbeing Benefits study that underpins the valuation of wellbeing impacts also notes that these benefits can persist “until the underlying technology becomes redundant”. This is unlikely to be the case for full fibre broadband, where usage and reliance are expected to continue over time. While longer persistence periods are sometimes applied in infrastructure appraisals, a three-year persistence period has been adopted here as a cautious and proportionate assumption. This approach maintains consistency with the 2023 evaluation and provides a reasonable basis for estimating the duration of wellbeing benefits.
The table below presents the cumulative additional wellbeing benefits of vouchers over a three-year period. For GBVS, the benefits are estimated to range from £24.7 million to £36.6 million, while for RGC they are larger, at between £46.0 million and £79.0 million. Taken together, the two schemes are estimated to have generated total wellbeing benefits of between £70.7 million and £115.7 million over three years. These figures should be regarded as safe and cautious estimates, as the evidence indicates that benefits could persist beyond three years, and these figures could be higher.
Estimated cumulative wellbeing benefits of vouchers over three years (£000s)
| Lower estimate | Central estimate | Upper estimate | |
|---|---|---|---|
| GBVS | 24,733 | 30,690 | 36,646 |
| RGC | 45,987 | 62,514 | 79,040 |
| Total | 70,721 | 93,204 | 115,686 |
| Source: GC Insight |
7.3 Indirect benefits
In addition to the direct wellbeing impacts for households that received a voucher, there are also indirect benefits. These occur when households that did not receive a voucher nonetheless gained access to an upgraded broadband connection because of their proximity to those that did. In practice, this happened mainly through voucher projects, where suppliers used groups of vouchers to extend their networks and in doing so connected additional premises in the surrounding area.
The original intention of the evaluation was to measure these effects by estimating the impact of vouchers on the availability of gigabit-capable broadband, comparing changes in coverage in voucher areas with changes in similar control areas. This would have allowed us to calculate the number of additional premises that gained access beyond those directly supported. However, as explained in Report 1, limitations in the Connected Nations data meant that this approach was not reliable.
Instead, we adopted an alternative approach using BDUK’s Expected Premises Passed (EPP) data. This is information provided by suppliers at the outset of a voucher project, setting out the number of additional premises they expected to pass by closely with their fibre on route to the voucher premise, typically within 50 metres. These passed premises are easy and cheap for the supplier to connect and can therefore be considered gigabit-ready alongside the direct voucher connections. These figures represent an expectation rather than a guarantee, so BDUK carried out further analysis to assess how many of these premises actually become ready for service. They found that, across UKGV projects delivered since 2021, only 63% of expected premises passed were ultimately ready for service, rising to 73% for premises in uncommercial areas (as defined by BDUK modelling). Although these findings relate to UKGV rather than GBVS or RGC, it was agreed with BDUK that the same percentages could reasonably be applied in this analysis.
We assume that premises classified as commercial by BDUK’s modelling, would, in most cases, have been connected through the market without voucher support. On this basis, we assume that only premises in uncommercial areas gained access as a result of voucher projects. This provides a conservative estimate of the additional benefits.
It is important to note that BDUK only holds robust EPP data for more recent projects delivered from 2021 onwards. This data is available for 380 projects, which represents around 27% of all projects where GBVS or RGC vouchers were used. Most of these projects (306) also involved UKGV vouchers alongside GBVS or RGC.
From these 380 projects, the EPP data shows that suppliers expected to deliver access to 128,900 premises in total. Of these,79,200 premises or approximately 61% were in uncommercial areas with an F-score above 0.82, meaning they were unlikely to be served by the market alone. Drawing on BDUK’s analysis, we assume that 73% of these uncommercial premises are now able to access a gigabit-capable connection, or ”ready for service”. This reduces the figure to around 57,000 additional premises.
The EPP data does not distinguish between households and business premises. To estimate the number of households, we used the share of vouchers on these projects that were taken up by residential customers, which was85%. Applying this proportion gives an estimate of 48,500 additional households that gained access to gigabit-capable broadband through voucher projects.
Steps to calculate the additional residential premises with access to gigabit capable broadband for projects where EPP data was available
| Indicator | Source or assumption | Estimate |
|---|---|---|
| Expected premises passed | EPP data | 128,858 |
| Expected premises passed in uncommercial areas | EPP data | 79,168 |
| Uncommercial premises that are ready for service | Multiplied by 0.72 based on BDUK analysis of the share of EPP that were ready for service | 57,001 |
| Residential premises in uncommercial areas that are ready for service | Multiplied by 0.85 since 85% of vouchers on projects were residential | 48,607 |
| Source: GC Insight using BDUK data |
The final step was to allocate the additional residential premises to each voucher scheme. This was done at the level of individual projects, using the proportion of vouchers from each scheme on that project. For example, if a project included three RGC vouchers and seven UKGV vouchers, then 30% of the additional premises were attributed to RGC and 70% to UKGV. Applying this method, we estimate that around 4,400 of the additional households with gigabit access can be attributed to GBVS and 20,100 households to RGC, with the remainder linked to UKGV.
Additional residential premises with access to gigabit capable broadband for projects where EPP data was available
| Scheme | Number of vouchers | EPP in uncommercial areas | Of which ready for service | Of which residential |
|---|---|---|---|---|
| GBVS | 1,821 | 7,193 | 5,179 | 4,416 |
| RGC | 7,294 | 32,664 | 23,518 | 20,055 |
| UKGV | 10,341 | 39,310 | 28,304 | 24,136 |
| Total | 19,456 | 79,168 | 57,001 | 48,607 |
| Source: GC Insight using BDUK data |
The calculation above excludes the 1,034 projects where EPP data is not available. To estimate the number of additional premises for these projects, we used data from the projects where EPP is known to calculate the average number of uncommercial premises passed per voucher. We also calculated how this varies depending on the project’s average F score, based on the average F score of the premises that received vouchers in each project.
The table below shows these averages. For example, projects with an average F score of less than 0.7 were expected to deliver just 0.7 uncommercial premises passed per voucher, while projects with an average F score above 0.9 were expected to deliver 5.4 uncommercial premises passed per voucher. These benchmarks were then applied to projects without EPP data, using the number of vouchers in each project and its average F score to estimate the likely number of additional premises passed.
Number of uncommercial premises passed per voucher for projects where EPP data was available
| Average F score of vouchers in project | Total vouchers | Uncommercial premises passed | Uncommercial premises passed per voucher |
|---|---|---|---|
| Less than 0.7 | 3,129 | 2,301 | 0.7 |
| 0.7-0.8 | 2,869 | 6,527 | 2.3 |
| 0.8-0.9 | 3,969 | 19,499 | 4.9 |
| 0.9-1 | 9,489 | 50,840 | 5.4 |
| Source: GC Insight using BDUK data |
When we apply these benchmarks to projects without EPP data, the results are shown in the table below. They indicate that the impacts are more heavily weighted towards GBVS, which accounted for a large share of the vouchers used in these projects. This is because EPP data only comes from projects after 2021, where GBVS largely delivered before this. By applying these benchmarks, we estimate that an additional 25,600 households gained access through GBVS and 15,600 households through RGC, with the remainder linked to UKGV.
Combining these figures with the estimates from projects where EPP data was available gives the following overall results:
-
30,000 households gained access through GBVS
-
35,600 gained access through RGC
-
28,600 gained access through UKGV
Additional residential premises with access to gigabit capable broadband for projects where EPP data was not available
| Number of vouchers | EPP in uncommercial areas | Of which ready for service | Of which residential | |
|---|---|---|---|---|
| GBVS | 14,809 | 41,664 | 29,998 | 25,580 |
| RGC | 5,258 | 25,340 | 18,245 | 15,558 |
| UKGV | 1,504 | 7,350 | 5,292 | 4,512 |
| Total | 21,571 | 74,353 | 53,534 | 38,545 |
| Source: GC Insight using BDUK data |
Not all of the additional households that gain access to gigabit-capable broadband will choose to subscribe to it. To estimate the proportion that do, we draw on data published by Ofcom, which reported that take-up of full-fibre broadband services stood at 35% in December 2024. Importantly, Ofcom also noted that take-up is higher in rural areas than in urban areas: 52% of rural households with access had subscribed, compared with just 32% in towns and cities.
Since all of the additional households considered in this analysis are located in uncommercial areas, we examined the share of voucher premises in these areas that were classified as rural or urban according to definitions from the Office for National Statistics, and how this varied between GBVS and RGC schemes. We then applied the relevant rural or urban take-up rates to these figures.
The results are shown in the table below. For GBVS, of the 29,997 households gaining access, around 13,100 are expected to subscribe to full-fibre broadband. For RGC, of the 35,613 households gaining access, around 18,100 are expected to subscribe. In total, this gives an estimated 31,200 households subscribing to full-fibre broadband as a result of the voucher schemes.
Estimated number of additional households subscribing to full-fibre broadband
| GBVS | RGC | Total | |
|---|---|---|---|
| Number of households with access | 29,997 | 35,613 | 65,610 |
| - of which rural | 17,388 | 33,752 | 51,140 |
| - of which urban | 12,609 | 1,861 | 14,470 |
| Take-up rural households (52%) | 9,042 | 17,551 | 26,593 |
| Take up urban households (32%) | 4,035 | 596 | 4,630 |
| Total households subscribing to full-fibre | 13,077 | 18,147 | 31,223 |
| Source: GC Insight using BDUK data |
The final step in the analysis is to apply the lower and upper estimates of gross wellbeing per household per annum to the number of households we estimate will subscribe to fibre broadband in uncommercial areas. These figures are then adjusted for deadweight and persistence.
For this stage, we assume a deadweight rate of 36% for both GBVS and RGC. This is lower than the rate applied earlier in the analysis, reflecting the fact that all of these households are in uncommercial areas, where it is less likely they would have gained access to gigabit-capable broadband without vouchers. After applying this deadweight adjustment, we then assume that the net additional wellbeing benefits persist for three years.
The cumulative results over this three-year period are shown in the table below. For GBVS, the total wellbeing benefits are estimated at between £61 million and £105 million. For RGC, the benefits are larger, at between £85 million and £146 million. Across both schemes combined, the cumulative benefits are estimated at between £146 million and £252 million.
Estimated cumulative indirect wellbeing benefits of voucher schemes over three years (£000s)
| GBVS | RGC | Total | ||
|---|---|---|---|---|
| Households subscribing to fibre broadband | 13,077 | 18,147 | 31,223 | |
| Gross wellbeing p.a. (£000) | Lower estimate | 31,946 | 44,332 | 76,279 |
| Central estimate | 43,428 | 60,265 | 103,693 | |
| Upper estimate | 54,909 | 76,198 | 131,107 | |
| Adjusted for deadweight | Lower estimate | 20,446 | 28,373 | 48,818 |
| Central estimate | 27,794 | 38,570 | 66,363 | |
| Upper estimate | 35,142 | 48,767 | 83,908 | |
| Cumulative impact over three years | Lower estimate | 61,337 | 85,118 | 146,455 |
| Central estimate | 83,381 | 115,709 | 199,090 | |
| Upper estimate | 105,425 | 146,300 | 251,725 | |
| Source: GC Insight using BDUK data |
7.4 Total wellbeing impacts
The table below shows the estimate of cumulative, net-additional wellbeing impacts of vouchers, including direct and indirect benefits. In total, we estimate the wellbeing benefits were between £217m and £367m, with a central estimate of £292m. The estimates for GBVS range from £89m to £142m, and from £131m to £225m for RGC.
The table shows that indirect benefits were substantially larger than direct benefits. This is due to the fact that the number of premises passed is far greater than the number of vouchers.
Total cumulative wellbeing impacts of voucher schemes over three years (£000s)
| GBVS | RGC | Total | ||
|---|---|---|---|---|
| Direct (voucher beneficiaries) | Lower estimate | 24,733 | 45,987 | 70,720 |
| Central estimate | 30,690 | 62,514 | 93,203 | |
| Upper estimate | 36,646 | 79,040 | 115,686 | |
| Indirect (premises passed) | Lower estimate | 61,337 | 85,118 | 146,455 |
| Central estimate | 83,381 | 115,709 | 199,090 | |
| Upper estimate | 105,425 | 146,300 | 251,725 | |
| Total | Lower estimate | 86,070 | 131,105 | 217,175 |
| Central estimate | 114,071 | 178,223 | 292,293 | |
| Upper estimate | 142,071 | 225,340 | 367,411 | |
| Source: GC Insight using BDUK data |
8. Wellbeing impacts by urban/rural area
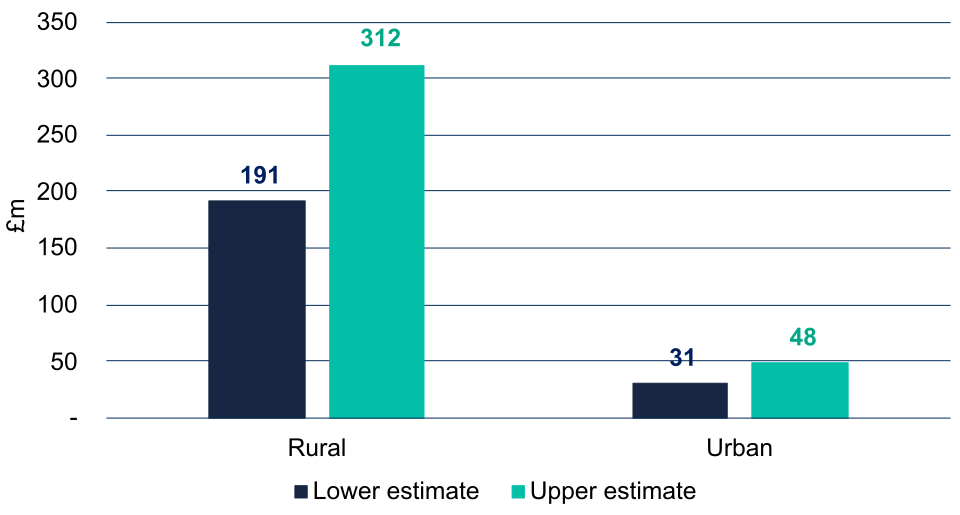
The chart shows the estimated distribution of wellbeing benefits between rural and urban areas. Because there is no urban/rural classification for premises passed, the split for indirect benefits has been estimated by assuming that premises passed fall into the same category as the vouchers used in each project. The results show a clear weighting towards rural areas, where total wellbeing benefits are estimated at £191 to £312 million, compared with £31 to £48 million in urban areas. This reflects the fact that the vast majority of uncommercial premises reached through voucher-funded projects were located in rural areas.
Wellbeing impacts of vouchers by urban/rural category
Source: GC Insight using BDUK data
9. Wellbeing impacts by deprivation decile
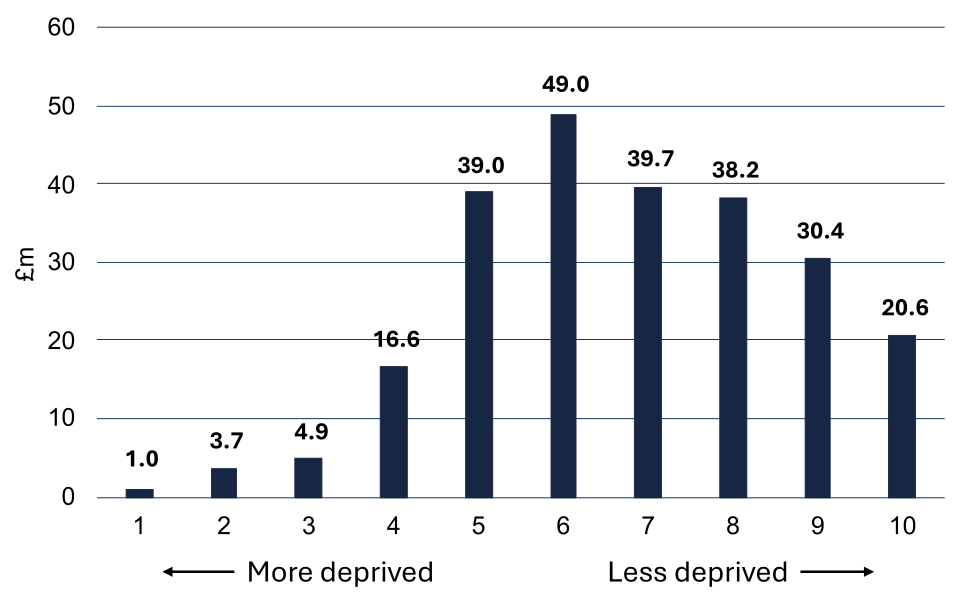
The chart shows the distribution of estimated wellbeing benefits by deprivation decile, based on the English Index of Multiple Deprivation. This analysis therefore applies only to vouchers used in England. As deprivation data is only available at Local Super Output Area(LSOA) level, output areas have been assigned the deprivation decile of their parent LSOA. In addition, because there is no deprivation classification for premises passed, we have assumed that these premises fall within the same deprivation decile as the vouchers used in each project. This is a reasonable assumption, as many premises passed will be located within the same LSOA as the voucher premises, and those in neighbouring areas are likely to experience similar levels of deprivation in most cases. The results show that wellbeing benefits are skewed towards less deprived areas, with 73% of total benefits occurring in the 50% least deprived LSOAs in England. This reflects the underlying distribution of vouchers and, in particular, the high proportion of project vouchers used in less deprived rural areas.
Wellbeing impacts of vouchers by urban/rural category (mid-point estimate)
Source: GC Insight, using BDUK data and CLG 2010 Index of Multiple Deprivation