FCO Gender Pay Gap Report 2018 to 2019
Published 23 January 2020

© Crown copyright 2020
This publication is licensed under the terms of the Open Government Licence v3.0 except where otherwise stated. To view this licence, visit nationalarchives.gov.uk/doc/open-government-licence/version/3 or write to the Information Policy Team, The National Archives, Kew, London TW9 4DU, or email: psi@nationalarchives.gov.uk.
Where we have identified any third party copyright information you will need to obtain permission from the copyright holders concerned.
This publication is available at https://www.gov.uk/government/publications/fco-gender-pay-gap-report-and-data-2018-to-2019/fco-gender-pay-gap-report-2018-to-2019-html-version
Foreign and Commonwealth Office (FCO) data on the difference in employees’ average earnings from April 2018 to March 2019.
Foreword from Permanent under Secretary, Sir Simon McDonald
The FCO is committed to equality and removing barriers to the progression of the protected groups in the workplace. As part of this effort, I am glad to publish the FCO’s gender pay gap data for 2018 to 2019. This is the third time that the FCO has published its gender pay gap figures since statutory reporting was introduced in 2017.
This year we have seen a decrease in our mean ordinary pay gap and in our mean and median bonus pay gaps. Our median gender pay gap has increased. Analysis of this year’s figures has revealed a number of contributing factors; such as the representation of women in senior grades, the impact of the competency point and the make-up of staff on 41 and 42-hour contracts. We will monitor these causes closely and review their impact.
Gender Equality is a key focus of our work across the world, and we have seen some excellent contributions this year from the Gender Equality Unit and FCO Women, supporting colleagues to weave gender equality into policy and practice. The FCO’s leadership in important initiatives such as ‘Preventing Sexual Violence in Conflict’ and the #LeaveNoGirlBehind education campaign demonstrate our commitment to equality. In 2020, we will celebrate the 25th anniversary of the Beijing Platform for Action and the 20th anniversary of UN Security Council Resolution 1325 on Women, Peace and Security.
If we are to promote gender equality effectively on the world stage, we must also practice what we preach in our own organisation. This year, FCO Women have organised a number of events led by inspiring women, as well as a series of masterclasses on such topics as resilience and imposter syndrome. Following feedback from colleagues on sexual harassment last year, FCO Women have worked with our HR Directorate to make the FCO a safer and more inclusive environment for all. The Board has committed to getting more women into top jobs and have set a new aspiration for 50% female representation in the FCO as a whole and in the Senior Management Structure by 2023.
These examples represent just a few of the fantastic steps that colleagues have taken to promote gender equality. Reports like this are vital in reminding us of what we still need to do. We must all continue to be enthusiastic ambassadors for gender equality.
What is Gender Pay Gap reporting?
In 2017, the government introduced world-leading legislation that made it statutory for organisations with 250 or more employees to report annually on their gender pay gap. Government departments are covered by the Equality Act 2010 (Specific Duties and Public Authorities) Regulations 2017, which came into force on 31 March 2017. These regulations underpin the Public Sector Equality Duty and require relevant organisations to publish their gender pay gap annually. This includes the mean and median gender pay gaps; the mean and median gender bonus pay gaps; the proportion of men and women who received bonuses; and the proportions of male and female employees in each pay quartile.
The gender pay gap shows the difference in the average pay between all men and women in a workforce. If a workforce has a particularly large gender pay gap, this can indicate that there may be a number of issues to deal with, and the individual calculations may help to identify what those issues are.
The gender pay gap is different to equal pay. A gender pay gap does not equate to the existence of an equal pay problem. It is unlawful to pay people unequally because they are a man or a woman and the FCO supports the fair treatment and reward of all staff, irrespective of gender. Equal pay deals with the differences between men and women who carry out the same jobs, similar jobs or work of equal value. It is unlawful to pay people unequally because they are a man or a woman.
Our vision is for all FCO staff to be valued and able to contribute to the best of their abilities.
What is included in this report?
This report fulfils the Department’s reporting requirements, analyses the data in more detail, contextualises the data and sets out what we are doing to close the gap in the FCO. Salary and gender balance data used for this report is based on employee pay on 31 March 2019 and bonuses paid between 1 April 2018 and 31 March 2019.
This report includes data for FCO staff, as well as staff from our Trading Fund (FCO Services) and Executive Agency (Wilton Park). FCO Services will also publish a separate report for its own staff. In line with legislation, staff are defined as the UK based staff who are on FCO payroll. The report does not include data for Local Staff (staff who are locally employed at Posts overseas) or contingent labour (the FCO does not have any directly engaged non-employees).
Headline Figures
Mean Ordinary Pay Gap 2017 to 2019
| 2017 | 2018 | 2019 | Difference 2018 to 2019 | Difference 2017 to 2019 |
|---|---|---|---|---|
| 10.6% | 8.7% | 8.3% | -0.4% | -2.3% |
Median Ordinary Pay Gap data 2017 to 2019
| 2017 | 2018 | 2019 | Difference 2018 to 2019 | Difference 2017 to 2019 |
|---|---|---|---|---|
| 11.1% | 8.2% | 10.1% | +1.9% | -1% |
Mean Bonus Pay Gap data 2017 to 2019
| 2017 | 2018 | 2019 | Difference 2018 to 2019 | Difference 2017 to 2019 |
|---|---|---|---|---|
| 16.2% | 14.6% | 9.4% | -5.2% | -6.8% |
Median Bonus Pay Gap data 2017 to 2019
| 2017 | 2018 | 2019 | Difference 2018 to 2019 | Difference 2017 to 2019 |
|---|---|---|---|---|
| 5.5% | 6.2% | 0% | -6.2% | -5.5% |
The FCO’s organisational context
The FCO and our global diplomatic network advance British interests and act for the people of the UK around the world, supporting all UK government activity overseas. 31 government partners rely on our global platform.
The FCO’s Strategic Objectives are to ‘Protect our People’, ‘Project our Global Influence’ and ‘Promote our Prosperity’. The FCO’s network represents the whole of the UK, celebrating its diversity, encapsulating 21st century UK values and interests, and committed to delivering for British nationals across the globe.
Figure 1 provides context on the FCO’s grading structure. Figure 2 illustrates the gender balance in the organisation as a whole, while Figure 3 shows the FCO’s gender balance broken down by grade.
Figure 1: FCO grading structure
| UK Civil Service Grade | Foreign Office Grade |
|---|---|
| Senior Civil Service (SCS 1 to 4) | Senior Management Structure (SMS 1 to 4) |
| Grade 6 | D7 |
| Grade | D6 |
| Senior Executive Officer | C5 |
| Higher Executive Officer | C4 |
| Executive Officer | B3 |
| Administrative Officer | A2 |
| Administrative Assistant | A1 |
Figure 2: Gender balance in the FCO
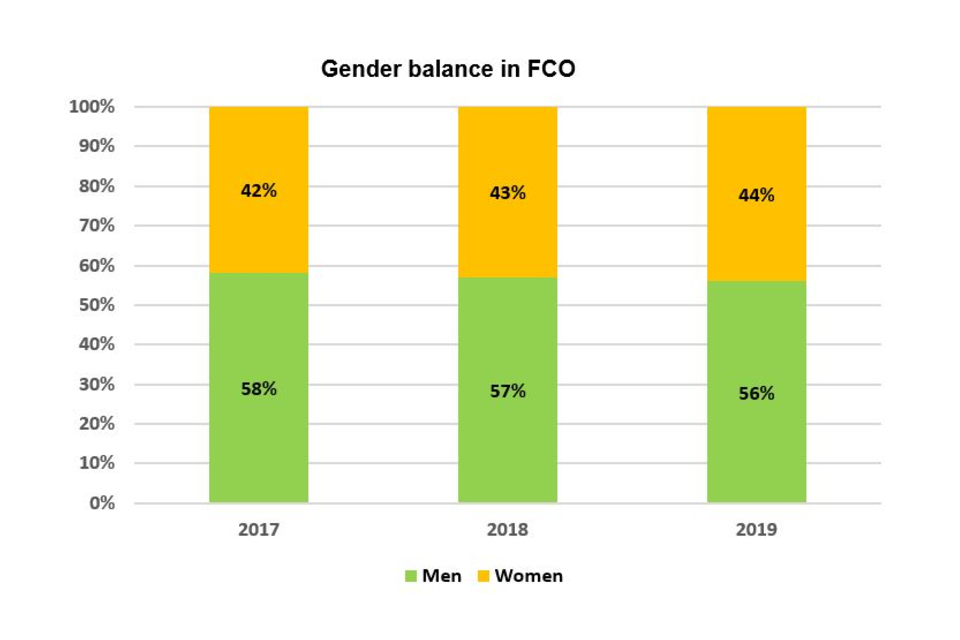
Bar chart showing the gender balance in the FCO for 2017, 2018 and 2019. See the annex for graph data.
Figure 3: Gender balance by grade
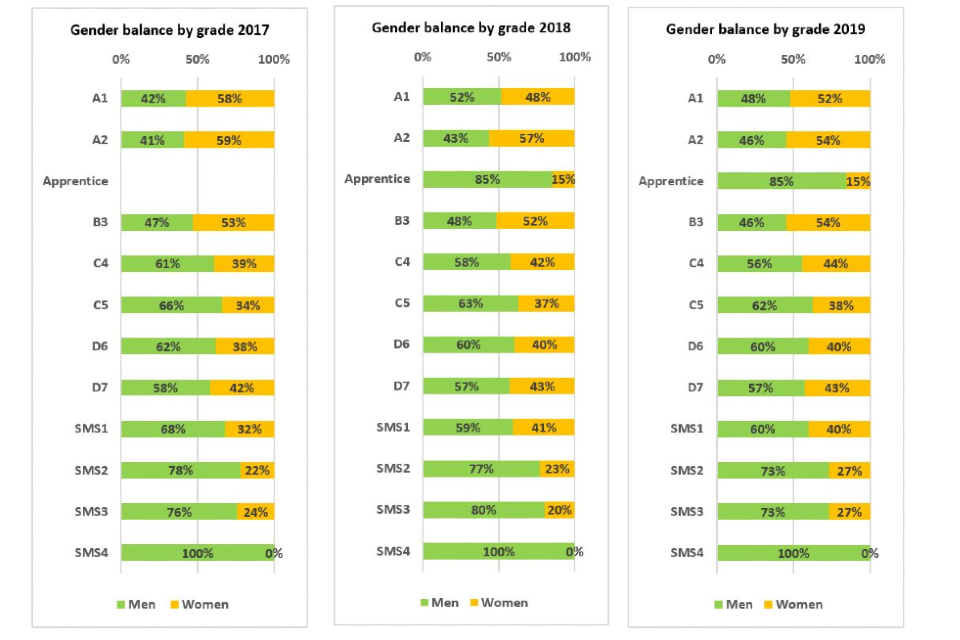
A collection of bar charts showing gender balance by grade in the FCO for 2017, 2018 and 2019. See the annex for graph data.
Mean and median ordinary pay gap data
‘Ordinary pay’ is defined as any monetary payment such as: basic pay; allowances; pay for piecework; pay for leave; shift premium pay. It does not include: overtime pay; redundancy pay; pay related to termination of employment; any repayments of authorised expenses; benefits in kind; interest-free loans. ‘Mean’ refers to the average calculated central value, while ‘median’ refers to the mid-point value.
The mean gender pay gap is the difference between the mean ‘ordinary pay’ for female and male employees. Figure 4 shows that the mean ‘ordinary pay’ in the FCO for men is 8.3% higher than for women, but that the gap is less than it was in 2017 and 2018.
Figure 4
| 2017 | 2018 | 2019 | Difference 2018 to 2019 | Difference 2017 to 2019 |
|---|---|---|---|---|
| 10.6% | 8.7% | 8.3% | -0.4% | -2.3% |
The median gender pay gap is the difference between the median ‘ordinary pay’ for female and male employees. Figure 5 shows that the median ‘ordinary pay’ in the FCO for men is 10.1% higher than for women. When comparing data across the last 3 years, there has been an overall reduction in the median ordinary pay gap, although it has widened since 2018. Analysis has not revealed a single clear cause of this increase. However, several contributing factors are explored later in the report.
Figure 5
| 2017 | 2018 | 2019 | Difference 2018 to 2019 | Difference 2017 to 2019 |
|---|---|---|---|---|
| 11.1% | 8.2% | 10.1% | +1.9% | -1% |
Mean and median bonus pay gap data
‘Bonuses’ are defined as any rewards related to: profit-sharing; productivity; performance; incentive; commission. The rewards can be made in: cash; vouchers; securities; securities options; interests in securities.
The mean gender pay gap for bonuses shows the difference between the mean ‘bonus pay’ for female and male employees. Figure 6 shows that the mean ‘bonus’ pay in the FCO for men is 9.4% higher than for women. This constitutes a 5.2% decrease in the mean bonus pay gap since 2018, and a continuing downward trend over three years.
The median gender pay gap data for bonuses shows the difference between the median ‘bonus pay’ for female and male employees. Figure 7 shows that in the FCO, the median ‘bonus’ pay for men and women is the same, resulting in a 0% median gender pay gap. The majority of FCO bonuses are awarded as part of the annual pay settlement to high performing staff. In 2018, our ‘end year’ bonus values were fixed cash amounts set by grade (i.e staff in the same grade receive the same level of bonus). The male and female staff at the mid-point, whose bonuses have been used to determine the median bonus for this year’s Gender Pay Gap report are from the same grade, hence the amount is the same for both genders. When comparing data across the 3 years the FCO has reported, there is a downward trend in the median bonus pay gap.
Figure 6
| 2017 | 2018 | 2019 | Difference 2018 to 2019 | Difference 2017 to 2019 |
|---|---|---|---|---|
| 16.2% | 14.6% | 9.4% | -5.2% | -6.8% |
Figure 7
| 2017 | 2018 | 2019 | Difference 2018 to 2019 | Difference 2017 to 2019 |
|---|---|---|---|---|
| 5.5% | 6.2% | 0% | -6.2% | -5.5% |
Figure 8 illustrates the percentage of male and female employees paid a bonus in 2018 and 2019. There has been an overall decrease in the number of employees paid a bonus in 2019, compared with 2018. This decrease affects both men (3.8% decrease) and women (5% decrease).
Figure 8: Proportion of male and female employees paid a bonus
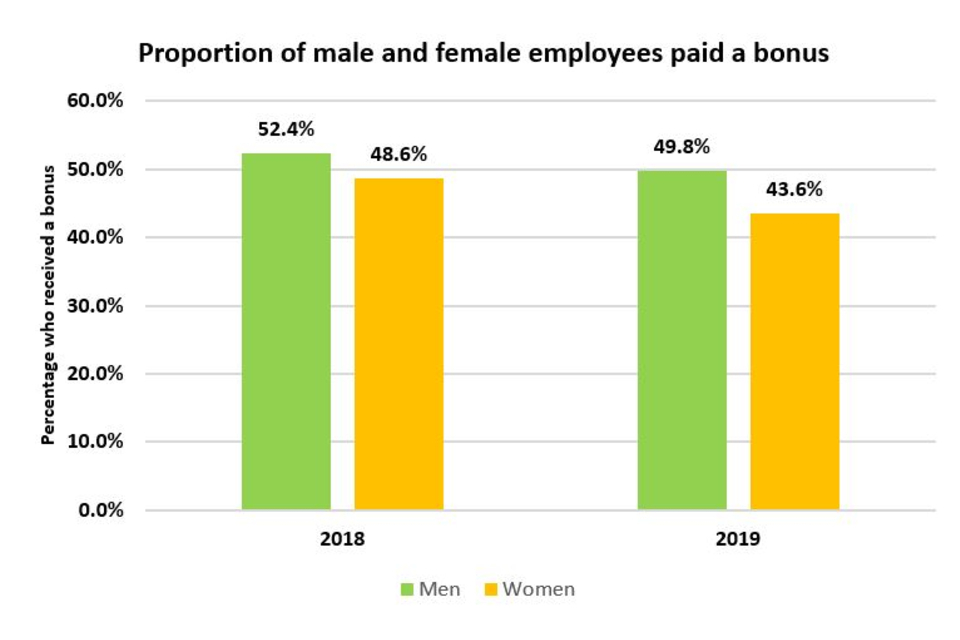
Bar chart showing the proportion of male and female employees paid a bonus in 2018 and 2019. See the annex for graph data.
Explaining the FCO’s ordinary pay gap
FCO pay policy is fully compliant with the Equality Act 2010: men and women performing work of equal value are paid within the same pay range. A range of factors, including grade and performance, determines FCO pay. The FCO regularly monitors the impact of pay practices, including by annual equal pay audits and reviews.
The FCO is making progress in reducing the gender pay gap. This year is the first year it is possible to look at general trends across a three-year reporting period. Downward trends over the 3 years in the FCO’s mean and median ordinary pay gap as well as the mean and median bonus pay gap show that there is movement in the right direction.
The FCO ordinary pay gap is influenced by a number of contributing factors. Analysis reveals that three contributing factors are:
- lower female representation at higher paid senior grades
- the FCO’s ‘competency point’ system; and
- 41 vs. 42 hour per week contracts
Lower female representation at higher paid senior grades
Across the FCO, there has been a shift of 2% in favour of women since 2018, reducing the gender imbalance overall (see Figure 2). However, higher female representation at the junior grades and lower female representation at the senior grades continues to impact on the FCO ordinary pay gap. Since 2018, data shows the following:
-
an increase in the proportion of women at grades A1 and B3, and a sustained gender imbalance at grade A2 (54.5% female). This means that more female than male staff are paid the lowest salaries
-
male than female staff are paid the higher salaries within the delegated grades (A1 to D7); and
-
a gender imbalance (albeit less than last year) remains at grades SMS2 and SMS3, meaning the highest salaries continue to be awarded disproportionately to male staff
There has been a movement towards gender balance in the organisation as a whole and by grade, with the biggest percentage shifts at SMS2 and SMS3, contributing to an overall reduction in the FCO’s mean ordinary gender pay gap. However, the gender imbalance at the most senior grades limits significant progress. While the number of staff in SMS2 and SMS3 is relatively low in comparison to the numbers in other grades, there are disproportionately more men in these higher salary grades, which impacts on the ordinary pay gap.
Figure 9 illustrates the mean gender pay gap at each grade. Where the pay gap figure is negative, the pay gap is in favour of women. While the mean ordinary gender pay gap is 8.3%, the gender pay gap at each individual grade is lower. The mean gender pay gap when broken down by grade ranges from 0.5% to 7.1% and the mean pay gap is less than 4% for almost all of the grades. However, the issue is not solely the difference in pay within grades, but rather the combination of the proportion of men and women within the grades, plus the distribution of men and women across the pay scales within those grades. The mean ordinary gender pay gap has narrowed since 2018 for a number of grades: B3, C4, D6, D7, SMS2 and SMS3. Grades C4 and D6 contain the largest number of staff and have both had a decrease in the mean gender pay gap (a 0.6% decrease at C4 and a 0.2% decrease at D6).
Figure 9: Mean ordinary pay gap by grade
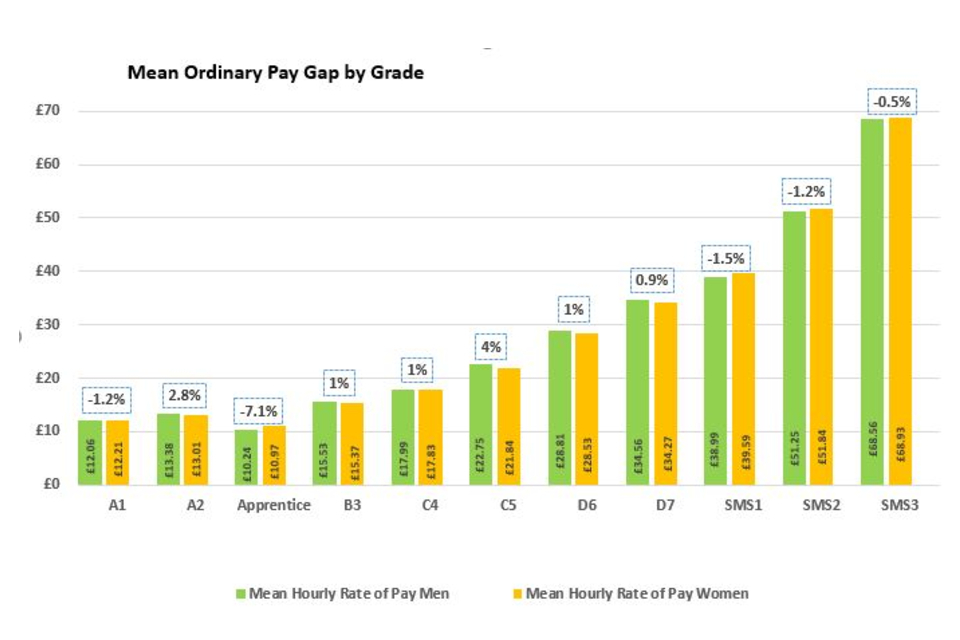
Bar chart showing the mean hourly rate of pay for men and women by grade, as well as the mean ordinary pay gap by grade. See the annex for graph data.
The graphs in Figure 10 represent the pay of all staff in the FCO, divided into four quartiles, from lowest pay (first) to highest pay (fourth). The graphs compare data from 2018 to 2019 in order to see shifts in the gender balance at each pay quartile over the last year. While there continues to be a higher concentration of women in the lower pay quartiles, compared to the upper pay quartiles, there has been an increase in female representation in the first, third and fourth quartiles in the last year. The most significant shift has been in the third quartile, with a 5.54% movement towards gender balance.
Figure 10: pay quartiles
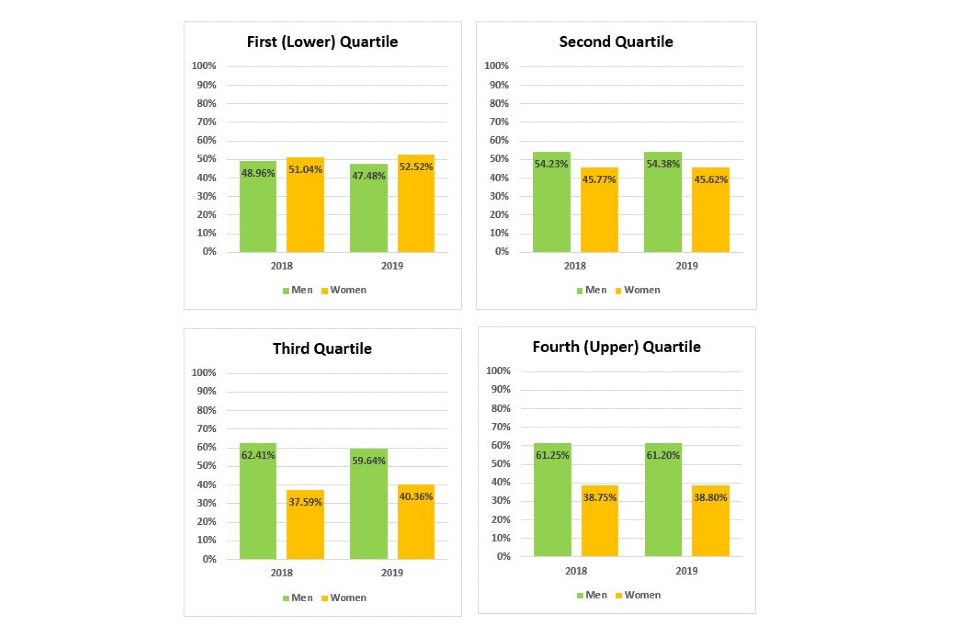
Bar charts showing the pay of all staff in the FCO divided into 4 quartiles, from lowest pay (first quartile) to highest pay (4th quartile) for 2018 and 2019. See the annex for graph data.
The impact of the ‘competency point’
In 2015, the FCO introduced competency points at grades C4 and D6. The points are set at a fixed value between the minima and maxima of the range. Staff move to the competency point value after 2 years in those grades, having demonstrated they have met the required level of competence. The FCO ordinary pay gap has increased, in part, due to the immediate impact of this system. Although more women than men are joining the FCO in the C4 grade, increasing the female representation at this grade, they will not be eligible for the competency point pay increase for two years. Men make up a larger proportion of those on salaries at or above the competency point, having served 2+ years at the grade. There is the same pattern at D6. The result is that the male median salary is higher in comparison to the female median salary.
With time, the increase in female officers at C4 should result in a levelling out of the median pay gap, as they move to the competency point. However, more needs to be done at D6 where a sustained gender representation imbalance will continue to result in a gender pay gap, even once more women achieve competency points.
41 vs. 42 hour per week contracts
Full-time conditioned hours for staff in London employed on or before 31 December 2013 are 41 hours gross (including five hours paid meal breaks) per week. Full-time conditioned hours for staff in Hanslope Park, Milton Keynes, or elsewhere in the United Kingdom outside of London, employed on or after 1 January 2014, are 42 hours gross (including five hours paid meal breaks) per week. This change followed the introduction of modernised terms and conditions across the Civil Service. Consequently, those staff members on 41-hour contracts earn a higher average hourly rate than those on a 42 hours contract. ‘National’ officers (staff working outside of London but still in UK) are employed on 42-hour gross contracts, as opposed to 41 hours gross contracts. Figure 11 shows the gender distribution across the grades for ‘National’ staff (42 hours gross contracts).
Figure 11: National staff by grade and gender
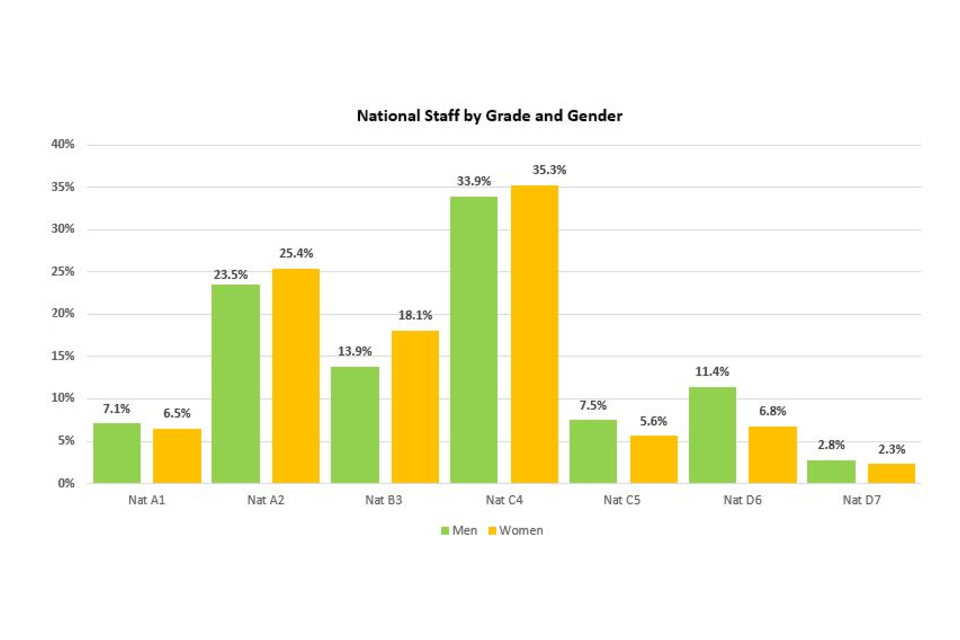
Bar chart showing the gender distribution across grades for ‘National’ staff. See the annex for graph data.
As Figure 11 illustrates, there is higher proportion of women on 42-hour contracts in the populous lower grades (A2, B3 and C4), and a higher proportion of men at C5, D6 and D7. This is a contributing factor to the median gender pay gap.
Many officers who work in London on 41 hours gross contracts are also entitled to London Location Allowance (LLA) of £5,000 per annum pro rata. OLLA (Outer London Location Allowance) is available to staff in Milton Keynes or Hanslope Park at a rate of £1,750 per annum. This produces a ‘double positive’ result, as officers on 41 hour contracts have a higher hourly average salary plus and LLA. Figure 12 shows staff on 41 hours gross contracts, many of whom receive LLA, broken down by grade.
The numbers of staff are highest at grades C4 and D6. When looking at the grade breakdown, there is a significantly higher proportion of men at these grades. This contributes to the gender pay gap as more men than women are in the position of having higher average hourly salaries. Regional data is relevant in understanding the gender pay gap when we consider the gender split regionally.
Figure 12: London officers on 41 hours gross contracts
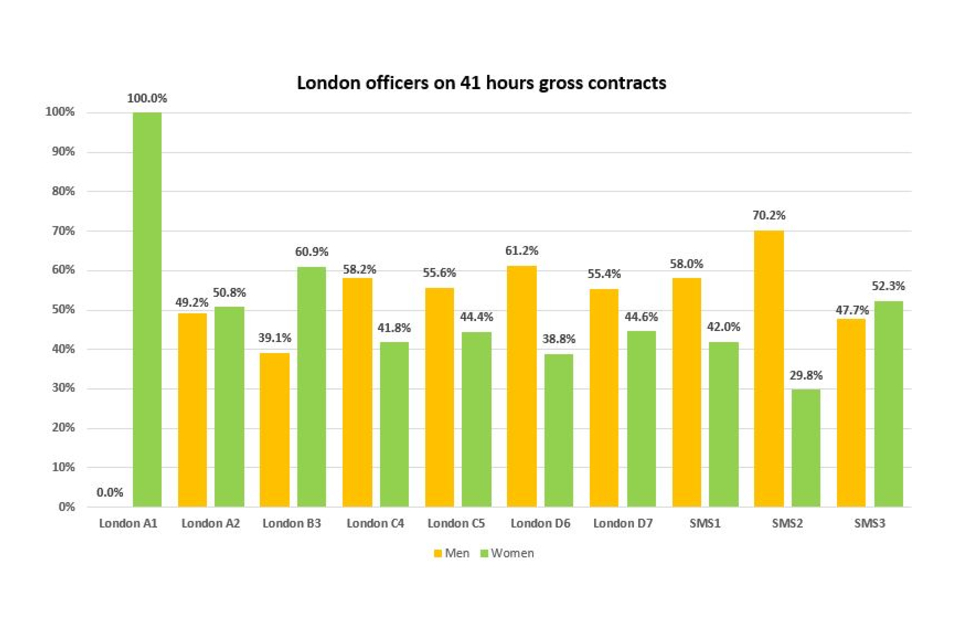
Bar chart showing the percentage of male and female London officers on 41 hours gross contracts by grade. See the annex for graph data.
Explaining the FCO’s bonus pay gap
In 2018 to 2019, the FCO paid bonuses to 28.25% of its Senior Civil Service (SCS)/Senior Management Structure (SMS) staff and to 48.5% of its staff in the Delegated Grades (A1-D7). The majority of FCO bonuses are paid as part of the annual pay settlement to high performing staff. In 2018, ‘end year’ bonus values were fixed cash amounts set by grade (i.e. staff in the same grade receive the same level of bonus). Individual Directorates also run in-year recognition schemes that award small bonuses for specific examples of exceptional performance, which contribute towards Directorate/Post objectives and/or to the corporate good. 2019 data shows that there has been an overall decrease in the number of employees awarded a bonus, compared with 2018. This decrease affects both men (2.6% decrease) and women (5% decrease).
Figure 13 shows the percentage proportion of men and women awarded a bonus by grade in 2018 to 2019.
Figure 13: Bonus gender balance by grade
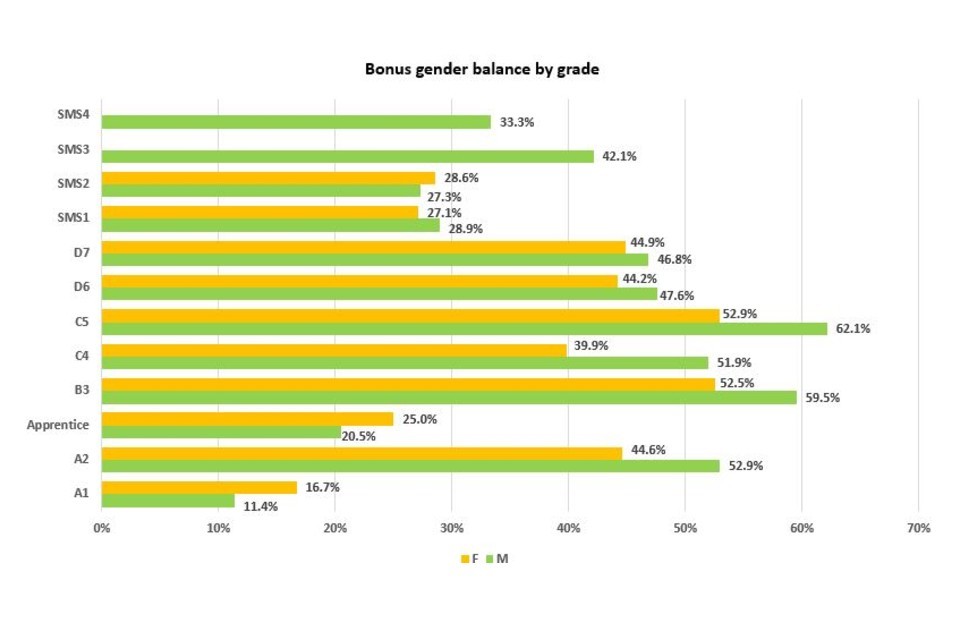
Bar chart showing the percentage of men and women awarded a bonus by grade in 2018 to 2019. See the annex for graph data.
The bonus data reveals that proportionately more men were awarded bonuses than women at all grades, apart from A1, Apprentices and SMS 2. There is a greater volume of staff at grades C4, and D6, where we see a balance towards men, contributing to the bonus gender pay gap.
The value of bonuses also has an impact on the bonus pay gap. Figure 14 shows ‘London’ Staff bonuses larger than £500, broken down by grade.
Figure 14: Bonuses greater than £500 by grade (‘London’ staff)
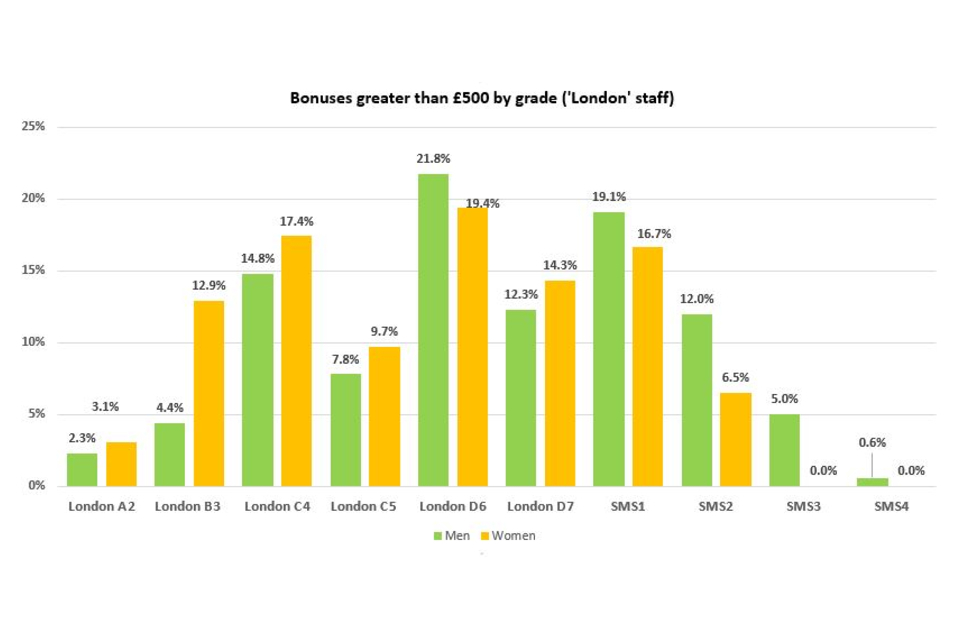
Bar chart showing the percentage of men and women awarded a bonus greater than £500 by grade (London staff). See the annex for graph data.
With the exception of D7, men are proportionately more likely to receive a bonus in the higher grades, and women are proportionately more likely to receive a bonus in the lower grades. Given that the value of bonuses is positively correlated to seniority; men receive proportionately higher bonuses than women. In total, male ‘London’ staff receive 61.5% of bonuses valued above £500, compared with women, who receive 38.5%. The greater volume of staff at grade D6 contributes to the bonus pay gap.
Bonus data for ‘National’ staff shows a discrepancy. Figure 15 shows a significant imbalance at D6, whereby men are proportionately more likely than women to receive a bonus valued above £500.
Figure 15: Bonuses greater than £500 by grade (‘National’ staff)
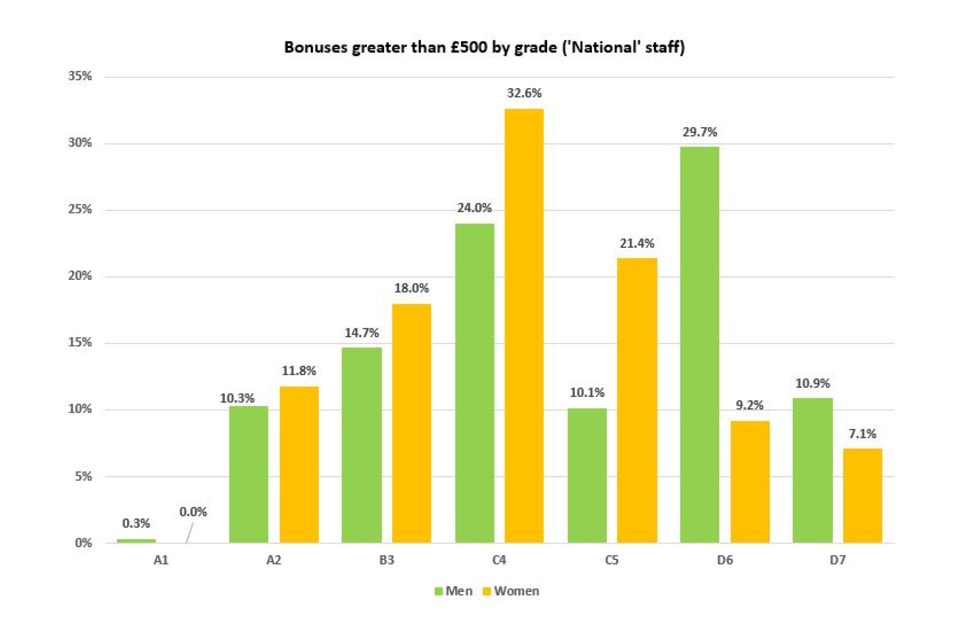
Bar chart showing the percentage of men and women awarded a bonus greater than £500 by grade (National staff). See the annex for graph data.
Taking action
The Civil Service Diversity and Inclusion Strategy sets out how the Civil Service will become the most inclusive employer in the UK by 2020. The strategy builds on the significant advances already made. At its core are the twin priorities:
- to continue to increase the representation of currently under-represented groups at all levels across the Civil Service
- to focus on inclusion to build our culture and reputation as a place that attracts, develops, retains and fully engages all the diverse talent across our organisation
The FCO Board is similarly committed to promoting a diverse talent pipeline: levelling the playing field by providing further support for talent from under-represented groups including women. To achieve this, the Board is working with FCO Women, a staff association that supports female employees throughout every stage of their career, to enable every woman to reach the peak of her potential. FCO Women offers mentoring and developmental opportunities, organises events and speakers, and is active on policy development. The FCO also works closely with its Board Champions for diversity and inclusion, and tackling bullying, harassment and discrimination.
Upon publication of the first FCO Gender Pay Gap Report, the FCO’s Permanent under Secretary (PUS) agreed a 10-Point Gender Plan, developed in consultation with FCO Women, with actions aimed at supporting women to progress through the organisation.
Progress made:
-
the FCO now has 31% female Heads of Mission, Post and Governors (up from 30% in 2018)
-
67.9% of Direct Appointment Scheme recruits (Higher Executive Officers and Executive Officers) in 2018-19 were female, compared to 67% in 2017 to 2018
-
65 Higher Executive Officers were recruited in 2018 to 2019 via the Cabinet Office-run Policy Professional external recruitment campaign (not run in the FCO the previous year). Of these recruits, 52.3% were female
-
the FCO has recruited 77 Administration Officers in 2018 to 2019, of whom 56.4% were female, compared to 31% in 2017 to 2018
-
women were well-represented, significantly above the FCO target of 50%, on both the Senior Leaders Scheme (SLS) and the Future Leaders Scheme (FLS), with female representation in the FLS at 78% (up from 57% the previous year)
-
we have increased female representation in our 2018-19 internship cohort, from 52% in 2017 to 2018 to 53% in 2018 to 2019
-
the FCO developed a targeted action plan for tackling sexual harassment in the organisation, following feedback gathered from over 40 focus groups in 38 locations around the world
-
following the election of a new chair and committee, FCO Women have focused on priorities including recruiting more men as allies and creating an inclusive culture that helps all women, regardless or ethnic heritage, sexual orientation and other barriers
-
FCO Women have run a mentor-matching service for members, and have run multiple masterclasses to support members’ informal learning
-
the FCO continues to promote international action on gender equality through the actions of our dedicated Gender Equality Unit
-
we celebrated the launch of the FCO Menopause Community
Future actions:
FCO-wide:
-
in order to align with a new broader D&I strategy for the coming years, FCO Women and HRD are collaborating on the design of a refreshed gender plan. The plan will focus on 3 main areas: FCO culture; gender parity, and ensuring women fulfil their potential
-
as part of a broader inclusion strategy, set new revised FCO-wide targets for female representation
-
continue to provide diversity analysis of each promotion round and take any necessary remedial action
-
work closely to analyse the talent pipeline and advise on actions accordingly
-
continue to support talented women through the Civil Service talent schemes and monitor the diversity of these schemes
-
evaluate the talent pipeline and data on women leaving the organisation and analyse for drivers
-
develop new proposals for how performance and pay are linked
-
undertake detailed analysis to assess the impact of the competency point on the gender pay gap
-
continue to advertise all jobs as flexible by default and provide a wide variety of options for flexible working, including compressed hours, flexible hours, job shares at all grades, remote working in the UK or from overseas posts
-
continue to enable eligible parents to benefit from Shared Parental Leave and Shared Parental Pay as statutory entitlements
-
improve our understanding of why women leave the organisation and support leavers to return
SMS-specific:
-
as part of a broader inclusion strategy, set new revised SMS diversity ambitions which align with FCO-wide aspirations for female representation
-
improve transparency around senior appointments by publishing statistics where appropriate on diversity of applications, shortlists and appointments with trend data and intersectionality
-
actively work with hiring managers to ensure that the fields for all jobs at SMS are as wide and diverse as possible
-
create a shared long-term action plan in consultation with staff to take us further and faster towards our SMS diversity ambitions
Pay policy
In December 2016, the FCO Board agreed its Workforce Strategy, which provides the strategic framework and direction for the FCO workforce between 2016 and 2020. Its Pay and Benefits Principles emphasise the FCO’s commitment to offering competitive reward packages that enable the FCO to recruit, retain and motivate staff with the skills and qualities that will continue to be needed to deliver the FCO’s business objectives. Ensuring equal pay for equal work is one of these principles.
As part of the FCO’s governance process for making changes to pay policy, any potential effects for the gender pay gap and equal pay risks are taken into account. Specific activities which are helping to reduce the FCO’s gender pay gap are:
-
in April 2018 the FCO implemented the first stage of a new pay structure for the delegated grades (A1 to D7), the second stage was implemented in August 2019. One of the aims of the new structure is to shorten FCO pay ranges, which will reduce the variation in salaries by grade and which will in turn improve the FCO’s mean and median gender pay gaps. We will review whether the new structure has had the expected positive impact in October 2019
-
a Senior Pay Committee was created in April 2017 to improve remuneration governance for SCS and SMS staff. One of its first decisions was to change the approach for SCS/SMS bonuses so that they are the same value regardless of grade. This remains current practice and means that all staff who are awarded a bonus receive the same amount irrespective of gender
-
the FCO is reviewing its approach to performance management, which may also mean a change to assessment markings and how the FCO awards performance bonuses. Once the approach is finalised we will develop new proposals for how performance and pay are linked. These proposals will be subject to an equality impact assessment to ensure that they do not adversely impact on any particular groups of staff
Annex: data shown in graphs
Figure 2
| 2017 | 2018 | 2019 | |
|---|---|---|---|
| Men | 58% | 57% | 56% |
| Women | 42% | 43% | 44% |
Figure 3
2017
| Grade | Men | Women |
|---|---|---|
| A1 | 42% | 58% |
| A2 | 41% | 59% |
| Apprentice | Apprentice data is not available for 2017 | |
| B3 | 47 % | 53% |
| C4 | 61% | 39% |
| C5 | 66% | 34% |
| D6 | 62% | 38% |
| D7 | 58% | 42% |
| SMS1 | 68% | 32% |
| SMS2 | 78% | 22% |
| SMS3 | 76% | 24% |
| SMS4 | 100% | 0% |
2018
| Grade | Men | Women |
|---|---|---|
| A1 | 52% | 48% |
| A2 | 43% | 57% |
| Apprentice | 85% | 15% |
| B3 | 48 % | 52% |
| C4 | 58% | 42% |
| C5 | 63% | 37% |
| D6 | 60% | 40% |
| D7 | 57% | 43% |
| SMS1 | 59% | 41% |
| SMS2 | 77% | 23% |
| SMS3 | 70% | 20% |
| SMS4 | 100% | 0% |
2019
| Grade | Men | Women |
|---|---|---|
| A1 | 48% | 51% |
| A2 | 46% | 54% |
| Apprentice | 85% | 15% |
| B3 | 46 % | 54% |
| C4 | 56% | 44% |
| C5 | 62% | 38% |
| D6 | 60% | 40% |
| D7 | 57% | 43% |
| SMS1 | 60% | 40% |
| SMS2 | 73% | 27% |
| SMS3 | 73% | 27% |
| SMS4 | 100% | 0% |
Figure 8
2018
| Men | 52.4% |
|---|---|
| Women | 48.6% |
2019
| Men | 49.8% |
|---|---|
| Women | 43.6% |
Figure 9
| Grade | Mean hourly rate of pay for men | Mean hourly rate of pay for women | Mean ordinary pay gap |
|---|---|---|---|
| A1 | £12.06 | £12.21 | -1.2% |
| A2 | £13.38 | £13.01 | 2.8% |
| Apprentice | £10.24 | £10.97 | -7.1% |
| B3 | £15.53 | £15.37 | 1.0% |
| C4 | £17.99 | £17.83 | 1.0% |
| C5 | £22.75 | £21.84 | 4.0% |
| D6 | £28.81 | £28.53 | 1.0% |
| D7 | £34.56 | £34.27 | 0.9% |
| SMS1 | £38.99 | £39.59 | -1.5% |
| SMS2 | £51.25 | £51.84 | -1.2% |
| SMS3 | £68.56 | £68.93 | -0.5% |
Figure 10
First (lower) quartile
| 2018 | 2019 | |
|---|---|---|
| Men | 48.96% | 47.48% |
| Women | 51.04% | 52.52% |
Second quartile
| 2018 | 2019 | |
|---|---|---|
| Men | 54.23% | 54.38% |
| Women | 45.77% | 45.62% |
Third quartile
| 2018 | 2019 | |
|---|---|---|
| Men | 62.41% | 61.20% |
| Women | 37.59% | 40.36% |
Fourth (upper) quartile
| 2018 | 2019 | |
|---|---|---|
| Men | 61.25% | 61.20% |
| Women | 38.75% | 38.80% |
Figure 11
| Grade | Men | Women |
|---|---|---|
| Nat A1 | 7.1% | 6.1% |
| Nat A2 | 23.5% | 25.4% |
| Nat B3 | 13.9% | 18.1% |
| Nat C4 | 33.9% | 35.3% |
| Nat C5 | 7.5% | 5.6% |
| Nat D6 | 11.4% | 6.8% |
| Nat D7 | 2.8% | 2.3% |
Figure 12
| Grade | Men | Women |
|---|---|---|
| A1 | 0% | 100% |
| A2 | 49.2% | 50.8% |
| B3 | 39 % | 60.9% |
| C4 | 58.2% | 41.8% |
| C5 | 55/6% | 44.4% |
| D6 | 61.2% | 38.8% |
| D7 | 55.4% | 44.6% |
| SMS1 | 58% | 42% |
| SMS2 | 70.2% | 29.8% |
| SMS3 | 47.7% | 52.3% |
Figure 13
| Grade | Men | Women |
|---|---|---|
| A1 | 11.4% | 16.7% |
| A2 | 52.9% | 44.6% |
| Apprentice | 20.5% | 25% |
| B3 | 59.5% | 52.5% |
| C4 | 51.9% | 39.9% |
| C5 | 62.1% | 52.9% |
| D6 | 47.6% | 44.2% |
| D7 | 46.8% | 44.9% |
| SMS1 | 28.9% | 27.1% |
| SMS2 | 27.3% | 28.6% |
| SMS3 | 42.1% | 0% |
| SMS4 | 33.3% | 0% |
Figure 14
| Grade | Men | Women |
|---|---|---|
| A2 | 2.3% | 3.1% |
| B3 | 4.4% | 12.94% |
| C4 | 14.8% | 17.4% |
| C5 | 7.8% | 9.7% |
| D6 | 21.8% | 19.4% |
| D7 | 12.3% | 14.3% |
| SMS1 | 19.1% | 16.7% |
| SMS2 | 12.0% | 6.5% |
| SMS3 | 5% | 0% |
| SMS4 | 0.6% | 0% |
Figure 15
| Grade | Men | Women |
|---|---|---|
| A1 | 0.3% | 0% |
| A2 | 0.3% | 1.8% |
| B3 | 14.7% | 18% |
| C4 | 24% | 32.4% |
| C5 | 62.1% | 21.4% |
| D6 | 29.7% | 9.2% |
| D7 | 10.9% | 7.1% |