Investigating factors associated with loneliness amongst adults in England during the pandemic
Published 16 December 2022

© Crown copyright 2022
This publication is licensed under the terms of the Open Government Licence v3.0 except where otherwise stated. To view this licence, visit nationalarchives.gov.uk/doc/open-government-licence/version/3 or write to the Information Policy Team, The National Archives, Kew, London TW9 4DU, or email: psi@nationalarchives.gov.uk.
Where we have identified any third party copyright information you will need to obtain permission from the copyright holders concerned.
This publication is available at https://www.gov.uk/government/publications/factors-associated-with-loneliness-in-adults-in-england-during-the-pandemic/investigating-factors-associated-with-loneliness-amongst-adults-in-england-during-the-pandemic
Executive summary
Overview
This report explores loneliness in people aged 16 and over in England during the pandemic (which began in March 2020) using data from the Community Life Survey (CLS) 2020-2021 and Understanding Society Wave 11 (2019-2021). It investigates the following:
-
the predictors of loneliness during the pandemic
-
the risk of chronic loneliness[footnote 1] for people with protected characteristics[footnote 2] during the pandemic
-
whether any factors or experiences predicted resilience to chronic loneliness during the pandemic
Interpreting findings
The two surveys used in this analysis – the Community Life Survey and Understanding Society - measure loneliness in slightly different ways. As such the estimates of people who are chronically lonely vary - 6% in the CLS and 9% in Understanding Society. Chronic loneliness is defined in the CLS as those who feel lonely “Often/Always”, and in Understanding Society as those who feel lonely “Often” (the word “always” does not appear in response options). The Department for Digital, Culture, Media & Sport (DCMS) uses the CLS to estimate the prevalence of loneliness. However, the two surveys have different benefits, so both are drawn on here.
We also looked at loneliness measured indirectly (with a 3-item measure) by using a series of questions about companionship, isolation, and feeling left out. Throughout this report, we use ‘chronic loneliness’ to refer to people who have been asked if they are lonely directly (i.e., using the single-item measure), and who have responded with “Often” or “Often/Always”. Where loneliness is measured indirectly, this will be clearly stated.
Findings
-
Pre-pandemic predictors of chronic loneliness remained predictors of chronic loneliness during the pandemic.
-
Similar to research before the pandemic, women, younger people, people with a disability or long-term condition and those who did not live with a partner were significantly more likely to be chronically lonely. We identified the same predictors using the indirect measure of loneliness.
-
Several factors predicted chronic loneliness across the entire life course, which was consistent with findings from pre-pandemic data. These were gender, age, relationship status and disability status. However, in contrast to previous data, these models revealed that having caring responsibilities increased young people’s odds of chronic loneliness; this did not apply to other age groups.
-
Findings on those with protected characteristics largely reflected continuity during the pandemic rather than change. As identified before the pandemic, the risk of chronic loneliness was higher for gay and lesbian, and bisexual people than for heterosexual people.
-
-
New predictors of loneliness during the pandemic - This report identifies some new predictors of loneliness:
-
During the pandemic, internet usage predicted loneliness measured indirectly. People who used the internet less than once a month were 2.5 times more likely to experience loneliness than people who used it every day.
-
Unlike previous time periods, household size predicted chronic loneliness during the pandemic, with those living in households of three people or more being less likely to report chronic loneliness.
-
Using the indirect measure of loneliness, we found that the risk was also higher for Black people than White[footnote 3] people during the pandemic.
-
-
The impact of relationship closeness[footnote 4] - This analysis was also able to estimate the impact of relationship closeness on the odds of chronic loneliness due to newly available data. It showed that close relationships played a significant role in reducing the odds of being chronically lonely during the pandemic.
-
The impact of the pandemic – in order to understand what makes people less susceptible to loneliness, we explored whether pandemic related factors predicted resilience to chronic loneliness. Most pandemic-specific experiences – such as being a key worker, furloughed, hospitalised with COVID-19 and working from home - had no impact on the odds of being resilient[footnote 5] to chronic loneliness. The sole exception to this was shielding: those who had ever been invited to shield were significantly less likely to exhibit resilience to chronic loneliness.
- The predictors of resilience to chronic loneliness during the pandemic largely reflected findings from research on the pre-pandemic period: men, non-disabled people, older people, and those living in a couple were more likely to exhibit resilience to chronic loneliness.
Implications
The overall finding that loneliness levels and predictors were largely unaffected by the pandemic supports government’s definition of loneliness (A connected society; a strategy for tackling loneliness) and challenges the idea that loneliness can be understood simply in terms of the number of social interactions people have. Our findings highlight a need for further research into the impact of the pandemic on Black people to explain a new-found divergence between loneliness measured directly and indirectly during the pandemic. This report also emphasises the importance of close relationships, household members and internet usage on the odds of being lonely, establishing interesting trends that can be monitored further post-pandemic.
Introduction
Approximately 6% of adults in England reported feeling lonely “Often/Always” in previous analysis of CLS survey data conducted in 2018/2019 and 2019/2020. Analysis of the 2020-2021 CLS period found that loneliness prevalence was also 6% during the pandemic period. Taken together, these findings raise the question how the pandemic changed the patterns of loneliness, if at all.
The three questions listed below are the focus of this report and are used to structure the report. Different data sources and analytical methods are employed for each question, and are clearly highlighted throughout.
Research questions:
-
What were the risk factors for loneliness[footnote 6] during the COVID-19 pandemic and how did they change during this period?
-
What was the risk of chronic loneliness for people with protected characteristics during the pandemic?
-
What experiences and factors predicted resilience to chronic loneliness during key time points of the pandemic (May 2020, November 2020 and March 2021)?
This analysis was carried out by Bea Taylor, Isabel Taylor, Kathryn Yates, Cate Standing-Tattersall and Sokratis Dinos.
Overview of existing research
DCMS has published a recent evidence review on previous research into loneliness in England (DCMS, 2022). The review builds upon recommendations set out in 2018 which critically assessed existing literature on this topic and identified evidence gaps on potential drivers of loneliness. Due to timing, the review contained limited detail on data from the time of the COVID-19 pandemic, with the vast majority of existing research exploring pre-pandemic loneliness.
This evidence review from DCMS illustrates that drivers of pre-pandemic loneliness have been extensively examined. This includes previous analysis of the CLS, which highlighted that those at a greater risk of experiencing loneliness are:
-
young adults (aged 16-24 years old)
-
women
-
single or widowed people
-
people with a limiting health condition (ONS, 2018)
Recent research commissioned by DCMS and conducted by NatCen, which investigated factors associated with loneliness specifically in England, corroborated the above results, finding that respondents belonging to the aforementioned subgroups were at a greater risk of loneliness. Additional groups that were identified as being at risk included:
-
gay and lesbian people
-
bisexual people
-
people who were out of work
-
those who had recently moved to their current address
-
those with low wellbeing or high anxiety
Longitudinal analysis of the CLS found that almost all of these predictors of loneliness were consistent over time, with few factors found to predict the alleviation of loneliness in the short-term. It is therefore of interest to investigate whether and how these predictors function when analysing data collected during the COVID-19 pandemic.
Findings from the Opinion and Lifestyle Survey, published by the ONS in 2021 using data collected during the pandemic between October 2020 and February 2021 indicate an increase in loneliness levels during the pandemic. While 5% of adults in Britain described themselves as “Often” or “Always” lonely between April and May 2020, the 2021 publication saw this proportion rise to 7.2% of the adult population.[footnote 7] In addition, 38.6% of those who stated that their wellbeing had been affected by the pandemic in the last seven days said that it was because they were lonely, which the ONS referred to as “lockdown loneliness”.
The evaluation of the Covid-19 Loneliness Fund highlighted that loneliness may have been exacerbated as a consequence of the pandemic, at least for some groups. So far, however, there has been limited evidence to support a direct causal link and to describe its mechanism. Qualter et al. (2021) hypothesised that loneliness was likely to be a significant consequence of the pandemic, as their longitudinal study indicated that increased social isolation and mental distress were likely to be prevalent during periods of lockdown, which could contribute to feelings of loneliness. Additionally, Holmes et al. (2020) conducted a survey of adults in April 2020, during the first lockdown in England. When asked about concerns related to the social consequences of lockdown measures, respondents raised loneliness as a potential cause for concern, as well as fears of people feeling trapped or being unable to access support for managing loneliness.
While these studies emphasise the importance of research into experiences of loneliness, there is limited evidence on how the pandemic impacted feelings of loneliness beyond hypotheses building upon pre-pandemic data. This analysis seeks to address this evidence gap, while considering the key predictors and significant factors identified from analysis conducted using pre-pandemic data.
Data and methods
Community Life Survey
The Community Life Survey (CLS) is a nationally representative household survey of adults aged 16 or over in England. The survey is conducted annually and collects data from a new, cross-sectional sample of the adult population each year. The CLS collects information on topics relating to wellbeing, community engagement, volunteering and social cohesion. This includes data on respondents’ level of loneliness using the ONS’s recommended direct and indirect measures. Further details of these measures are outlined below.
The 2020-2021 wave of the CLS was conducted during the COVID-19 pandemic, with fieldwork taking place between April 2020 and March 2021. The CLS has employed an online and paper-only design since the 2016-2017 wave, using ‘push-to-web’ to encourage respondents to complete an online survey by sending households letters via postal service. This design meant that the methodology employed in previous years could be replicated during the pandemic years as it did not involve face-to-face interviewing, which would not have been possible during certain periods of lockdown. Nonetheless, it is unclear what effects the pandemic, its lockdowns and any social and/or individual repercussions of the pandemic may have had on this data. The final, unweighted sample of respondents in 2020-2021 is 10,917 (compared to 10,243 respondents in 2019-2020).
Understanding Society
Understanding Society (USoc; the UK Household Longitudinal Study) is a large, nationally representative household panel survey of people aged 16 and over in England, Scotland, Wales, and Northern Ireland. This project utilised data from respondents living in England only. Fieldwork for each wave is conducted on a rolling basis, with interviews with the same households designed to take place approximately a year apart. This can therefore be used for longitudinal analysis of data collected from the same respondents in different waves, allowing us to investigate factors that predict changes in people’s experiences of loneliness and other aspects of their lives.
This report uses two datasets taken from Understanding Society. The first is Mainstage Wave 11, for which fieldwork began in January 2019 and was completed in January 2021 (before and during the pandemic). The second dataset is comprised from the Understanding Society COVID-19 study, which was conducted every 1-2 months throughout the pandemic, starting in April 2020. This study allows for greater insight into pandemic-specific experiences like shielding, COVID-19 hospitalisation and furlough. The COVID-19 study also allows for analysis of loneliness at three time-points in the pandemic, all of which were during lockdown restrictions – May 2020, November 2020 and March 2021 – unlike the mainstage Understanding Society and CLS data, which covers a far larger time frame.
Measurements of loneliness
This report looks at direct and indirect loneliness. Direct loneliness can be measured by asking respondents explicitly about “loneliness” and allowing them to report their own perceived experiences of this. Direct loneliness can be problematic if some respondents are more likely than others to describe themselves as lonely even when they feel similarly about their circumstances. Whether or not respondents consider themselves to be experiencing loneliness can be influenced by social stigma or different understandings of the concept of loneliness. Measures of indirect loneliness, measured through combining responses to multiple questions related to loneliness (such as isolation) are less likely to be impacted by this but need to be carefully constructed to ensure they capture the intended underlying concept – in this case, loneliness.
The ONS has published recommendations for measuring loneliness in survey research, which includes the recommendation to use a combination of direct and indirect measures to capture this concept. The CLS asks questions designed to measure respondents’ experiences of loneliness, broadly following this guidance.
Direct measure of loneliness
A direct measure of loneliness involves a single survey question, asking respondents:
- How often do you feel lonely?
In Understanding Society, responses to this question are “Often”, “Some of the time”, “Hardly ever or never”. In the CLS the response options are “Often/Always”, “Some of the time”, “Occasionally”, “Hardly ever” and “Never”.
This question can be used to construct a variable that identifies people as experiencing chronic loneliness (defined as people who say that they feel lonely often or always).
Indirect measures of loneliness
In line with the ONS’s recommendations, the CLS measures loneliness indirectly by combining responses to three survey questions asking respondents:
-
How often do you feel you lack companionship?
-
How often do you feel left out?
-
How often do you feel isolated from others?
Responses to each question are measured on a three-point scale (1=“Hardly ever or never”, 2=“Some of the time”, 3=“Often”). These scores are then combined to form a scale of loneliness from 3 to 9.
Analysis of the indirect measure of loneliness is included in this report to compare it with findings from the direct measure (chronic loneliness). This inclusion assesses if and how the relationships between risk factors and loneliness differ when using the direct and indirect measures.
Glossary of methodological terms
This section provides a brief definition for a range of methodological terms used in this report.
Binary logistic regression – a statistical method which uses observations in the data to predict a binary outcome (such as whether or not people are experiencing chronic loneliness). Unlike descriptive analysis, it can estimate the relationship between explanatory and outcome variables while controlling for other factors that may also impact this relationship.
Cross-sectional study – this is a study in which the explanatory variables and outcome variable are both measured at a single point in time. Cross-sectional studies provide a ‘snapshot’ of participants.
Control variable – these are a type of variable that may influence the relationship between the outcome and explanatory variables, but they are not a key variable of interest. They allow us to estimate the ‘adjusted’ relationship between explanatory variables and an outcome variable.
Explanatory variable(s) – also known as the independent variable(s). These are variables we include in regression models to explain or predict changes in the outcome variable. For example, age, disability status and education level.
Fully adjusted model – A model containing all relevant control variables, as well as the explanatory variable(s) to predict the outcome variable.
Odds ratio – these are a key output from logistic regression models. Odds ratios reflect how many times more or less likely people with a specific explanatory characteristic are to experience the outcome variable.
Outcome variable – also known as the dependent variable. Regression models estimate the relationship between a single outcome variable of interest and the explanatory variables. For example, we can use loneliness as our outcome variable to understand to what extent loneliness is explained by factors like income and gender.
Predicted probabilities – a predicted probability is another kind of output from a logistic regression model. It predicts the probability of an outcome occurring (here, being chronically lonely) for a particular subgroup. It is different to the actual prevalence of loneliness in that sub-group, as it is based on the logistic model.
Statistical significance – this is a way to quantify whether results from analysis are likely to be due to random chance. When a result or difference is statistically significant at the 95% level this means we can be 95% confident that this was caused by something other than chance alone. All findings presented here are statistically significant unless otherwise stated.
Survey weights – these are applied to each respondent in the sample to ensure that all metrics derived from the dataset are representative of the wider population.
Loneliness during the pandemic
This section examines the key predictors of loneliness during the pandemic, and explores whether these have changed compared to previous years. As highlighted in previous analysis of the CLS, there was no evidence to suggest that overall levels of loneliness were higher in 2020-2021 than they had been in previous survey waves that collected data before the start of the COVID-19 pandemic. This theme of continuity rather than change is also reflected in the predictors of loneliness during the pandemic.
Firstly, this section examines predictors of chronic loneliness, measured using the direct measure of loneliness, before exploring whether predictors change when using the indirect measures of loneliness. Relationship quality is then explored in order to see whether people’s immediate household or having someone to open up to predicts chronic loneliness. The analysis then explores how predictors change across the life course among different age groups before finally exploring whether protected characteristics (sexual orientation and ethnicity) significantly predict chronic loneliness.
Predictors of loneliness – analysis of USoc and CLS
To understand how the predictors of chronic loneliness might have changed from previous waves, we recreated analyses from NatCen’s previous research on a pre-pandemic period, using Understanding Society Wave 11 data (2019-2021) and Community Life Survey data (2020-2021). Both models included controls for demographic characteristics such as age and gender, health circumstances such as disability status, and living situations such as household size and relationship status.
Understanding Society fieldwork took place from January 2019 until January 2021, meaning that some respondents were interviewed before the pandemic. As such, the Understanding Society model includes a variable to control for whether someone was interviewed before or after the pandemic. This was not necessary for CLS analysis, because CLS fieldwork took place exclusively during the pandemic – April 2020 to March 2021.
These fully adjusted models identified several predictors of chronic loneliness, measured using the direct measure of loneliness, that were also identified in the pre-pandemic waves of data.
A comparison of significant predictors of chronic loneliness in Understanding Society Wave 10 (2018-2020), Understanding Society Wave 11 (2019-2021) and the Community Life Survey (2020-2021) can be seen in Table 1.
Table 1: Significant predictors of chronic loneliness in Understanding Society and the Community Life Survey
| USoc wave 10 (2018-2020) | USoc Wave 11 (2019-2021) | CLS (2020-2021) | |
|---|---|---|---|
| Younger age | ✓ | ✓ | ✓ |
| Female sex | ✓ | ✓ | ✓ |
| Have long-term illness or disability | ✓ | ✓ | ✓ |
| Widowed, separated or divorced | ✓ | ✓ | ✓ |
| Never been married | ✓ | ✓ | |
| Unemployed | ✓ | ✓ | |
| Second-to-bottom income quintile | ✓ | ||
| Bottle income quintile | ✓ | ||
| Middle income quintile | ✓ |
Note: when data values are split into five equal parts, each part is known as a quintile.
Findings showed that during the pandemic:
-
Younger people were more likely to be chronically lonely. Both the CLS and USoc data revealed that the oldest (65+) age group was significantly less likely to be chronically lonely than the youngest (16-34). Understanding Society Wave 11 (2019-2021) data revealed that compared to individuals aged 65+, 50–64-year-olds were found to be 2.6 times more likely to experience loneliness, 35–49-year-olds 3.4-times more likely, and 16–34-year-olds 3.8 times more likely to experience loneliness compared to people in the oldest age group.
-
Women were more likely to be chronically lonely. Analysis of Understanding Society Wave 11 (2019-2021) found that women were 1.3 times more likely to experience chronic loneliness than men. Analysis of the CLS 2020-2021 also found that women were at a greater risk.
-
People with a long-term health condition or disability were more likely to be chronically lonely than people with no condition or disability. This was identified in both the CLS and Understanding Society data. Analysis of Understanding Society Wave 11 (2019-2021) data found that disabled people were 2.8 times more likely to be chronically lonely.
-
Relationship status was a key predictor of chronic loneliness. In Understanding Society Wave 11 (2019-2021), compared to those who lived with a partner (either married, in a civil partnership or cohabiting), people who were widowed, separated or divorced were 3.4 times more likely to be chronically lonely, and people who had never been married were 3.5 times more likely to be chronically lonely. Analysis of CLS 2020-21 also found that those who did not live with a partner were more likely to be lonely.
Analysis of Understanding Society Wave 11 (2019-2021) data was also able to demonstrate that the pandemic as a period of time did not impact the odds of being chronically lonely. Possibly due to its larger sample size, fully adjusted models in Understanding Society identified predictors of chronic loneliness that the CLS did not. In particular, analysis of Understanding Society Wave 11 (2019-2021) found that, similar to Wave 10 (2018-2020), people who were unemployed (for any reason) were 1.4 times more likely to be chronically lonely than those who were employed. Employment was not found to be a significant predictor in the CLS adjusted models.
Analysis of Understanding Society Wave 11 (2019-2021) also revealed that income played a role in predicting chronic loneliness, but the relationship was not linear, nor was it consistent across waves. Compared to those in the top income quintile, only those in the second-to-bottom quintile were more likely to experience chronic loneliness (1.4 times). This represents a slight departure from results of Wave 10 (2018-2020) analysis, which found that those in the bottom and middle quintiles were more likely to be chronically lonely compared to those in the top income quintile.
Summary of predictors of loneliness across USoc and CLS during the pandemic
-
Age – younger people were more likely to be chronically lonely compared to the oldest age group (65+) in the CLS and USoc data.
-
Gender – analysis of USoc and CLS found that women were more likely to be chronically lonely compared to men.
-
Health – people with a long-term health condition or disability were more likely to be chronically lonely than people with no condition or disability in the CLS and USoc data.
-
Relationship status – People who did not live with a partner were more likely to be chronically lonely in both the CLS and USoc analysis.
-
Employment status – analysis of USoc found people who were unemployed (for any reason) were more likely to be chronically lonely than those who were employed
-
Income – analysis of USoc also found that income was a predictor of chronic loneliness, but that this relationship was not linear. During Wave 11 (2019-2021), only people in the second-to-bottom income quintile were significantly more likely to be lonely compared to people in the top income quintile.
Predictors of loneliness measured indirectly
Analysis of the CLS also used the same fully-adjusted models to identify predictors of indirect loneliness. As in 2019-2020, more people in the 2020-2021 (during the COVID-19 pandemic) CLS cohort reported experiencing indirect loneliness than said that they felt lonely “Often/Always” using the direct question. This, once again, may suggest that the indirect measure constructed from three separate questions may better reflect the circumstances of a lonely person, particularly amongst people who are reluctant to identify as or describe themselves as lonely.
Several factors that predicted direct, chronic loneliness also predicted indirect loneliness: having a long-term illness or disability, not living with a partner, being younger and being a woman. These models also found that low household income and living in a rural area were significant predictors of indirect loneliness. Although this may suggest that people living in more isolated settings were more likely to experience loneliness (as measured using the indirect measure) during the COVID-19 pandemic, we cannot establish if this is different from long-term trends as the indirect measure of loneliness was only captured in the two most recent waves of CLS data.
In addition, internet usage remained a significant predictor of loneliness using the indirect measure, but only in the model estimated using data collected in 2020-2021 (during the COVID-19 pandemic). Here, respondents who reported using the internet less than once a month (including those who did not use it at all) were 2.5 times more likely as people who used it every day to experience loneliness (using the indirect measure) when controlling for socio-economic and demographic factors.
Summary of predictors of indirect loneliness in the CLS
-
Having a long-term illness or disability, not living with a partner, younger age and being a woman were significant predictors of indirect loneliness, as they were for direct loneliness.
-
Income – people from low-income households were more likely to experience loneliness compared to people from higher income households.
-
Location – people living in rural areas were more likely to experience loneliness than people living in urban areas.
-
Internet use – People who used the internet less than once a month or not at all were consistently more likely to report loneliness than people who used the internet every day. Internet use was not a significant predictor of loneliness in previous analysis of the 2019/20 CLS.
Relationship quality: extending the original model
Wave 11 (2019-2021) data of Understanding Society allowed for two new features to be added to the original model to further explore the predictors of chronic loneliness over the life course. These are intended to provide further insights into the importance of close and quality relationships with variables that were not available in previous waves.
Quality relationships - having someone to open up to
The first predictor added to the extended model examined the extent to which a respondent felt they could open up to someone (a partner, family or friend). Compared to individuals who had someone they felt they could open up to “a lot”, individuals were 1.6 times more likely to be chronically lonely if they only had someone they felt they could open up to ‘somewhat’, 4.4 times more likely if they only had someone they could open up to ‘a little’, and 5 times more likely if they had no one to open up to, or a relationship in which they could open up ‘not at all’.
In this model gender, age, relationship status, employment status, having a long-term health condition or disability and household income all remained significant predictors of chronic loneliness.
Interaction between pandemic status and household size
Being interviewed during the pandemic was not found to have a direct effect on chronic loneliness in the original model. However, we recognise that the impact of the pandemic on people might be dependent on their situation at home (as the Government ‘stay at home’ order meant individuals spent all their time at home during this time, except for very limited purposes). For example, the impact of the pandemic might have been different for people in a single-person household, compared to people in a four-person household.
To explore this further, we added a pandemic-household interaction to the model outlined above. As odds ratios for interaction effects are crude and complex to interpret, we used predicted probabilities to report the results of this interaction and demonstrate how loneliness differed across different household sizes before and during the pandemic. Figure 1 illustrates the predicted probability of experiencing chronic loneliness, depending on household size before and after the start of the pandemic.
Figure 1: Predicted probability of chronic loneliness by household and interview date (pre- or post- pandemic onset)
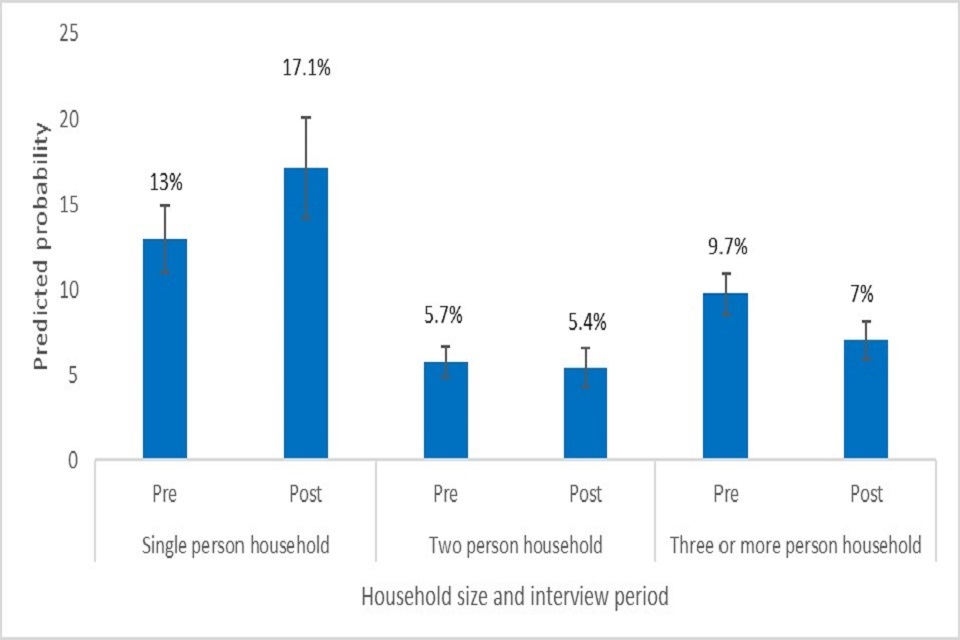
This demonstrates how the impact of the pandemic varied by household size. People in the largest households were less likely to experience loneliness during the pandemic, compared to before.
Summary of relationship quality as a predictor of loneliness
-
Having someone to open up to reduced the odds of chronic loneliness. The more someone could open up to at least one person in their life, the less likely they were to be lonely.
-
People in households of three people or more were significantly less likely to be chronically lonely during the pandemic, compared to before.
Different risk factors at different life stages
To investigate how risk factors vary across different life stages, separate versions of the extended model were estimated for each age group of respondents. This revealed that some risk factors for chronic loneliness were common across all life stages, but others were unique to people at different stages of life. Table 2 shows the risk factors for chronic loneliness by life stage in the current analysis. Risk factors for chronic loneliness in Understanding Society Wave 10 (2018-2020) can be seen in NatCen’s previous report (Table 2).
Table 2: Risk factors for chronic loneliness by life stage
| Age | Female | Never married or been in civil partnership | Widowed, separated or divorced | Not in work | Have long-term illness or disability | In middle income quintile | Has caring responsibilities |
|---|---|---|---|---|---|---|---|
| 16-34 | ✓ | ✓ | ✓ | ✓ | |||
| 35-49 | ✓ | ✓ | ✓ | ✓ | |||
| 50-64 | ✓ | ✓ | ✓ | ✓ | ✓ | ✓ | |
| 65+ | ✓ | ✓ | ✓ | ✓ |
We were also able to explore a new predictor, quality relationships, across different life stages. Compared to having someone to open up to “a lot”, only being able to open up “somewhat” was an important predictor of chronic loneliness among 35-49 and the 65+ age groups. Compared to individuals who had at least one person they could open up to “a lot”, individual’s aged 35-49 were 2.6 times more likely, and individuals aged 65+ were 1.6 times more likely to experience chronic loneliness if they could only open up to someone in their friends, family or romantic relationships “somewhat”.
Important risk factors across all life stages - across all age groups, being a woman, having never been married nor having been in a civil partnership, and having a long-term disability or illness were important predictors of chronic loneliness. This suggests that even though younger people are more likely to have never been married and older people are more likely to experience long-term illnesses or disabilities, the overall relationship between these factors and chronic loneliness is not simply driven by differences in prevalence levels at different stages of life. This finding is consistent with previous analysis using Understanding Society Wave 10 (2018-2020). Additionally, only having someone to open up to “a little” or “not at all” was a significant predictor of chronic loneliness across all ages. This is a new question in Understanding Society Wave 11 (2019-2021).
Being widowed, separated or divorced - among those aged 35-49, 50-64 and 65+ being widowed, separated or divorced was an important predictor of chronic loneliness. This finding is consistent with previous analysis using Understanding Society Wave 10 (2018-2020). The lack of a significant relationship for the youngest group of respondents may reflect the lower likelihood of being widowed, separated or divorced at this age.
Not in work – not being in paid employment (for any reason, including retirement) was an important risk factor for those in the 50-64 age group. Amongst those aged 50-64 years old, people not in work were 1.9 times more likely to experience chronic loneliness than employed people. This was also an important predictor of chronic loneliness in the previous Wave 10 (2018-2020) analysis, where unemployed people aged 50-64 were 2 times more likely to experience chronic loneliness than employed people in the same age group.
Income - being in the middle-income quintile, compared to the wealthiest quintile, also predicted chronic loneliness among 50–64-year-olds. This was not found in previous Wave 10 (2018-2020) analysis.
Specific predictors for loneliness among young people – having caring responsibilities was a risk factor for chronic loneliness specifically in the 16-34 age group. This was not found in previous Wave 10 (2018-2020) analysis.
Summary of the risk factors for loneliness among different age groups:
-
Younger people (those aged 16-34 years old) had the greatest risk of chronic loneliness of any age group.
-
Employment status was an important predictor of loneliness among 50–64-year-olds, but this was not the case in any other age group.
-
Being in the middle-income quintile, compared to the wealthiest quintile, predicted loneliness among 50–64-year-olds, but not among any other age group.
-
Having caring responsibilities predicted chronic loneliness among 16–34-year-olds, but this was not the case in any other age group.
-
Only being able to open up “somewhat” was an important predictor of chronic loneliness among 35-49 and the 65+ age groups.
Risk of chronic loneliness for people with protected characteristics
This section investigates the relationship between loneliness and protected characteristics using Wave 11 (2019-2021) data from Understanding Society. Binary logistic regression models were built to explore whether age, gender, ethnicity, and sexual orientation affected the risk of chronic loneliness. These models also controlled for education level, income, and whether the respondent was interviewed during the pandemic.
Age and Gender - In line with the findings from previous sections of this report, women and young people were significantly more likely to be chronically lonely.
Sexual Orientation - As in previous waves of data, sexual orientation was found to be a strong predictor of chronic loneliness. Compared to heterosexual people, gay or lesbian people were 2.6 times more likely to be chronically lonely, whereas bisexual people were 2.3 times more likely to be chronically lonely.
Figure 2. Risk of chronic loneliness by sexual orientation, compared to heterosexual people
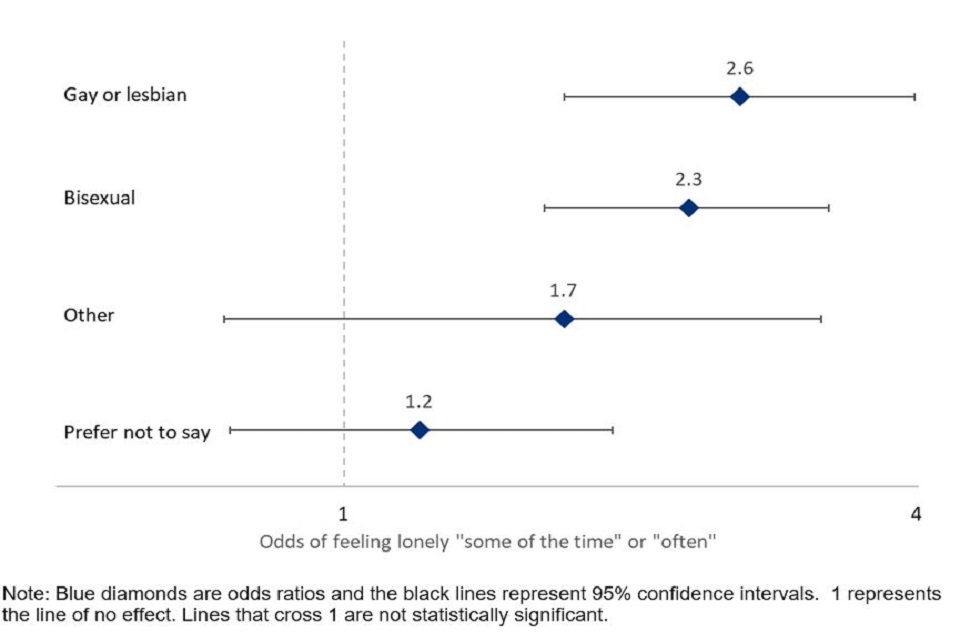
Ethnicity - Ethnicity alone was not found to predict chronic loneliness in Wave 11 (2019-2021) data, which spans the pre- and post-pandemic period. This was also found to be the case in analysis using CLS data. However, when the CLS was used to analyse the predictors of loneliness using the indirect measure, we found that Black people were significantly more likely to be lonely than white people. Compared with previous years of the CLS, 2020-2021 was the first year a difference in indirect loneliness between white and Black people was identified. While the discrepancy between indirect and direct measures of loneliness for Black people may be explained by loneliness stigma or different understandings of what loneliness is, further research may be required to understand the impact of the pandemic on loneliness amongst Black people.
Summary of chronic loneliness risk for people with protected characteristics:
-
The risk of chronic loneliness was higher for bisexual, gay and lesbian people than for heterosexual people.
-
Further research may be required to understand the impact of the pandemic on chronic loneliness in Black people.
Factors predicting resilience to chronic loneliness during the pandemic
The research presented thus far can only speak to the predictors of loneliness at a single point in time, which limits our ability to explore change and continuity in loneliness. This section uses longitudinal data from three critical points in the pandemic (May 2020, November 2020 and March 2021) to examine the characteristics of those who exhibited resilience to chronic loneliness during the pandemic. Resilience to chronic loneliness is defined here as not experiencing chronic loneliness at any of these three time points.
While prior sections of this report suggest that the pandemic as a period of time did not increase the likelihood of experiencing loneliness, this model allows us to explore the impact of pandemic-specific experiences, such as working from home, furlough, COVID-19 hospitalisation and key worker status.
Resilience to chronic loneliness
Amongst those who responded to survey questions about loneliness in all three time periods, 43.7% exhibited resilience to chronic loneliness. Of those who experienced chronic loneliness at some point, 28.9% experienced chronic loneliness during all three time points, and 27.6% experienced chronic loneliness at one or two time points in the pandemic.
Logistic regression models were built to explore the predictors of being resilient to chronic loneliness during the pandemic. Our findings largely mirror those from the pre-pandemic period, with the following groups being less likely to exhibit resilience to chronic loneliness during the pandemic:
-
women
-
younger people
-
disabled people
-
those not living with a partner
Pandemic variables
This model also looked at pandemic-specific experiences as predictors of resilience to chronic loneliness.
Most pandemic experiences did not predict loneliness resilience. Experiencing the following at any point during the pandemic made people no more or less likely to exhibit resilience to chronic loneliness during the pandemic:
-
being a key worker
-
working from home
-
being furloughed
-
being hospitalised with COVID-19
The sole exception was the experience of shielding during the pandemic. Those who had ever been invited to shield were significantly less likely to exhibit resilience to chronic loneliness.
Summary of the predictors to resilience to chronic loneliness during the pandemic:
-
The predictors of loneliness to resilience largely reflect findings from previous research on the predictors of loneliness: men, non-disabled people, older people, and those living in a couple were more likely to exhibit resilience to chronic loneliness.
-
Most pandemic-specific experiences – such as being a key worker, furloughed, hospitalised with COVID-19 and working from home had no impact on the odds of being resilient to chronic loneliness.
-
The sole exception to this was shielding: those who had ever been invited to shield were significantly less likely to exhibit resilience to chronic loneliness.
Conclusion
This report reveals that the predictors of loneliness during the pandemic were similar to before the pandemic: women, young people, disabled people, and those who did not live with a partner were more likely to be chronically lonely. Our analysis also found that being interviewed during the pandemic did not increase the odds of being chronically lonely compared to individuals interviewed before the pandemic, suggesting that the pandemic period itself did not predict loneliness, either.
The use of the two outcome measures for loneliness (i.e. the direct, chronic measure and the indirect measure) yielded similar results overall suggesting that the two measures captured loneliness satisfactorily. However, the analysis did reveal a new predictor of loneliness during the pandemic, which was only picked up using the indirect measure of loneliness. We found that internet usage predicted loneliness via the indirect measure, with those who used the internet less than once a month being 2.5 times more likely to experience loneliness than those who used it every day.
New features of Understanding Society Wave 11 (2019-2021) data allowed for models to interrogate the role of relationship quality during the pandemic in a way we were unable to before. These models revealed that the impact of the pandemic on people’s chronic loneliness depended on their household size. In fact, people in a household of three or more were less likely to be lonely during the pandemic than before, despite having a presumably reduced number of social contacts. These models also revealed that not having someone to open up to “a lot”, was a key predictor of loneliness. Both of these results highlight the importance of quality relationships in understanding loneliness.
Several factors predicted chronic loneliness across the entire life course, which was consistent with findings from pre-pandemic data. These were gender, age, relationship status and disability status. In contrast to previous data, these models revealed that having caring responsibilities increased young people’s odds of chronic loneliness; this did not apply to other age groups.
Bisexual, gay and lesbian people were significantly more likely to be lonely than heterosexual people, as identified in previous waves of data. While our models did not find that ethnicity had an effect on chronic loneliness measured directly, analysis of the CLS 2020-2021 found that Black people were significantly more likely to be lonely, and this was only found to be the case during the pandemic.
The predictors of resilience to loneliness largely reflect findings from research on the pre-pandemic period: men, non-disabled people, older people, and those living in a couple were more likely to exhibit resilience to chronic loneliness. Most pandemic-specific experiences – such as being a key worker, furloughed, hospitalised with COVID-19 and working from home had no impact on the odds of being resilient to chronic loneliness. The sole exception to this was shielding: those who had ever been invited to shield were significantly less likely to exhibit resilience to chronic loneliness.
The overall finding that loneliness levels and predictors were largely unaffected by the pandemic presents a problem for the idea that loneliness can be understood in terms of the number of social interactions people have. Our findings also emphasise the importance of close relationships and household members on the odds of chronic loneliness.
This report also highlights a need for further research into the impact of the pandemic on Black people, particularly using the indirect measure of loneliness. Many models utilising the indirect measure of loneliness were able to pick up the same predictors of loneliness as the chronic loneliness (direct) measure, but were also able to identify further insights on factors like internet usage and ethnicity. Given the multitude of reasons why people might respond differently to a question about their level of loneliness directly (stigma, different cultural interpretations of ‘loneliness’, or personal confidence with the term), there would be several benefits to further, systematic research on the predictors of loneliness using the indirect measure.
-
Defined as people who say that they feel lonely often or always. ↩
-
Including age, gender, marriage or civil partnership, race, sexual orientation and disability. ↩
-
Ethnicity was categorised into the following: White, Mixed race, Asian, Black or Other. ↩
-
the extent to which a respondent felt they could open up to someone (a partner, family or friend). Response options were “a lot”, “somewhat”, “a little” and “not at all”. ↩
-
Not experiencing chronic loneliness at any of the three time points analysed for this report. ↩
-
As previously mentioned, throughout this report we use ‘chronic loneliness’ to refer to people who have been asked if they are lonely directly (i.e., using the single-item measure), and who have responded with “Often” or “Often/Always”. Where loneliness is measured indirectly, this will be clearly stated. ↩
-
The survey does not comment on whether this is a statistically significant change, and there could be many reasons for why this change has occurred. For example, the increase in prevalence could reflect a real increase in loneliness or an increase in the willingness to report loneliness due to factors such as decreased stigma or increased awareness of the concept. ↩