Investigating factors associated with loneliness in adults in England
Published 12 June 2022
Applies to England

© Crown copyright 2022
This publication is licensed under the terms of the Open Government Licence v3.0 except where otherwise stated. To view this licence, visit nationalarchives.gov.uk/doc/open-government-licence/version/3 or write to the Information Policy Team, The National Archives, Kew, London TW9 4DU, or email: psi@nationalarchives.gov.uk.
Where we have identified any third party copyright information you will need to obtain permission from the copyright holders concerned.
This publication is available at https://www.gov.uk/government/publications/factors-associated-with-loneliness-in-adults-in-england/investigating-factors-associated-with-loneliness-in-adults-in-england
1. Executive Summary
1.1 Overview
This report explores loneliness in people aged 16 and over in England using data from the Community Life Survey (CLS) 2013/14 - 2019/20 and Understanding Society Waves 9 (2017/19) and 10 (2018/20). It investigates:
-
The characteristics of those at risk of loneliness;
-
Whether the risk factors for loneliness have changed over time;
-
Whether any factors predict the alleviation of loneliness over the short term; and
-
The relationship between loneliness and mental wellbeing.
1.2 Interpreting findings
The two surveys used in this analysis - Understanding Society and the Community Life Survey - measure loneliness in slightly different ways. As such the estimates of people who are chronically lonely vary - 6% in the CLS and 9% in Understanding Society. Chronic loneliness is defined in the CLS as those who feel lonely “Often/Always”, and in Understanding Society as those who feel lonely “Often” (and option of always is not given). DCMS uses the CLS to estimate the prevalence of loneliness. However, the two surveys have different benefits, so both are drawn on here.
Some variables (for example age, ethnicity, sex) are relevant to multiple research questions, so they are covered in multiple chapters. Key points are highlighted in summary boxes at the end of each chapter. These are not comprehensive summaries.
1.3 Findings
The key findings are summarised below.
-
Confirmation of findings from existing research - Findings in this report support previous research: women, young people (aged 16-34 in this analysis), those who live alone and those who were widowed were found to be at a greater risk of loneliness.
-
Identification of additional at risk groups - This report also identifies additional groups of people at higher risk of loneliness; in particular, gay, lesbian, and bisexual people, as well as those who identified as an ‘other’ sexual orientation and those who preferred not to disclose their sexual orientation were all at a greater risk of loneliness than heterosexual people. This report also highlights the greater risk of loneliness for those not in work, those who have recently moved to their current address, those with low wellbeing and those with high anxiety. It finds that people with disabilities or longstanding health conditions were almost three times more likely to experience chronic loneliness as those without.
-
Higher risk for young people - This report identifies young people (16-34 years old) as a high-risk group for loneliness, with over five times greater odds of chronic loneliness than those aged 65 or older. This report also highlights the unique risk factor profile for loneliness in young people. Unlike any other age group, income and sex were key determinants of loneliness in this group.
-
Close relationship between mental wellbeing and loneliness - This research found that mental wellbeing and loneliness were closely associated.
-
Analysis of Understanding Society estimated that 4% of people without mental distress but 28% of people with mental distress experienced chronic loneliness. [footnote 1] Similarly, 60% of people experiencing chronic loneliness experienced mental distress, compared to only 15% of those who were not chronically lonely.
-
Longitudinal analysis found that mental distress played a role in the onset of chronic loneliness and the continuation of this over time. Similarly, loneliness was a predictor of the onset and, to a lesser extent, the continuation of mental distress
-
-
Difficulty in alleviating loneliness - Few factors were identified that predicted the alleviation of loneliness in the short term. People who had said they were lonely 12 months earlier were more likely to indicate that they no longer experienced loneliness if they:
-
Did not have a disability or long-term illness (compared to those who did);
-
Were living with a partner (compared to those who were not cohabiting).
-
Had good mental wellbeing rather than poor mental wellbeing.
-
-
Consistency of risk factors over time - Longitudinal analysis of the CLS found that almost all predictors of loneliness were consistent over time. For those factors that did change, it was difficult to conclusively determine the extent of change over time that did occur, due to a change in survey mode in 2016/2017.
Key groups at risk of loneliness
-
Young people, with younger age groups progressively more likely to be lonely than people in the oldest age group (aged 65 or over);
-
Those with poor mental wellbeing;
-
People with a disability or long-standing health problem;
-
People not living with a partner (either married or cohabiting);
-
Gay, lesbian, or bisexual people and people who chose ‘other’ when asked about their sexual orientation;
-
People on lower incomes (those in the two poorest quintiles, compared to those in the wealthiest quintile);
-
People who were out of work;
-
Those who have recently moved to their current address; and
-
Women, who were at greater risk of loneliness than men.
1.4 Implications
The report concludes with a discussion on policy implications of these findings, and potential areas of further research.
-
This analysis highlights the need to target interventions at people from different age groups, as well as the value of providing support to people when they first experience loneliness. This may be particularly valuable for alleviating both loneliness in the short term and mental distress, given the impact of loneliness on people’s mental health appears to be greater for those who had not previously reported feeling lonely.
-
Important areas for future research include further exploration of the role of protected characteristics in experiences of loneliness, in particular how the intersection of protected characteristics is related to loneliness, and of the relationship between mental health and loneliness over a longer time period.
2. Introduction
This project has used survey data collected from adults aged 16 and older across England in the Community Life Survey (CLS) and in Understanding Society to investigate which individual characteristics and life experiences are associated with experiences of loneliness. This data was collected before March 2020, so people’s reported levels of loneliness will not have been influenced by the COVID-19 outbreak and national lockdowns.
The four research questions below are the focus of this analysis. These questions are used to structure the report, focussing on different potential factors associated with loneliness, how these change over time and differ between life stages, and what protective factors there may be against experiencing loneliness. Different data sources and analytical methods have been used to answer each question so as to ensure the most appropriate approach to offer insights in each area.
Research questions:
-
What types of people are particularly vulnerable to experiencing loneliness?
-
Have the risk factors for loneliness changed over time?
-
How does loneliness relate to mental wellbeing, and is there evidence of a two-way relationship between mental health and loneliness?
-
What short-term factors predict the alleviation of loneliness?
This analysis was carried out by Bea Taylor, Isabel Taylor, Joe Crowley, Kate Belcher, Sokratis Dinos and Afrika Anfruns from the National Centre for Social Research and commissioned by the Department for Digital, Culture, Media and Sport.
Research on loneliness in England
Previous research on loneliness in England has been summarised in a recent evidence review published by DCMS in 2022, building upon the recommendations they set out in 2018. The review aimed to critically assess existing literature on loneliness using a lifespan perspective and to identify priority evidence gaps relating to the potential drivers of loneliness, and interventions that have been found to alleviate it.
Drivers of loneliness have been extensively examined, including through previous analysis of the Community Life Survey (CLS). Previous analysis of the CLS has highlighted that young adults (aged 16-24 years old), women, single or widowed people and people with a limiting health condition are at a higher risk of experiencing loneliness. These findings have been confirmed by other studies. Using a different loneliness scale with UK citizens, the BBC Loneliness Experiment and work by Barreto et al. (2021) reported similar findings regarding age, relationship status and health.
Among adolescents, chronic loneliness – defined here as loneliness experienced ‘often’ or ‘always’ - is related to negative social experiences, such as bullying from peers and siblings and arguments with parents. The impact of chronic loneliness has also been investigated with findings from Qualter et al. (2021) suggesting that it is linked to poor physical and mental health, increased social isolation and poor academic performance amongst young people.
However, there remain a number of important gaps in the current evidence on loneliness that this report aims to address. In particular, DCMS’s evidence review highlighted the need for sub-group analysis above and beyond regional breakdowns. In particular, the relationships between loneliness and disability and between loneliness and sexual orientation were highlighted as under-studied areas.
The evidence review outlined the need for a more detailed exploration of longer-term experiences of loneliness, which could be explored through a longitudinal approach to allow for the identification of factors that explain short-term changes in loneliness over a certain time period. It also highlighted evidence gaps within the life course approach to studying loneliness, with a particular focus on the development and subsequent trajectories of loneliness at different life stages, and how this differed amongst members of vulnerable groups. This report therefore aims to address some of these gaps in knowledge about loneliness in adults in England.
2.1 Data and methods
Community Life Survey
The Community Life Survey (CLS) is a nationally representative household survey of adults aged 16 or over in England. It is conducted on an annual basis, collecting data from a new, cross-sectional sample of the adult population of England each year. The CLS collects information on topics relating to wellbeing, community engagement, volunteering and social cohesion. This includes data on respondents’ level of loneliness using the ONS’s recommend direct measure (since 2013/14) and indirect measure (in 2019/20). Further details of these measures are outlined below.
The 2019/20 wave of the CLS is the most recent wave completed before the start of the COVID-19 pandemic. It is therefore the focus of the majority of this analysis. Fieldwork for the 2019/20 CLS was conducted between April 2019 and March 2020, with a final, unweighted sample of 10,243 respondents.
Overall, a total of seven waves of the CLS were used to investigate changes in risk factors for loneliness over time, from 2013/14 to 2019/20. However, changes to the survey method that were introduced in 2016/17 mean that data collected before and after this date may not be directly comparable; since 2016/17, respondents could choose to complete the survey online or as a paper survey, while earlier waves had used face-to-face interviewing to collect data. Although the pilot study that was run from 2012-13 to 2015-16 collected data using a self-completion online/paper survey methodology to test differences between survey modes, this is not used in this analysis due to the experimental nature of the data collection.
Understanding Society
Understanding Society (the UK Household Longitudinal Study) is a large, nationally representative household panel survey of people aged 16 and over in England, Scotland, Wales, and Northern Ireland. This project utilised data from respondents living in England only. Fieldwork for each wave is conducted on a rolling basis, with interviews with the same households designed to take place approximately a year apart. This can therefore be used for longitudinal analysis of data collected from the same respondents in different waves, allowing us to investigate factors that predict changes in people’s experiences of loneliness and other aspects of their lives.
Respondents to Understanding Society are drawn from a random sample of households, along with an Ethnic Minority Booster sample to facilitate sub-group analysis. In each sampled household, all members of the household are invited to take part. The study is multi-topic and covers a range of social, economic, and behavioural aspects of life, with variation in some modules of questions asked each year. Understanding Society also provides, under Special Licence access, a dataset that includes information collected on respondents’ sexual orientation. Data was most recently collected on this in Wave 9 of the study. Due to the sensitivity of the data, additional access conditions are required to access this data which can then be matched to respondents in the standard Understanding Society dataset.
Wave 9 (2017/19) and Wave 10 (2018/20) are the most recent waves of Understanding Society that were completed before the start of the COVID-19 pandemic. Fieldwork for each wave took place over a 2-year period and although the fieldwork periods overlap, respondents are interviewed only once per wave with approximately one year between interviews. Wave 9 analysis was conducted on a final, unweighted sample of 26,385 respondents whilst Wave 10 analysis was conducted on 25,494 respondents. The large sample sizes allow us to investigate loneliness amongst smaller sub-groups of the population than in the CLS.
2.2 Measurements of loneliness
Survey research can ask about respondents’ experiences of loneliness through direct or indirect questions. Direct questions ask explicitly about ‘loneliness’, and allow respondents to report their own perceived experiences of this. These can be problematic if some respondents are more likely than others to describe themselves as lonely even when they feel similarly about their circumstances. This could be due to social stigma, different interpretations of the concept of loneliness or an unwillingness to use this label for themselves. This may affect particular socio-demographic groups more than others. Indirect measures, constructed from multiple questions asked about experiences related to loneliness (such as isolation), are less likely to be impacted by this. However, they need to be carefully constructed to ensure the questions capture the intended underlying concept – in this case, loneliness.
The ONS has published recommendations for measuring loneliness in survey research, which includes the recommendation to use a combination of direct and indirect measures to capture this. Both the CLS and Understanding Society ask questions designed to measure respondents’ experiences of loneliness, broadly following this guidance.
Direct measure of loneliness
This is measured through the single survey question, asking respondents:
- How often do you feel lonely?
This question can be used to identify people experiencing chronic loneliness (people who say that they feel lonely often or always) and people experiencing either transient or chronic loneliness (people who say that they feel lonely at least some of the time).
Chronic loneliness is the main focus of this analysis as this has particularly negative effects on people’s wellbeing. This captures the frequency of someone’s loneliness, rather than the length of time they have reported experiencing loneliness.
Due to the small sub-group sizes available for investigating the relationship between protected characteristics and loneliness in Understanding Society, transient loneliness is used as the outcome variable for this section of analysis. This measure of loneliness captures respondents who say that they feel loneliness “often/always” or “some of the time” in Understanding Society. It therefore includes all respondents apart from those who say that they feel lonely “Hardly ever or never”.
Indirect measures of loneliness
In line with the ONS’s recommendations, the CLS measures loneliness indirectly by combining responses to three survey questions asking respondents:
-
How often do you feel you lack companionship?
-
How often do you feel left out?
-
How often do you feel isolated from others?
Responses to each question are measured on a three-point scale (1=“Hardly ever or never”, 2=“Some of the time”, 3=“Often”) and an overall scale that runs from 3 to 9 can be generated from these.
Analysis of the indirect measure of loneliness is included in this report to compare it with findings from the direct measures to assess if and how the relationships between risk factors and loneliness differ when using the direct and indirect measures.
2.3 Glossary of methodological terms
This section provides a brief definition for a range of methodological terms used in this report. Further details on these techniques can be found in the Technical Appendix.
Descriptive analysis – a statistical method used to summarise data, such as the percentage or frequency of certain survey responses. It can also be used to investigate the relationship between different variables, for example to investigate if the proportion of people experiencing chronic loneliness differs between demographic groups.
Cross-sectional analysis – a statistical method that analyses data collected at a single point in time. This can be used to offer a snapshot of any one time point and, where repeated cross-sectional data is available, to build up a picture of overall levels of change over time.
Binary logistic regression – a statistical method which uses observations in the data to predict a binary outcome (such as whether or not someone is experiencing chronic loneliness). Unlike descriptive analysis, it can estimate the relationship between explanatory and outcome variables while controlling for other factors that may also impact this relationship.
Outcome variable – also known as the dependent variable. Regression models estimate the relationship between a single outcome variable of interest and the explanatory variables. For example, we can use loneliness as our outcome variable to understand to what extent loneliness is explained by factors like income and gender.
Explanatory variable(s) – also known as the independent variable(s). These are variables we include in regression models to explain or predict changes in the outcome variable. For example, age, disability status and education level.
Control variable – these are a type of variable that may influence the relationship between the outcome and explanatory variables, but they are not a key variable of interest. They allow us to estimate the ‘adjusted’ relationship between an outcome variable and outcome variables.
Odds ratio – these are a key output from logistic regression models. Odds ratios reflect how many times more or less likely someone with a specific explanatory characteristic is to experience the outcome variable.
Statistical significance – this is a way to quantify whether results from analysis are likely to be due to random chance. When a result or difference is statistically significant at the 95% level this means we can be 95% confident that this was caused by something other than chance alone. All findings presented here are statistically significant unless otherwise stated.
Confidence intervals – these are included in bar charts and plots of odds ratios in this report to show the degree of uncertainty around the estimates produced. They display the range of values that we are 95% confident will include the true value across the broader population of interest, based on the estimate generated from respondents to the survey. Confidence intervals that do not overlap highlight statistically significant differences.
Survey weights – these are applied to each respondent in the sample to ensure that all metrics derived from the dataset are representative of the wider population.
2.4 Key explanatory variables
The explanatory variables to be used in this analysis fall into three main categories that may be linked to individuals’ experiences of loneliness. These are:
-
Life experiences and events: this includes people’s education, employment, health outcomes, general sense of wellbeing, relationship status, and whether people recently moved to their local area.
-
The role of protected characteristics or factors related to social exclusion: such as sexual orientation, ethnicity, and social class.
-
Mental wellbeing: this is measured using the General Health Questionnaire-12 survey instrument (GHQ), which is used to screen people for mental disorders. A score of 4 or more on the GHQ scale is considered to identify people who are experiencing probable mental distress.
In addition to these areas, a range of socio-demographic characteristics are also analysed, including sex, age, household income and whether people have caring responsibilities and used as control variables in regression models.
3. Comparison of levels of loneliness reported in the CLS 2019/20 and Understanding Society Wave 9
Both the CLS and Understanding Society ask about respondents’ level of loneliness using the survey question recommended by the ONS. However, while the CLS asks respondents about their level of loneliness using the response categories proposed by the ONS, a smaller number of response categories is available to respondents in Wave 9 and Wave 10 of Understanding Society.
As Table 1 shows, “chronic loneliness” can be measured by both surveys in a similar way, by capturing respondents reporting they feel lonely “Often/always” in the CLS and “Often” in Understanding Society. However, Understanding Society offers less granular response categories, collapsing “Hardly ever” and “Never” into a single category. Furthermore, unlike in the CLS, respondents are not given the option to say that they feel lonely “Occasionally”, with a single mid-point category labelled “Some of the time”:
Table 1: Response categories for direct loneliness questions in CLS and Understanding Society

Table showing that Understanding Society collapses the CLS response options “Hardly ever” and “Never” into a single response option and has a single mid-point category labelled “Some of the time”
Given the differences in response categories, the data collected in the CLS and Understanding Society are not directly comparable. These differences may help to explain, at least to some extent, the different levels of loneliness reported between these surveys; as Figure 1 shows, respondents to both Wave 9 and Wave 10 of Understanding Society (conducted in 2018/19 and 2019/20 respectively) were more likely to say they felt lonely “Often” than respondents to the 2018/19 or 2019/20 CLS were to say that they felt lonely “Often/always”.
Respondents to Understanding Society were also more likely to report feeling lonely “Hardly ever/never” than respondents to the CLS were to place themselves into any of these two (separate) response categories. It therefore appears that Understanding Society, with three wider categories, found more people at the two extremes of the loneliness spectrum (feeling lonely “often/always” or “hardly ever/never”) than the CLS. This may be because the greater granularity of response categories offered by the CLS, and particularly the inclusion of “Occasionally” as an additional, subjective response category may influence how survey respondents answer this question. However, as these studies collect data from different samples of respondents, we cannot determine whether it is differences in question wording or differences in experiences of loneliness that is primarily driving these results.
Figure 1: Levels of loneliness - CLS 2018/19 & 2019/20 and Understanding Society Waves 9 & 10
Stacked bar chart showing that in Understanding Society, which offers fewer response categories than the CLS, more people select response options at each end of the loneliness scale than in the CLS.
The measure of people experiencing chronic loneliness (defined as those who feel lonely “Often/Always”) therefore appears to be the most comparable response category across the two surveys. Nonetheless, respondents to Understanding Society were still more likely to fall into this category than respondents to the CLS (9% compared to 6% in both waves).
Neither men nor women were more likely to report chronic loneliness in Understanding Society than in the CLS. However, younger people were much more likely to report chronic loneliness in Understanding Society than in the CLS (Figure 2). In the most recent, pre-pandemic wave of Understanding Society (Wave 10), 14% of people aged 16-34 said that they were “Often” lonely compared to 9% of 16-34 year olds who said they were “Always/Often” lonely in the 2019/20 CLS. There were not, however, differences between the levels of chronic loneliness reported in these studies for the oldest group of respondents (aged 65 or older).
This may suggest that people who are at the highest risk of experiencing loneliness, such as younger people, are most likely to be impacted by changes in the response options offered; they may be more likely to place themselves in the most extreme category when they are given fewer options to distinguish between feeling lonely “often/always”, “some of the time” or “always”. However, as we are comparing responses from different samples between these studies, we cannot determine to what extent these differences are driven by the different response options offered or differences in experiences of loneliness between respondents to the studies.
Figure 2: Levels of chronic loneliness by age - CLS 2019/20 and Understanding Society Wave 10
Bar chart that shows younger people were more likely to report chronic loneliness in Understanding Society than in the CLS, but this did not vary for the oldest age groups.
Summary of the comparison of loneliness measured in the CLS and Understanding Society:
Although the same question wording was used to ask directly about loneliness in the CLS and Understanding Society, different response categories were offered to respondents. Therefore, the results are not directly comparable.
-
In Understanding Society respondents were more likely to feel lonely “often” than CLS respondents were to feel lonely “often/always”.
-
However, the CLS survey question offered respondents an additional answer category, “occasionally”. The total percentage of people in the CLS who felt lonely at least “occasionally” was greater than the percentage in Understanding Society who felt lonely at least “some of the time”.
Younger people (aged 16-34 years old) in the Understanding Society data were more likely to feel chronically lonely than in the CLS, but there were no differences in older age groups.
Although the survey questions used in the CLS and Understanding Society are not identical, they can both be used to identify respondents experiencing chronic loneliness who report feeling lonely either “Often/always” (in the CLS) or “Often” (in Understanding Society). These measures are the focus of the analysis in the next sections of this report, although a measure of transient loneliness (feeling lonely “Some of the time” or “Often”) is used in analysis of Understanding Society to investigate the relationship between loneliness and protected characteristics, due to small sub-group sizes.
4. Comparing direct and indirect measures of loneliness in the CLS
The main findings in this report relate to the direct measure of loneliness. This has been included in all waves of the CLS since 2012/13 and in Wave 9 and Wave 10 of Understanding Society. However, an indirect measure of loneliness can also be generated from questions relating to, but not explicitly asking about, loneliness.
The CLS uses three recommended questions from the 3-item UCLA loneliness scale to capture different elements of loneliness and isolation. These ask:
-
How often do you feel you lack companionship?
-
How often do you feel left out?
-
How often do you feel isolated from others?
Three response options are given: 1=“Hardly ever or never”, 2=“Some of the time”, 3=“Often”.
Responses to these questions can be combined to generate a scale running from 3 (low levels of loneliness) to 9 (high levels of loneliness) Scores of 8 or 9 on this scale – which reflect people who reply “often” to at least two out of three items and “never” to none of the items – have previously been used to reflect high levels of loneliness. Therefore, for the purpose of this analysis, respondents who score 8-9 have high levels of loneliness.
In the 2019/20 CLS, more people reported high levels of loneliness using the indirect loneliness scale than said that they felt lonely “often/always” using the direct question. This may be driven by the reluctance of some people to identify as or describe themselves as lonely, even if they are experiencing isolation or a lack of social connection. For these people in particular, their experiences of loneliness may be better reflected across the three questions used to construct the indirect measure.
One and a half times as many people were considered to be experiencing high levels of loneliness using the indirect measure than said they felt lonely “often/always” in response to the direct question. However, it is important to note that these have not been designed as interchangeable measures and the ONS recommends that they should be used in combination to get richer insights into experiences of loneliness and isolation in survey research.
While it does appear that people are more likely to be classified as lonely using the indirect than direct measure, this relationship is largely consistent across demographic groups. In binary logistic regression models built to estimate the relationship between individual characteristics and life events (all controlling for age, sex and ethnicity), the relationship between each of these predictor variables and direct or indirect measures of loneliness was largely consistent.
However, the relationship between ethnicity and loneliness is not consistent across models predicting loneliness using the direct and the indirect measure. In models using the direct measure and controlling for age and sex, Asian or Asian British people are not predicted to have higher odds of experiencing chronic loneliness than White people. However, when the indirect measure is used to identify people experiencing high levels of loneliness, Asian or Asian British people are estimated to be 1.3 times more likely to experience loneliness than White people. This may suggest that these groups are less likely to identify or describe themselves as lonely, even when they are experiencing isolation or a lack of social connections. This could be driven by a social stigma linked to loneliness amongst these respondents.
Summary of the comparison of loneliness measures:
-
Indirect measures produced a slightly higher estimate of the prevalence of loneliness than direct questions.
-
Most predictors of loneliness were consistent for both indirect and direct measures of loneliness.
-
However, in regression models predicting experiences of loneliness while controlling for age and sex, being of Asian or Asian British ethnicity was a predictor of loneliness when using the indirect but not direct loneliness measure.
5. What types of people are particularly vulnerable to experiencing loneliness?
Previous analysis of the CLS has highlighted that a range of individual characteristics are associated with loneliness. In particular, young people, women, people not living in a couple and people in poor health were found to be more likely to be experiencing chronic loneliness, by reporting that they felt lonely “often/always” (Pyle & Evans, ONS, 2018). These relationships remain important in data collected in the 2019/20 CLS used in this analysis.
Analysis of Understanding Society also found women, young people and those not in work to be more likely than men, older people and those in work to experience chronic loneliness. Women were 1.2 times more likely than men to be chronically lonely while the prevalence of chronic loneliness recorded in Understanding Society decreased with age.
Building on previous analysis of the CLS to investigate the personal characteristics associated with loneliness, this analysis focuses on life experiences and outcomes that can be identified as risk factors for loneliness in the CLS. This highlights how these are associated with loneliness in England.
Individuals’ social environment and working life are associated with their levels of loneliness. In particular:
-
Work status - People not in work (8.4%) are more likely to be chronically lonely compared to those who are (4.8%). The relationship between employment status and loneliness was not impacted by age, sex or ethnicity.
-
Recently moved - Those who have moved to their current address in the previous 12 months were more likely to be lonely than those who had not (8.3% compared to 6.2%). However, when controlling for age, sex and ethnicity, having recently moved is not a risk factor for loneliness. This may be because younger people who are at a higher risk of experiencing loneliness are also more likely to have lived at their current address for a shorter amount of time. This may mean that people new to their address are more likely to experience loneliness because they are younger, and not because of the recent change to their living situation.
-
Level of deprivation - People who live in more deprived areas are at a higher risk of experiencing chronic loneliness (9.3%) than those who live in less deprived areas (4.2%). This was not impacted by age, sex or ethnicity.
-
Caring responsibilities - Descriptive analysis of the 2019/20 CLS found that people with caring responsibilities are not more likely to experience loneliness. However, when controlling for age, sex and ethnicity, having caring responsibilities was associated with a higher likelihood of experiencing chronic loneliness. As older people and women are more likely to have caring responsibilities, this suggests that there is evidence of an important relationship between having caring responsibilities and loneliness when these demographic differences are taken into account.
-
Living status - In comparison to people who lived with a partner (either married or cohabitating), people who did not live with a partner were more likely to be lonely. People who were widowed, separated, or divorced were 3.5 times more likely to experience chronic loneliness and people who had never been married were 2.5 times more likely to experience chronic loneliness than those who were living with a partner.
-
Health - People with a long-term health condition or disability were 2.9 times more likely to experience chronic loneliness than those with no such condition or disability.
-
Household income - Descriptive analysis revealed that people in the highest income quintile were the less likely to be lonely than people in all other quintiles (Figure 3). When controlling for other demographic characteristics in logistic regression models, the pattern was less consistent; only people in the lowest quintile (1.5 times higher) and middle quintile (1.3 times higher) had higher odds of experiencing chronic loneliness than people in the highest income quintile.
Figure 3: Rates of chronic loneliness by income quintile
Bar chart that shows people in the highest income quintile are less likely to experience chronic loneliness that people in lower income quintile.
Summary of the relationship between day-to-day experiences and loneliness in the CLS:
A number of groups were at greater risk of being lonely, including:
-
People who were out of work;
-
Those living in areas of greater deprivation;
-
People with caring responsibilities; and
-
Those who had recently moved to their current address.
6. Factors predicting chronic loneliness over the life course
Although analysis of both the CLS and Understanding Society highlight that many individual characteristics and life experiences are associated with a higher risk of feeling lonely, the same factors do not necessarily apply across all stages of life.
The most recent Understanding Society data (Wave 10) was therefore used to investigate if people at different life stages experienced different risk factors for loneliness. To understand the predictors of loneliness for different groups of people, this section utilised stratified logistic regression models. Further details of this can be found in the Technical Appendix.
Descriptive analysis revealed that the oldest age group (aged 65 or more) were the least likely to be lonely (Figure 4).
Figure 4: Levels of loneliness by age group - Understanding Society Wave 10
Bar chart showing that 16-34 year olds were the most likely and people aged 65 or over were the least likely to report chronic loneliness in Understanding Society.
In regression models controlling for other demographic characteristics, 50-64 year olds were found to be 2.9 times more likely to be lonely, 35-49 year olds 4.1 times more likely to be lonely, and 16-34 year olds 5.4 times more likely to be lonely than people in this oldest age group.
Different risk factors at different life stages
To investigate how risk factors vary across different life stages, separate binary logistic regression models were estimated for each age group of respondents using data collected in Wave 10 of Understanding Society. These models controlled for respondents’ sex and ethnicity. This revealed that some risk factors for chronic loneliness were common across all life stages, but others were unique to people at different stages of life, as outlined in Table 2.
Table 2: Important risk factors for chronic loneliness by life stage
| Age | Sex | Never married or been in civil partnership | Widowed, separated or divorced | Have long-term disability or illness | Not in work | In lowest income quintile |
|---|---|---|---|---|---|---|
| 16-34 | ✔ | ✔ | ✔ | ✔ | ||
| 35-49 | ✔ | ✔ | ✔ | |||
| 50-64 | ✔ | ✔ | ✔ | ✔ | ||
| 65+ | ✔ | ✔ | ✔ |
-
Important risk factors across all life stages - Across all age groups, never being married nor having been in a civil partnership and having a disability were important predictors of chronic loneliness. This suggests that even though younger people are more likely to have never been married and older people are more likely to experience long-term illnesses or disabilities, the overall relationship between these factors and chronic loneliness is not simply driven by differences in prevalence levels at different stages of life.
-
Being widowed - Among those aged 35-49, 50-64 and 65 years old or over, being widowed was an important predictor of chronic loneliness. Like never being married, this reflects respondents who are not currently cohabiting with a partner and the lack of a significant relationship for the youngest group of respondents may reflect the lower likelihood of being widowed, separated or divorced at this age.
-
Not in work - Not being in work was only an important risk factor for those in the 50-64 age group. For many people, this will be towards the end of their working lives. Amongst those aged 50-64 years old, people not in work had 2.0 times higher odds of experiencing chronic loneliness than employed people.
-
Specific predictors for loneliness among young people - People in the youngest age group, who were most at risk of chronic loneliness, had a particularly distinct set of risk factors. While being widowed, separated, or divorced did not predict chronic loneliness in the youngest life stage, income and sex did. Amongst those aged 16-34, women had 1.4 times higher odds of experiencing chronic loneliness than men, and people in the lowest income quintile had 1.7 times higher odds of chronic loneliness than those in the highest quintile. Neither income nor sex was a significant predictor of chronic loneliness at any other life stage.
Summary of the risk factors for loneliness among different age groups:
Young people (those aged 16-34 years old), had the greatest risk of chronic loneliness of any age group, and among young people there was a unique profile of characteristics associated with being lonely. Specifically:
-
Being a woman predicted chronic loneliness among 16-34 year olds, but this was not the case in any other age group.
-
Being in the lowest income quintile, compared to the wealthiest quintile, also predicted chronic loneliness among 16-34 year olds but income but not among any other age group.
-
Other age groups also had their own unique risk profiles for loneliness, with relationship status and employment becoming more important w8q275among older age groups.
7. Risk of loneliness for people with protected characteristics
To investigate the relationships between loneliness, protected characteristics and risk factors for social exclusion, data collected about respondents’ age, sex, ethnicity, sexual orientation and social class in Wave 9 of Understanding Society were used. This was the most recent wave to collect information on respondents’ sexual orientation. Binary logistic regression models were built using this data to explore whether people experiencing social exclusion or with other specific protected characteristics were at a higher risk of experiencing loneliness.
Due to the small number of respondents who fell into some of these protected groups in Understanding Society, these models used the broader conception of transient loneliness rather than chronic loneliness as the outcome variable. Therefore, the outcome used for these models reflected transient loneliness, that is whether an individual felt lonely “some of the time” or “often” compared to whether they felt lonely “hardly ever or never”.
-
Sex - As with chronic loneliness, women were more likely than men to experience transient loneliness; from these models, they were estimated to be 1.4 times more likely to experience transient loneliness.
-
Age - Younger people were also more likely to experience transient loneliness, and the incidence of transient loneliness decreased with age.
-
Ethnicity - This was not a consistent predictor of loneliness in these models. However, those who fell into the ‘other’ category (which included people who identified as ‘Arab’ and those who identified as belonging to any other ethnic group) were 1.6 times more likely to be lonely than people from a White ethnic background. Black, mixed race and Asian people were not more likely to be lonely than White people. However, findings from the CLS discussed earlier in this report suggest that rates of loneliness in Asian people may be underestimated by analysis of direct measures alone. Further research on indirect loneliness and ethnicity may offer further insights in this area.
-
Income - We consistently found that the lower someone’s income, the higher their odds of being lonely. This finding was significant across all models.
-
Social class - Even when controlling for income level, social class (NSSEC-7) was also associated with loneliness. People in semi-routine professions (such as semi-routine postal work, caretaking or machine operation) were 1.3 times more likely to be lonely than those in Management and Professional roles.
-
Sexual orientation - This was a strong predictor of loneliness, and this relationship held when controlling for other demographic characteristics. As Figure 5 shows, compared to straight people, gay or lesbian people were 1.4 times more likely to be lonely, and bisexual people 2.5 times more likely. People who identified their sexual orientation as ‘other’ were 2.3 times more likely to be lonely than heterosexual people.
Figure 5: Odds ratio of being lonely by sexual orientation - Understanding Society Wave 9
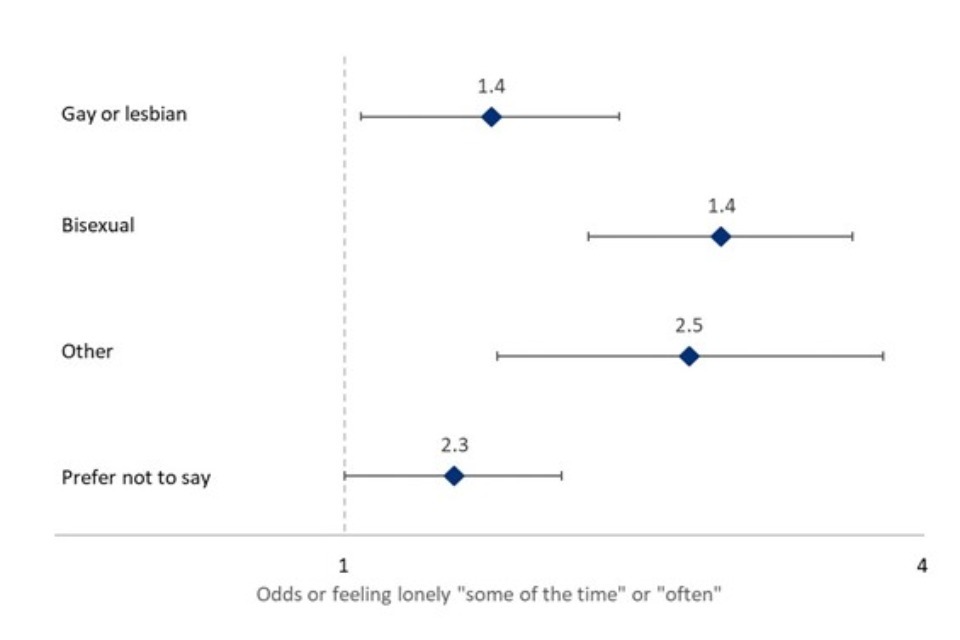
Odds ratio plot showing that gay or lesbian or Bisexual people or people reporting other sexual orientation had higher odds of experiencing transient loneliness than heterosexual people.
Combinations of protected characteristics may compound individuals’ risk of experiencing loneliness. To test this hypothesis, interaction effects were added to the logistic regression models outlined above to explore whether the intersection of protected characteristics predicted loneliness. Each possible two-way interaction between age, gender and ethnicity was tested in separate models to investigate this.
-
Loneliness and age - Models estimated with an age-sex interaction suggested that the relationship between loneliness and age was consistent for both men and women, with older people consistently less likely to report being lonely amongst both men and women.
-
Sex and ethnicity - From models including an interaction between ethnicity and sex, we found that within each ethnicity, women had a higher risk of loneliness than men.
-
Age and ethnicity - Models including an interaction between age and ethnicity suggest that the relationship between ethnicity and loneliness was not significant across all age groups. Models estimated with an age-ethnicity interaction provided some evidence that amongst people aged 55-64, Black, Asian and people who identified as an ‘other’ ethnicity were more likely to be lonely than White people of the same age. However, among young people (aged 16-34-year-old), Black and Asian people were less likely to be lonely than White people.
However, it should be noted that all models with interaction effects, particularly those looking at ethnicity, involve sub-groups of as little as 30 and some relationships may not be identified due to small sub-group sizes. Therefore, further research is required to understand better the relationships between the intersection of ethnicity, age and gender and loneliness in greater detail.
Summary of the risk of loneliness for people with protected characteristics:
-
The risk of experiencing loneliness was greater for gay, lesbian and bisexual people, as well people who selected ‘other’ to heterosexuals.
-
Ethnicity by itself did not predict loneliness, but it did interact with age and sex. In particular, among 16-34 year olds, Black and Asian people were less likely to be lonely (compared to white people), while among those aged 55-64, Black and Asian people, and those who reported their ethnicity as ‘other’, were more likely to report being lonely.
-
People’s social class (NSSEC-7) was also associated with loneliness, with people from semi-routine professions more likely than those in management or professional roles to report loneliness, even when controlling for their household income.
8. How does loneliness relate to mental wellbeing?
Loneliness was strongly associated with other measures of individuals’ wellbeing. This was measured using the ONS’s four wellbeing measures, as included in the CLS. These are designed to capture respondents’ level of life satisfaction, happiness, anxiety and feeling that life is worthwhile on an 11-point scale from 0 (“not at all”) to 10 (“completely”).
For this analysis, respondents are considered to have positive outcomes in the areas of life satisfaction, happiness and feeling that life is worthwhile if they responded 5 or higher to each of these questions. This approach was reversed for the anxiety scale, with respondents who selected a score of 5 or lower considered to have a positive outcome in this wellbeing area, due to the focus of this question being on negative experiences.
As shown in Figure 6 rates of chronic loneliness were more than ten times higher amongst people with negative than with positive outcomes in three out of the four wellbeing areas. This was the case for measures relating to:
-
Life satisfaction (34% compared to 3%);
-
Happiness (30% compared to 3%);
-
Feeling that life is worthwhile (36% compared to 3%).
Rates of chronic loneliness were also three times higher amongst people with high levels of anxiety than those with low levels of anxiety (13% compared to 4%).
Wellbeing measures were important predictors of chronic loneliness even when controlling for respondents’ age, sex and ethnicity through binary logistic regression models.
Figure 6: Levels of chronic loneliness by wellbeing outcomes - CLS 2019/20
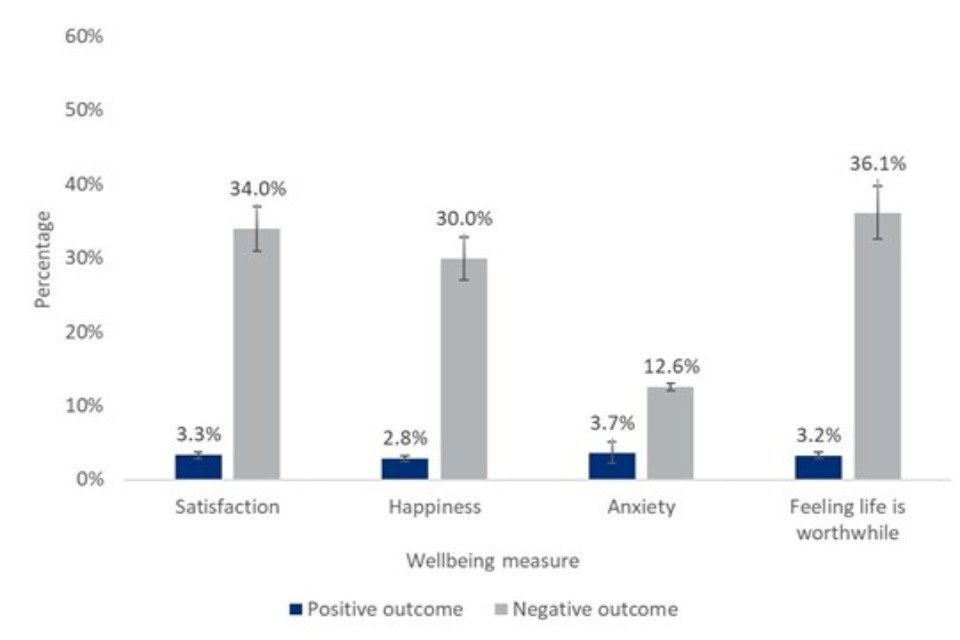
Bar chart showing that people with positive wellbeing outcomes were consistently less likely than those with negative wellbeing outcomes to experience chronic loneliness.
The relationship between loneliness and mental distress
Analysis of Wave 10 of Understanding Society reveals a close association between chronic loneliness and mental distress. As Figure 7 shows, chronically lonely people made up just 4% of those without mental distress, but 28% of those experiencing mental distress. Similarly, people with mental distress made up 15% of those who were not chronically lonely, but 60% of those experiencing chronic loneliness.
Figure 7: Levels of chronic loneliness by mental distress and levels of mental distress by chronic loneliness - Understanding Society Wave 10
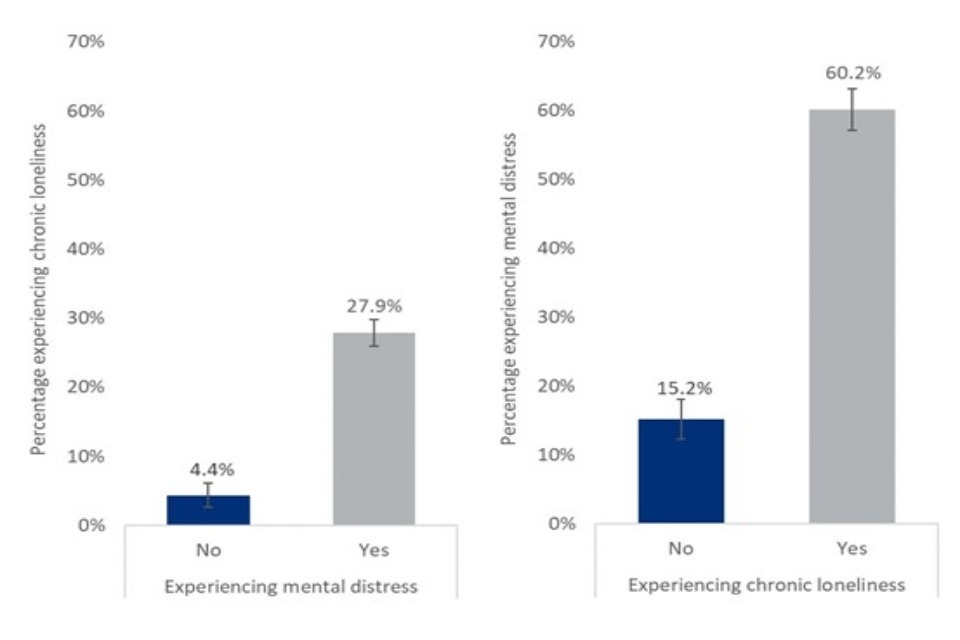
Two bar charts showing that people experiencing mental distress were five times as likely to experience loneliness than people without, and people experiencing loneliness were four times as likely to experience mental distress than non lonely people.
Having established a clear association at a single point in time, two sets of binary logistic models were estimated to investigate the relationship between loneliness and mental wellbeing. These models used data collected from the same individuals in Wave 9 and Wave 10 of Understandings Society, with outcomes used from the most recent data.
The first set of models used loneliness and the second used mental distress as the outcome variable. These models included lagged predictors, as collected in Wave 9, to investigate whether prior chronic loneliness (measured in Wave 9) was associated with subsequent mental distress (measured in Wave 10), and whether prior mental distress (measured in Wave 9) was associated with subsequent chronic loneliness (measured in Wave 10). All models controlled for gender, ethnicity, age, relationship status, employment status, disability and income quintile.
The impact of past mental distress on loneliness
-
People who experienced prior mental distress were 4.2 times more likely to experience subsequent chronic loneliness than those who did not experience earlier mental distress.
-
This may be because mental distress prolongs (existing) loneliness, because it initiates loneliness, or a combination of both. To investigate this further, two separate logistic regression models were estimated; the first was built using only data collected from people who were already lonely at the first time point and the second included only data from people who were not.
-
Amongst those who were already lonely, people with prior mental distress were 1.6 times more likely to report loneliness at the later time point than people with no prior mental distress; and
-
Amongst those who were not already lonely, people with prior mental distress were 2.8 times more likely to report loneliness at the later time point than people with no prior mental distress;
-
Taken together, this suggests that prior mental distress increases the chances of both the continuation and onset of chronic loneliness.
The impact of past loneliness on mental distress
-
Prior chronic loneliness was also a predictor of mental distress. Those who reported prior chronic loneliness were 3.7 times more likely to experience subsequent mental distress than those who were not previously lonely.
-
However, as in the previous analysis investigating the impact of past mental distress on loneliness, this may be because loneliness prolongs (existing) mental distress, because it initiates mental distress, or a combination of both.
-
Therefore, separate models were also estimated for people who had and who had not been experiencing prior mental distress to investigate this further.
-
Amongst people who had already experienced mental distress, people who had prior chronic loneliness were 1.7 times more likely to report subsequent mental distress than those who did not experience prior loneliness.
-
Amongst those who did not report prior mental distress, people reporting prior chronic loneliness were 2.9 times more likely to experience later mental distress than those who did not report being lonely at the earlier time point.
-
Therefore, while past loneliness was a significant predictor of the continuation of mental distress, chronic loneliness appears to have had a greater impact on the mental health of those who had not previously experienced mental distress.
It should be noted that this analysis focuses on data collected within a relatively short time span, with around one year between respondent interviews for the different waves of Understanding Society. Therefore, further investigation would be required to better understand the longer-term relationships between these factors.
Summary of the relationship between mental wellbeing and loneliness:
There was considerable overlap between mental wellbeing and loneliness. In particular:
-
People who reported loneliness were more likely than those who did not to report mental distress, and similarly people who reported mental distress more likely to report feeling lonely.
-
A clear two-way relationship between mental wellbeing and loneliness was identified in Waves 9 and 10 of Understanding Society.
-
People experiencing mental distress were more likely to start being lonely (if they had not initially reported experiencing loneliness) or continue to be lonely (if they had already felt lonely) one year later.
-
People experiencing loneliness were more likely than people who had not been lonely to continue to experience mental distress one year later. Pre-existing loneliness was an even stronger predictor of the onset of mental distress amongst those who had never experienced mental distress before.
9. Have the risk factors for loneliness changed over time?
To investigate if the relationship between the risk factors outlined above and loneliness have changed over time, repeated cross-sectional analysis of the CLS was conducted for data collected between 2013/14 (the first year all relevant data was collected) and 2019/20 (the latest wave of the CLS to be completed before the COVID-19 pandemic). From 2016/17, however, there were changes to the CLS survey mode, as it moved to an online/paper-based self-competition questionnaire only and no longer included any face-to-face interviews. The sample size available for analysis was also considerably larger from the 2016/2017 wave of this study.
-
Relationships between loneliness and key risk factors - Key risk factors for loneliness were largely consistent across each survey wave. As outlined in earlier sections these were: poor health or wellbeing, not being in work, not living in a couple and living in an area with higher deprivation. The magnitudes of these relationships have also remained largely similar across survey years.
-
Relationship between loneliness and wellbeing - The gap in loneliness levels between people with high and low life satisfaction, happiness, anxiety and feelings that life is worthwhile appears to have widened over this time period [footnote 2]. People who reported high levels of life satisfaction were no more likely to report chronic loneliness in 2019/20 than they were in 2016/17, but people with low levels of life satisfaction were more likely to report chronic loneliness than they had been three years earlier (Figure 8).
Figure 8: Levels of chronic loneliness by low and high life satisfaction - CLS 2016/17 to 2019/20
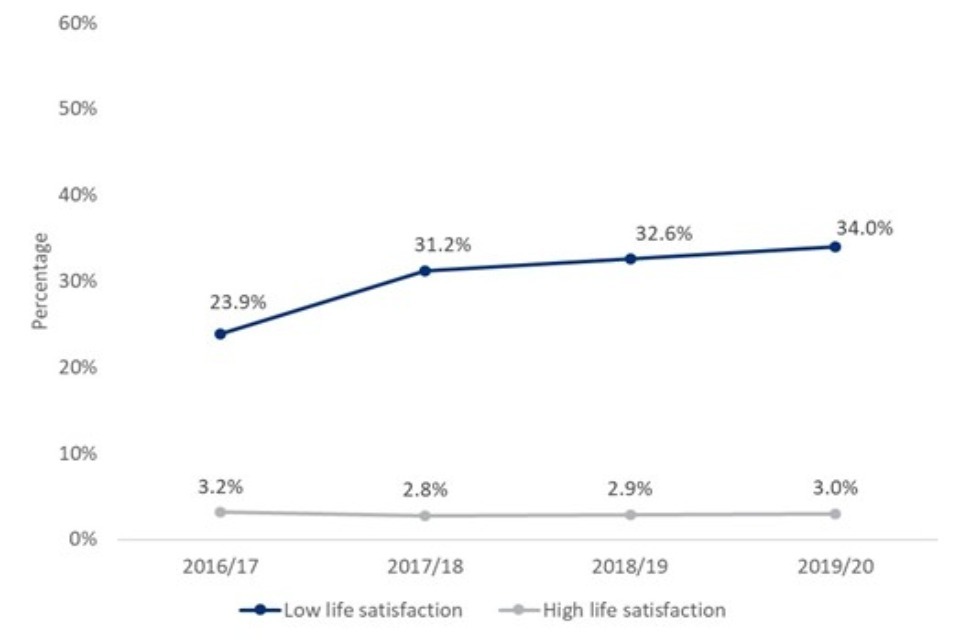
Line chart to share that the gap in loneliness between people with high and low levels of life satisfaction widened between 2016/17 and 2019/20.
Other variables of interest were only significantly associated with loneliness in a limited number of survey years for which there appears to be no overall trend over time.
-
Not having a university degree [footnote 3]
-
Living in an urban area [footnote 4]
-
Living at current address for under 12 months [footnote 5]
These variables were not, therefore, consistent risk factors for chronic loneliness across all survey years.
Summary of the changes to risk factors for loneliness over time in the CLS:
-
Poor health and wellbeing, being out of work, not living in a couple, and living in a deprived area have all remained consistent predictors of chronic loneliness in data collected by the CLS between 2016/17 and 2019/20.
-
However, over time wellbeing seems to have become a more important risk factor: low levels of life satisfaction and feelings that life is not worthwhile have become more strongly associated with chronic loneliness in recent years.
-
Other factors had inconsistent relationships with loneliness over time. Not having a university degree, living in an urban area and having moved recently to their current address were all risk factors for loneliness in some, but not all, survey years.
10. Short Term Factors that Predict the Alleviation of Loneliness
According to Understanding Society data, 9% of the population was experiencing chronic loneliness in Wave 9. By Wave 10, 48% of previously lonely people were still lonely, and 52% were no longer lonely. To investigate the factors that predicted the alleviation or the continuation of loneliness, binary logistic regression models were estimated using a subset of respondents who were lonely in Wave 9. These models were used to identify the factors that predicted the alleviation - rather than continuation – of people’s loneliness over the short-term (between Waves 9 and 10).
Across the whole sample, three factors made someone more likely to stop being lonely:
-
Living with a partner;
-
Having good mental wellbeing and;
-
Having no disabilities or long-term health conditions.
Figure 9 demonstrates the relationship between physical and mental health and loneliness alleviation estimated in the binary logistic regression models.
Figure 9: Odds ratio of loneliness alleviation for people without a disability or long-term condition and people without mental distress - Understanding Society Wave 9
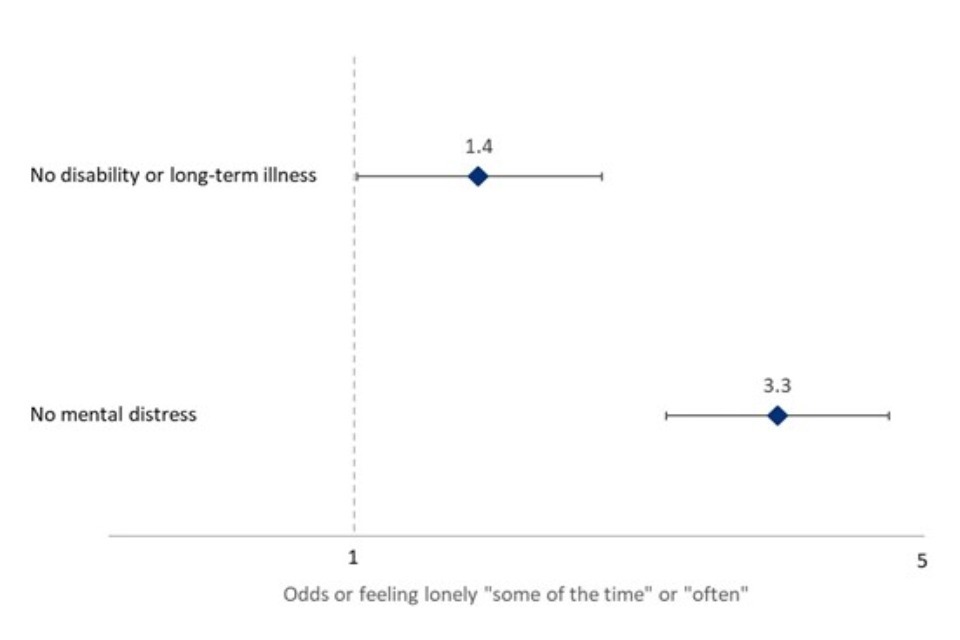
Odds ratio plot showing people without a disability were 1.4 times more likely to stop feeling lonely compared to disabled people, while people without mental distress were 3.3 times more likely to stop feeling lonely than those with mental distress.
These models were stratified by age group to investigate variations by age.
-
Living with a partner only predicted the alleviation of pre-existing loneliness amongst the oldest age group. Amongst people aged 65 or older who were already lonely, living with a partner increased the odds of no longer being lonely by 3.8 times.
-
Respondents’ relationship status was not associated with loneliness in any other age group.
Strong mental wellbeing was associated with the alleviation of loneliness in all age groups. However, disability was not a predictor of the alleviation of loneliness amongst any age group, despite being an important predictor when models were estimated for the overall population. This is likely reflecting the very small number of disabled people in each age group with prior loneliness; smaller sample sizes increase the uncertainty in estimates, making significance harder to detect. More research on the alleviation of loneliness in disabled people over the life course may be required.
It should be noted that these three factors are ‘short-term’ in that they predicted the alleviation of loneliness over two waves of Understanding Society. Arguably, none of these factors are changes individuals can reasonably make to alleviate loneliness themselves in the short term. This does, however, give insight into who is more prone to loneliness over successive time periods, and indicates the value of mental health support for lonely people who may not yet be experiencing mental distress.
Summary of factors associated with the short-term alleviation of loneliness
-
When analysing all age groups together, living with a partner, good mental wellbeing and not having disabilities or long-term health problems were all associated with the alleviation of loneliness.
-
When different age groups were analysed separately, strong mental wellbeing remained important in all age groups, while living with a partner was a protective factor only among people aged 65 or over and not having a disability was no longer an important predictor in any age group.
-
This suggests that measures to improve mental health would be an effective tool to help alleviate loneliness across different age groups.
11. Conclusion
This report has provided further evidence for risk factors for loneliness identified in previous research. Analysis of both the CLS 2013/14-2019/20 and Understanding Society Waves 9 and 10 found that women, young people, those who live alone and those who were widowed were at a greater risk of loneliness. These relationships appear to have been largely consistent over time, with analysis of the CLS consistently finding these to be risk factors for loneliness. Wellbeing outcomes (life satisfaction, happiness, anxiety and feeling that things are worthwhile), were also consistent risk factors for loneliness over this time period, but there is evidence to suggest that the strength of the relationship between some wellbeing outcomes and loneliness has increased in recent years.
While the relationship between demographic characteristics and life experiences was largely consistent for both direct and indirect measures of loneliness, there was evidence from analysis of the CLS that people from Asian ethnic backgrounds were more likely than people from White ethnic backgrounds to be identified as lonely when the indirect measure was used, but not when responses to the direct question about loneliness were analysed. Therefore, the relationship between loneliness and ethnicity may be overlooked if only the direct measure of loneliness is relied upon.
This report has also identified additional groups of people at risk of loneliness. In particular, it highlights how people with protected characteristics or at greater risk of social exclusion, such as women, members of the LGBTQ+ community and people in lower socio-economic grades, were all found to be at greater risk of loneliness, even when controlling for other socio-economic and demographic factors. The evidence as to the relationship between intersecting protected characteristics and loneliness was less clear, likely due to small sub-group sizes. Further research into this area would be required to understand this better.
This report also highlights the unique risk factor profile for loneliness amongst young people, who were themselves found to be at a greater risk of loneliness. Sex and income were found to be key determinants of loneliness for young people, despite being insignificant for older age groups who were more impacted by relationship and work status. This suggests that initiatives aimed at alleviating loneliness likely need to be tailored to meet the needs and pressures of different people at different stages of the life course.
Although there was little clear and consistent evidence as to the factors that predict the alleviation of loneliness from this secondary data analysis, it does appear that some groups (including people with a disability or long-term health condition and people with moor mental health) are more likely to experience prolonged loneliness, as well as being more likely to experience chronic loneliness at any individual time point.
This report demonstrated a close association between mental wellbeing and loneliness. The findings in this report suggest that mental distress and loneliness have a two-way relationship; pre-existing loneliness increases the risk of subsequent mental distress, while pre-existing mental distress increases the risk of subsequent loneliness. The impact of loneliness on people’s mental health appears to be greater for people who had not previously experienced loneliness than those who had reported feeling lonely for a prolonged period of time. This suggests that mental health interventions to help people when they first experience loneliness may be particularly valuable. Given the high level of demand for mental health services across England, including for long term mental health problems, interventions that aim to alleviate loneliness may not only improve individuals’ mental wellbeing but also have a potential knock on effect to public health services in local areas.
-
Where findings refer to ‘chronic loneliness’ this includes people who reported that they often or always feel lonely. Where reference is only to ‘loneliness’, this also includes people who reported feeling lonely sometimes. ↩
-
When comparing levels of loneliness between 2016/17 and 2019/20 only, there is evidence to suggest that the relationship between wellbeing and loneliness has increased. This suggests that this is not driven, at least just by changes to the survey mode in 2016/17, when the biggest changes were recorded in the data. ↩
-
Not having a university degree was a significant risk factor for experiencing chronic loneliness in 2013/14, 2015/16, 2017/2018 and 2019/20. In other years, people without a degree were found to be no more likely than those with a degree to report feeling lonely “often/always”. ↩
-
Living in an urban area was a significant risk factor for loneliness in all except for two survey years (2016/17 and 2019/20) ↩
-
Having lived at a current address for under 12 months was only a significant predictor of chronic loneliness in 2014/15, 2016/17, 2018/19 and 2019/20. ↩