Grading gaps in summer 2020: who was affected by differences between centre assessment grades and calculated grades?
Updated 2 August 2021
Applies to England

© Crown copyright 2021
This publication is licensed under the terms of the Open Government Licence v3.0 except where otherwise stated. To view this licence, visit nationalarchives.gov.uk/doc/open-government-licence/version/3 or write to the Information Policy Team, The National Archives, Kew, London TW9 4DU, or email: psi@nationalarchives.gov.uk.
Where we have identified any third party copyright information you will need to obtain permission from the copyright holders concerned.
This publication is available at https://www.gov.uk/government/publications/evaluation-of-centre-assessment-grades-and-grading-gaps-in-summer-2020/grading-gaps-in-summer-2020-who-was-affected-by-differences-between-centre-assessment-grades-and-calculated-grades
Authors
- Philip Noden
- Eleanor Rutherford
- Nadir Zanini
- Tim Stratton
- James Bowsher-Murray
Acknowledgements
The authors would like to thank colleagues from Ofsted, the Department for Education and Ofqual for their invaluable input into this research project as part of the GRADE (Grading and Admissions Data for England) joint initiative.
Executive summary
In response to the COVID-19 pandemic, the government decided that students would not sit public examinations, including A levels, that were due to be taken in May and June 2020. It was planned that A level results would be awarded on the basis of a calculated grade which aimed to standardise teacher assessments. Calculated grades did not command public confidence and Ofqual instructed the exam boards to reissue grades. Instead, the Centre Assessment Grade (CAG) was awarded when this was higher than the calculated grade. In this report, we focus on candidates whose CAGs were higher than the calculated grades which they were initially awarded. In particular, we look at whether candidates with specific characteristics were more likely to be affected by discrepancies in grades between their CAGs and calculated grades.
CAGs were based on teachers’ judgements of their students’ expected performance; they represented the grades teachers believed candidates would have achieved if exams had taken place. Schools and colleges submitted the expected grade for each of their students for each subject taken. Alongside this information, a rank order of students within each grade was also supplied.
The calculated grade was the outcome of a standardisation method implemented by exam boards following guidance developed with Ofqual. It was derived on the basis of the ranking information provided by centres relating to each student in each subject, alongside the centre’s historical performance and the prior attainment of current students in those subjects. This process aimed both to ensure that the overall pattern of results for the 2019/20 cohort mirrored grade distributions of previous years to avoid grade inflation, and also to provide a means of standardising grades across centres.
Calculated grades were issued to A level candidates on results day, Thursday 13th August. For many students, the calculated grades were different to the grades their teachers had proposed as their CAG. Some of these candidates naturally expressed their concerns and it became apparent that calculated grades did not command public confidence. Consequently, on 17th August Ofqual instructed awarding bodies to reissue candidates’ grades, awarding whichever was the higher of the CAG and calculated grade for each A level qualification. This is referred to as the ‘final grade’.
For most A level entries, the calculated grade was the same as the CAG (59%). Calculated grades were higher than CAGs in a small proportion of cases (just over 2%). But, in most instances where there were differences, teachers’ assessments of grades were higher than the results produced by the standardisation method (39% of entries).
As previously highlighted, some 68% of candidates saw at least one of their A level subjects upgraded when final grades were issued. We are unable to identify those for whom the discrepancy between CAG and calculated grades caused greatest distress or had the greatest consequence, but we can identify those for whom the discrepancy was largest. For some candidates, the calculated grade results for their package of A level qualifications were together considerably lower than the grades assessed by their teachers. Overall, 10.3% of candidates received calculated grades that were, in total, three grades or more lower than their CAGs. These candidates could, for example, have received one calculated grade which was three grades lower than the CAG, or three calculated grades that were each one grade lower than the CAG.
Data relating to CAGs and calculated grades will be available to the research community, through a secure process that maintains student confidentiality, and this will facilitate further analysis. As part of this process, Ofqual, Ofsted and the DfE have jointly completed some initial exploration of the data to exemplify potential research and analytical approaches, and to increase our understanding of 2020 assessment outcomes.
This paper presents findings from this initial research, and examines what factors are associated with the likelihood of candidates receiving calculated grades that were different from their CAGs and, in particular, with calculated grades three grades or more lower than their CAGs across their A level qualifications (henceforth referred to as a three-grade gap or three-point grading gap).
Descriptive statistics are presented showing the relationship between candidate characteristics and the likelihood of receiving a three-grade gap. The report then presents multivariate analysis to examine associations between candidate characteristics and the likelihood of a grading gap, using multilevel modelling to reflect the hierarchical structure of the data. First, we examine whether associations remain when candidates are clustered within schools, colleges and other providers. Second, the analysis takes into account the subjects studied by A level candidates. Finally, A level entries are cross-classified within candidates and within subject groups within centres.
The results show that, taking centres and subject choices into account, there is no evidence that candidates’ socio-economic background, SEND status or the language spoken at home were associated with the likelihood of receiving a three-grade gap. There was some evidence that females and Asian and British Asian students were more likely to receive a three-grade gap than males and white students respectively, but the effect sizes were very small. More precisely, the model predicts that a white female candidate, attending the median school or college, would have a 15.7% likelihood of experiencing a three-grade gap. If that candidate were male the probability of a three-grade gap would be 14.5%. The corresponding probabilities for female and male Asian candidates would be 17% and 15.6%.
It is therefore possible to conclude that in summer 2020 the likelihood of experiencing a three-grade gap between CAGs and calculated grades was not systematically and substantially higher for specific groups of students. These findings echo early evidence that students with protected characteristics or from low socio-economic backgrounds were not disadvantaged (Lee, Stringer & Zanini, 2020). As documented in this report, a large number of A level students may have experienced distress arising from differences between CAGs and calculated grades in summer 2020. It is not possible to know whether the CAG or the calculated grade more accurately reflected the grade students would have achieved had they taken the exams. However, these results are reassuring in so far as they suggest candidates with protected characteristics or from disadvantaged groups were not systematically and substantially more likely to experience grade discrepancies.
Introduction
In March 2020, due to the coronavirus pandemic, it was announced that public examinations scheduled for the summer would not take place. To allow candidates to complete their qualifications and progress to their next stage of education or career, it was decided that calculated grades should be awarded on the basis of the best available evidence. In order to protect examination standards, this was to include a method to standardise results across centres and to ensure that the distribution of results had a similar profile to previous years.
To support this process, centres (usually schools and colleges) were asked to provide two pieces of information relating to each qualification entered by each student:
- a Centre Assessment Grade (CAG) which indicated the grade they were judged most likely to have achieved had the exams taken place
- a rank order of candidates within each grade
Each set of CAGs and ranks for an individual subject within a centre was signed off by two teachers, and the head of centre made a declaration that the grades submitted reflected the objective judgements of the centre’s staff (Ofqual, 2020a). Qualitative evidence illustrating how teachers arrived at their judgements is presented in Holmes et al (2021).
The development and operation of the standardisation method used by Ofqual is fully described in Ofqual’s interim technical report (Ofqual, 2020b). In summary, the method retained the ranking of students which had been provided by centres. However, the grade profiles for individual subjects within centres were adjusted to reflect the historical performance by students at the centre, and the prior attainment (GCSE performance) of the current cohort.
The standardisation method is summarised on page 93 of the interim report in the form shown below. In this formulation, Pkj represents the proportion of students from centre j, achieving grade k or higher.
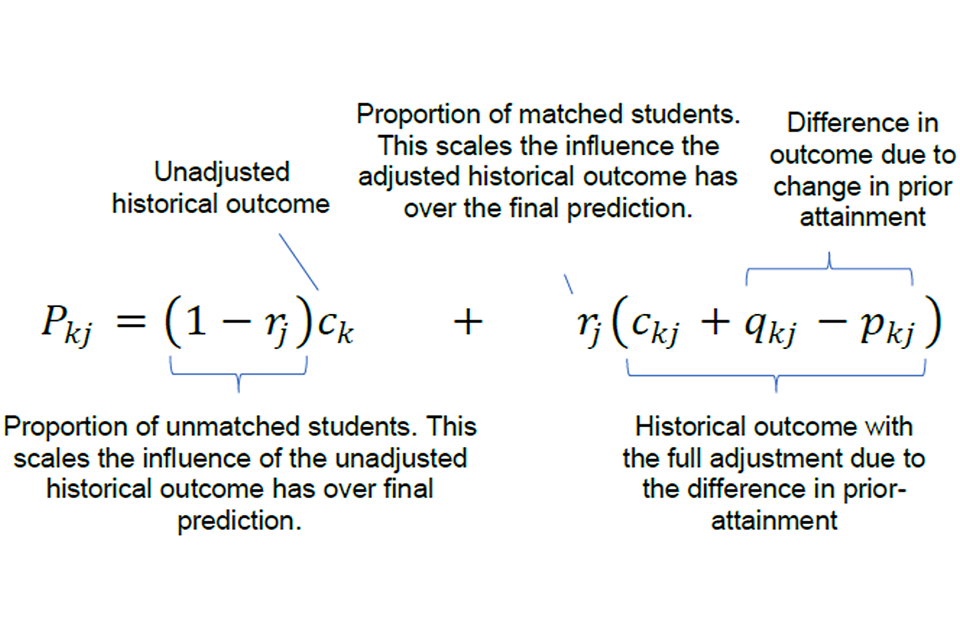
This equation is explained under 'Step 6: Determine the centre-level predicted grade distribution for summer 2020' in the document 'Awarding GCSE, AS, A level, advanced extension awards and extended project qualifications in summer 2020: interim report'.
For most candidates, the allocated grade was determined by applying this standardisation method to the centre’s ranking of candidates. It was decided that this approach would not be applied to very small groups of students (fewer than five candidates studying a subject within a centre) because the statistical basis for calculated grades was deemed to be too weak. In these cases therefore, the CAG was used without standardisation. For subject cohorts with five to 15 candidates, a taper was used which applied a linear weighting between the CAG outcomes and the calculated grades.
On A level results day, 13th August 2020, candidates received their calculated grades. However, it became clear that calculated grades did not command public confidence. Even in a normal year, A level results day is highly emotive. Some candidates’ plans are realised while others confront new sets of decisions about their future. In 2020 this was made all the more distressing by an unfamiliar grading method and apparent discrepancies between the grade judgements of teachers and the calculated grades which students received.[footnote 1] As a result of the lack of public confidence, on Monday 17th August Ofqual announced that candidates would receive as their ‘final grade’ whichever was the higher grade out of their CAG and their calculated grade.
It is important to be clear that the standardisation method was applied at the level of an individual subject within a centre. That is, the calculated grades method was applied to, for example, A level history within a particular school. The ranking within this group of candidates was the same for CAGs as for calculated grade outcomes. It is also important to be aware that it is impossible to know, for any individual candidate, whether the CAG or the calculated grade more accurately reflected the grade that they would have achieved had examinations gone ahead.
We might think of the incidence of discrepancies between CAGs and calculated grades as arising in one of three ways. First, they could arise at the level of the centre. For example, the calculated grades for some schools may have been adjusted to a greater degree in order to bring grades into line with past performance, once prior attainment of candidates at the centre was accounted for. Secondly, subjects within centres could similarly have a larger or smaller incidence of discrepancies. Thirdly, groups of candidates could vary in their probability of being ranked in a position making them more likely to experience a grade discrepancy – for example, if a group of candidates were more likely to be ranked in a lower position within the grade.
This analysis follows on from the equalities analysis published in December 2020 (Lee, Stringer & Zanini, 2020). The equalities analysis compared 2020 A level and GCSE outcomes with outcomes in the two previous years when examinations took place in the normal way. The analysis concluded that, overall, the 2020 grades – whether CAGs, calculated grades, or final grades – did not introduce new or exacerbate existing attainment differences associated with candidate characteristics. At A level there was one statistically significant difference in the relationships between candidate characteristics and outcomes in 2020 compared with previous years. This was a narrowing of the gap between male and female candidates in 2020. In previous years male candidates had received higher grades than female candidates but in 2020 this gap closed.[footnote 2]
This report differs from the equalities analysis and focuses specifically on candidates who were affected by discrepant grades. The question we address here is:
Were candidates with different characteristics more likely to receive calculated grades which were lower than their Centre Assessment Grades?
That is, we focus on candidates whose Centre Assessment Grades were higher than their calculated grades and who therefore may have been disappointed on results day and relieved some days later when final graded were awarded.
The equalities analysis (Lee, Stringer & Zanini, 2020) examined the relationship between prior attainment, candidate characteristics and grade outcomes. The analysis concluded that candidate-level protected and socio-economic background characteristics were comparably predictive of both CAGs and calculated grades.[footnote 3]
In the current analysis of grading gaps, presented in this report, we have used the same candidate characteristics, but this time our outcome of interest is the difference between a candidate’s CAG and their grade as standardised by the calculated grade method. The outcome variable is whether there was an adjustment made by the standardisation method. Given the findings of the equalities analysis, we might reasonably expect that there would not be strong associations between individual level candidate characteristics and grading gaps. The aim of this report is to provide empirical evidence to confirm whether there is any pattern in the data that may suggest that specific groups of candidates were systematically affected by discrepancies between CAGs and calculated grades.
This report does not set out to explain the variation in the incidence of grading gaps between centres. Analysis of CAGs, including variation in grades across centres, is however presented in a separate report (Stratton, Zanini & Noden, 2021).
Data
This report presents analysis of the same dataset that was used for the Ofqual equalities analysis (Lee, Stringer & Zanini, 2020), and a full description of the data may be found on pages 14-21 of that report. The dataset comprises the Ofqual examination results dataset, matched to socioeconomic and demographic variables from the National Pupil Database provided by the Department for Education. In the current analysis, the dataset was filtered to focus only on candidates from England and aged 18 at the end of the school year. Candidates without valid entries for their unique candidate identifier or their A level grades were excluded. Data included in the analysis comprised 457,420 A level entries from 246,110 candidates.[footnote 4]
For 16.8% of candidates, their A level data did not match successfully to the National Pupil Database. Candidates attending independent schools and sixth form colleges were particularly unlikely to match. Consequently, demographic information was missing for more than 40% of candidates attending each of these types of centre.
The independent variables of primary interest in this report related to candidates’ socio-demographic and educational characteristics. Candidates’ gender was indicated in the Ofqual standardisation data. Special educational needs status was identified through the National Pupil Database data and candidates with either an Education and Health Care Plan or who were receiving special educational needs support were indicated by a binary variable. The National Pupil Database was also the source for identifying eligibility for free school meals, the quintile of area deprivation of the pupil’s home postcode (as indicated by the Income Deprivation Affecting Children Index, IDACI) and the quintile of their mean GCSE prior attainment score. Students for whom demographic information was missing were included in the analysis. This is because all of the independent variables were categorical and for each variable a missing data category was included in the analysis.
Some descriptive statistics
CAGs and calculated grades for A level entries
The relationship between CAGs and calculated grades is shown in Figure 1. We see that for most entries, the CAG was the same as the calculated grade. We also see that for each CAG a substantial proportion of entries were given a calculated grade which was one grade lower. In addition, we see that for smaller proportions of entries the calculated grade was higher than the centre assessment grade. Also, in a small proportion of cases the discrepancy between CAG and the calculated grade is greater than one grade. It should be noted that the thin lines (also shown in a lighter shade in Figure 1) are not shown to scale.[footnote 5]
Table 1 provides greater detail relating to the numbers represented in Figure 1. It again shows the relationship between the CAG, provided by schools and colleges in May 2020, and the calculated grade which was awarded on results day. For example, 179,700 entries received a grade B as their CAG. Of these, 59% were also graded B as their calculated grade. Of the remaining 41% of entries where the calculated grade was different from the CAG, the vast majority received a C grade with just 1% of B grade CAGs being adjusted to an A or A* grade and 3% of B grade CAGs being adjusted to a D grade or lower.
Across all entries shown in the table, in most cases (59%) the CAG was the same as the calculated grade – that is, 59% of cases lie on the main diagonal in Table 1. For a small proportion of entries (3%) the gap between the CAG and the calculated grade was of more than one grade. In the remaining 38% of cases, the CAG was one grade different from the calculated grade.
Figure 1. Relationship between Centre Assessment Grades and calculated grades – thin lines in lighter grey represent fewer than 1,000 entries are not shown to scale (n=457,420)
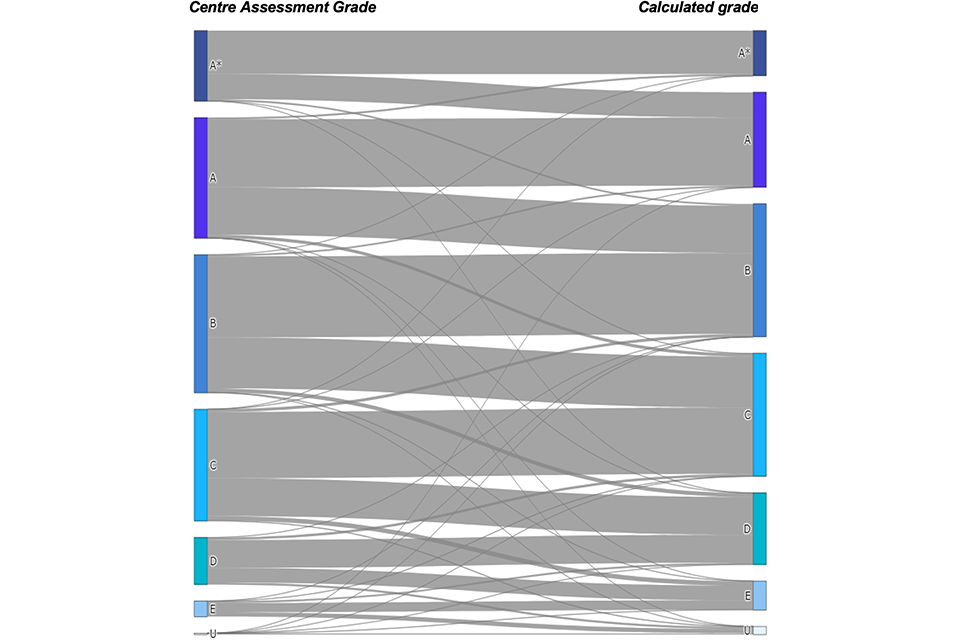
Sankey diagram showing the relationship between A level Centre Assessment Grades and calculated grades in summer 2020. Numbers underlying the diagram are shown in Table 1.
In most cases where there was a discrepancy, the CAG was one grade higher than the calculated grade. Thus, overall, for a substantial minority of entries (41%) the calculated grade was not equal to the CAG, and in the vast majority of these discrepant cases the calculated grade was lower than the CAG (39%).
It should be noted that the proportion of entries for which the CAG was higher than the calculated grade varied across subjects. Among relatively popular subjects (those with more than 5,000 entries), this ranged from biology, in which 51% of entries had a higher CAG than calculated grade, to product design, for which the figure was 23% (all subjects with more than 5,000 entries are shown in Appendix, Table A1).
Table 1. Relationship between Centre Assessment Grades and calculated grades (n=457,420)
| N | Calc grade A* | Calc grade A | Calc grade B | Calc grade C | Calc grade D | Calc grade E | Calc grade U | |
|---|---|---|---|---|---|---|---|---|
| CAG A* | 91,950 | 61 | 36 | 3 | ~ | ~ | 0 | 0 |
| CAG A | 156,920 | 1 | 56 | 39 | 3 | ~ | ~ | ~ |
| CAG B | 179,700 | ~ | 1 | 59 | 37 | 3 | ~ | ~ |
| CAG C | 145,530 | ~ | ~ | 2 | 59 | 34 | 4 | ~ |
| CAG D | 61,240 | 0 | 0 | ~ | 5 | 59 | 31 | 4 |
| CAG E | 20,260 | 0 | 0 | ~ | 1 | 11 | 60 | 28 |
| CAG U | 1,810 | 0 | ~ | ~ | ~ | 3 | 17 | 79 |
Note: Numbers have been rounded to the nearest 10, percentages rounded to the nearest whole percentage. Percentages less than 0.5% are represented by ~. Zero means that there were zero cases.
CAGs and calculated grades at candidate level
Most candidates study for more than one A level subject, and consequently the chances of a candidate having a discrepant grade for at least one entry was greater than for one single entry.
Here, for individual candidates, we cannot judge the scale of the consequences which followed from the change in grading from results day on 13 August, when calculated grades were issued, to the issuing of final grades on 17 August. For example, as university applicants know well, a single grade can be the difference between gaining or not gaining a university place. We can however identify the number of A levels in which candidates saw their grade increase from results day to final grades, and this is shown in Table 2. We see that 32% had no grade changes and therefore that 68% of candidates had at least one entry in which the CAG was higher than the calculated grade and hence was upgraded. This is in line with figures previously published (Ofqual, 2020c).
Table 2. Number of A levels in which candidates had a higher CAG than calculated grade (n=246,110)
| 0 | 1 | 2 | 3 | 4 | Total | |
|---|---|---|---|---|---|---|
| % of candidates | 32 | 39 | 23 | 7 | ~ | 100 |
| Number of candidates | 78,470 | 95,580 | 55,730 | 16,100 | 220 | 246,110 |
Note: Numbers have been rounded to the nearest 10, percentages rounded to the nearest whole percentage. Percentages less than 0.5% are represented by ~.
Although we are unable to identify those for whom the discrepancy between CAG and calculated grades caused greatest distress or had the greatest consequence, we can identify those for whom the discrepancy was largest. That is, we have added together the discrepancies – or gaps – between calculated grades and CAGs to calculate a ‘grading gap’ for each candidate. Consequently, a candidate given CAGs ABB who was given calculated grades ACD, would have a candidate-level grading gap of three grades – with the CAG higher than the calculated grades. The candidate-level distribution of grading gaps is shown in Figure 2.
We see that for just over 30% of candidates there was no difference between their aggregate CAGs and calculated grades. For most candidates, however, their CAG score exceeded their calculated grades total.
Figure 2. Candidate-level grading gaps
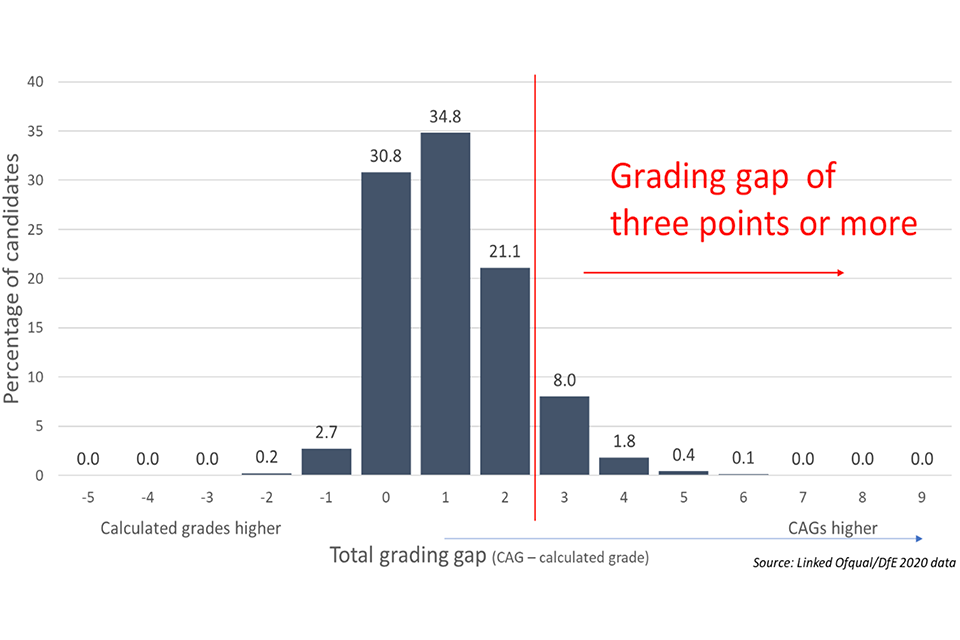
Proportion of candidates with different total grading gaps across all the A levels which they took in summer 2020 - discussed in the text.
Candidate-level three-grade gap
In our initial candidate-level analysis, we chose to focus on candidates whose CAGs exceeded their calculated grades by three points or more. This threshold was chosen balancing the proportion of candidates affected and the size of the grading gap.[footnote 6] Descriptive statistics relating to candidates’ characteristics and the incidence of a three-point grading gap are shown in Appendix table A2.
Different candidates may enter different numbers of A levels. Consequently, there are numerous ways in which a candidate could acquire a grading gap of three points or more. Figure 3 shows the most common combinations of entries and grading gaps which led to a gap of three or more. The largest bar, labelled ‘1 1 1’, indicates that there was a one-point grading gap in each of three A level subjects, which means that the standardisation method downgraded each of three entries by one grade. This was the case for more than 40% of candidates who had a grading gap of three points or more. The second bar shows that, among this group of candidates, in almost a quarter of cases a candidate had a CAG which was two points higher in one of their A level subjects, one point higher in a second and no gap for the third. The fourth column, labelled ‘2 1 –‘, relates to candidates who took two A levels, and had a two-grade gap for one entry and a one-grade gap for the other entry.
Figure 3. Candidates with a grading gap of three points or more, contribution of individual A levels to the grading gap
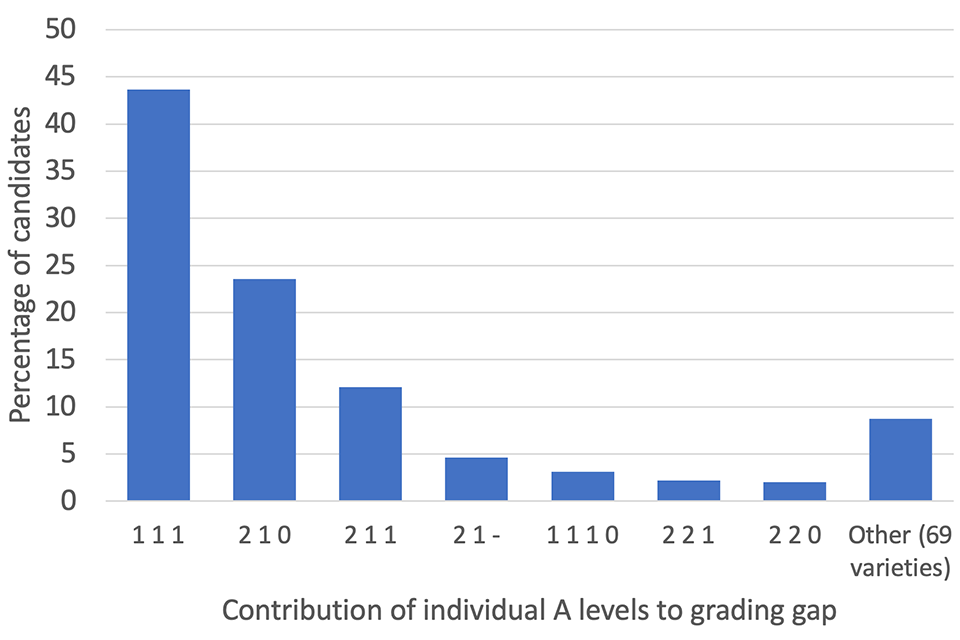
Candidates with a three point grading gap between CAGs and calculated grades in summer 2020, the proportion of candidates achieving the three point gap from different combinations of discrepancies - discussed in the text.
Analytical approach
We take two approaches to address the relationship between candidate characteristics and grading gaps. In the first instance we take a candidate-level approach, as our primary interest is in the outcomes experienced by candidates, and then an entry level approach. The models included in this report are summarised in Table 3.
Table 3. Summary of models
| Dependent variable | M1 3 point grading gap (or more) | M2 3 point grading gap (or more) | M3 3 point grading gap (or more) | M4 1 point grading gap (or more) | M5 1 point grading gap (or more) |
|---|---|---|---|---|---|
| N | 82,830 | 82,830 | 82,830 | 248,490 | 450,810 |
| Level 1 | Candidate | Candidate | Candidate | Entry | Entry |
| Level 2 | Not applicable | Centre | Centre | Candidate | Candidate |
| Level 2a | Not applicable | Not applicable | Not applicable | Subject within centre | Subject within centre |
| Candidate-level characteristics: - Gender - Major ethnic group - Language group - SEN - FSM - IDACI quintile - Prior attainment quintile |
Yes | Yes | Yes | Yes | Yes |
| Subject fixed effects: - 49 binary variables for subject groups |
No | No | Yes | No | No |
The candidate-level approach uses the presence or absence of a three-point grading gap as its binary dependent variable. Clearly, the likelihood of having a three-point grading gap would be affected by the number of A levels a candidate had entered. A candidate sitting only one A level would be extremely unlikely to have a three-point grading gap compared with a candidate taking three A levels. Consequently, we focused our attention only on candidates taking three A levels. Descriptive statistics relating to the subset of candidates taking three A levels are also shown in Appendix table A2.
We then use logistic regression to model how likely it was that a candidate was downgraded by three or more grades, including our set of demographic characteristics as explanatory variables. As the model is predicting the log odds of having a grading gap, we exclude candidates who, in any of their three subjects, were in a cohort of fifteen or fewer candidates. This is because for the smallest cohorts of candidates (cohorts of fewer than five) there was no possibility of a grading gap – the CAG was used as the calculated grade. For cohorts of five to 15 a taper was applied and these cases have also been excluded.
Initially, in Model 1, we knowingly violate the independence assumption of logistic regression. That is, our initial model treats candidates as if their grading gap outcomes were independent of all other candidates, including those studying at the same centre. In Model 2 we correct for this false assumption, clustering candidates at centre level (that is, usually a school or college). A key advantage of model two is that, by explicitly taking into account the hierarchical structure of the data, the model more accurately estimates the standard errors of the regression coefficients. Model 3 then takes into account the A level subjects being studied by candidates, taking into account the association between A level subject and the likelihood of calculated grades differing from CAGs.
In the second analytical approach, individual A level entries are the lowest level in the model – that is, entries are not aggregated to produce a candidate-level score. Instead, entries are clustered within individual candidates and within ‘subject group within centre’. As each entry is clustered both within a candidate and within the subject group within centre, this involves a cross-classified data structure. As was described earlier, subject within centre is the level at which the standardisation method was applied.
Model 3 and Model 4 are fit to the same set of candidates. That is, model three relates to candidates taking three A levels, all three of which were in subject within centre groups of more than 15 candidates. In Model 5, we then fit the cross-classified model to a larger number of entries, by including all A level entries that were in subject within centre cohorts of more than 15.
All analysis was carried out using R, models were fit using lme4 and diagrams created using ggplot2 and plotly.
Results
Candidate-level analysis
The candidate-level analysis takes as its dependent variable a binary indicator for whether the candidate had CAGs which were, in total, three grades or more higher than the total score for their calculated grades.
We wanted to examine whether the relationship between candidate characteristics and the likelihood of a three-point grading gap was present when we simultaneously took account of these factors. In Model 1, we knowingly ignore the clustering of cases within centres. In the absence of clustering, the effective sample sizes are smaller than the number of cases shown and consequently standard errors and p values are underestimated; the p values reported for model one should be treated with caution. Model 2 then clusters candidates within centres and Model 3 adds a set of control variables relating to the subjects which candidates studied.
First of all, it is helpful to consider the model fit statistics of the three models. For Model 1, Tjur’s coefficient of discrimination (Tjur, 2009) indicates that less than 1% of the probability of a candidate having a three-point grading gap is explained by the characteristics included in the model. In short, knowing these candidate characteristics, such as a candidate’s gender, ethnicity and prior attainment band, would provide very little predictive power as to the likelihood that they would have had a three-point grading gap.
Model 2 takes into account the clustering of candidates within centres. We see from the model fit statistics at the foot of Table 4 that, while the explanatory power of the candidate characteristic variables remains at a very low level, more than 30% of probability of a candidate having a three-point grading gap is accounted for by differences between centres. In Model 3, we add a set of dummy variables to control for which subjects a candidate was studying (the model is shown in full in Appendix Table 3). While the proportion of variance clustered at centre level remains stable, there is a slight improvement in Tjur’s coefficient of discrimination as compared with Model 2, indicating that there is some difference between subjects in the likelihood of a grading gap.
Table 4a. Candidate-level logistic regression models fixed effects for models 1, 2 and 3, dependent variable = grading gap of three points or more (n=82,830)
| M1 odds ratio | M1 std. error | M1 p-val. | M2 odds ratio | M2 std. error | M2 p-val. | M3 odds ratio | M3 std. error | M3 p-val. | |
|---|---|---|---|---|---|---|---|---|---|
| [Intercept] | 0.18 | 0.01 | <0.001 | 0.19 | 0.01 | <0.001 | 0.19 | 0.02 | <0.001 |
| Male (female) | 0.92 | 0.02 | <0.001 | 0.97 | 0.02 | 0.252 | 0.91 | 0.03 | 0.001 |
| SEN status (no SEN) | 0.86 | 0.05 | 0.004 | 0.99 | 0.06 | 0.824 | 0.96 | 0.06 | 0.469 |
| FSM eligibility (not eligible) | 1.02 | 0.05 | 0.737 | 1.01 | 0.06 | 0.911 | 1.02 | 0.06 | 0.675 |
| Asian or Asian British (white) | 1.17 | 0.04 | <0.001 | 1.17 | 0.05 | <0.001 | 1.1 | 0.05 | 0.043 |
| Black or Black British | 1.2 | 0.06 | <0.001 | 1.04 | 0.06 | 0.473 | 0.98 | 0.06 | 0.769 |
| Chinese | 0.92 | 0.13 | 0.533 | 1.01 | 0.15 | 0.948 | 0.97 | 0.15 | 0.846 |
| Mixed | 1.06 | 0.06 | 0.249 | 0.98 | 0.06 | 0.779 | 0.94 | 0.06 | 0.312 |
| Any other ethnic group | 1.41 | 0.12 | <0.001 | 1.25 | 0.12 | 0.015 | 1.16 | 0.11 | 0.124 |
| Ethnic group unclassified | 1.26 | 0.11 | 0.01 | 1.08 | 0.11 | 0.489 | 1.04 | 0.11 | 0.689 |
| EAL (first language English) | 1.11 | 0.04 | 0.006 | 1.08 | 0.05 | 0.053 | 1.05 | 0.04 | 0.238 |
| Language group unclassified | 0.96 | 0.15 | 0.814 | 1.06 | 0.18 | 0.74 | 1.05 | 0.18 | 0.77 |
| Missing socio-demographics data | 0.51 | 0.13 | 0.007 | 0.71 | 0.2 | 0.214 | 0.68 | 0.19 | 0.17 |
| 1st (lowest) deprivation quintile | 0.89 | 0.03 | 0.002 | 0.96 | 0.04 | 0.276 | 0.96 | 0.04 | 0.383 |
| 2nd deprivation quintile | 0.96 | 0.04 | 0.237 | 0.97 | 0.04 | 0.512 | 0.98 | 0.04 | 0.616 |
| 4th deprivation quintile | 0.99 | 0.04 | 0.778 | 0.98 | 0.04 | 0.665 | 0.99 | 0.04 | 0.764 |
| 5th (highest) deprivation quintile | 1.09 | 0.04 | 0.027 | 1.02 | 0.04 | 0.655 | 1.02 | 0.05 | 0.62 |
| Missing IDACI data | 1.42 | 0.35 | 0.158 | 1.39 | 0.38 | 0.227 | 1.39 | 0.38 | 0.233 |
| 1st (lowest) prior attainment quintile | 0.85 | 0.04 | 0.001 | 0.78 | 0.04 | <0.001 | 0.95 | 0.05 | 0.408 |
| 2nd prior attainment quintile | 0.98 | 0.04 | 0.632 | 0.92 | 0.04 | 0.033 | 1.01 | 0.04 | 0.882 |
| 4th prior attainment quintile | 0.97 | 0.03 | 0.318 | 1.01 | 0.04 | 0.862 | 0.93 | 0.03 | 0.034 |
| 5th (highest) prior attainment quintile | 0.57 | 0.02 | <0.001 | 0.59 | 0.02 | <0.001 | 0.51 | 0.02 | <0.001 |
| Missing prior attainment data | 0.83 | 0.03 | <0.001 | 0.83 | 0.05 | 0.001 | 0.81 | 0.05 | <0.001 |
| Subject groups | n/a | n/a | n/a | n/a | n/a | n/a | (See appendix) | (See appendix) | (See appendix) |
Note: Models 2 and 3 were fit using the glmer command and nAGQ=0 subcommand which uses a faster but less exact form of parameter estimation than the default setting.
Table 4b. Candidate-level logistic regression models random effects and model fit for models 1, 2 and 3, dependent variable = grading gap of three points or more (n=82,830)
| M1 | M2 | M3 | |
|---|---|---|---|
| σ2 | Not applicable | 3.29 | 3.29 |
| τ00 | Not applicable | 1.46 centre_no | 1.46 centre_no |
| ICC | Not applicable | 0.31 | 0.31 |
| N | Not applicable | 1417 centre_no | 1417 centre_no |
| Observations | 82,830 | 82,830 | 82,830 |
| Marginal R2 / Conditional R2 (Tjur) | 0.009 | 0.010 / 0.315 | 0.031 / 0.328 |
Note: Models 2 and 3 were fit using the glmer command and nAGQ=0 subcommand which uses a faster but less exact form of parameter estimation than the default setting.
Moving to the interpretation of the candidate characteristics included in the models, it is notable that various candidate characteristics appear to be statistically significant in Model 1, but cease to be so in Model 2 when candidates are clustered at centre level. For example, in Model 1 the odds ratio for candidates from the black ethnic group is 1.20. This means the odds of a three-grade gap for candidates from the black ethnic category are 20% greater than for the reference category – in this case, white candidates. However, when clustering at centre level is taken into account in Model 2, the difference in odds declines to 4% (odds ratio = 1.04) and is not statistically significant. Our interpretation of this different result between Model 1 and Model 2 is that it is the school attended which affects the probability of having a three-point grading gap, rather than belonging to the black ethnic group. In other words, black candidates may be more likely to attend schools or colleges at which all pupils (as a whole, not only black pupils) were more likely to have a three-point grading gap.
Indeed, only two demographic characteristics – candidates’ gender and belonging to the Asian ethnic category – were associated with the odds of a three-point grading gap when clustering and subject choice were taken into account (Model 3). In both cases the effect size was very small. Male candidates were 9% less likely to have a three-grade gap than female candidates (that is, odds ratio = 0.91).
In the case of Asian candidates, we see that the odds ratio did not change from Model 1 to Model 2, with Asian candidates’ odds 17% higher than white candidates. However, the odds ratio declined somewhat when subject choices were taken into account, suggesting Asian candidates were more likely to take subjects in which more candidates experienced a grading gap. Nevertheless, in Model 3 Asian candidates’ odds of a three-grade gap remained 10% greater than those of white candidates.
Model 3 predicts that a white female candidate, attending the median centre, would have a 15.7% probability of experiencing a three-grade gap (with all other variables set to their reference category). If that candidate were male the probability would be 14.5%. The corresponding probabilities for female and male Asian candidates would be 17% and 15.7%.
Each of the models controls for candidate prior attainment at GCSE, with mean GCSE split into quintile groups. We see that candidates in the highest prior attaining quintile were less likely to have a three-grade gap than those from the median group. This may be linked to the fact that prior attainment was used by some teachers as a source of evidence to rank pupils (Holmes et al., 2021). This might have led students with high prior attainment to be more frequently at the top of rankings and consequently more protected from potential grading gaps.[footnote 7]
Analysis was also carried out using alternative thresholds for the dependent variable – a two-point grading gap and a four-point grading gap – and the results are shown in Appendix Tables A4 and A5. Results relating to a two-grade gap echo those relating to the three-grade gap described above, albeit that, for Asian candidates, the increased likelihood of having a two-grade gap did not reach the level of statistical significance in the model controlling for A level subject (shown in the Appendix as model 8).
However, there were somewhat different results relating to a four-grade gap – which of course affected a much smaller proportion of candidates. Most notably, none of the demographic characteristics were significantly associated with a four-point grading gap when both subjects and clustering within centres were taken into account (Model 11).
Nevertheless, regardless of the threshold used, the picture emerging is that the effect sizes for demographic variables were very small, with few differences reaching the level of statistical significance.
Entry level analysis
The entry level analysis took an alternative approach with entries rather than candidates as the lowest level of the model. For this analysis we have taken a grading gap of one grade or more as the dependent variable. This is because, as we saw earlier, gaps of more than one grade were relatively unusual and because three A levels each with a one-grade gap was the most frequently observed source of a three-point candidate-level grading gap.
Entries are clustered within candidates and also subject groups within centres. The latter is of course the unit at which the calculated grade method was applied. Model 4, shown in Table 5, shows results when the model is fit to the same dataset that was used for models 1, 2 and 3 (that is, candidates taking only three subjects, all of which were taken in subject within centre cohorts of more than 15 candidates).
We see that, as in models 1 to 3, candidates from the highest quintile of prior attainment were significantly less likely to have a grading gap (in the case of models 4 and 5 of course, this is one-point grading gap). However, in Model 4 we see that candidates from the lowest two prior attainment quintiles were significantly less likely to have a grading gap than the median quintile group, albeit with odds reduced by only 9% and 5%).
Consistent with model 3, the only demographic characteristics significantly associated with a grading gap indicate that male candidates were less likely to have a grading gap than female candidates (a 7% reduction in the odds) and that Asian candidates were more likely (a 5% increase in the odds).
Table 5a. Entry level cross-classified logistic regression model fixed effects for models 4 and 5, dependent variable = grading gap of one point or more.
| M4 odds atio | M4 std. error | M4 p-val. | M5 odds ratio | M5 std. error | M5 p-val. | |
|---|---|---|---|---|---|---|
| [Intercept] | 0.88 | 0.02 | <0.001 | 0.91 | 0.01 | <0.001 |
| Male (female) | 0.93 | 0.01 | <0.001 | 0.93 | 0.01 | <0.001 |
| SEN status (no SEN) | 0.99 | 0.02 | 0.598 | 0.99 | 0.02 | 0.751 |
| FSM eligibility (not eligible) | 1.03 | 0.02 | 0.160 | 1.03 | 0.02 | 0.148 |
| Asian or Asian British (white) | 1.05 | 0.02 | 0.014 | 1.03 | 0.02 | 0.025 |
| Black or Black British | 1.03 | 0.03 | 0.205 | 1.03 | 0.02 | 0.095 |
| Chinese | 0.93 | 0.06 | 0.231 | 0.93 | 0.04 | 0.126 |
| Mixed | 1.01 | 0.02 | 0.745 | 1.01 | 0.02 | 0.466 |
| Any other ethnic group | 1.01 | 0.04 | 0.763 | 0.96 | 0.03 | 0.267 |
| Ethnic group unclassified | 1.04 | 0.05 | 0.357 | 1.04 | 0.03 | 0.226 |
| EAL (first language English) | 1.01 | 0.02 | 0.452 | 1.02 | 0.01 | 0.160 |
| Language group unclassified | 1.01 | 0.07 | 0.891 | 0.97 | 0.05 | 0.553 |
| Missing socio-demographics data | 1.07 | 0.12 | 0.575 | 1.04 | 0.09 | 0.611 |
| 1st (lowest) deprivation quintile | 0.98 | 0.02 | 0.202 | 0.99 | 0.01 | 0.554 |
| 2nd deprivation quintile | 0.98 | 0.02 | 0.318 | 1.01 | 0.01 | 0.516 |
| 4th deprivation quintile | 0.99 | 0.02 | 0.727 | 1.00 | 0.01 | 0.871 |
| 5th (highest) deprivation quintile | 1.00 | 0.02 | 0.929 | 1.00 | 0.01 | 0.823 |
| Missing IDACI data | 0.93 | 0.11 | 0.511 | 0.95 | 0.08 | 0.568 |
| 1st (lowest) prior attainment quintile | 0.91 | 0.02 | <0.001 | 0.88 | 0.01 | <0.001 |
| 2nd prior attainment quintile | 0.95 | 0.02 | 0.003 | 0.92 | 0.01 | <0.001 |
| 4th prior attainment quintile | 0.98 | 0.01 | 0.166 | 0.97 | 0.01 | 0.013 |
| 5th (highest) prior attainment quintile | 0.65 | 0.01 | <0.001 | 0.64 | 0.01 | <0.001 |
| Missing prior attainment data | 0.87 | 0.02 | <0.001 | 0.85 | 0.01 | <0.001 |
Table 5b. Entry level cross-classified logistic regression model random effects and model fit for models 4 and 5, dependent variable = grading gap of one point or more.
| M4 | M5 | |
|---|---|---|
| σ2 | 3.29 | 3.29 |
| τ00 candidate | 0.06 | 0.06 |
| τ00 subject within centre | 1.28 | 1.42 |
| ICC | 0.29 | 0.31 |
| N subject within centre | 12,523 | 13,695 |
| N candidate | 82,829 | 207,521 |
| Observations | 248,490 | 450,810 |
| Marginal R2 / Conditional R2 (Tjur) | 0.006 / 0.293 | 0.006 / 0.315 |
As, on this model formulation, we need no longer require information relating to all of a candidate’s A level entries, we can expand the dataset to include all A level entries taken in subject within centre cohorts of more than 15 candidates. This allows us to investigate whether the findings shown in models 1 to 4 generalise to a pool of candidates which includes entrants who are also taking less popular subjects. Model 5 shows the results when the model is fitted to this larger dataset (comprising 450,810 entries). We see that the results for Model 5 are substantively the same as those for Model 4.
Conclusion
This report presents some initial analysis using data which will be available to external researchers through the ONS Secure Research Service. We wanted to understand whether particular candidate characteristics were associated with the chances of being among those with more substantial discrepancies between CAGs and calculated grades. Our focus has been on candidates who were in ‘subject within centre’ groups of more than fifteen candidates as this group was treated in the same way by the standardisation method. The initial focus was on candidates whose CAGs were, on aggregate, three grades higher than their calculated grades.
Model 3, presented above, included demographic variables and took account of prior attainment at GCSE and also the A level subjects being studied. Candidates were also clustered within centres. In this model, two demographic characteristics were associated with increased odds of a three-grade gap. However, even for these variables, there was only a very weak relationship with the likelihood of having a three-point grading gap.[footnote 8] These weak relationships related to female candidates, who were more likely to have a three-point grading gap than male candidates and candidates from the Asian ethnic category, who were more likely to have a three-grade gap than white candidates.
This analysis does not provide an explanation for such differences. We can speculate, for example, that they could arise from selection effects in which candidates’ expectations of their likely position within a subject cohort influence their subject choices – and that these influences vary across groups. Alternatively, we could speculate that they arise from differences in teacher rankings – for example teachers being slightly more inclined to boost some groups of candidates to a higher grade and, in doing so, making them more vulnerable to the standardisation method adjusting their grade downwards. However, regardless of the explanation, the effects on the probability of having a three-grade gap are extremely small.
The analysis, however, also draws attention to much more substantial variation between centres in the chances of experiencing a three-grade gap (and similarly to variation across ‘subjects within centre’ cohorts).[footnote 9] Consequently, an important conclusion to draw from this analysis, which sought to understand whether the chances of grade discrepancies varied by candidate characteristics, is that differences across demographic groups were much smaller than differences across centres.
A large number of A level students experienced the distress of a grade gap in summer 2020. The findings presented in this report point toward the conclusion that gaps between CAGs and calculated grades did not systematically and substantially affect specific groups of students. Although it is not possible to know which grading approach (CAGs or calculated grades) more accurately reflected the grade students would have achieved had they taken the exams, the evidence produced in this report suggests that candidates with protected characteristics or belonging to disadvantaged groups were not systematically and substantially more likely to experience grade discrepancies.
References
Chen, H., Cohen, P., and Chen, S. (2010). How big is a big odds ratio? Interpreting the magnitudes of odds ratios in epidemiological studies. Communications in Statistics – simulation and computation, 29, 860-864.
Holmes, S., Churchward, D., Howard, E., Keys, E., Leahy, F. & Tonin, D. (2021). Centre Assessment Grades: Teaching Staff Interviews, Summer 2020. Ofqual Report.
Lee, M. W., Stringer, N. & Zanini, N. (2020). Student-level equalities analyses for GCSE and A level. Ofqual Research Report, 20/6713.
Ofqual. (2020b). Awarding GCSE, AS, A level, advanced extension awards and extended project qualifications in summer 2020: interim report. Ofqual Research Report 20/6656/1.
Ofqual. (2020c). Summer 2020 results analysis – GCSE, AS and A level. Update to the interim report. Ofqual Research Report 20/6729.
Office for Statistics Regulation (2021). Ensuring statistical models command public confidence: learning lessons from the approach to awarding grades in the UK in 2020.
Stratton, T., Zanini, N., & Noden, P. (2021). An evaluation of Centre Assessment Grades from summer 2020. Ofqual Research Report.
Tjur, T. (2009). Coefficients of determination in logistic regression models – a new proposal: the coefficient of discrimination. The American statistician, 63 (4), 366-372.
Appendix – Supplementary tables
Table A1. Percentage of entries for which Centre Assessment Grade was higher than calculated grade for subjects with more than 5,000 entrants.
| Subject | % for which CAG was higher than calculated grade | Entries |
|---|---|---|
| Biology | 51 | 53,550 |
| Law | 46 | 10,230 |
| Physics | 45 | 31,820 |
| Psychology | 44 | 57,810 |
| Chemistry | 44 | 46,190 |
| Computing | 41 | 10,890 |
| English Literature | 40 | 35,660 |
| English Language | 40 | 13,890 |
| Physical Education | 40 | 9,890 |
| History | 39 | 38,440 |
| Mathematics | 38 | 76,860 |
| Religious Studies | 38 | 13,520 |
| Business Studies | 37 | 30,210 |
| Politics | 37 | 14,860 |
| English Language & Literature | 37 | 6,640 |
| Economics | 36 | 27,670 |
| Sociology | 35 | 33,460 |
| Geography | 35 | 26,040 |
| Art & Design: Photography | 35 | 10,240 |
| Drama & Theatre Studies | 35 | 8,300 |
| Art & Design: Fine Art | 32 | 12,140 |
| Spanish | 30 | 7,360 |
| Film Studies | 30 | 5,290 |
| Media Studies | 28 | 12,760 |
| Further Mathematics | 28 | 12,640 |
| French | 24 | 6,960 |
| D&T: Product Design | 23 | 7,900 |
Table A2. Descriptive statistics: candidate characteristics and a grading gap of three points or more among all candidates aged 18 (N = 246,110), the subgroup who took three A levels (N = 168,980) and those who took three A levels, all of which were in subjects with more than 15 candidates at the centre (N = 82,830)
| Characteristic | % of all candidates | % all with 3 grade gap | % of 3 A level group | % 3 A level group with 3 grade gap | % in group size >15 for all 3 subjects | % of >15 group size for 3 A levels with 3 grade gap |
|---|---|---|---|---|---|---|
| Gender female | 55.6 | 10.3 | 56.8 | 13 | 55.3 | 12.5 |
| Gender male | 44.4 | 10.3 | 43.2 | 13.2 | 44.7 | 11.8 |
| Gender missing | 0 | 0 | 0 | 0 | 0 | 0 |
| Major ethnic group white | 61.1 | 10 | 60.7 | 12.8 | 53.5 | 12.1 |
| Major ethnic group Asian | 10.3 | 12.9 | 11.1 | 15.9 | 13 | 15 |
| Major ethnic group black | 4.4 | 13.1 | 4.5 | 16.5 | 4.5 | 15.9 |
| Major ethnic group Chinese | 0.5 | 10.4 | 0.5 | 11.4 | 0.6 | 11.2 |
| Major ethnic group mixed | 4.2 | 10.9 | 4.4 | 13.3 | 4 | 13 |
| Major ethnic group any other | 1.4 | 13.9 | 1.4 | 17.3 | 1.4 | 18 |
| Major ethnic group unclassified | 1.4 | 11.7 | 1.3 | 15.7 | 1.3 | 15.3 |
| Major ethnic group missing | 16.8 | 8.4 | 16.2 | 10.8 | 21.7 | 9.5 |
| Not eligible for free school meals | 77.8 | 10.7 | 78.9 | 13.5 | 73.9 | 12.9 |
| Eligible for free school meals | 5.4 | 10.9 | 4.9 | 15.1 | 4.4 | 14.7 |
| FSM information missing | 16.8 | 8.4 | 16.2 | 10.8 | 21.7 | 9.5 |
| First language English | 70.7 | 10.3 | 71.2 | 13.1 | 65.7 | 12.5 |
| First language other than English | 12 | 12.8 | 12.2 | 16 | 12.2 | 15.6 |
| First language unclassified | 0.5 | 10.9 | 0.4 | 14.3 | 0.5 | 13.8 |
| First language missing | 16.8 | 8.4 | 16.2 | 10.8 | 21.7 | 9.5 |
| No identified special educational needs | 78.3 | 10.8 | 79.3 | 13.6 | 74 | 13.1 |
| Identified special educational needs | 4.9 | 9.3 | 4.5 | 12.4 | 4.3 | 11.3 |
| Missing information on special educational needs | 16.8 | 8.4 | 16.2 | 10.8 | 21.7 | 9.5 |
| Not missing data for ethnicity, FSM, first language and SEN | 83.2 | 10.7 | 83.8 | 13.6 | 78.3 | 13 |
| Missing data for ethnicity, FSM, first language and SEN | 16.8 | 8.4 | 16.2 | 10.8 | 21.7 | 9.5 |
| Lowest IDACI quintile | 16.6 | 9.8 | 17.7 | 11.9 | 17.4 | 11.3 |
| 2nd IDACI quintile | 16.6 | 10.2 | 17.1 | 12.7 | 15.9 | 12.2 |
| 3rd IDACI quintile | 16.6 | 10.8 | 16.7 | 13.7 | 15.4 | 13 |
| 4th IDACI quintile | 16.6 | 10.8 | 16.3 | 14.1 | 14.9 | 13.4 |
| Highest IDACI quintile | 16.6 | 11.6 | 15.9 | 15.6 | 14.5 | 15.3 |
| Missing IDACI data | 17 | 8.4 | 16.3 | 10.8 | 21.8 | 9.5 |
| Lowest mean GCSE score quintile | 16.6 | 6.2 | 9.2 | 12.9 | 6.3 | 12.3 |
| 2nd mean GCSE score quintile | 16.6 | 10.2 | 15.6 | 14.1 | 12.6 | 14 |
| 3rd mean GCSE score quintile | 16.6 | 13 | 19.2 | 15.2 | 17.3 | 14.3 |
| 4th mean GCSE score quintile | 16.6 | 13.8 | 21 | 14.4 | 21 | 14 |
| Highest mean GCSE score quintile | 16.6 | 8.9 | 19.1 | 9 | 22.7 | 8.8 |
| Missing GCSE data | 16.9 | 9.6 | 15.8 | 12.9 | 20.2 | 11.3 |
Table A3a. Candidate grading gap of three grades or more including subject effects, fixed effects for models 1, 2 and 3
| M1 odds ratio | M1 std. error | M1 p-val. | M2 odds ratio | M2 std. error | M2 p-val. | M3 odds ratio | M3 std. error | M3 p-val. | |
|---|---|---|---|---|---|---|---|---|---|
| [Intercept] | 0.18 | 0.01 | <0.001 | 0.19 | 0.01 | <0.001 | 0.19 | 0.02 | <0.001 |
| Male (female) | 0.92 | 0.02 | <0.001 | 0.97 | 0.02 | 0.252 | 0.91 | 0.03 | 0.001 |
| SEN status (no SEN) | 0.86 | 0.05 | 0.004 | 0.99 | 0.06 | 0.824 | 0.96 | 0.06 | 0.469 |
| FSM eligibility (not eligible) | 1.02 | 0.05 | 0.737 | 1.01 | 0.06 | 0.911 | 1.02 | 0.06 | 0.675 |
| Asian or Asian British (white) | 1.17 | 0.04 | <0.001 | 1.17 | 0.05 | <0.001 | 1.10 | 0.05 | 0.043 |
| Black or Black British | 1.20 | 0.06 | <0.001 | 1.04 | 0.06 | 0.473 | 0.98 | 0.06 | 0.769 |
| Chinese | 0.92 | 0.13 | 0.533 | 1.01 | 0.15 | 0.948 | 0.97 | 0.15 | 0.846 |
| Mixed | 1.06 | 0.06 | 0.249 | 0.98 | 0.06 | 0.779 | 0.94 | 0.06 | 0.312 |
| Any other ethnic group | 1.41 | 0.12 | <0.001 | 1.25 | 0.12 | 0.015 | 1.16 | 0.11 | 0.124 |
| Ethnic group unclassified | 1.26 | 0.11 | 0.010 | 1.08 | 0.11 | 0.489 | 1.04 | 0.11 | 0.689 |
| EAL (first language English) | 1.11 | 0.04 | 0.006 | 1.08 | 0.05 | 0.053 | 1.05 | 0.04 | 0.238 |
| Language group unclassified | 0.96 | 0.15 | 0.814 | 1.06 | 0.18 | 0.740 | 1.05 | 0.18 | 0.770 |
| Missing socio-demographic data | 0.51 | 0.13 | 0.007 | 0.71 | 0.20 | 0.214 | 0.68 | 0.19 | 0.170 |
| 1st (lowest) deprivation quintile (3rd quintile) | 0.89 | 0.03 | 0.002 | 0.96 | 0.04 | 0.276 | 0.96 | 0.04 | 0.383 |
| 2nd deprivation quintile | 0.96 | 0.04 | 0.237 | 0.97 | 0.04 | 0.512 | 0.98 | 0.04 | 0.616 |
| 4th deprivation quintile | 0.99 | 0.04 | 0.778 | 0.98 | 0.04 | 0.665 | 0.99 | 0.04 | 0.764 |
| 5th (highest) deprivation quintile | 1.09 | 0.04 | 0.027 | 1.02 | 0.04 | 0.655 | 1.02 | 0.05 | 0.620 |
| Missing IDACI data | 1.42 | 0.35 | 0.158 | 1.39 | 0.38 | 0.227 | 1.39 | 0.38 | 0.233 |
| 1st (lowest) prior attainment quintile (3rd quintile) | 0.85 | 0.04 | 0.001 | 0.78 | 0.04 | <0.001 | 0.95 | 0.05 | 0.408 |
| 2nd prior attainment quintile | 0.98 | 0.04 | 0.632 | 0.92 | 0.04 | 0.033 | 1.01 | 0.04 | 0.882 |
| 4th prior attainment quintile | 0.97 | 0.03 | 0.318 | 1.01 | 0.04 | 0.862 | 0.93 | 0.03 | 0.034 |
| 5th (highest) prior attainment quintile | 0.57 | 0.02 | <0.001 | 0.59 | 0.02 | <0.001 | 0.51 | 0.02 | <0.001 |
| Missing prior attainment data | 0.83 | 0.03 | <0.001 | 0.83 | 0.05 | 0.001 | 0.81 | 0.05 | <0.001 |
| Accounting (maths) | n/a | n/a | n/a | n/a | n/a | n/a | 1.01 | 0.14 | 0.933 |
| Ancient history | n/a | n/a | n/a | n/a | n/a | n/a | 0.45 | 0.16 | 0.024 |
| Art & design 3d studies | n/a | n/a | n/a | n/a | n/a | n/a | 0.76 | 0.15 | 0.165 |
| Art & design art, craft and design | n/a | n/a | n/a | n/a | n/a | n/a | 1.16 | 0.15 | 0.274 |
| Art & design critical and contextual studies | n/a | n/a | n/a | n/a | n/a | n/a | 2.02 | 1.11 | 0.202 |
| Art & design fine art | n/a | n/a | n/a | n/a | n/a | n/a | 1.26 | 0.10 | 0.004 |
| Art & design graphics | n/a | n/a | n/a | n/a | n/a | n/a | 0.86 | 0.09 | 0.173 |
| Art & design photography | n/a | n/a | n/a | n/a | n/a | n/a | 1.05 | 0.10 | 0.593 |
| Art & design textiles | n/a | n/a | n/a | n/a | n/a | n/a | 1.03 | 0.19 | 0.883 |
| Biology | n/a | n/a | n/a | n/a | n/a | n/a | 1.35 | 0.06 | <0.001 |
| Business studies | n/a | n/a | n/a | n/a | n/a | n/a | 0.83 | 0.04 | <0.001 |
| Chemistry | n/a | n/a | n/a | n/a | n/a | n/a | 1.05 | 0.05 | 0.294 |
| Chinese | n/a | n/a | n/a | n/a | n/a | n/a | 1.42 | 0.84 | 0.558 |
| Classical civilisation | n/a | n/a | n/a | n/a | n/a | n/a | 1.04 | 0.15 | 0.775 |
| Computing | n/a | n/a | n/a | n/a | n/a | n/a | 1.46 | 0.11 | <0.001 |
| D & T design engineering | n/a | n/a | n/a | n/a | n/a | n/a | 3.66 | 1.62 | 0.004 |
| D & T fashion and textiles | n/a | n/a | n/a | n/a | n/a | n/a | 3.34 | 2.19 | 0.065 |
| D & T product design | n/a | n/a | n/a | n/a | n/a | n/a | 1.60 | 0.20 | <0.001 |
| Dance | n/a | n/a | n/a | n/a | n/a | n/a | 3.41 | 1.23 | 0.001 |
| Drama & theatre studies | n/a | n/a | n/a | n/a | n/a | n/a | 1.37 | 0.15 | 0.003 |
| Economics | n/a | n/a | n/a | n/a | n/a | n/a | 0.92 | 0.05 | 0.077 |
| Electronics | n/a | n/a | n/a | n/a | n/a | n/a | 0.37 | 0.27 | 0.168 |
| English language | n/a | n/a | n/a | n/a | n/a | n/a | 1.02 | 0.06 | 0.753 |
| English language & literature | n/a | n/a | n/a | n/a | n/a | n/a | 1.11 | 0.10 | 0.233 |
| English literature | n/a | n/a | n/a | n/a | n/a | n/a | 0.93 | 0.04 | 0.122 |
| Environmental studies | n/a | n/a | n/a | n/a | n/a | n/a | 1.37 | 0.28 | 0.116 |
| Film studies | n/a | n/a | n/a | n/a | n/a | n/a | 1.17 | 0.12 | 0.137 |
| French | n/a | n/a | n/a | n/a | n/a | n/a | 1.43 | 0.18 | 0.005 |
| Further mathematics | n/a | n/a | n/a | n/a | n/a | n/a | 0.99 | 0.09 | 0.918 |
| Geography | n/a | n/a | n/a | n/a | n/a | n/a | 0.85 | 0.04 | 0.001 |
| Geology | n/a | n/a | n/a | n/a | n/a | n/a | 1.23 | 0.30 | 0.409 |
| German | n/a | n/a | n/a | n/a | n/a | n/a | 1.03 | 0.62 | 0.964 |
| History | n/a | n/a | n/a | n/a | n/a | n/a | 0.88 | 0.04 | 0.002 |
| History of art | n/a | n/a | n/a | n/a | n/a | n/a | 0.67 | 0.51 | 0.599 |
| Law | n/a | n/a | n/a | n/a | n/a | n/a | 1.18 | 0.07 | 0.005 |
| Media studies | n/a | n/a | n/a | n/a | n/a | n/a | 0.61 | 0.05 | <0.001 |
| Music | n/a | n/a | n/a | n/a | n/a | n/a | 1.76 | 0.48 | 0.038 |
| Music technology | n/a | n/a | n/a | n/a | n/a | n/a | 1.95 | 0.57 | 0.021 |
| Philosophy | n/a | n/a | n/a | n/a | n/a | n/a | 0.97 | 0.16 | 0.873 |
| Physical education | n/a | n/a | n/a | n/a | n/a | n/a | 1.27 | 0.10 | 0.002 |
| Physics | n/a | n/a | n/a | n/a | n/a | n/a | 1.31 | 0.07 | <0.001 |
| Politics | n/a | n/a | n/a | n/a | n/a | n/a | 0.94 | 0.06 | 0.310 |
| Psychology | n/a | n/a | n/a | n/a | n/a | n/a | 0.96 | 0.03 | 0.220 |
| Religious studies | n/a | n/a | n/a | n/a | n/a | n/a | 0.97 | 0.07 | 0.705 |
| Sociology | n/a | n/a | n/a | n/a | n/a | n/a | 0.74 | 0.03 | <0.001 |
| Spanish | n/a | n/a | n/a | n/a | n/a | n/a | 1.74 | 0.18 | <0.001 |
| Statistics | n/a | n/a | n/a | n/a | n/a | n/a | 1.35 | 0.21 | 0.050 |
| Languages with few entrants | n/a | n/a | n/a | n/a | n/a | n/a | 0.34 | 0.38 | 0.333 |
Table A3b. Candidate grading gap of three grades or more including subject effects, random effects and model fit for models 1, 2 and 3
| M1 | M2 | M3 | |
|---|---|---|---|
| σ2 | Not applicable | 3.29 | 3.29 |
| τ00 | Not applicable | 1.46 centre_no | 1.46 centre_no |
| ICC | Not applicable | 0.31 | 0.31 |
| N | Not applicable | 1417 centre_no | 1417 centre_no |
| Observations | 82,830 | 82,830 | 82,830 |
| Marginal R2 / Conditional R2 (Tjur) | 0.009 | 0.010 / 0.315 | 0.031 / 0.328 |
Table A4a. Alternative threshold: candidate total CAGs two grades or more higher than calculated grades, fixed effects for models 6, 7 and 8
| M6 odds ratio | M6 std. error | M6 p-val. | M7 odds ratio | M7 std. error | M7 p-val. | M8 odds ratio | M8 std. error | M8 p-val. | |
|---|---|---|---|---|---|---|---|---|---|
| [Intercept] | 0.78 | 0.02 | <0.001 | 0.95 | 0.04 | 0.232 | 1.00 | 0.07 | 0.990 |
| Male (female) | 0.91 | 0.01 | <0.001 | 0.98 | 0.02 | 0.180 | 0.95 | 0.02 | 0.010 |
| SEN status (no SEN) | 0.88 | 0.03 | 0.001 | 0.97 | 0.04 | 0.475 | 0.96 | 0.04 | 0.274 |
| FSM eligibility (not eligible) | 1.04 | 0.04 | 0.335 | 1.02 | 0.04 | 0.640 | 1.03 | 0.04 | 0.518 |
| Asian or Asian British (white) | 1.08 | 0.03 | 0.002 | 1.08 | 0.04 | 0.022 | 1.04 | 0.03 | 0.240 |
| Black or Black British | 1.17 | 0.04 | <0.001 | 1.07 | 0.05 | 0.131 | 1.04 | 0.04 | 0.404 |
| Chinese | 0.88 | 0.08 | 0.191 | 0.95 | 0.10 | 0.590 | 0.93 | 0.10 | 0.495 |
| Mixed | 1.04 | 0.04 | 0.286 | 0.98 | 0.04 | 0.693 | 0.96 | 0.04 | 0.380 |
| Any other ethnic group | 1.08 | 0.07 | 0.232 | 0.98 | 0.07 | 0.788 | 0.94 | 0.07 | 0.370 |
| Ethnic group unclassified | 1.14 | 0.07 | 0.053 | 1.09 | 0.08 | 0.270 | 1.08 | 0.08 | 0.345 |
| EAL (first language English) | 1.03 | 0.03 | 0.226 | 1.02 | 0.03 | 0.554 | 1.00 | 0.03 | 0.974 |
| Language group unclassified | 0.89 | 0.10 | 0.308 | 0.87 | 0.11 | 0.238 | 0.86 | 0.11 | 0.229 |
| Missing socio-demographic data | 0.69 | 0.13 | 0.047 | 0.91 | 0.19 | 0.639 | 0.89 | 0.19 | 0.576 |
| 1st (lowest) deprivation quintile (3rd quintile) | 0.92 | 0.02 | 0.001 | 0.95 | 0.03 | 0.082 | 0.96 | 0.03 | 0.111 |
| 2nd deprivation quintile | 0.98 | 0.03 | 0.384 | 0.98 | 0.03 | 0.517 | 0.99 | 0.03 | 0.610 |
| 4th deprivation quintile | 0.99 | 0.03 | 0.820 | 0.99 | 0.03 | 0.688 | 0.99 | 0.03 | 0.767 |
| 5th (highest) deprivation quintile | 1.04 | 0.03 | 0.126 | 0.99 | 0.03 | 0.680 | 0.99 | 0.03 | 0.767 |
| Missing IDACI data | 1.19 | 0.22 | 0.361 | 1.10 | 0.23 | 0.649 | 1.10 | 0.23 | 0.656 |
| 1st (lowest) prior attainment quintile (3rd quintile) | 0.85 | 0.03 | <0.001 | 0.77 | 0.03 | <0.001 | 0.88 | 0.03 | 0.001 |
| 2nd prior attainment quintile | 0.93 | 0.02 | 0.009 | 0.87 | 0.02 | <0.001 | 0.92 | 0.03 | 0.004 |
| 4th prior attainment quintile | 0.98 | 0.02 | 0.312 | 1.02 | 0.03 | 0.453 | 0.97 | 0.02 | 0.230 |
| 5th (highest) prior attainment quintile | 0.60 | 0.01 | <0.001 | 0.63 | 0.02 | <0.001 | 0.58 | 0.02 | <0.001 |
| Missing prior attainment data | 0.83 | 0.02 | <0.001 | 0.80 | 0.03 | <0.001 | 0.80 | 0.03 | <0.001 |
| Accounting (maths) | n/a | n/a | n/a | n/a | n/a | n/a | 1.16 | 0.09 | 0.073 |
| Ancient history | n/a | n/a | n/a | n/a | n/a | n/a | 0.85 | 0.13 | 0.278 |
| Art & design 3d studies | n/a | n/a | n/a | n/a | n/a | n/a | 0.96 | 0.11 | 0.745 |
| Art & design art, craft and design | n/a | n/a | n/a | n/a | n/a | n/a | 1.05 | 0.09 | 0.590 |
| Art & design critical and contextual studies | n/a | n/a | n/a | n/a | n/a | n/a | 0.95 | 0.35 | 0.894 |
| Art & design fine art | n/a | n/a | n/a | n/a | n/a | n/a | 1.14 | 0.06 | 0.014 |
| Art & design graphics | n/a | n/a | n/a | n/a | n/a | n/a | 0.95 | 0.06 | 0.411 |
| Art & design photography | n/a | n/a | n/a | n/a | n/a | n/a | 1.04 | 0.06 | 0.453 |
| Art & design textiles | n/a | n/a | n/a | n/a | n/a | n/a | 1.46 | 0.15 | <0.001 |
| Biology | n/a | n/a | n/a | n/a | n/a | n/a | 1.22 | 0.04 | <0.001 |
| Business studies | n/a | n/a | n/a | n/a | n/a | n/a | 0.84 | 0.03 | <0.001 |
| Chemistry | n/a | n/a | n/a | n/a | n/a | n/a | 0.98 | 0.03 | 0.513 |
| Chinese | n/a | n/a | n/a | n/a | n/a | n/a | 2.02 | 0.89 | 0.111 |
| Classical civilisation | n/a | n/a | n/a | n/a | n/a | n/a | 1.17 | 0.11 | 0.081 |
| Computing | n/a | n/a | n/a | n/a | n/a | n/a | 1.38 | 0.07 | <0.001 |
| D & T design engineering | n/a | n/a | n/a | n/a | n/a | n/a | 2.74 | 1.07 | 0.010 |
| D & T fashion and textiles | n/a | n/a | n/a | n/a | n/a | n/a | 1.02 | 0.62 | 0.968 |
| D & T product design | n/a | n/a | n/a | n/a | n/a | n/a | 1.41 | 0.12 | <0.001 |
| Dance | n/a | n/a | n/a | n/a | n/a | n/a | 1.77 | 0.54 | 0.062 |
| Drama & theatre studies | n/a | n/a | n/a | n/a | n/a | n/a | 1.33 | 0.09 | <0.001 |
| Economics | n/a | n/a | n/a | n/a | n/a | n/a | 0.93 | 0.03 | 0.025 |
| Electronics | n/a | n/a | n/a | n/a | n/a | n/a | 0.54 | 0.15 | 0.024 |
| English language | n/a | n/a | n/a | n/a | n/a | n/a | 1.07 | 0.04 | 0.093 |
| English language & literature | n/a | n/a | n/a | n/a | n/a | n/a | 1.15 | 0.07 | 0.014 |
| English literature | n/a | n/a | n/a | n/a | n/a | n/a | 0.95 | 0.03 | 0.100 |
| Environmental studies | n/a | n/a | n/a | n/a | n/a | n/a | 1.28 | 0.15 | 0.038 |
| Film studies | n/a | n/a | n/a | n/a | n/a | n/a | 0.93 | 0.06 | 0.296 |
| French | n/a | n/a | n/a | n/a | n/a | n/a | 1.36 | 0.11 | <0.001 |
| Further mathematics | n/a | n/a | n/a | n/a | n/a | n/a | 0.76 | 0.05 | <0.001 |
| Geography | n/a | n/a | n/a | n/a | n/a | n/a | 0.93 | 0.03 | 0.022 |
| Geology | n/a | n/a | n/a | n/a | n/a | n/a | 1.02 | 0.16 | 0.919 |
| German | n/a | n/a | n/a | n/a | n/a | n/a | 1.60 | 0.39 | 0.055 |
| History | n/a | n/a | n/a | n/a | n/a | n/a | 0.90 | 0.03 | <0.001 |
| History of art | n/a | n/a | n/a | n/a | n/a | n/a | 1.50 | 0.40 | 0.124 |
| Law | n/a | n/a | n/a | n/a | n/a | n/a | 1.15 | 0.05 | <0.001 |
| Media studies | n/a | n/a | n/a | n/a | n/a | n/a | 0.71 | 0.03 | <0.001 |
| Music | n/a | n/a | n/a | n/a | n/a | n/a | 1.82 | 0.31 | <0.001 |
| Music technology | n/a | n/a | n/a | n/a | n/a | n/a | 1.56 | 0.28 | 0.013 |
| Philosophy | n/a | n/a | n/a | n/a | n/a | n/a | 1.14 | 0.11 | 0.153 |
| Physical education | n/a | n/a | n/a | n/a | n/a | n/a | 1.34 | 0.07 | <0.001 |
| Physics | n/a | n/a | n/a | n/a | n/a | n/a | 1.14 | 0.04 | 0.001 |
| Politics | n/a | n/a | n/a | n/a | n/a | n/a | 0.94 | 0.04 | 0.089 |
| Psychology | n/a | n/a | n/a | n/a | n/a | n/a | 0.97 | 0.02 | 0.207 |
| Religious studies | n/a | n/a | n/a | n/a | n/a | n/a | 0.94 | 0.04 | 0.164 |
| Sociology | n/a | n/a | n/a | n/a | n/a | n/a | 0.76 | 0.02 | <0.001 |
| Spanish | n/a | n/a | n/a | n/a | n/a | n/a | 1.45 | 0.10 | <0.001 |
| Statistics | n/a | n/a | n/a | n/a | n/a | n/a | 1.45 | 0.15 | 0.001 |
| Languages with few entrants | n/a | n/a | n/a | n/a | n/a | n/a | 1.77 | 0.84 | 0.231 |
Table A4b. Alternative threshold: candidate total CAGs two grades or more higher than calculated grades, random effects and model fit for models 6, 7 and 8
| Model 6 | Model 7 | Model 8 | |
|---|---|---|---|
| σ2 | Not applicable | 3.29 | 3.29 |
| τ00 | Not applicable | 0.95 centre_no | 0.95 centre_no |
| ICC | Not applicable | 0.22 | 0.22 |
| N | Not applicable | 1417 centre_no | 1417 centre_no |
| Observations | 82,830 | 82,830 | 82,830 |
| Marginal R2 / Conditional R2 (Tjur) | 0.012 | 0.008 / 0.231 | 0.021 / 0.241 |
Table A5a. Alternative threshold: candidate total CAG four grades or more higher than calculated grades, fixed effects for models 9, 10 and 11
| M9 odds ratio | M9 std. error | M9 p-val. | M9 odds ratio | M10 std. error | M10 p-val. | M11 odds ratio | M11 std. error | M11 p-val. | |
|---|---|---|---|---|---|---|---|---|---|
| [Intercept] | 0.03 | 0.00 | <0.001 | 0.02 | 0.00 | <0.001 | 0.02 | 0.00 | <0.001 |
| Male (female) | 1.06 | 0.05 | 0.224 | 1.16 | 0.06 | 0.007 | 0.98 | 0.06 | 0.782 |
| SEN status (no SEN) | 0.97 | 0.11 | 0.787 | 1.19 | 0.15 | 0.160 | 1.14 | 0.14 | 0.307 |
| FSM eligibility (not eligible) | 0.89 | 0.10 | 0.264 | 0.85 | 0.10 | 0.170 | 0.88 | 0.10 | 0.299 |
| Asian or Asian British (white) | 1.18 | 0.09 | 0.041 | 1.13 | 0.11 | 0.192 | 0.97 | 0.09 | 0.778 |
| Black or Black British | 1.44 | 0.14 | <0.001 | 1.20 | 0.14 | 0.112 | 1.05 | 0.12 | 0.673 |
| Chinese | 0.97 | 0.30 | 0.911 | 1.06 | 0.35 | 0.869 | 0.90 | 0.30 | 0.762 |
| Mixed | 1.33 | 0.15 | 0.010 | 1.14 | 0.14 | 0.273 | 1.04 | 0.13 | 0.737 |
| Any other ethnic group | 1.54 | 0.25 | 0.009 | 1.19 | 0.22 | 0.337 | 0.99 | 0.18 | 0.969 |
| Ethnic group unclassified | 1.38 | 0.26 | 0.083 | 0.78 | 0.17 | 0.270 | 0.73 | 0.16 | 0.168 |
| EAL (first language English) | 1.18 | 0.09 | 0.029 | 1.14 | 0.10 | 0.127 | 1.07 | 0.09 | 0.414 |
| Language group unclassified | 1.13 | 0.34 | 0.679 | 1.72 | 0.57 | 0.100 | 1.66 | 0.56 | 0.134 |
| Missing socio-demographic data | 0.48 | 0.28 | 0.208 | 0.81 | 0.52 | 0.741 | 0.76 | 0.50 | 0.671 |
| 1st (lowest) deprivation quintile (3rd quintile) | 0.76 | 0.07 | 0.002 | 0.85 | 0.08 | 0.098 | 0.87 | 0.08 | 0.142 |
| 2nd deprivation quintile | 0.98 | 0.08 | 0.774 | 1.02 | 0.09 | 0.801 | 1.04 | 0.10 | 0.700 |
| 4th deprivation quintile | 1.17 | 0.10 | 0.052 | 1.13 | 0.10 | 0.156 | 1.14 | 0.10 | 0.135 |
| 5th (highest) deprivation quintile | 1.28 | 0.11 | 0.003 | 1.17 | 0.11 | 0.101 | 1.18 | 0.11 | 0.083 |
| Missing IDACI data | 1.15 | 0.68 | 0.809 | 1.19 | 0.76 | 0.785 | 1.14 | 0.74 | 0.846 |
| 1st (lowest) prior attainment quintile (3rd quintile) | 0.88 | 0.09 | 0.215 | 0.86 | 0.10 | 0.203 | 1.18 | 0.14 | 0.182 |
| 2nd prior attainment quintile | 0.98 | 0.08 | 0.778 | 0.90 | 0.08 | 0.239 | 1.04 | 0.09 | 0.696 |
| 4th prior attainment quintile | 0.92 | 0.06 | 0.211 | 0.95 | 0.07 | 0.464 | 0.82 | 0.06 | 0.013 |
| 5th (highest) prior attainment quintile | 0.47 | 0.04 | <0.001 | 0.48 | 0.04 | <0.001 | 0.37 | 0.03 | <0.001 |
| Missing prior attainment data | 0.78 | 0.06 | 0.001 | 0.86 | 0.10 | 0.209 | 0.79 | 0.09 | 0.050 |
| Accounting (maths) | n/a | n/a | n/a | n/a | n/a | n/a | 0.93 | 0.36 | 0.851 |
| Ancient history | n/a | n/a | n/a | n/a | n/a | n/a | 0.82 | 0.84 | 0.848 |
| Art & design 3d studies | n/a | n/a | n/a | n/a | n/a | n/a | 1.17 | 0.53 | 0.724 |
| Art & design art, craft and design | n/a | n/a | n/a | n/a | n/a | n/a | 1.37 | 0.45 | 0.341 |
| Art & design critical and contextual studies | n/a | n/a | n/a | n/a | n/a | n/a | 7.19 | 8.30 | 0.088 |
| Art & design fine art | n/a | n/a | n/a | n/a | n/a | n/a | 1.60 | 0.33 | 0.021 |
| Art & design graphics | n/a | n/a | n/a | n/a | n/a | n/a | 0.89 | 0.28 | 0.707 |
| Art & design photography | n/a | n/a | n/a | n/a | n/a | n/a | 1.36 | 0.30 | 0.168 |
| Art & design textiles | n/a | n/a | n/a | n/a | n/a | n/a | 1.01 | 0.61 | 0.992 |
| Biology | n/a | n/a | n/a | n/a | n/a | n/a | 1.49 | 0.14 | <0.001 |
| Business studies | n/a | n/a | n/a | n/a | n/a | n/a | 0.77 | 0.09 | 0.020 |
| Chemistry | n/a | n/a | n/a | n/a | n/a | n/a | 1.29 | 0.13 | 0.010 |
| Chinese | n/a | n/a | n/a | n/a | n/a | n/a | 1.46 | 1.67 | 0.742 |
| Classical civilisation | n/a | n/a | n/a | n/a | n/a | n/a | 0.86 | 0.41 | 0.755 |
| Computing | n/a | n/a | n/a | n/a | n/a | n/a | 1.92 | 0.32 | <0.001 |
| D & T design engineering | n/a | n/a | n/a | n/a | n/a | n/a | 8.49 | 7.84 | 0.021 |
| D & T fashion and textiles | n/a | n/a | n/a | n/a | n/a | n/a | 0.00 | 0.01 | 0.995 |
| D & T product design | n/a | n/a | n/a | n/a | n/a | n/a | 1.65 | 0.46 | 0.071 |
| Dance | n/a | n/a | n/a | n/a | n/a | n/a | 3.28 | 2.51 | 0.121 |
| Drama & theatre studies | n/a | n/a | n/a | n/a | n/a | n/a | 2.10 | 0.54 | 0.004 |
| Economics | n/a | n/a | n/a | n/a | n/a | n/a | 1.09 | 0.12 | 0.449 |
| Electronics | n/a | n/a | n/a | n/a | n/a | n/a | 1.85 | 2.00 | 0.570 |
| English language | n/a | n/a | n/a | n/a | n/a | n/a | 0.83 | 0.14 | 0.248 |
| English language & literature | n/a | n/a | n/a | n/a | n/a | n/a | 1.27 | 0.31 | 0.332 |
| English literature | n/a | n/a | n/a | n/a | n/a | n/a | 0.77 | 0.08 | 0.016 |
| Environmental studies | n/a | n/a | n/a | n/a | n/a | n/a | 2.34 | 1.17 | 0.090 |
| Film studies | n/a | n/a | n/a | n/a | n/a | n/a | 1.25 | 0.35 | 0.414 |
| French | n/a | n/a | n/a | n/a | n/a | n/a | 1.65 | 0.60 | 0.168 |
| Further mathematics | n/a | n/a | n/a | n/a | n/a | n/a | 1.44 | 0.27 | 0.050 |
| Geography | n/a | n/a | n/a | n/a | n/a | n/a | 0.67 | 0.08 | 0.001 |
| Geology | n/a | n/a | n/a | n/a | n/a | n/a | 0.00 | 0.00 | 0.972 |
| German | n/a | n/a | n/a | n/a | n/a | n/a | 0.00 | 0.00 | 0.985 |
| History | n/a | n/a | n/a | n/a | n/a | n/a | 0.60 | 0.07 | <0.001 |
| History of art | n/a | n/a | n/a | n/a | n/a | n/a | 6.87 | 7.70 | 0.085 |
| Law | n/a | n/a | n/a | n/a | n/a | n/a | 1.47 | 0.22 | 0.009 |
| Media studies | n/a | n/a | n/a | n/a | n/a | n/a | 0.65 | 0.14 | 0.040 |
| Music | n/a | n/a | n/a | n/a | n/a | n/a | 6.88 | 3.64 | <0.001 |
| Music technology | n/a | n/a | n/a | n/a | n/a | n/a | 3.55 | 2.32 | 0.053 |
| Philosophy | n/a | n/a | n/a | n/a | n/a | n/a | 0.73 | 0.33 | 0.487 |
| Physical education | n/a | n/a | n/a | n/a | n/a | n/a | 1.32 | 0.24 | 0.135 |
| Physics | n/a | n/a | n/a | n/a | n/a | n/a | 1.71 | 0.19 | <0.001 |
| Politics | n/a | n/a | n/a | n/a | n/a | n/a | 0.69 | 0.11 | 0.023 |
| Psychology | n/a | n/a | n/a | n/a | n/a | n/a | 0.96 | 0.08 | 0.649 |
| Religious studies | n/a | n/a | n/a | n/a | n/a | n/a | 0.89 | 0.16 | 0.534 |
| Sociology | n/a | n/a | n/a | n/a | n/a | n/a | 0.71 | 0.08 | 0.002 |
| Spanish | n/a | n/a | n/a | n/a | n/a | n/a | 3.14 | 0.81 | <0.001 |
| Statistics | n/a | n/a | n/a | n/a | n/a | n/a | 1.64 | 0.68 | 0.235 |
| Languages with few entrants | n/a | n/a | n/a | n/a | n/a | n/a | 1.72 | 2.48 | 0.707 |
Table A5b. Alternative threshold: candidate total CAG four grades or more higher than calculated grades, random effects and model fit for models 9, 10 and 11
| M9 | M10 | M11 | |
|---|---|---|---|
| σ2 | Not applicable | 3.29 | 3.29 |
| τ00 | Not applicable | 3.09 centre_no | 3.14 centre_no |
| ICC | Not applicable | 0.48 | 0.49 |
| N | Not applicable | 1,417 centre_no | 1,417 centre_no |
| Observations | 82,830 | 82,830 | 82,830 |
| Marginal R2 / Conditional R2 (Tjur) | 0.005 | 0.017 / 0.494 | 0.159 / 0.570 |
-
Events surrounding results day are briefly described in Lee, Stringer & Zanini (2020). In addition, a review of lessons learned from the 2020 process is provided in Office for Statistics Regulation (2021). ↩
-
Lee, Stringer and Zanini (2020) note that the closure of this gap could reflect the continuation of a pre-existing trend. ↩
-
That is, in joint analyses of 2018, 2019 and 2020 data, findings suggested that the predictive power of students’ protected characteristics and socio-economic background on CAGs, calculated grades and final grades was broadly similar over time (Lee, Stringer and Zanini, 2020). ↩
-
This report focuses on A level results only. A level students were issued calculated grades on results day, which were than replaced with the higher of the CAG and calculated grade. GCSE students were never issued the calculated grade. ↩
-
Thin lines, shown in lighter grey each represent fewer than 1,000 A level entries. For example, the horizontal link connecting grade U Centre Assessment Grades to grade U calculated grades represents more than 1,400 entries (and is shown to scale). In contrast, the curved link connecting Centre Assessment Grade U to calculated grade D represents just 60 entries. ↩
-
Appendix Tables A4 and A5, however, present models relating to two point and four point grading gaps. ↩
-
To note, also, that students ranked at the top were also more likely to be affected by a ceiling effect, that is the grade distribution reaching the top limits of the available grade range causing truncation at the top end, making it very unlikely for these students the possibility of a negative grade gap (Stratton, Zanini & Noden, 2021). ↩
-
The effects sizes relating to these groups did not reach the threshold even to be described as small as defined by Chen, Cohen, and Chen (2010). ↩
-
Systematic differences between centres, and subjects, are examined in Stratton, Zanini and Noden (2021). ↩