An evaluation of centre assessment grades from summer 2020
Updated 2 August 2021
Applies to England

© Crown copyright 2021
This publication is licensed under the terms of the Open Government Licence v3.0 except where otherwise stated. To view this licence, visit nationalarchives.gov.uk/doc/open-government-licence/version/3 or write to the Information Policy Team, The National Archives, Kew, London TW9 4DU, or email: psi@nationalarchives.gov.uk.
Where we have identified any third party copyright information you will need to obtain permission from the copyright holders concerned.
This publication is available at https://www.gov.uk/government/publications/evaluation-of-centre-assessment-grades-and-grading-gaps-in-summer-2020/an-evaluation-of-centre-assessment-grades-from-summer-2020
Authors
- Tim Stratton
- Nadir Zanin
- Philip Noden
Acknowledgements
The authors would like to thank colleagues from Ofsted, the Department for Education and Ofqual for their invaluable input into this research project as part of the GRADE (Grading and Admissions Data for England) joint initiative.
Executive summary
In summer 2020, GCSE and A level exams were cancelled in England as part of the government’s response to the COVID-19 pandemic. Instead, schools and colleges (centres) were asked to allocate grades based on their best judgement regarding what grade they believed candidates would have achieved if exams had gone ahead. These were referred to as Centre Assessment Grades (CAGs). CAGs were intended to form only part of a process to produce standardised final grades. However, the standardisation process did not command public confidence, and a subsequent policy change in August 2020 meant that final grades were awarded to students based on the higher grade from their CAG or the standardised grade.
This has resulted in the largest dataset on teacher grading judgements available in the UK. This creates a unique opportunity to understand the factors that influence teacher-graded judgements and how these relate to grades awarded by exams under normal circumstances. Previous studies have indicated that teacher grades tend to be more generous than those achieved by candidates in exams. There is also some evidence that teacher judgements can be affected by various candidate or school level characteristics, although in most cases evidence across previous studies does not show a consistent pattern. With respect to summer 2020, although evidence suggests that students’ protected characteristics and socio-economic background did not influence pupil’s grades (Lee, et al., 2020), it is not known whether other factors, such as those related to centre characteristics or subject could have had an influence on CAGs.
The main aim of this study was not to measure the size of the overall change in grades in 2020, since this has been carried out in detail previously (He & Black, 2020). Instead, we aimed to identify if the factors related to grades in 2020 based on teacher judgement differed from the factors related to grades awarded in previous years in a consistent way, in terms of candidate, centre or subject characteristics.
Methodology
In this study, we use data held by Ofqual on CAGs in 2020 and exam results from the previous two years (2018 and 2019), combined with data on candidate characteristics from the National Pupil Database. This is to identify if there are any differences in the patterns of relationships between CAGs and other candidate, school and subject level features, when compared to those relationships in ‘normal years’.
The core analysis took the form of a series of nested multi-level models, run separately for each year (CAGs in 2020, awarded grades in 2018 and 2019). These models were used to identify how certain characteristics were related to grades after holding all other characteristics constant. We then compare the outputs from these models between years to identify where there are notable differences in 2020 from the previous two years. Nested models allowed us to identify which ‘level’ of features explained the most variation in grades in each year (prior attainment, candidate, centre, subject-within centre, subject) and how this changed between years. A series of additional analyses were used to provide confidence in the core model results as well as provide additional insight into certain features of interest.
Using this methodology we are only able to draw conclusions for the variables included in the analysis. Results indicated that there was still a substantial proportion of variation in grades unexplained by our modelling. We cannot say whether this unexplained variation follows a similar pattern to previous years.
Key findings
Grades from Centre Assessment Grades in 2020 were on average around half a grade higher than grades from previous years for both GCSE and A levels. However, reassuringly, analysis indicated that the majority of relationships between grades and other features studied had not substantially changed compared to previous years, once normal variation between years had been accounted for. This suggests that although teacher grades were moderately higher than previous years’ grades, they did not introduce any substantial bias or different patterns of grading. The strongest predictor by far of grade outcomes was a candidate’s prior attainment for both GCSE and A level. This relationship was slightly stronger in 2020 compared to previous years. This increase in predictive power of prior attainment may represent CAGs factoring out ‘unpredictable’ variation in student outcomes, seen in normal years due to factors such as exam anxiety, last minute revision or the combination of questions which come up on exam papers. Alternatively, it may represent teachers’ over-reliance on prior attainment as a source of data and not sufficiently taking into account individual candidate differences in performance.
Due to the increase in mean grade, there was some evidence that at the top of the grade distribution there was a plateauing of the relationship with prior attainment. Effectively in 2020 candidates with the highest prior attainment received on average slightly smaller increases in grades compared to previous years as they were already attaining the highest grades possible. This was reflected at centre level as schools and colleges which had lower previous performance and candidates with lower mean prior attainment were those with the largest increase in mean grades. Again, this was likely due to the fact that lower attaining schools had ‘greater headroom’ and therefore ‘further to travel’ up the grade range, whereas the level of increase for higher performing schools was limited due to the ceiling effect of the top of the available grade range.
Results about candidate level features reflected those already published from an analysis of the equalities impact of grading in 2020 by Ofqual (Lee et al., 2020). The most notable effect was a decrease in the attainment gap between male and female students at A level. Whereas previously boys have somewhat outperformed girls, this effect was slightly reduced in 2020. This may represent a genuine closing of the attainment gap, following a trend from previous years, although it could represent a small bias in favour of girls in A level CAGs. In a qualitative study by Ofqual (Holmes et al., 2021) teachers suggested that in preparation for exams boys are more likely to show a ‘last minute push’ and this was difficult to legitimately factor in to CAGs.
Other more marginal effects suggested that those candidates attending centres in areas with the highest deprivation indices received relatively higher grades than previously in 2020, closing the gap with candidates from less deprived areas. This could again be due to more deprived centres tending to be lower performing and so have ‘more headroom’ in the grade range. The grades of candidates from independent centres increased slightly more in 2020 compared to other centre types, and at A level the increase in grades of candidates at sixth form centres was somewhat lower than for candidates from other centre types. There was also some indication that small cohorts received marginally higher CAGs than larger cohorts in 2020 compared to previous years, after accounting for subject and centre type differences. We suggest this may be because teachers of small cohorts had less consistent data to anchor their judgements, as outcomes for small groups are naturally more variable between years. This may have led to some additional generosity for these groups due to this increased uncertainty.
However, all of these effects only explained a very small amount of the variation in grades. In fact, all centre and candidate level effects combined explained less than 1% of variation in grades at A level, where most of the differences were found. Most variation in grades was due to prior attainment, between candidate differences not explained by any of the variables included in the analysis, and additional unexplained variation in grades. This unexplained variation, both between candidates and between subjects taken by the same candidate, is likely to be due to factors such as motivation, exam preparation or teaching quality - measures of which were not available for this analysis.
There was evidence at both GCSE and A level that subjects with more non-exam assessment, which tend to be more applied and expressive subjects, tended to be those with the largest increase in grades in 2020. We hypothesise that this may be due to teachers using non-exam assessment grades, which are usually candidates’ highest graded element, to inform the allocation of CAGs. Data also suggests that ‘facilitating’ subjects at A level, those subjects sometimes considered to provide access to the widest range of university courses, tended to be more generously graded than non-facilitating subjects.
Overall, we conclude that although there are some minor differences in the relationships between the candidate and centre level features analysed and grades in 2020, the patterns of grading are remarkably similar to previous years, particularly for GCSE.
Introduction
In summer 2020, exams for GCSEs and A levels, among other qualifications, in England were cancelled as part of the government’s response to the coronavirus (COVID-19) pandemic. The decision to cancel exams was announced in March 2020. To continue to be able to award grades and ensure the ability of candidates to progress, centres were asked to submit to exam boards’ judgements of the grades they believed candidates would have been most likely to achieve if exams had gone ahead. Centres were asked to provide a grade for each candidate in each subject taken. These grades were referred to as Centre Assessment Grades (CAGs).
The aim of this study is to provide some insights into the factors which may have affected centre decisions around the allocation of CAGs and how these decisions may cause differences in the patterns of grades awarded in 2020 compared to grades received by candidates in previous years, when exams went ahead. The intent was not to define whether these differences were valid or justified but to highlight any notable changes, which may give insight into teacher grading judgements in future.
This study is produced as part of a series of research projects carried out on a preliminary version of a combined data set from the Department for Education (DfE) and Ofqual being made available to independent researchers, GRADE. The intention of this dataset is to allow further evaluation of the grading approach taken in summer 2020, and to facilitate future research and insights into assessment.
The utilisation of teacher judgements in 2020
When producing CAGs in 2020, there was no national pre-standardisation of centres’ grading judgements. Centres were asked to provide their best judgement of the ability of their candidates and, more precisely, to assign students the grade they believed they would have achieved if they had sat exams as usual. To support these grading decisions, Ofqual provided guidance on the best evidence centres should use and how to avoid any unconscious bias in their grading decisions (Ofqual, 2020a). It was emphasised to centres that judgements should be objective and not be influenced by any protected characteristics, such as gender or ethnic group, or any other student characteristics not related to their academic achievement, such as behaviour, appearance or social background. However, teachers were asked to take into consideration any reasonable adjustments usually provided to candidates with special educational needs or disabilities, such as the provision of a reader or scribe, or the allowance of extra time, when making their grading decisions. Centres were also provided with guidance on how data on previous performance of the centre could be used to ‘sense check’ judgements to avoid under or over predicting grades at a cohort level.
Centres were asked to not discuss or disclose the grades to students or parents before results were issued. This was intended to protect the integrity of teachers’ judgements so that teachers could make their judgements fairly and without external pressure, which may have distorted grades. Guidance stated that CAGs had to be signed off by two teachers in the assessed subject, one of whom should be the head of department or subject lead. In addition to this, the Head of Centre was required to submit a declaration that the grades submitted were accurate and represented the objective and professional judgement of staff at the centre (Ofqual, 2020a). An appeals process was put in place for centres in case they believed there had been an error in the allocation of grades or in the data used in the standardisation model (see below), and guidance was provided to students on how to progress if they believed they had evidence of bias or discrimination relating to their CAG. Students who were not able to be issued a CAG or who were not happy with their final grade were also offered the opportunity to take their exams in autumn 2020.
CAGs were initially intended to be included as part of a process to produce a standardised grade. However, the standardisation method failed to command public confidence. Following a subsequent policy change in August 2020, it was decided the higher of the CAG and the standardised grade would be awarded instead. The majority of students received the CAGs provided by the centre. Only a small number of candidates received their standardised grades where these were higher than the original CAG. Details of the standardisation process and how it was applied are discussed in an interim report published by Ofqual on A level results day 2020 (Ofqual, 2020b).
These CAG judgements provide the largest dataset of teacher judgements available in England’s education system and provide a unique case study for evaluation and for the comparison of factors affecting teacher judgement to those affecting performance in exams.[footnote 1] There have been previous studies of teacher judgements, both in the UK and elsewhere, but rarely have they utilised a dataset of this size at both A level and GCSE level.
Previous studies of teacher judgements in assessment
In 2020, centres provided grades using their professional judgement and expertise. Previous analysis produced by Ofqual has shown that there is no evidence that CAGs systematically disadvantaged candidates with protected characteristics or those from less advantaged socio-economic backgrounds when compared to previous years (Lee et al., 2020). Despite this reassuring finding, producing consistent judgements across students, centres and subjects is a highly challenging task. There is prior evidence that the accuracy of judgements provided by teachers in other contexts can be inconsistent across candidates (Campbell, 2015). Accuracy can vary between teachers and different centres, and previous studies have identified relationships between grading judgements and candidate or centre level demographic characteristics (see Lee & Walter, 2020; Lee & Newton, 2021).
Before further discussing previous studies of teacher judgement it is worth acknowledging that any time we are comparing exam-based assessments with teacher judgements, when differences are identified it does not necessarily imply that teacher judgements are ‘wrong’. One or both methods of assessment may include biases, although as teacher judgement is inherently more subjective, biases are potentially more likely.
However, it is also possible that differences may emerge if teachers are assessing a slightly different construct, consciously or unconsciously, from exam-based assessments. For example, attainment through exams inherently partially assesses candidates’ exam taking ability, alongside the intended knowledge or skills. Whereas, a more holistic view of a students’ overall performance is unlikely to include ‘exam skills’ but may include other qualitative ‘attitudinal’ factors or other features teachers deem important to success in a subject. Teacher judgements may therefore be legitimate representations of this construct, although it may differ from the construct measured by exams. A direct comparison is always likely to result in differences as the two constructs, and subsequently the grades awarded, may not be directly equivalent.
The majority of studies comparing exam results and teacher judgement have shown that grades provided by teachers tend to be on average more generous than grades received from exam-based assessments (Delap, 1995; Dhillon, 2005; Gill and Benton, 2015). Most studies of teacher judgement in the UK have been based on data on A level predictions produced by teachers for use in university application. At this level, Delap (1994) found that the difference between teacher predictions and exam grades to be on average around half a grade and Wyness (2016) found that 75% of applicants were over predicted across their best three A levels. Thiede et al. (2019) describe this type of over estimation as confidence bias, although there is little empirical research to evaluate the reason behind these types of over estimations.
One potential reason for over estimation at A level may be to avoid closing down students’ opportunities for which universities or university courses they are able to apply to. Wyness (2016) demonstrated that, although much fewer than those overpredicted, underpredicted candidates were more likely to attend universities for which they were overqualified, which may then negatively affect their future earnings (Walker and Zhu, 2013) - something which teachers are likely keen to avoid. In this situation there are also no negative consequences to teachers for over-prediction and aspirational grades may help to encourage students to work harder to meet their predicted grades. There is less evidence of the generosity of grading by teachers at GCSE level, but research suggests that teacher judgements at all levels tend to be somewhat over optimistic (Lee & Newton, 2021).
Previous studies have also aimed to identify if any characteristics of candidates may have led to grades awarded by teacher judgement that were more or less generous. For example, Burgess and Greaves (2009) looked at the difference between teacher assessments and externally marked test scores at age 11 and found that teachers gave lower grades to pupils in receipt of free school meals (FSM), pupils with special educational needs (SEN) and black pupils. Similarly, Campbell (2015) found potential biases in judgements of pupils’ reading ability at primary school, where pupils from low-income families, boys, pupils with SEN and pupils who have English as an additional language (EAL) were less likely to be judged ‘above average’, after controlling for other factors including ability on a related cognitive test. A study of UCAS data (UCAS, 2016) found that Asian, Black, ‘Mixed’ and ‘Other’ ethnic groups were more likely to be over predicted, along with those from more disadvantaged areas and female students.
Ofqual published a review of studies of teacher predictions in 2020 (Lee & Walter, 2020) and an update with a review of concurrent teacher judgements in 2021 (Lee & Newton, 2021), including those studies mentioned above. From these reviews it was concluded that, overall, the results of previous research were mixed, but suggest a slight bias in favour of female students in teacher assessments and some evidence for higher ratings for black and Asian students when teachers predict A level grades.
The largest and most consistent effect across previous studies of teacher judgement suggested a bias against those with special educational needs, although the size of this effect was still relatively small. Results for socioeconomic status were less clear, with studies of teacher predictions generally suggesting higher teacher grades for more disadvantaged students, whereas studies of concurrent teacher assessment suggest the opposite effect and a relative advantage for less disadvantaged students. Overall, evidence from the relatively small number of relevant studies available suggested that where differences between exam results and teacher judgements can be linked to student characteristics, the effects are usually small and results between studies are inconsistent and, in some cases, contradictory. Even within the same study different effects are sometimes found between subjects. This suggests that given current evidence, there is not a substantial reason to expect there to be additional bias in CAGs related to candidate characteristics, when compared to grading in a normal year.
However, previous research published by Ofqual on results from 2020 has shown that the generosity of teacher judgements differed between subjects, which had some impact on inter-subject comparability compared to previous years (He & Black, 2020). Analysis of both GCSE and A level results showed that, in general, subjects had been graded more leniently in 2020 compared to previous years, both from looking at weighted mean grades and by applying a Rasch difficulty model. For GCSE, this constituted an overall leniency of around three fifths of a grade, and, at A level, around half a grade. Analysis showed that this resulted in a narrowing of differentiation between grades in terms of difficulty. The study identified that there had also been substantial differences between subjects in the amount of leniency, which had an impact on the rank order of subject difficulties seen in previous years and represented significantly more change in subject rank order than is usually found between years. This study did not attempt to identify if there were any patterns across subjects in this leniency in terms of assessment structure or subject type.
Current study
In this study we use the grades awarded via teacher judgement in 2020 (CAGs) as a unique case study to evaluate the similarities and differences between the factors influencing CAGs in 2020 and those linked to grades awarded in previous years, when candidates took assessments as normal. For this we use results data for England in 2019 and 2018 as a benchmark for normal outcomes and changes between these two years as an indication of the size of normal fluctuations in the relationships between grades and other factors. Uniquely here we have access to a large dataset covering all results awarding in all three years as well as a large number of candidate and school level attributes taken from data held by Ofqual and linked to demographic data from the National Pupil Database (NPD) compiled by the Department for Education (DfE).
When assigning grades to students, teachers were asked to make an absolute judgement of students’ academic ability (Thiede et al., 2019). The accuracy of absolute judgement decisions is usually evaluated by looking at the difference between predicted and actual levels of achievement (Thiede et al., 2019). Unfortunately, in this case we have no ‘actual level of achievement’ to compare teacher judgements to, as no students took exams alongside receiving a teacher judgement. Instead, here we examine if the relationships between grade awarded and candidate, school and subject characteristics are substantially different to the patterns of those relationships in previous years. Identifying unique changes in these relationships in 2020 may help to shed light on the decision-making processes used by schools and colleges in allocating CAGs, and more broadly some features which may influence teacher judgement in general. This may also help to identify areas where bias, unconscious or otherwise, could have occurred. In any year, there will be differences in results between groups of candidates and these will have complex causes. So, we are not aiming to evaluate the reasons for these differences in a normal year, but to see if the relationships with candidate, school or subjects change between 2019 and 2020 in a way which cannot be attributed to normal fluctuations (as defined by the 2018 to 2019 change).
It is worth acknowledging upfront that any relationships identified through the following analysis cannot be said to be causative of grading differences. In this type of study, it is important to acknowledge that some of the relationships may be simple correlations and there may be other unmeasured causative factors involved, which were not available to the analyses, that may have had an influence on results. Also, due to the nature of the very large datasets used here, even very small differences between groups may be ‘statistically significant’, when in reality the effect on grades due to these differences may have very little real-world impact. Only where factors have a significant relationship with grades and the size of that effect is meaningful in one or more years, are changes in those relationships likely to be meaningful. Therefore, throughout we will attempt to put results into context by defining notable levels of change in the relationships between variables and candidates’ grades. However, we also acknowledge that even small effects may have an impact on some individuals.
Aim and research questions
The main aim of the study is to evaluate whether there were any observable patterns in the allocation of CAGs in 2020 that differ from patterns observable in grades awarded in normal years (represented by years 2018 and 2019). These grading patterns are defined by the relationships between grade awarded and other information known about candidates, schools and subjects.
Research questions
- Did features at the candidate, centre or subject level explain more or less of the variability in CAGs compared to the variability explained in grades in a normal year, suggesting those features had a greater or lesser impact on grades in 2020 than in a normal year?
- Did students with certain characteristics obtain higher or lower CAGs relative to other students, when compared to normal years, after controlling for other factors?
- Did certain types of centres award higher or lower CAGs relative to other centre types, when compared to normal years, after controlling for other factors?
- After controlling for centre and candidate features, were grades awarded in certain subjects or subject types higher or lower than other subjects, when compared to grades awarded in normal years?
Methods
Data
For the analysis, data on GCSE and A level results from years 2018-2020 held by Ofqual was combined with data on candidate characteristics from DfE and other additional publicly available sources of data on school attributes and subject details (Ofqual, 2017, 2018). Ofqual data was matched to the NPD using candidates’ first name, surname and date of birth and only NPD data for candidates with unique matches was retained. Candidates who could not be uniquely matched or who were matched but had no available data in the NPD were classed as having ‘missing NPD data’. An analysis and discussion of issues with missing data in the NPD can be seen in the previously published equalities analysis by Ofqual (Lee et al., 2020).
A key point highlighted is that candidates with missing NPD data are not randomly distributed across centres. Independent centres have particularly high rates of missing data (making up 69% of all missing data at GCSE and 36% at A level, in the sample used for analysis), as submitting this data to the NPD is not mandatory for non-state schools. Sixth form colleges also have a relatively high rate of missing data at A level (48% of all missing data in sample, see Appendix A for further details of patterns of missing data). However, as patterns of missing data are relatively stable between the years included in the analysis, particularly at A level where overall missing rates are higher, this should not substantially affect comparisons made over time, which is the focus of the analyses presented here.
Data was restricted to only ‘typical’ candidates to support making like-for-like comparisons between years. This helps make the interpretation of analyses easier and subsequent conclusions clearer for this core group of candidates. For A levels this consisted of 18-year-old students taking three A levels, and for GCSEs, 16-year-old candidates taking at least 3 GCSEs. Age was judged as on the 31st August in the year candidates took exams. For the core modelling, data was also restricted to only candidates who also had prior attainment data available, as this is a key predictor of exam results. Again, missing data for prior attainment is not distributed randomly, and is proportionally highest for candidates at independent schools at GCSE (55% of ‘typical candidate’ entries at independent centres have missing prior attainment, making up 22% of all entries with missing data). At A level, missing prior attainment was more evenly distributed although the majority came from sixth form centres (31%) followed by FE/Tertiary colleges (26%) and Independent centres (23%; see Appendix A for further details).
Candidates from ‘Missing’ and ‘Other’ centre types were also removed as there is evidence from the data that entry patterns for candidates from centres in the ‘Other’ category were different in 2020 compared to previous years, reducing the comparability of this group over time. Private candidates who are not taught at a centre, who would fall under this category in a normal year, were only able to receive CAGs in 2020 if Heads of Centres could be confident in ranking them alongside other students, which in many cases was not possible (Ofqual, 2020a). Students with ‘Other’ and ‘Missing’ centre types represent 2.1% of the GCSE data and 1.3% of all A level entries across all three years, but only 1.3% of GCSE ‘typical’ candidate entries and 0.7% of A level ‘typical’ candidate entries. Centre level variables were calculated before restricting samples, to give the most accurate indication of centre characteristics. See Appendix B for summary statistics of data before and after filtering.
For GCSE, only subjects which were awarded on the reformed 9 to 1 grading scale were included in analysis. This means that only subjects in phase 1 and phase 2 of GCSE reform – those with results first issued in 2017 and 2018 respectively - were included (Ofqual, 2017). Due to issues of comparability this also involved removing combined science awards from the analysis as this subject is awarded on a double grading scale, making conversion and comparison to other subjects difficult. Only subjects which were awarded in all three years were included in analyses, although it is possible that individual assessment specifications may not have been available across all three years, for example where specifications are available in the same subject but from different exam boards in different years.
The majority of GCSE modelling was carried out on a fully random sample of 1,500,000 results (approximately 500,000 from each year modelled, ~17% of entries before sampling), to create a more manageable dataset for computational reasons. The sample was checked to ensure it was representative of the total data. A comparison of the dataset before and after sampling is shown in Appendix B. Key models were also run on the full dataset, which indicated there were no substantial differences in model estimates, all results presented are those from models using the sampled data for consistency. Table 1 provides details of the candidates and results included in the final analysis, while a more detailed table and a table for the full dataset before filtering is included in Appendix B.
Table 1. Numbers and percentages of entries, centres and candidates in the sample used for analysis. Centre breakdowns represent number and percentage of total centres in each group, candidate breakdowns represent number and percentage of candidates in each group.
| GCSE 2018 | GCSE 2019 | GCSE 2020 | A level 2018 | A level 2019 | A level 2020 | |
|---|---|---|---|---|---|---|
| Total Entries | 481720 | 501001 | 517198 | 377447 | 387600 | 420129 |
| Total Centres | 3883 | 3990 | 4046 | 2513 | 2500 | 2475 |
| Centre Type: Mainstream secondary | 3099 (79.8%) | 3147 (78.9%) | 3179 (78.6%) | 1762 (70.5%) | 1779 (70.8%) | 1746 (70.5%) |
| Centre Type: College (FE/Tertiary) | 39 (1%) | 34 (0.9%) | 37 (0.9%) | 79 (3.2%) | 70 (2.8%) | 75 (3%) |
| Centre Type: Grammar | 73 (1.9%) | 73 (1.8%) | 73 (1.8%) | 70 (2.8%) | 70 (2.8%) | 72 (2.9%) |
| Centre Type: Independent | 662 (17%) | 725 (18.2%) | 750 (18.5%) | 494 (19.8%) | 493 (19.6%) | 485 (19.6%) |
| Centre Type: Sixth Form college | 10 (0.3%) | 11 (0.3%) | 7 (0.2%) | 95 (3.8%) | 101 (4%) | 97 (3.9%) |
| Total Students | 302110 | 315349 | 326896 | 129155 | 130944 | 141869 |
| Gender: Female | 152952 (50.6%) | 159682 (50.6%) | 165319 (50.6%) | 73700 (57.1%) | 73750 (56.3%) | 80431 (56.7%) |
| Gender: Male | 149158 (49.4%) | 155667 (49.4%) | 161577 (49.4%) | 55473 (42.9%) | 57204 (43.7%) | 61462 (43.3%) |
Analysis methodology
The core modelling approach used a series of multilevel models using grades converted to a numeric score as the dependent variable. For GCSE, grades 9 to U were converted to a 9 to 0 scale and for A level, grades A* to U were converted to a scale of 6 to 0, with the assumption that grades adequately reflect a linear scale, which is discussed further below. Models were nested by layering in variables from different levels to the analysis: prior attainment, candidate, centre, subject-within-centre and subject. This set of nested models was run separately for each year, on awarded grades in 2018 and 2019 and CAGs in 2020. The core models presented in the following sections included all subjects and a fixed effect variable to account for differences in mean subject grade. Random effects of candidate ID and centre number were included in all models to account for the hierarchical structure of the data and the non-independence of datapoints within these groups, that is students within the same centre being more similar to each other than to students in other centres.
This type of multivariate analysis allows the effect of individual variables to be assessed after holding other effects constant. We can also compare the coefficients produced by the three separate sets of models for each year to observe if there have been meaningful changes in these relationships between years, with the assumption that there have not been major shifts in the cohort not controlled for by the factors included in the model.
The use of a series of nested models allows us to identify how much variation in grades is explained by the variables included at each level - prior attainment, candidate, centre, subject-within-centre or subject - and crucially to the analysis presented here, whether and how the amount of variance explained changes between the years analysed. For example, an increase in the variance explained at a particular level in a particular year would suggest that characteristics included at that level have a stronger relationship with, and may be having a larger effect on, candidates’ grades in that year compared to other years.
The set of nested models comprised of:
- Model 0 - Null model only containing subject fixed effect (also included in all other models)
- Model 1 - just prior attainment
- Model 2a - prior attainment and other candidate level variables
- Model 2b - prior attainment and centre level variables
- Model 3 - prior attainment, centre and candidate level variables
- Model 4 - prior attainment, centre and candidate variables and subject-within-centre prior performance.
Additional models 5a and 5b were used to evaluate subject level effects. Model 5a included all the variables in model 4 and in addition the proportion of Non-Exam Assessment (NEA) included in each subject. Model 5b included variables indicating if the subject was a ‘facilitating subject’ for A level or an EBacc subject for GCSE and five broad subject groupings (STEM, Applied, Languages, Humanities, Expressive, as in Bramley 2014, see Appendix C for details). Facilitating subjects are those included in a list of subjects which historically were deemed valuable to a wide range of degree courses at selective universities, representing subjects which tend to be more academic in nature, although this list has been discontinued in recent years (Russell Group, 2016). EBacc subjects are those that are included in the English Baccalaureate, a designation which is used for school accountability to encourage students to take GCSEs that “keep young people’s options open” and again include some of the more academic subjects (DfE, 2019). 5a and 5b were modelled separately as subject type and amount of NEA are highly related and co-vary, creating difficulty in interpretation if included in the same model. Table 2 provides details of the variables included in each of the models.
Table 2. Details of variables included in core modelling. Reference groups are either the first category listed for unordered categories or the ‘medium’ group for ordered categories, shown in bold.
| Variable | Level | Details | Included in models |
|---|---|---|---|
| Prior attainment score | Candidate - Prior attainment | Normalised mean GCSE or KS2 score -Standardised to mean 0, SD of 1 | 1,2a,2b,3,4,5a,5b |
| Prior attainment category | Candidate - Prior attainment | Quintiles: Very low, low, medium, high, very high | 1,2a,2b,3,4,5a,5b |
| Prior attainment score by Prior attainment category interaction | Candidate - Prior attainment | 1,2a,2b,3,4,5a, 5b | |
| Gender | Candidate | Female, Male | 2a,3,4, 5a, 5b |
| DOB by quarter | Candidate | 1:Sep-Nov, 2:Dec-Feb, 3:March-May, 4:June-Aug | 2a,3,4, 5a, 5b |
| SEN Status | Candidate | No, Yes | 2a,3,4, 5a, 5b |
| Language Group | Candidate | English, Other, Unclassified | 2a,3,4, 5a, 5b |
| Ethnic Group | Candidate | White, Asian, Black, Chinese, Mixed Background, Unclassified, Any Other Ethnic Group | 2a,3,4, 5a, 5b |
| IDACI Score group | Candidate | Quintiles: Very low, low, medium, high, very high | 2a,3,4,5a, 5b |
| Free School Meal Eligible | Candidate | No, Yes | 2a,3,4, 5a, 5b |
| Missing NPD flag | Candidate | Flag to indicate if candidates had missing NPD data: No, Yes | 2a,3,4, 5a, 5b |
| Subject cohort size group | Centre | Number of students taking subject within centre. Split into three equal groups: Small, medium, large | 2b,3,4, 5a, 5b |
| Centre Type | Centre | Secondary (includes all mainstream state schools ie academies, free schools, comprehensive), College (FE and Tertiary), Independent, Grammar, Sixth Form (sixth form colleges) | 2b,3,4, 5a, 5b |
| Proportion SEN group | Centre | Three equal groups: Low, medium, high | 2b,3,4, 5a, 5b |
| Mean IDACI score group | Centre | Quintiles: Very low, low, medium, high, very high | 2b,3,4, 5a, 5b |
| Proportion EAL group | Centre | Three equal groups: Low, medium, high | 2b,3,4, 5a, 5b |
| Mean prior attainment group | Centre | Three equal groups: Low, medium, high | 2b,3,4, 5a, 5b |
| Region of country | Centre | London, East Midlands, East of England, North East, North West, South East, South West, West Midlands, Yorkshire and Humber, Missing | 2b,3,4,5a, 5b |
| Mean previous years grade group | Subject within Centre | Mean grade from the subject/centre in previous year in three equal groups: low, medium, high | 4, 5a, 5b |
| Mean previous year value added group | Subject within Centre | Mean VA score from previous year (scaled grade -scaled prior attainment) in three equal groups: low, medium, high | 4, 5a, 5b |
| Mean previous years grade group by Mean previous year value added group interaction | Subject within Centre | 4, 5a, 5b | |
| Subject | Subject | Subject groupings used to produce CAGs | 0,1,2a,2b,3,4,5a, 5b |
| NEA group | Subject | None, low (10-20%), medium (30-40%), high (50-60%), All | 5a |
| Subject type | Subject | Humanities, Applied, STEM, Expressive, Languages | 5b |
| Facilitating/EBacc subject | Subject | No, Yes | 5b |
Prior attainment scores for both Key Stage 2 results and mean GCSE scores were initially provided on a normalised scale, ranging from 0 to 100. For analysis these variables were standardised to a mean of 0 and a standard deviation of 1 across years. For the core modelling prior attainment was included as both five categorical quantiles, very low to very high, and a continuous linear variable, as well as the interaction between the two. This allows the relationship between prior attainment and grade to be non-linear and enables us to estimate the slope of the relationship between prior attainment and grade for each of the prior attainment quantiles. For each variable divided into quantiles, either three or five groups, groups were calculated based on percentile ranks across years to divide variables into roughly equal sized categories, meaning the same boundary scores were used in all three years.
Quantiles were calculated on candidates and centres included in the analysis rather than the whole population. Cut-offs were calculated after restricting to unique candidates for candidate level variables and unique centres for centre level variables. Details of the cut-off scores for each of these categories are provided in Appendix D. For special education needs, candidates who were either classified as SEN with a statement or without a statement were grouped as having SEN, all other candidates were classed as ‘not SEN’.
Alternative models
A series of alternative models were run to provide additional confirmation of the findings of the core models and to provide additional insight into some specific areas of interest.
The core models assume that grades represent a linear scale, therefore the interval between each grade is consistent and that the relationship between each variable and grade is consistent across the grade distribution, which may not always hold. To provide confidence in these results the models were rerun as binary logistic models evaluating the probability of candidates attaining at least specific key grades or above. The dependent variable was 0 for candidates that did not achieve at least the grade modelled and 1 if they achieved that grade or above. For GCSE, the key grades evaluated were grade 4 and grade 7 or above, and for A level the grades evaluated were grade C and grade A or above.
A second alternative set of models were produced with prior attainment as a nine-category quantile and an additional category for ‘missing prior attainment’ instead of the two prior attainment variables and interaction described above. This was to avoid excluding candidates based on missing prior attainment, allowing us to examine if their inclusion or exclusion has any substantial impact on model estimation. It also allows us to investigate the change in the relationship between prior attainment and grade at multiple steps along the distribution.
A final set of additional models were carried out to examine some interactions of interest. These models followed the specification for model 4 but added in interactions between prior attainment and socio-economic status (SES), between SES and ethnicity, and between ethnicity and proportion of non-white students in the centre.
Identifying changes between years
Models were evaluated in multiple stages to identify notable changes in relationships in 2020 compared to previous years. First, the variance explained by the variables included in each nested model was evaluated to identify the percentage of variance explained at each level - prior attainment, candidate, centre, subject-within-centre - and how this changed between 2020 and previous years. Percentage of total variance explained was calculated for each model using pseudo R-squared values, based on the method described by Nakagawa and Schielzeth (2012). This method provides a breakdown of the marginal R-squared, the percentage of variance explained by the fixed effect variables included in the model, and the conditional R-squared, the total percentage of variance explained by the model including both the fixed effects and the random effects included to account for the clustered nature of the data (student ID and centre number). This allows partitioning of the variance into ‘explained’ variance by the variables included in each model and additional ‘unexplained’ variance between candidates and between centres.
Next, we evaluated the meaningfulness of changes in model coefficients. Due to the fact that these models contain a large number of observations, variables may be statistically significant even if effect sizes are very small. We therefore cannot simply rely on significance, which may be misleading, we also need to consider the meaningfulness of the effect sizes. Variables which showed no significant relationship with grade in either 2020 or 2019 were subsequently not evaluated further. For model coefficients which were significantly different than 0 in 2019 or 2020, we compared the size of the coefficients between different years to evaluate how the relationship between each variable and grade awarded differed between years. Changes in 2020 were considered notable if there had been a larger change in the coefficients between 2019 and 2020 than between 2018 and 2019 and the change in coefficient between 2019 and 2020 was larger than 1/10th of a grade (±0.1). This is to ensure that coefficient changes were only discussed as being of substantive interest if they represented changes larger than ‘normal fluctuation’ between years and also represent an effect which is large enough to be meaningful in the interpretation of assessment results.
A second criterion was used to identify changes of borderline interest, by identifying coefficients which were at least 0.05 outside of the ‘normal’ range, defined by the coefficients from 2018 and 2019 as the maximum and minimum of this range. Highlighting coefficients in 2020 that were 0.05 higher than the highest previous coefficient from 2018 or 2019 or 0.05 lower than the lowest previous coefficient.
Results
Results are presented for A levels followed by those for GCSE. Within each of these sections we start by highlighting some descriptive analyses of some of the key variables. Next, we present the results of the core series of models for 2018, 2019 and 2020. To do this we follow the steps outlined above, first by looking at the variance explained at each level and how these differ between years to identify if there have been significant shifts in which groups of variables have the strongest relationship with grade in 2020. Next, we look at changes in regression coefficients with significant effects using the procedure discussed previously. Coefficients from these models represent the relative difference in mean grade between the group of interest and the reference category for that variable. Where these coefficients have changed between years it represents a relative increase or decrease in the mean grade for candidates in that category relative to the mean grade of those in the reference category. Changes in ‘Missing’ categories are only discussed where they are likely to be meaningful.
Following this evaluation of the core linear models, we present findings from the additional model specifications. For each of these additional models, results are only discussed in detail where they notably differ from the results of the core models (full model outputs can be found in Appendix E and F).
First, the binomial models, which include grade as a binary variable, whether candidates achieved a C or A or above for A level or 4 or 7 or above for GCSE, and evaluate the probability of candidates achieving each grade or above are discussed. These models provide an additional assurance of the results found in the core modelling. These binomial models also allow us to identify if the effects identified in the core models apply over the whole grade range or have more of an impact in the middle of the grade distribution (grade 4 or C) or only towards the top of the grade range (grades A or 7).
Second, the models including candidates with missing prior attainment and including prior attainment as a series of quantile categories are discussed. This model specification allows us to ensure that model results are not biased by the exclusion of candidates with missing prior attainment data. The prior attainment quantile modelling approach also allows additional evaluation of the relationship between prior attainment and grade across the prior attainment range.
Finally, we present the results of a series of models using the core modelling approach but layering in a few additional interactions between prior attainment, socio-economic status and ethnicity. These are effects that have been variously identified in previous studies of teacher judgement as having a possible impact, but their inclusion in the core models here would make the main effects difficult to interpret.
A level
Descriptive statistics
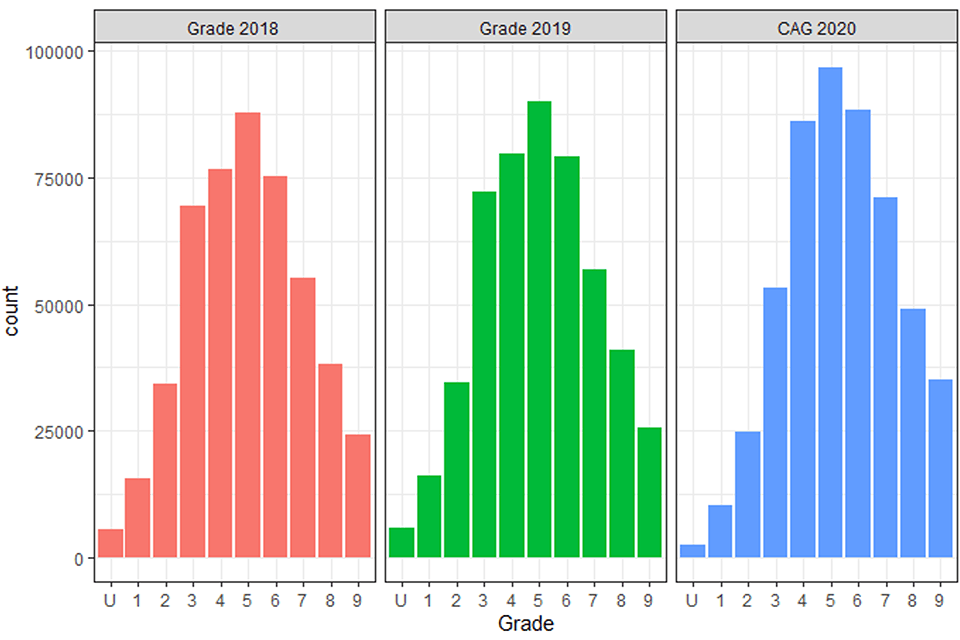
At A level there has been an average across subject increase in outcomes of around half a grade in 2020 compared to previous years (+0.49, Table 3). Figure 1 shows the grade distribution for results in 2018 and 2019 and CAGs in 2020 and it can be seen there is a marked shift of the distribution to the right, indicating grades have overall moved up the grade range.
Figure 1. Grade distributions in 2018, 2019 and CAG distribution in 2020.
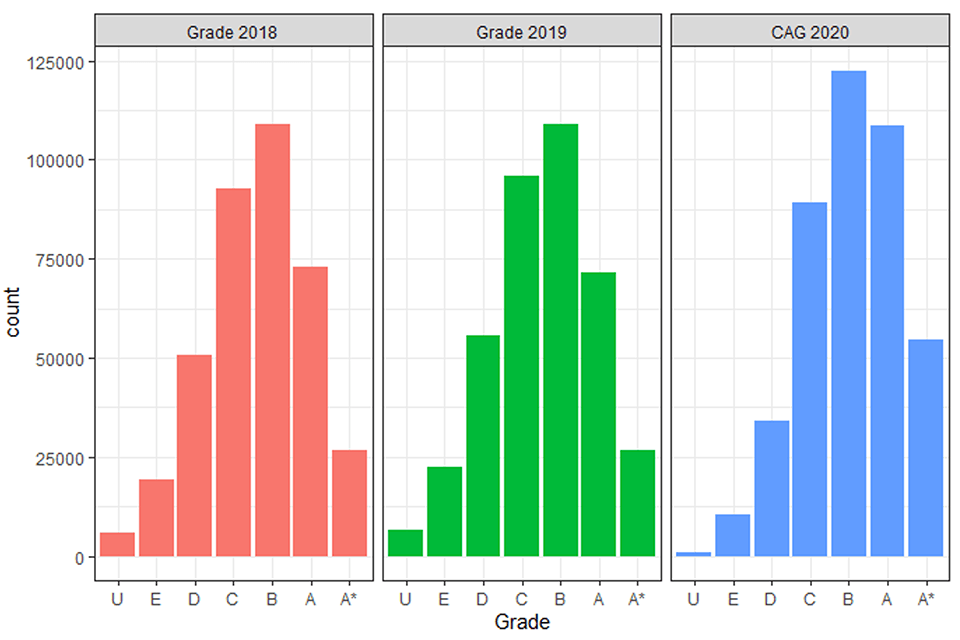
Three histograms showing the number of each grade awarded in 2018, 2019 and CAGs awarded in 2020. The grade distribution for CAGs in 2020 is higher up the grade range compared to the other two histograms.
Table 3. Descriptive statistics for A level data used in analysis.
| 2018 | 2019 | 2020 | 2020 minus average of previous years | |
|---|---|---|---|---|
| Overall Mean Grade | 3.60 (1.35) | 3.55 (1.37) | 4.06 (1.25) | 0.49 |
| Correlation with prior attainment | 0.55 | 0.56 | 0.60 | 0.05 |
| Mean Grade – prior quintile 1 | 2.67 (1.19) | 2.58 (1.20) | 3.07 (1.07) | 0.45 |
| Mean Grade – prior quintile 2 | 3.12 (1.19) | 3.05 (1.20) | 3.57 (1.08) | 0.49 |
| Mean Grade – prior quintile 3 | 3.5 (1.18) | 3.45 (1.19) | 3.99 (1.06) | 0.52 |
| Mean Grade – prior quintile 4 | 3.97 (1.14) | 3.92 (1.14) | 4.49 (1.01) | 0.55 |
| Mean Grade – prior quintile 5 | 4.73 (1.01) | 4.71 (1.03) | 5.20 (0.84) | 0.48 |
Note: Standard deviations shown in brackets.
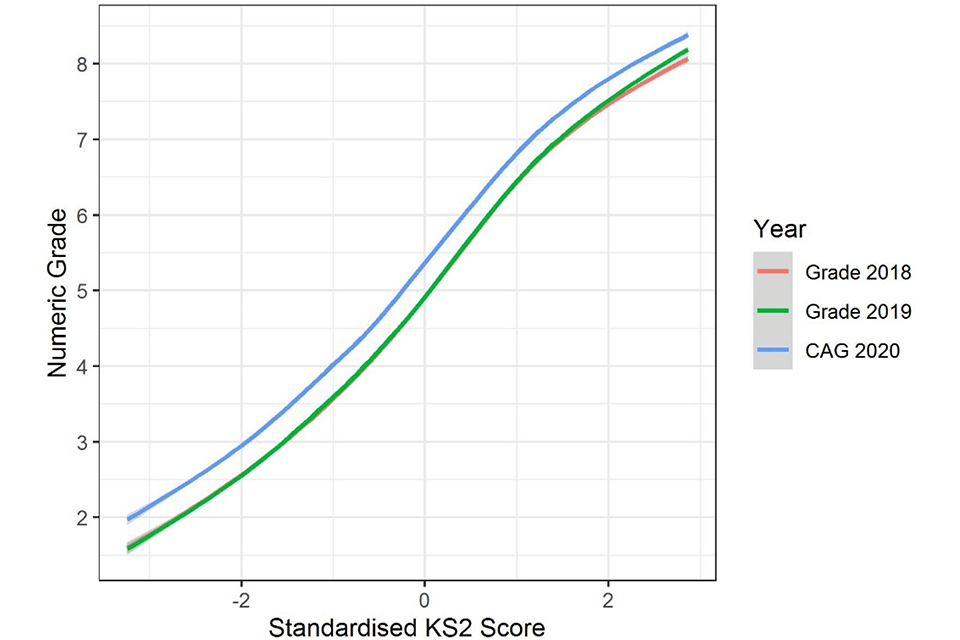
Figure 2 represents the relationship with prior attainment and indicates that this relationship has remained relatively consistent between years, as the lines are broadly parallel. However, data in Table 3 suggests in 2020 slightly more generous grades were awarded to candidates with higher prior attainment, except for those in the highest quintile group. This suggests a slight plateauing of the relationship with prior attainment at the top end of the distribution. This is likely to be due to the grade distribution reaching the top limits of the available grade range causing truncation at the top end through a ceiling effect. The reduced standard deviation in grades in 2020, particularly for the highest prior attainment quintile would support this (see Table 3).
Figure 2. Relationship between prior attainment and grade in all three years evaluated with confidence intervals.
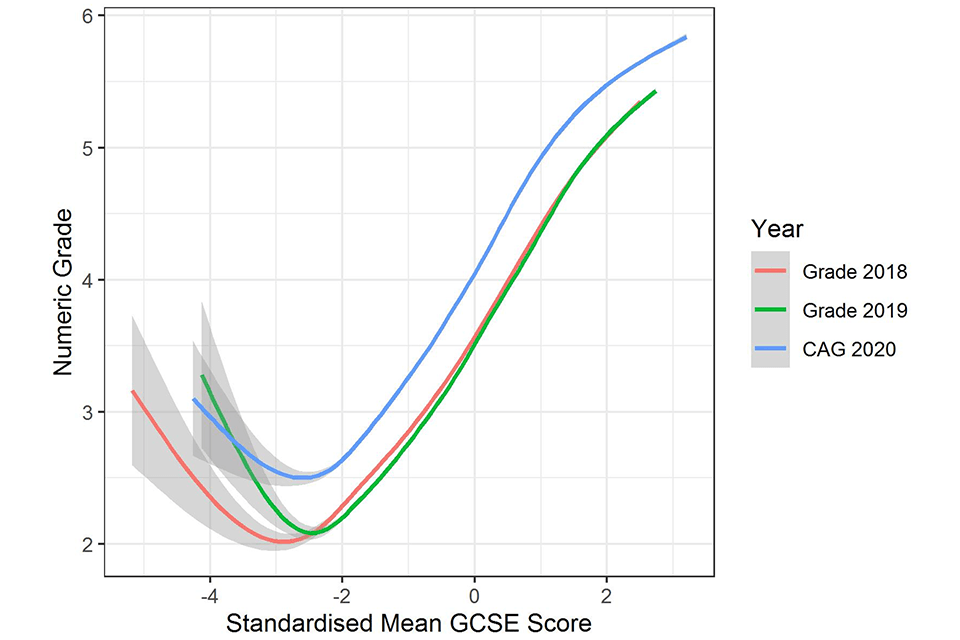
A line graph showing the relationship between mean GCSE score and grades. Three curves show the relationship in 2018 and 2019 and for CAGs in 2020. The curve for CAGs is higher than the other two curves but has a similar shape.
Note: Smoothed curve fitted using a generalized additive model from R package ggplot2. Confidence intervals are wider towards the bottom end of the mean GCSE scale as the number of candidates is small.
Table 4 shows the mean grade in each year for each of the category breakdowns and the difference between 2020 and an average of the previous two years. The most notable difference in this descriptive data is that small cohorts appear to have greater increases in grades in 2020 than larger cohorts. Also, that colleges, grammar schools and sixth form centres have a slightly smaller increase in grades and independent centres the largest increase from previous years. At subject level, the biggest differences are the larger relative increase in grades in languages and expressive subjects compared to others.
Table 4. Mean grades in each year for breakdowns by subject cohort size, centre type and subject group.
| Subgroup | 2018 | 2019 | 2020 | 2020 minus average of previous years |
|---|---|---|---|---|
| Subject Cohort Size: Not-small | 3.61 | 3.55 | 4.05 | 0.47 |
| Subject Cohort Size: Small | 3.49 | 3.49 | 4.26 | 0.77 |
| Centre Type: College | 3.48 | 3.20 | 3.77 | 0.43 |
| Centre Type: Grammar | 3.82 | 3.80 | 4.21 | 0.40 |
| Centre Type: Independent | 4.04 | 4.03 | 4.58 | 0.55 |
| Centre Type: Secondary | 3.53 | 3.46 | 4.00 | 0.51 |
| Centre Type: Sixth form | 3.57 | 3.51 | 3.93 | 0.39 |
| Subject Group: Applied | 3.40 | 3.36 | 3.88 | 0.50 |
| Subject Group: Expressive | 3.84 | 3.86 | 4.40 | 0.55 |
| Subject Group: Humanities | 3.61 | 3.59 | 4.06 | 0.46 |
| Subject Group: Languages | 3.87 | 3.85 | 4.47 | 0.61 |
| Subject Group: STEM | 3.57 | 3.45 | 4.00 | 0.49 |
Note: Final column shows the difference between 2020 grades and an average of the previous two years.
Variance explained at each level
Total variance of results was smaller in 2020 compared to previous years (2018: 1.90, 2019: 1.94, 2020: 1.59), suggesting that the overall spread of grades was smaller. In model 0 (only including the subject fixed effect and random effects), there was both less between candidate variance (2018: 1.02, 2019: 1.08, 2020: 0.98) and between centre variance (2018: 0.33, 2019: 0.34, 2020: 0.2). This is likely in part due to the truncation of the grade range discussed above.
Table 5. Percentage of variance explained by fixed model effects (marginal pseudo – R squared) and full model including fixed and random effects (conditional pseudo R-squared)
| Model | Marg. 2018 | Marg. 2019 | Marg. 2020 | Cond. 2018 | Cond. 2019 | Cond. 2020 |
|---|---|---|---|---|---|---|
| Mod 0 (null) | 7% | 8% | 7% | 71% | 73% | 73% |
| Mod 1 (prior att.) | 38% | 40% | 45% | 67% | 69% | 70% |
| Mod 2a (cand.) | 38% | 40% | 45% | 67% | 69% | 70% |
| Mod 2b (centre) | 39% | 41% | 45% | 67% | 69% | 70% |
| Mod 3 (cand & centre) | 40% | 42% | 45% | 67% | 69% | 70% |
| Mod 4 (centre prior perf.) | 41% | 43% | 46% | 68% | 70% | 70% |
Table 6. Estimates of the variance explained at each level, calculated as the difference in marginal R-squared between nested models.
| Level | 2018 | 2019 | 2020 |
|---|---|---|---|
| Between Subjects | 7.0% | 8.0% | 7.1% |
| Prior Attainment | 30.6% | 31.6% | 38.1% |
| Candidate Variables | 0.7/0.8% | 0.6/0.4% | 0.2/0.1% |
| Centre Variables | 1.7%/1.8% | 1.8%/1.6% | 0.1%/0% |
| Subject-Centre Prior Performance | 0.7% | 1.1% | 1.0% |
| Unexplained Centre | 1.7% | 1.9% | 2.0% |
| Unexplained Candidate | 22.3% | 25.0% | 24.8% |
| Residual Variance | 29.6% | 30.2% | 32.4% |
Note: For candidate and centre level variables two estimates are provided. The first as the difference between model 1 and 2a/2b, the second as the difference between model 2a/2b and 3.
Tables 5 and 6 show the percentage of the total variance explained by each model and at each model level, as the total variance was slightly smaller in 2020 these proportions may not represent the same amount of variance in absolute terms. For the A level models prior attainment explained the largest proportion of variance of any of the fixed effect variables included in the models for all years. In addition, in 2020 the variance explained by prior attainment was notably higher than in previous years by 6-7% suggesting that prior attainment is a stronger predictor of grade in 2020 compared to previous years. Candidate level variables explained only a very small amount of variance in previous years (around 1%) and this was even smaller in 2020, explaining only around 0.1% of variance. In previous years centre level variables explained around 2% of the variance but they explained almost no variance in 2020. This suggests that both candidate and centre level variables are overall having a smaller impact on grades in 2020 than in a normal year. Finally, the addition of centre prior performance explained around 1% of the variance in all three years. In all cases, adding additional fixed effects variables did not improve the overall explanatory power of the models (conditional R-squared), due to random effects for candidate and centre already taking account of much of the variance. However, adding in additional variables did help account for some of the unexplained variation between centres and between candidates (see Table 5). Although even once all variables were included, a large proportion of the variance in grades in all years was due to unexplained differences between candidates (22-25%) and residual variance representing additional unexplained variation in grades (30-32%).
Changes in coefficients
Following the main criteria set out above for interpretable changes in coefficients - that is, those with a change greater than 0.1 between 2019 and 2020 and a greater absolute change between 2019 and 2020 than between 2018 and 2019 - there were a small number of notable changes at A level (See Figure 3). After controlling for all other factors, male students outperformed female students in 2018 and 2019 by around 0.22-0.24 grades, however in 2020 this gap was reduced to 0.06 grades. This suggests a small relative decrease in outcomes for male students in 2020 compared to previous years.
Compared to mainstream secondary schools, sixth form colleges had relatively less generous grades in 2020 by around 0.12 grades on average than in 2019. In previous years candidates at sixth form centres usually outperformed secondaries by on average around 0.06 grades, whereas in 2020 their grades were on average 0.06 grades lower.
Centres with the highest average deprivation scores had relatively higher outcomes in 2020 compared to 2019 by 0.1 grades on average. Usually, candidates at these centres attain grades slightly lower on average than candidates at centres with average deprivation scores, but in 2020 had slightly higher grades by 0.06 grades.
Schools with high average prior attainment had lower outcomes in 2020 by 0.13 grades compared to medium prior attainment centres, whereas schools with low prior attainment grades increased on average by 0.14 grades. This is likely due to the effect noted previously of an overall increase in mean grade, resulting in a truncation of the grade distribution at the top end. Essentially, schools with previously lower performance had further to increase in 2020, whereas those at the top end were limited in the amount of increase possible.
Evaluating the effect of centre prior performance, suggests that centres with missing prior performance and value-added data, essentially those entering a subject for the first time, had relatively higher grades in 2020 than previous years. These centres in normal years tend to have outcomes lower than the reference group (2018: -0.18 grades, 2019: -0.12 grades), whereas in 2020 they had very similar outcomes to centres with average prior performance and value added.
Modelling also identified the plateauing effect of the relationship with prior attainment for candidates in the highest prior attainment group (See Appendix E). The slope of the relationship between prior attainment and grade for this group was around 0.72 in previous years but only 0.53 in 2020. The slopes for other prior attainment groups did not substantially change. This effect is more noticeable in the prior attainment quantile model, which shows that it is only those in the top prior attainment quantile (top 11%) which show this relative disadvantage (see details below). Again, this is likely due to candidates at the top end of the distribution not being able to increase their grades in 2020 by as much as those lower down the distribution as they are already attaining the maximum grade possible.
At subject level, modelling suggests that facilitating subjects were slightly more generously awarded than non-facilitating subjects by around 0.4 grades compared to 2019 (see Table 7). The order of subject generosity ranges from the Expressive subject group as the most generously awarded compared to 2019, followed by facilitating STEM, facilitating Humanities, Applied, not-facilitating STEM, not-facilitating Humanities and finally Languages. Breaking the subjects down separately by proportion of NEA showed that the most generous subjects were those with high proportions of NEA, the lowest increases in grades from 2019 were in subjects with low and medium levels of NEA, however those with all NEA or no NEA were in between (see Table 8).
Table 7. Model coefficients from Model 5b for facilitating and subject groups, with standard errors in brackets.
| Group | 2018 | 2019 | 2020 | 2020 minus average |
|---|---|---|---|---|
| Applied | -0.18 (0.02) | -0.24 (0.02) | 0.11 (0.01) | +0.33 |
| Expressive | -0.43 (0.04) | -0.47 (0.04) | 0.03 (0.03) | +0.48 |
| Languages | 1.77 (0.15) | 2.02 (0.16) | 1.64 (0.19) | -0.26 |
| STEM | 0.22 (0.07) | 0 (0.07) | 0.11 (0.05) | 0 |
| Facilitating | -0.52 (0.04) | -0.66 (0.04) | -0.29 (0.04) | +0.3 |
Note: Reference group is non-facilitating humanities. Final column shows difference between 2020 coefficient and the average of the previous years.
Table 8. Model coefficients from Model 5a for NEA groups, with standard errors in brackets.
| Group | 2018 | 2019 | 2020 | 2020 minus average |
|---|---|---|---|---|
| Low | 0.29 (0.06) | 0.66 (0.06) | 0.18 (0.04) | -0.3 |
| Medium | 1.55 (0.15) | 2.02 (0.16) | 1.53 (0.20) | -0.26 |
| High | -0.13 (0.07) | 0.19 (0.07) | 0.21 (0.05) | +0.18 |
| All | 0.30 (0.08) | 0.45 (0.09) | 0.35 (0.06) | -0.03 |
Note: Reference group is the no NEA group. Final column shows difference between 2020 coefficient and the average of the previous years.
Figure 3. Model coefficients from core model 4 for 2018, 2019 and 2020, with standard error bars.
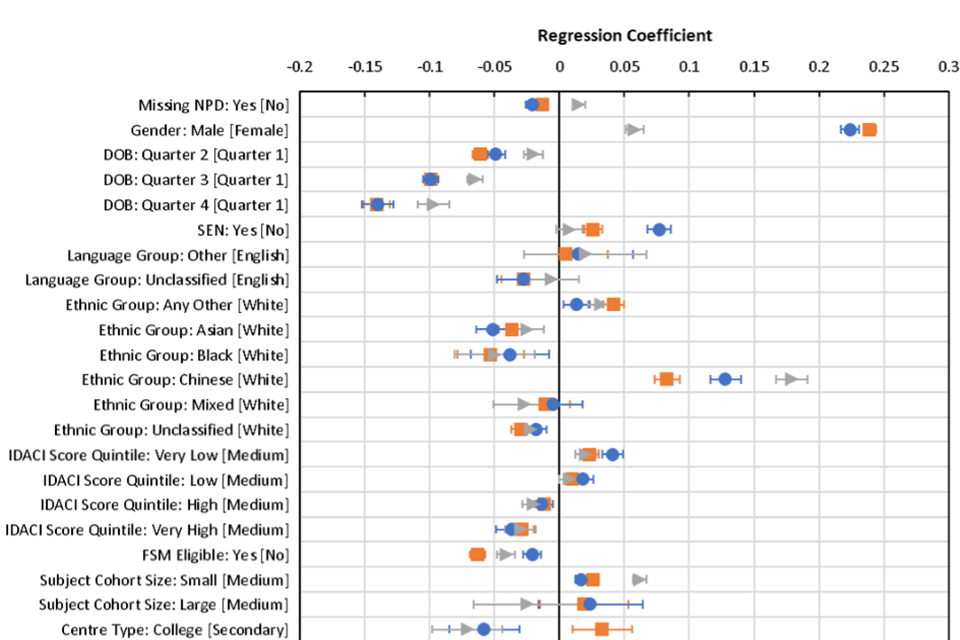
Note: Reference category for coefficients shown in square brackets. Missing categories and interaction effects are not shown.
Borderline changes
Using the criteria previously outlined for changes of borderline interest - coefficients more than 0.05 grades outside the ‘normal’ range defined by 2018 and 2019 models - then a few additional changes are highlighted as potentially notable.
Students in the Chinese ethnic group did particularly well in 2020, following a trend where their grades were 0.05 grades higher in 2019 than 2018 and again 0.06 grades higher in 2020 than 2019. Looking at centre type, independent centres average grades increased in 2020 by around 0.06 grades compared to mainstream schools. Finally, we see that there is a significant change in the interaction between centre mean prior value added and centre mean prior performance.
The group with the largest relative increase in grades is those from schools with low previous mean grades and low previous value added. These schools saw a relative increase in grades by 0.08 grades from 2019. The absolute difference in outcomes between this group and the medium group became non-significant in 2020. This may again be due to the truncation effect as centres starting from a lower starting point have further to increase on average in the grade range.
Although not significant by the criteria laid out above, and therefore only relatively minor effects, there were a few other interesting patterns in variables with multiple levels. The overall effect of birth date, by quarter of the year, was reduced in 2020. Fairly consistently in 2018 and 2019, younger students tend to have a slightly lower grades by around 0.04-0.05 grades per quarter of the year, whereas in 2020 this effect was reduced to only around 0.02-0.03 grades. There also appears to be a small change in the effect of cohort size; in previous years there are minor differences with both large and small cohorts attaining grades on average around 0.02 grades higher than medium sized cohorts. Whereas in 2020 there seems to be a small cohort advantage, with small cohorts attaining grades on average 0.06 grades higher than previously compared to the medium group and large cohorts attaining grades 0.03 lower. Finally, there seems to be a very small change in the effect of region of the country, although the differences between regions are usually relatively minor; in 2020 the majority of coefficients were closer to 0 than previous years suggesting a weakening of this effect.
Binomial models
The A level binomial model for both C and above and A and above overall showed similar patterns to those discussed above in the core modelling. Table 9 shows the percentage of candidates reaching at least grade C and grade A increased in 2020, with the increase at grade C particularly in the lower prior performance groups and the increase at grade A particularly in the highest prior attainment groups. When identifying notable changes in coefficients again only coefficients which saw a larger change between 2019 and 2020 than between 2018 and 2019 were considered. We also used a cut-off of at least a change of 0.2 in the log-odds of the coefficient between 2019 and 2020 to be notable. However, coefficients are reported in the text using odds-ratios for ease of interpretation (full output in Appendix E). Odds ratios greater than 1 indicate an increase in the probability of that group attaining the key grade compared to the reference group, whereas odds-ratios below 1 indicate a lower probability relative to the reference group.
Table 9. Percentage of candidates achieving each key grade analysed or above, by prior attainment group. C or Above indicated by C+, A or Above indicated by A+.
| C+ 2018 | C+ 2019 | C+ 2020 | C+ 2020 -average | A+ 2018 | A+ 2019 | A+ 2020 | A+ 2020 -average | |
|---|---|---|---|---|---|---|---|---|
| Overall percentage attaining grade or above | 80% | 78% | 89% | 10% | 26% | 25% | 39% | 13% |
| % Grade – prior quintile 1 | 58% | 55% | 73% | 17% | 5% | 4% | 8% | 4% |
| % Grade – prior quintile 2 | 72% | 70% | 85% | 14% | 10% | 9% | 18% | 8% |
| % Grade – prior quintile 3 | 82% | 80% | 92% | 11% | 19% | 17% | 32% | 14% |
| % Grade – prior quintile 4 | 90% | 89% | 97% | 7% | 33% | 32% | 54% | 22% |
| % Grade – prior quintile 5 | 97% | 97% | 99% | 2% | 64% | 63% | 83% | 19% |
Note: Additional column shows the difference in percentage between 2020 and the average of the previous two years.
Modelling the probability of candidates gaining at least C, in addition to some of the factors discussed above, the probability for candidates in small subject cohorts showed a notable increase from an odds ratio of 1.05 (5% more likely than medium group to attain at least a C) compared to medium sized cohorts in 2019 to 1.36 (36% more likely to attain a C compared to the medium group) in 2020.
At A and above there was a slight decrease in the probability of candidates with SEN status achieving an A from a significant odds ratio of 1.21 in 2018 (p<0.001) and 1.07 in 2019 (p<0.05), to a non-significant odds ratio of 0.986 in 2020 (p=0.65). Although this appears to be following a trend of decreasing effect, which was only moderately significant in 2019.
The binomial models highlighted some additional insights into variables already discussed as having notable changes in the core linear modelling. The reduced effect of gender in 2020 seen in the linear models was evident in the A and above model (Odds Ratio (OR) – 2018:1.61, 2019:1.57, 2020:1.19), but the shift was slightly larger in the C and above model (OR – 2018:1.57, 2019:1.57, 2020:1.03). The effect of students in the Chinese ethnic group doing particularly well in 2020 was seen more notably in the A and above model (OR – 2018:1.18, 2019:1.16, 2020:1.47) than the C or above model where the effect was marginal. Candidates from independent centres had a notable increase in the probability of achieving an A or above (OR – 2018:1.24, 2019:1.29, 2020:1.98), but not C or above, whereas candidates from sixth form centres had relatively lower probability of achieving at least a C (OR – 2018:1.12, 2019:1.15, 2020:0.89) and A (OR – 2018:1.08, 2019:1.10, 2020:0.85). Candidates in centres with very high mean IDACI scores saw an increase in their probability of getting both a C (OR – 2018:0.97, 2019:0.95, 2020:1.17) and A or above (OR – 2018:0.96, 2019:0.90, 2020:1.10). Finally, candidates in centres with high mean prior attainment saw a decrease in their probability of getting at least an A (OR – 2018:1.02, 2019:1.02, 2020:0.77), but not C. Whereas candidates at centres with low mean prior attainment saw an increase in their probability of getting a C or above (OR – 2018:0.91, 2019:0.87, 2020:1.11), but not A. This is again likely due to the truncation effect discussed previously.
Quantile prior attainment model including candidates with missing prior attainment.
A version of the model was run to include candidates with missing prior attainment data. For this model prior attainment was split into nine quantile groups of approximately equal size with an additional ‘missing prior attainment’ category. Overall, the variance explained by the fixed effects in the model were lower than the core modelling (marginal R-squared- 2018: 35%, 2019: 37%, 2020: 40%), likely to be because the model was a poor predictor of outcomes for candidates with missing prior attainment. However, patterns in model coefficients did not substantially differ from those in the core modelling (full output in Appendix E).
Modelling prior attainment as quantile groups helps to highlight the relative differences in generosity in grades in 2020 across the prior attainment distribution. Results indicate that there is a slight positive bias in generosity of grades in 2020, with candidates with higher prior attainment receiving more generous grades on average after all other variables are controlled for. Comparing model coefficients across years suggests the largest positive effects in 2020 when compared to an average of the previous two years were in quantiles 6, 7 and 8, whereas least generous grades were awarded to those in quantiles 1, 2 and 3. However, quantile 9 was less generously awarded, which is likely to again highlight the truncation effect at the top end of the grade range as these high performing candidates are not able to receive any higher grades. Candidates in the ‘missing’ category were also the least most generously awarded. Figure 4 shows the estimated change grades between from prior years to 2020 for each prior attainment quantile for the largest subjects in each subject group for candidates in the reference category (see Table 2 for details of reference group).
Figure 4. Difference in estimated grade between 2020 and average of 2018 and 2019 by prior attainment quantile for largest entry subjects in each subject group.
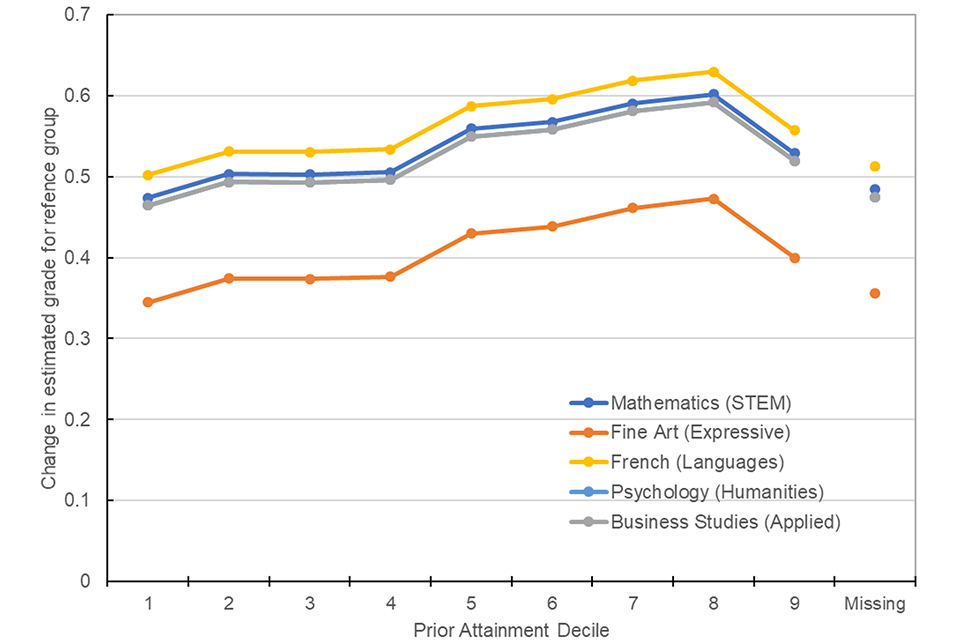
Mean change in estimated grades from the average of 2018 and 2019 to CAGs in 2020 for candidates in each prior attainment quantile. Discussed in the main text.
Note: Estimates calculated from coefficients in quantile prior attainment-based model 4. Business studies line overlaps psychology.
Additional interaction models
The first additional interaction effect evaluated was between prior attainment group and socio-economic status. The overall effect was significant in all three years (p<0.001), as candidates with low prior attainment but from a low deprivation area tend to not do as well as the main effects would predict. The effect of prior attainment is also more moderate for candidates with missing IDACI scores, who tend to perform closer to the average than other candidates. However, following the guidelines for interpreting coefficients set out above there were no notable changes for individual groups.
The second interaction investigated was between socio-economic status and ethnicity. This interaction was not significant in 2018 (p=0.71), but was significant in both 2019 (p<0.05) and 2020 (p<0.001). The key changes in coefficients were for candidates in the ‘Other’ ethnic group, where candidates in the high and very high IDACI score groups received relatively lower grades by 0.15 and 0.10 grades respectively. This was also the case for students in the Chinese ethnic group in the high and very high IDACI score groups, that gained relatively lower grades in 2020 by 0.33 and 0.12 grades respectively.
The final interaction effect evaluated was the relationship between the proportion of non-white students in a centre and candidates’ individual ethnicity. In this case the effect was significant in 2018 (p<0.01) and 2019 (p<0.001) but not 2020 (p=0.203). In previous years the only group significantly different from the reference group (White candidates at a centre with a medium proportion of non-white candidates), was from those with missing ethnicity variables at schools with low proportions of non-white candidates. These candidates in previous years attained grades significantly lower than other candidates by 0.45 grades in 2018 and 0.55 grades in 2019, but only non-significantly by 0.04 grades in 2020. The only other notable change in coefficients was for candidates in the Black ethnic group at schools with low proportions of non-white students who’s mean grades were higher in 2020 by 0.11 grades than in 2019. This suggests that candidates of unknown ethnicity and those in the Black ethnic group going to predominately white schools attained moderately higher grades than previously in 2020.
GCSE
Descriptive statistics
For GCSE the calculated average increase in grade in 2020 is slightly lower than A level at around 0.4 grades (Table 10). The grade distributions shown in Figure 5 again show a shift in the distribution up the grade range. As can be seen from Figure 6, the relationship with prior attainment has again remained relatively consistent. Although for GCSE, initial data suggests the plateauing of the relationship with prior attainment at the top end is slightly more severe, with the average increase being around 0.05-0.08 lower for the top quintile (Table 10). This again is likely due to the grade distribution approaching the top limits of the available grade distribution causing truncation of grades at the top end.
Figure 5. Grade distributions for awarded grades in 2018 and 2019 and CAGs in 2020.
Three histograms showing the number of each grade awarded in 2018, 2019 and CAGs awarded in 2020. The grade distribution for CAGs in 2020 is higher up the grade range compared to the other two histograms.
Table 10. Descriptive statistics for GCSE results.
| 2018 | 2019 | 2020 | 2020 minus average of previous years | |
|---|---|---|---|---|
| Overall Mean Grade | 4.98 (2.07) | 4.99 (2.08) | 5.38 (1.99) | 0.40 |
| Correlation with prior attainment | 0.63 | 0.64 | 0.65 | 0.02 |
| Mean Grade – prior quintile 1 | 3.03 (1.53) | 3.04 (1.54) | 3.45 (1.47) | 0.42 |
| Mean Grade – prior quintile 2 | 3.97 (1.61) | 3.99 (1.62) | 4.41 (1.53) | 0.43 |
| Mean Grade – prior quintile 3 | 4.71 (1.67) | 4.71 (1.67) | 5.16 (1.58) | 0.45 |
| Mean Grade – prior quintile 4 | 5.53 (1.69) | 5.55 (1.70) | 5.96 (1.59) | 0.42 |
| Mean Grade – prior quintile 5 | 6.70 (1.66) | 6.73 (1.66) | 7.08 (1.52) | 0.37 |
Note: Standard deviations shown in brackets.
Figure 6. Relationship between prior attainment and grade in all three years evaluated with confidence intervals.
A line graph showing the relationship between mean GCSE score and grades. Three curves show the relationship in 2018 and 2019 and for CAGs in 2020. The curve for CAGs is higher than the other two curves but has a similar shape.
Note: Smoothed curve fitted using a generalized additive model from R package ggplot2.^
Table 11 shows the mean grade in each year for each of the category breakdowns and the difference between 2020 and an average of the previous two years. The most notable differences in this descriptive data is that small cohorts saw on average greater grade increases than larger cohorts. Across centre types, colleges saw particularly large increases in mean grade. Out of the other centre types, independent centres and sixth form colleges were on average more generous. At GCSE applied subjects had the greatest increases in mean grade and humanities and STEM the smallest increases.
Table 11. Mean grades in each year with breakdowns, by subject cohort size, centre type and subject group.
| Subgroup | 2018 | 2019 | 2020 | 2020 minus average of previous years |
|---|---|---|---|---|
| Subject Cohort Size: Not-small | 4.98 | 4.99 | 5.37 | 0.39 |
| Subject Cohort Size: Small | 4.99 | 5.03 | 5.68 | 0.67 |
| Centre Type: Secondary | 4.90 | 4.91 | 5.30 | 0.40 |
| Centre Type: College | 3.73 | 4.05 | 4.56 | 0.67 |
| Centre Type: Grammar | 6.72 | 6.77 | 7.06 | 0.32 |
| Centre Type: Independent | 6.11 | 6.09 | 6.59 | 0.49 |
| Centre Type: Sixth form | 4.33 | 4.04 | 4.67 | 0.48 |
| Subject Group: Humanities | 4.81 | 4.83 | 5.19 | 0.37 |
| Subject Group: Applied | 4.72 | 4.83 | 5.40 | 0.63 |
| Subject Group: Expressive | 5.05 | 5.04 | 5.58 | 0.54 |
| Subject Group: Languages | 4.75 | 4.76 | 5.25 | 0.50 |
| Subject Group: STEM | 5.31 | 5.33 | 5.70 | 0.38 |
Note: Final column shows the difference between 2020 grades and an average of the previous two years.
Variance explained at each level
Similar to A level, there was lower overall variance in results in 2020 compared to previous years (2018: 4.53, 2019: 4.57, 2020: 4.21) indicating that the overall spread of grades was reduced. This was again reflected in there being lower candidate (2018: 2.31, 2019: 2.33, 2020: 1.33) and slightly lower centre level variance (2018: 0.94, 2019: 0.96, 2020: 0.86). The effect is smaller than at A level, which may be due to GCSE having a wider grade scale, with candidates more evenly distributed across the range.
Table 12. Percentage of variance explained by fixed model effects (marginal pseudo – R squared) and fixed and random effects (conditional pseudo R-squared)
| Model | Marg. 2018 | Marg. 2019 | Marg. 2020 | Cond. 2018 | Cond. 2019 | Cond. 2020 |
|---|---|---|---|---|---|---|
| Mod 0 (null) | 2% | 2% | 1% | 74% | 74% | 77% |
| Mod 1 (prior att.) | 38% | 38% | 40% | 72% | 72% | 75% |
| Mod 2a (cand.) | 43% | 43% | 46% | 72% | 72% | 75% |
| Mod 2b (centre) | 44% | 44% | 46% | 73% | 73% | 76% |
| Mod 3 (cand & centre) | 47% | 47% | 49% | 74% | 74% | 77% |
| Mod 4 (centre prior perf.) | 48% | 49% | 51% | 72% | 72% | 75% |
Table 13. Estimates of variance explained at each level, calculated as the difference in marginal R-squared between nested models.
| Level | 2018 | 2019 | 2020 |
|---|---|---|---|
| Between Subjects | 1.7% | 1.7% | 1.3% |
| Prior Attainment | 35.9% | 36.2% | 38.8% |
| Candidate Variables | 4.8/3.1% | 4.8/3.2% | 5.6/3.7% |
| Centre Variables | 6.0/4.3% | 5.7/4.1% | 5.2/3.3% |
| Subject-Centre Prior Performance | 1.2% | 1.9% | 1.9% |
| Unexplained Centre | 1.4% | 1.6% | 1.9% |
| Unexplained Candidate | 24.5% | 23.6% | 23.5% |
| Residual Variance | 23.2% | 26.1% | 26.7% |
Note: For candidate and centre level variables two estimates are provided. The first as the difference between model 1 and 2a/2b, the second as the difference between model 2a/2b and 3.
For the GCSE models, prior attainment again explained the largest proportion of variance of any of the fixed effect variables included in the models (see Table 12 and 13). The variance explained by prior attainment was slightly higher in 2020 than in previous years, although the difference is smaller than that for A level at around 3%. Candidate level variables explained more variance for GCSEs than A levels (around 5%) and was slightly higher in 2020 than previous years, suggesting these variables are slightly more closely related to grades in 2020 than in previous years. However, centre level variables explained slightly less variance in 2020 compared to previous years. Finally, the addition of centre prior performance explained around 1-2% of the variance in all three years. As for A levels, the conditional R-squared did not markedly increase with addition of model fixed effects (Table 13).
Changes in coefficients
Using the criteria previously outlined, only a handful of variables show notable changes in 2020 (See Figure 7 for model coefficients). First, candidates with missing NPD data had relatively higher grades than 2019 by 0.24 grades. As discussed previously the vast majority of candidates in this group, particularly in 2019, come from independent centres (See Appendix A). This may suggest that candidates at those centres gained relatively higher outcomes in 2020 compared to candidates at other centre types in addition to the effect indicated by centre type directly.
Candidates at sixth form colleges show a relatively higher increase in grades in 2020 than mainstream secondary schools compared to 2019 by around 0.14 grades respectively. Usually grades for candidates at these centres are on average lower than those at mainstream schools, whereas in 2020 this gap is smaller. However, caution is advised interpreting figures for both FE/Tertiary colleges and sixth form colleges at GCSE level as ‘typical’ candidates at these centres that are included in the analysis (16-year-olds taking at least 3 GCSEs) are few and may ironically represent atypical candidates at these centre types which usually teach over 16s.
As for A level there is evidence of a plateauing of the relationship with prior attainment for the highest prior attainment group. In 2018 and 2019 the slope of this relationship was 0.95 and 0.97 respectively, whereas in 2020 it was a flatter relationship with a coefficient of 0.90.
Evaluating the coefficients from models 5a and 5b suggests that at GCSE, there was no clear pattern of generosity related to whether a subject was included in the EBacc or not. This evaluation also suggests that subjects with higher proportions of NEA were generally more generously awarded than those with low proportions of NEA. The smallest increases compared to 2019 were in subjects with no and a low percentage of NEA and the highest increases were in subjects with medium followed by high levels of NEA, although subjects normally assessed via 100% NEA were again closer to the average (see Table 14 for model coefficients). Evaluating subject areas suggests that subjects in the Applied group were the most generously awarded, followed by Expressive subjects, Languages, Humanities, finally STEM subjects being the least generously awarded. At GCSE the number of applied subjects is small so the coefficients need to be treated with caution (see Table 15 for model coefficients).
Table 14. Model coefficients from Model 5a for NEA groups, with standard errors in brackets.
| Group | 2018 | 2019 | 2020 | 2020 minus average |
|---|---|---|---|---|
| Low | -0.72 (0.01) | -0.59 (0.01) | -0.53 (0.01) | +0.13 |
| Medium | -0.82 (0.24) | -1.17 (0.26) | -0.05 (0.28) | +0.95 |
| High | -0.36 (0.02) | -0.35 (0.02) | 0.03 (0.02) | +0.39 |
| All | -0.13 (0.05) | -0.05 (0.04) | 0.07 (0.03) | +0.16 |
Note: Reference group is the no NEA group. Final column shows difference between 2020 coefficient and the average of the previous years.
Table 15. Model coefficients from Model 5b for EBacc and subject groups, with standard errors in brackets.
| Group | 2018 | 2019 | 2020 | 2020 minus average |
|---|---|---|---|---|
| Applied | -0.11 (0.24) | -0.71 (0.26) | 0.49 (0.29) | +0.9 |
| Expressive | 0.34 (0.04) | 0.11 (0.04) | 0.57 (0.04) | +0.35 |
| Languages | -0.72 (0.01) | -0.59 (0.01) | -0.53 (0.01) | +0.13 |
| STEM | -0.04 (0.01) | -0.04 (0.01) | -0.06 (0.01) | -0.02 |
| Facilitating | 0.71 (0.03) | 0.45 (0.03) | 0.54 (0.03) | -0.04 |
Note: Reference group is the non-EBacc humanities. Final column shows difference between 2020 coefficient and the average of the previous years.
Figure 7. Model coefficients from model 4 for 2018, 2019 and 2020, with standard error bars.
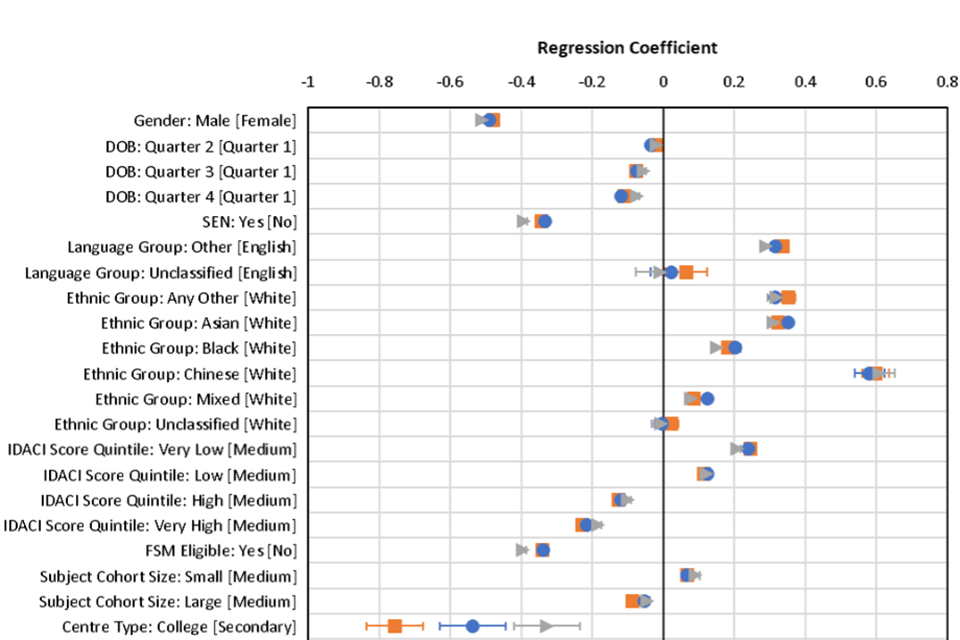
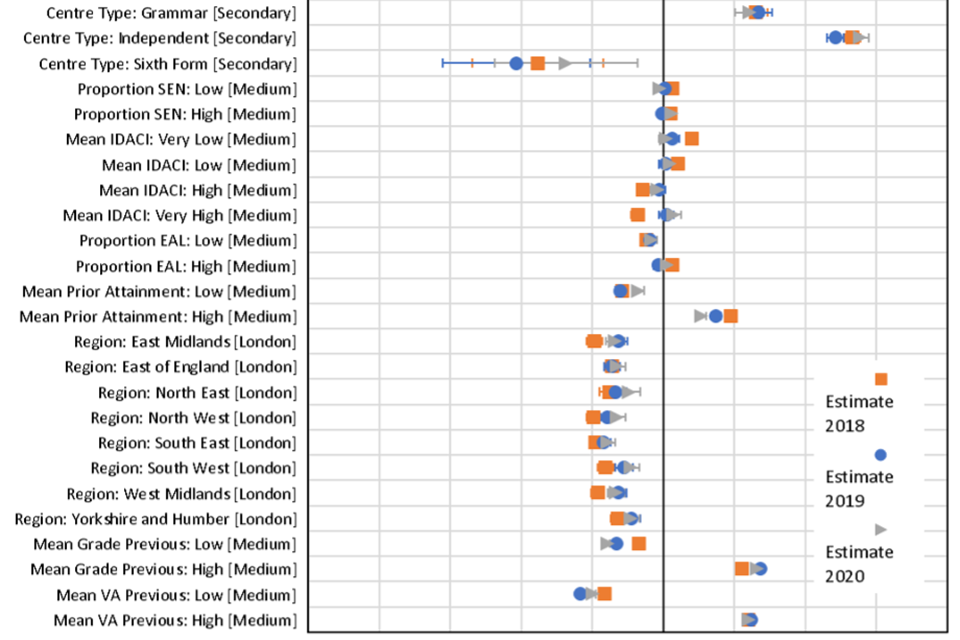
Note: Reference category is show in square brackets. Missing categories and interaction effects not shown.
Borderline changes
Using the alternative criteria outlined above for identifying more borderline changes in coefficients (those with coefficients 0.05 above or below the ‘normal’ range) identified only one additional change. Students that were FSM eligible had a slight relative decrease in outcomes in 2020 with grades that were on average 0.06 grades lower than in 2019, suggesting a small negative effect on this group.
Looking at some of the smaller effects across multi-level variables, there are a few changes potentially of note. As at A level, the effect of date of birth seems to be somewhat reduced: usually there is a negative effect of around 0.03-0.04 grades per quarter for younger students, whereas in 2020 this is reduced to around 0.02-0.03 grades. There seems to be a small effect of IDACI score, with candidates in the ‘high’ and ‘very high’ IDACI score groups having slightly higher grades in 2020 (change of +0.02 and +0.03 respectively compared to 2019), and those in the ‘very low’ IDACI score group having slightly lower grades on average (change of -0.03), when compared to the medium group. There also seems to be a slight small cohort advantage in 2020 with an increase on average of 0.02 grades over 2019 compared to the medium group. Finally, there is a small effect of the mean prior attainment of candidates at each school, with those attending schools with low mean prior attainment having a slight increase in grades in 2020 with an increase of 0.05 grade over 2019.
Binomial models
The GCSE binomial model for both C and above and A and above again showed similar patterns to those discussed above in the core modelling (full output in Appendix F). Table 16 shows the percentage of candidates reaching at least grade 4 and grade 7 increased in 2020, with the increase at grade 4 particularly in the lower prior attainment candidates and the increase at grade 7 particularly in the highest prior attainment candidates.
Table 16. Percentage of candidates achieving each key grade analysed or above, by prior attainment group. Grade for or above indicated as 4+, grade 7 or above indicated as 7+.
| 4+ 2018 | 4+ 2019 | 4+ 2020 | 4+ 2020 -average | 7+ 2018 | 7+ 2019 | 7+ 2020 | 7+ 2020 -average | |
|---|---|---|---|---|---|---|---|---|
| Overall percentage attaining grade or above | 74% | 74% | 83% | 8% | 24% | 25% | 30% | 6% |
| % Grade – prior quintile 1 | 34% | 34% | 48% | 13% | 2% | 2% | 3% | 1% |
| % Grade – prior quintile 2 | 60% | 60% | 74% | 14% | 6% | 6% | 8% | 2% |
| % Grade – prior quintile 3 | 77% | 77% | 87% | 10% | 14% | 14% | 19% | 5% |
| % Grade – prior quintile 4 | 89% | 89% | 94% | 5% | 29% | 29% | 37% | 9% |
| % Grade – prior quintile 5 | 96% | 96% | 98% | 2% | 57% | 58% | 67% | 10% |
Note: Additional column shows the difference in percentage between 2020 and the average of the previous two years.
Using the criteria discussed above for binomial models, very few variables showed notable changes between 2019 and 2020 for GCSE. At C and above colleges had a notable increase in the probability of achieving a grade C compared to 2019 (C and above Odds Ratio (OR) – 2018:0.36, 2019:0.48, 2020:0.65) as well as grammar schools (OR – 2018:1.76, 2019:1.45, 2020:1.99). At A and above independent centres also had an additional increase in the probability of attaining this grade (OR – 2018:1.67, 2019:1.66, 2020:2.10). The effects of free school meal eligibility which was identified in the linear model did not show a notable change in the binomial models.
Quantile prior attainment model including candidates with missing prior attainment
Similar to A level, a model was run with prior attainment split into 9 quantile groups of approximately equal size with an additional ‘missing prior attainment’ category to avoid excluding candidates with missing prior attainment and allow additional insight into the relationship between grades and prior attainment. As at A level, the total variance explained by the fixed effects in the model was lower than the core models described above (marginal R-squared- 2018: 43%, 2019: 44%, 2020: 46%). This is again likely to be because prior attainment was a poor predictor of outcomes for those in the missing group. For GCSE, the coefficients from the quantile prior attainment model again followed a similar pattern to the core modelling presented above (full output in Appendix F).
As can be seen from Figure 8, candidates in quantiles 1-6 saw a similar increase in outcomes in 2020 compared to previous years. However, candidates with above average prior attainment saw progressively lower increases in grade outcomes. This may again be explained by the plateauing of the relationship between prior attainment and grades at the top end in 2020, likely due to the overall increase in grades causing a truncation of the distribution of mean grades at the top end of the grade distribution. Interestingly, those with missing prior attainment are amongst those with the lowest increase in outcomes even once other factors were included in the models. This is potentially due to these candidates tending to be high performing candidates from independent centres and so show a similar pattern to those in the highest prior attainment quantiles.
Figure 8. Difference in estimated grade between 2020 and average of 2018 and 2019 by prior attainment quantile for largest entry subjects in each subject group.
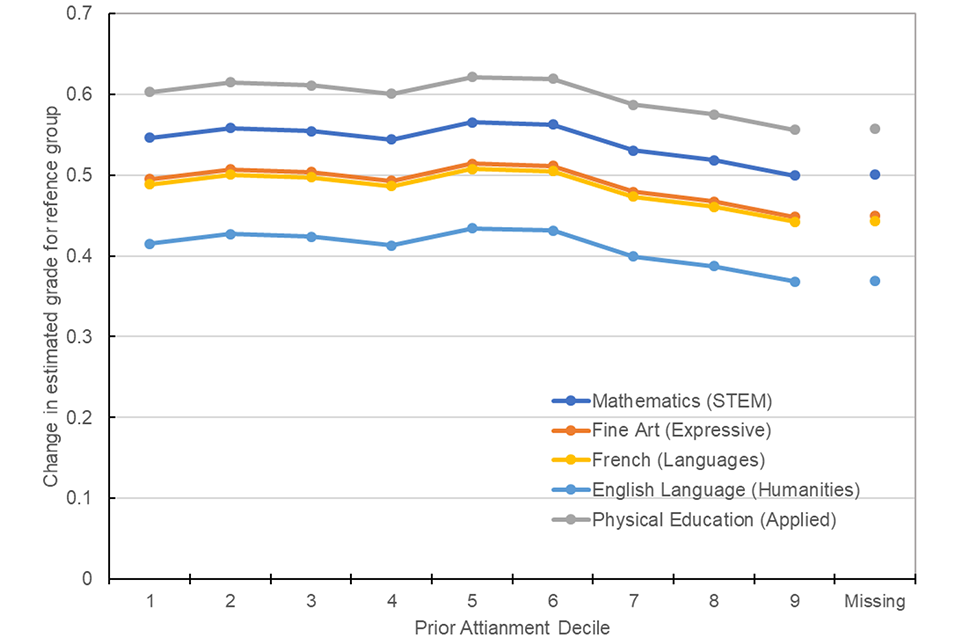
Mean change in estimated grades from the average of 2018 and 2019 to CAGs in 2020 for candidates in each prior attainment quantile. Discussed in the main text.
Note: Estimates calculated from coefficients in quantile prior attainment-based model 4.
Additional interactions
For GCSE, all three additional interactions investigated were significant across all three years (p<0.001). However, the only notable changes in 2020 for any of the individual coefficients were for candidates in the Other ethnic group in the high IDACI score group, that in 2020 received grades 0.14 grades higher than in 2019 relative to the reference group. There was a small effect that candidates in the very high IDACI score group who had high and very high prior attainment gained grades 0.07 and 0.06 grades lower respectively in 2020 and candidates in the very high IDACI score group but who had very low prior attainment gained grades 0.1 lower in 2020 relative to the reference group. There was also a small effect that candidates from the ‘Other’ ethnic group who were in schools with a high proportion of non-white candidates gained grades 0.07 lower than previous years.
Discussion
Key findings
The most notable change in teacher grades in 2020 from previous years was an overall increase in outcomes by around half a grade for both GCSE and A levels. However, the overall finding of this study is that despite this change, the majority of the relationships between grades and other factors tested have stayed very similar to previous years, especially for GCSE where very few differences were found.
Reassuringly the analysis showed a similar relationship in 2020 between prior attainment and grades to previous years at both GCSE and A level. If the slope of the relationship had substantially changed it may have been cause for concern as it would suggest a marked change from previous years in the value-added relationship between candidates’ prior performance and grades awarded. However, both the slope of the relationship and the variance explained by prior attainment were similar to previous years for both GCSE and A level. The variance explained was slightly higher in 2020, particularly for A level, suggesting a slightly higher predictive power of prior attainment than in previous years. For both GCSE and A level there was also a slight plateauing of the relationship between prior attainment and grade at the top end in 2020, likely linked to the overall increase in grades, discussed further below.
For GCSE, the majority of the other model coefficients were remarkably similar to previous years; even those changes highlighted by the analysis were very minor changes in the relationships between the variables investigated and GCSE grades. At A level there were more notable differences in coefficients, however the variance explained by any variable except prior attainment was very small (<1%), which suggests these changes had a very minor impact on grading. Analysis suggests that beyond prior attainment, differences in performance were mostly due to between candidate differences which were not explained by any of the variables in the model and variation between results in different subjects for a given candidate were again unexplained by any of the included variables. This suggests that, despite an overall increase in average grades, teacher judgements have not substantially changed the relationships between grades and the other variables examined.
Grading generosity in 2020
The increase in overall grades is similar to that previously reported by Delap (1995) for A level predictions and corroborates previous studies which have also reported that teacher judgements tend to be more generous than exam grades (Dhillon, 2005; Gill & Benton, 2015; Wyness, 2016). Interestingly the average level of generosity was similar across both GCSE and A level, although slightly lower for GCSE, despite the different lengths of the grading scales.
A possible explanation for this generosity comes from interviews with teachers carried out by Holmes et al. (2021) regarding how they came to their grading decisions in 2020. In the interviews, teachers noted that within a class they usually have multiple students who have the potential to achieve a particular grade if all went well. However, in a normal year some will fail to achieve that grade due to a variety of reasons; for example, not revising enough, exam stress or due to the selection of questions which happens to come up on the exam papers. Teachers reported that as they could not know which students would perform well or badly on the day of the assessment, they gave students the grades they had potential to get on a good day, a sort of benefit of the doubt.
Interestingly, a recent analysis by Benton (2021) found that the distribution of CAGs in 2020 reflected a logical amount of generosity, given estimates of the classification accuracy of teacher judgements compared to exams taken from previous research, if teachers were using a strategy of avoiding introducing any additional disadvantage in 2020. This suggests that teachers may have had a natural intuition about how confident they could be in their own grading estimates and applied a logical level of benefit of the doubt to ensure that students were not disadvantaged relative to a normal year. However, it is also worth noting that this ‘benefit of the doubt’ may not be the sole reason for an increase in overall grades. There are a series of potential reasons which may have led teachers to be somewhat generous in 2020, such as teachers wanting to ensure progression for students or possible pressure from students or parents. Teachers were also aware that in 2020 there was intended to be a standardisation procedure so they may have believed there would be no consequence to allowing some generosity, and even that building in generosity may have helped prevent their students being disadvantaged by the procedure.
One unfortunate effect of this increase in overall grades is a potential decrease in differentiation of grades between candidates. It is particularly noticeable at A level that the grade distribution has moved up the grading scale and in 2020 is being restricted by meeting the top end of the grade scale. This results in a slightly skewed distribution due to the truncation of the distribution at the top end. This may be one reason for the reduced variance in grades in 2020 seen throughout the analysis. The effect of this truncation can be particularly seen in the relationship between grades and prior attainment, which in 2020 shows a slight plateau at the top end. Essentially candidates with the highest prior attainment scores gained slightly less generous grades in 2020 compared to other candidates, at both GCSE and A level, as they were already obtaining the highest grades possible.
Key influences on teacher judgements
The results showed that of the variables included in the analysis, the majority of the explained variation between grades was due to prior attainment alone and other variables contributed very little to the model fit. In 2020, prior attainment also explained more variance than in previous years. This does not necessarily suggest that teachers were directly using candidates’ prior performance as a source of evidence, rather that it is a good predictor of academic performance generally. However, in normal years this relationship is moderated by a number of factors, which tend to reduce the strength of the correlation with prior attainment. In 2020 there may have been a lessening of these moderating effects.
First, some of the unpredictable ‘on the day’ variance in exam performance seen in a normal year may have been factored out by teacher judgements. In any year candidates’ exam performance varies in a relatively unpredictable way, potentially relating to the quality of their revision, effort in the exam or how well they prepared for the questions that appeared in the exam. As suggested above, if teachers were unable to predict which candidates would have a ‘good day’ (that is, achieved the best grade they had shown the ability of performing in their school work), and so gave all students the ‘benefit of the doubt’, this may have led to reduced ‘unpredictable’ variance in results and subsequently to an increase in the predictive power of prior attainment.
On the other hand, an increase in the strength of the relationship with prior attainment could represent teachers over-relying on previous performance information about candidates when making their judgements, and not sufficiently factoring in variations in candidates’ current performance. Teachers basing their judgements on prior measures of candidates’ performance would increase the strength of the relationship with prior attainment, but may not represent an accurate representation of candidates’ current ability. Particularly for students whose ‘value added’, in terms of progress since the last set of assessments, doesn’t fit the normal pattern. This explanation is potentially supported by qualitative evidence from Holmes et al. (2021) which suggests that centres tended to use student progression data as a key source of evidence. This also seems to be corroborated by the fact that prior performance data tends to be more reliable at A level, coming from tests taken only two years before at GCSE. Therefore, the additional increase in explanatory power of prior attainment at A level may represent teachers’ additional confidence in it as a source of evidence.
Evidence from the A level modelling suggested that candidate and centre characteristics had a weaker relationship with CAGs compared to grades in a normal year. The overall effect was that both candidate and school level features explained very little variance in 2020. For GCSE there was a weaker effect of centre variables but not candidate level variables. In addition, for A level in particular, a number of coefficients were closer to 0, reflecting smaller differences between groups in 2020 compared to previous years. This is most notable for gender where the better performance of boys in previous years at A level is substantially reduced in 2020, but this effect can also be seen to a lesser extent for candidate age, IDACI scores and through smaller differences between regions of the country. This reduction in the strength of the relationship with these variables may represent a slight homogenisation of grades in 2020 between different candidates and centres. This may be in part due to teachers and centres not sufficiently acknowledging the differences in outcomes between groups usually evident in results in a normal year, including some of the variation usually seen between centres in value added relationships. Understandably, comprehensively accounting for all of these factors would be near impossible for centres with the information available to them about their own and other cohorts and would potentially require significant coordination between centres. Alternatively, at candidate level it may represent an intentional balancing of results between groups to avoid bias, which inadvertently may have reduced the size of differences between groups seen in a normal year. Evidence from Holmes et al. (2021) suggests that centres did make direct analytical comparisons between subgroups as part of their process for avoiding bias in their CAGs.
Even after including all of the variables in the modelling there was still a large proportion of unexplained variance between candidates (GCSE: 24-25%, A level 22-25%), suggesting that candidates perform differently for a variety of reasons not captured by the models. On top of this there was a large proportion of further unexplained within-candidate variance in the models (GCSE: 23-26%, A level: 30-32%), representing unexplained differences in performance across different qualifications taken by the same candidate. Although we can say that out of the characteristics investigated patterns of relationships were similar to previous years, we cannot know if the unexplained variance follows similar patterns to previous years. For example, in a normal year if a candidate performs better in an exam than would be predicted by the variables included in the model, and therefore contributing to the unexplained variance, then we would assume it is for reasons such as: the candidate had worked hard during this phase of their education exceeding the value-added expectations from the model; they had successfully revised for that exam; they got lucky on the day and questions they could answer came up; because they underperformed in their previous exam stage due to illness or other reasons and so it under-represented their true level of ability. In 2020 we can make no such assumptions. If candidates attained higher grades than predicted by the model, all we can say is that the centre allocated them higher grades. Whether this is because the candidate was genuinely on target to perform better than average for a candidate with their characteristics and prior attainment would predict or for other reasons, we cannot know from this analysis.
Impact on equalities
The candidate level findings concur with those previously published by Ofqual (Lee et al., 2020), indicating the 2020 grading process did not exacerbate inequalities relating to groups with protected characteristics or socio-economic status. However, similarly to this study, the previous equalities analysis produced by Ofqual showed that there had been a narrowing of the gender gap at A level (Lee et al., 2020). Whereas in previous years males outperformed females, after accounting for a range of other factors including prior attainment, in 2020 this difference was significantly reduced. This effect was not seen at GCSE; Lee et al. (2020) therefore attributed the effect at A level to a genuine closing of the attainment gap rather than an overall bias in favour of female students.
In the interviews carried out by Holmes et al. (2021), teachers did raise some concerns about their predictions around gender. Some reflected that female students tend to perform more consistently than male students whose work often picks up towards the end of the year. Therefore, there was some concern that some boys would be disadvantaged if this ‘last-minute push’ was not taken into account when grades were estimated. Teachers indicated that as their judgements had to be made on the evidence available to them, they could not factor in this effect while being objective and evidence based. However, as discussed previously the amount of variance explained by any candidate characteristics at A level was very small, particularly in 2020, so even this change in coefficient would have had a very minor effect on candidates’ grades compared to factors such as prior attainment and individual candidate performance.
Previous studies on the effect of students’ socio-economic status (SES) on teacher judgements have been mixed, with some studies finding no effect (Kaiser et al., 2015), whereas others found that teachers underestimated (Ready & Wright, 2011) or overestimated the ability of lower SES children (BIS, 2011, 2013). The results from this study suggest that through teacher judgements there was a relative evening out of the differences in results between candidates from centres in areas with different levels of deprivation compared to previous years. This was mostly reflected in the highest IDACI quintile; candidates in this group in previous years attained on average lower grades than other groups, but in 2020 the results for this and the median group were much more similar. Some of the analysis at GCSE suggested there may be a slight disadvantage to candidates eligible for free school meals in 2020, which can be another indicator of socio-economic status, but this effect was inconsistent between the various models carried out. One possible reason for this inconsistency is that the relationship between SES and grade may not be straightforward. Wyness (2016) and Murphy and Wyness (2020) found an interaction between SES and prior attainment, which suggests that after controlling for other factors, high ability students from disadvantaged backgrounds received less optimistic teacher grades than high ability students from more advantaged backgrounds. We did find a very weak indicator of this effect at GCSE where those in the highest prior attainment quintile, who were also in the high IDACI group gained relatively lower grades in 2020 than those in the reference group, although the effect was very small.
Holmes et al. (2021) found that some teachers were concerned around the ability to appropriately take into account special considerations normally awarded to SEN students in exams when making their grading judgements. There is some evidence from the A level models that CAGs may have slightly underestimated the grades for SEN students, although the effects were again very small.
Finally, if we look at ethnic group, previously both UCAS (2016) and Wyness (2016) found that black and Asian students grades tended to be over predicted. In the current study at GCSE level, there were differences in teachers’ grades for different ethnic groups in 2020, even after controlling for other variables, but those differences were in line with differences in exam grades for these groups in normal years. At A level, there was some evidence that candidates in the Chinese ethnic group had slightly more generous grades compared to white candidates in 2020. The additional findings from the interaction models related to ethnic group were on the whole inconsistent and therefore inconclusive.
All together the findings from this study agree with the previously published equalities study from Ofqual which suggested that CAGs did not substantially exacerbate existing inequalities in 2020, beyond the small potential disadvantage faced by male students at A level (Lee et al., 2020). As discussed in that report there is evidence that this is continuing a trend seen in previous years rather than being evidence of bias in teacher judgements.
Subject level findings
Overall, our findings showed that there were differences in the average level of generosity of teacher judgements between subjects. This is similar to the findings of the Ofqual study of inter-subject comparability after summer 2020 (Ofqual, 2020). Across both GCSE and A level assessments, subjects with higher proportions of NEA tended to be somewhat more generously graded, although this effect was much more consistent at GCSE compared to A level. This concurs with Holmes et al. (2021) who found in interviews with teachers, that in subjects with NEA, centres considered candidates’ grades on assessments already taken as part of these courses when developing CAGs. Non-exam assessments tend to be more generously awarded than exams (Ofqual, 2013), often resulting in NEA components being candidates’ highest graded component for these qualifications. If teachers used these assessments as a benchmark and did not adequately account for this relatively higher performance, then this may explain why these subjects tended to have higher CAGs. The fact that subjects with all NEA were closer to an average generosity, does not undermine this conclusion. For these subjects, 2020 was much more similar to a normal year than other subjects, as in a normal year the whole grade is usually determined by NEA. The fact we still see some generosity in this group may reflect the relaxing of moderation arrangements in 2020.
Analysis also suggested that there are differences in generosity between the broad subject groups. Interestingly in a previous study, Südkamp et al. (2012) found no overall effect of subject matter (languages, mathematics or both) on teacher judgement accuracy and although Delap (1994) originally found differences in grading generosity between subjects at A level, these effects disappeared after controlling for other candidate characteristics. On the other hand, UCAS (2016) found that the performance of candidates with certain combinations of subjects, for example mathematics, biology and chemistry was more likely to be over predicted. Here we found that consistently across GCSEs and A levels, expressive subjects were amongst those with the greatest generosity from teacher judgements. It’s highly likely that this is because these subjects have high levels of NEA leading to generosity in grades as discussed above. However, it’s important to note that particularly for expressive subjects, students tend to perform well on the NEA components as this is central to the appeal of taking the subject and represents an important part of the assessed construct.
At A level there was also a small effect of facilitating subjects being more generously awarded. One of the factors we were not able to control for in this analysis was whether a candidate had applied for university. As discussed by Wyness (2016) there is potentially an additional incentive for teachers to be more generous with candidates applying for university as this will have a highly visible impact on their future prospects compared to those not applying for university. This may well result in facilitating subjects which tend to be taken by university applicants, particularly those applying for more selective universities, to be more generously awarded (issues with university application are further discussed below).
Differences between centres
Another reassuring finding from this analysis was that variance between centres in 2020 had not increased from previous years. If results had shown an uptick in variation in grades between centres, particularly variation unexplained by the modelling, it may have suggested that centres were behaving substantially differently from one another in the way CAGs were allocated. Some of the teacher comments reported by Holmes et al. (2021) suggested that the weight placed on different sources of evidence and the approaches taken to deciding on CAGs differed across centres. For example, some centres said that they factored in the trajectory of the centres’ outcomes across previous years to their CAGs, whereas others did not (Holmes et al. 2021). Fortunately, at least for the majority of centres, this does not seem to have led to substantial differences in grading, as the proportion of unexplained between centre variation stayed relatively stable in 2020 and total between centre variation somewhat reduced in 2020. However, from this analysis we did not directly assess the difference in grading between years in individual centres, so it is possible that there were between centre differences in behaviour, but not to the extent of increasing overall variance. Any additional variation introduced by between centre differences in their CAG process was not greater than the variation between centres in exam results seen in previous years.
Analysis also suggested that the amount of variation explained by centre characteristics was somewhat reduced in 2020 for both GCSE and A levels. This reduction suggests that features which were linked to centre performance in previous years had a lesser effect in 2020. Combined with the overall reduction in variance between centres, this suggests that centres which may have performed differently in previous years are showing less differentiation in results in 2020. Supporting the suggestion above that grades were relatively more homogenous in 2020 compared to previous years.
Despite this reduced differentiation, the analysis here has still shown that there were some patterns in the amount of leniency introduced in 2020 between different types of centre. Centres with lower mean prior attainment and those with lower prior performance saw larger increases in grades than those with higher mean prior attainment. At least part of this effect is likely due to the ceiling effect on the grade range discussed previously. It is impossible to substantially increase the grades awarded to those already expected to get top grades and so inevitably the mean increase in grades possible for candidates expected to get grades towards the top end of the distribution is limited (Murphy & Wyness, 2020). This effect was similarly found by UCAS (2016) who found that candidates with lower prior attainment were more likely to be over predicted. Subsequently, centres with high proportions of high performing candidates will have seen less generosity introduced in 2020. In the binomial A level models, we see that for centres with low prior attainment the probability of attaining a C or above has increased but not the probability of attaining A or above. Conversely, at high prior attainment centres the relative probability of attaining an A or above has slightly reduced compared to lower performing centres.
One of the key findings from Holmes et al. (2021) was that larger centres or departments within centres tended to use a more data-driven approach to producing CAGs, whereas smaller centres or departments placed more emphasis on knowledge of individual students and more subjective evidence such as student characteristics and attitudes to learning. Small cohorts tend to be less stable and the average ability of the cohort may fluctuate substantially from year to year, meaning centre past performance data may be unreliable. This may have led larger centres to place more weight on the previous performance of the centre when determining grades than smaller centres. This may go some way to explain the slight advantage seen in 2020 by smaller cohorts compared to other groups, particularly in the probability of attaining at least a C at A level, if these centres were using less data to anchor their results to previous years. Interestingly, previous research has found that class size has no effect on teacher judgement accuracy (Wild & Rost, 1995), so this effect may be purely to do with the approach applied by these centres to standardise their grades, rather than judgment accuracy of teachers per se.
Additional support for this comes from evidence that at A level centres with no prior performance data gained on average higher grades in 2020 than in previous years. These centres are likely to be those teaching a subject for the first time and so will have no past performance data. Grades for these centres were close to those for an average performing centre in 2020, whereas in previous years they would gain slightly lower average grades, likely to be because of unfamiliarity with the teaching material or the exam format. Holmes et al. (2021) also found that results for more mathematical and scientific subject areas tended to be more data driven than more creative subjects. Again, this may help explain the relative lack of generosity in grades for STEM subjects compared to other subjects identified here.
Wyness (2016) showed that after controlling for prior attainment and other candidate characteristics, students from independent schools and grammar schools were more likely to be over predicted at A level. This was reflected in our analysis where at both A level and GCSE, independent centres had amongst the greatest increases in mean grades awarded in 2020, particularly towards the top of the grade distribution. There was also some evidence that grammar schools’ outcomes increased more than those of mainstream secondaries at GCSE, particularly in the probability of candidates attaining C or above. Our results also somewhat agree with those of Delap (1994), who estimated that colleges were more likely to overestimate grades in comparison with other centres. Our analysis found that at GCSE there was some evidence of sixth form colleges and FE/Tertiary colleges being relatively generous, although the samples for these centres were very small and likely to represent atypical candidates at this level. At A level we found some evidence of the opposite effect, with sixth form centres awarding relatively lower grades than other centres in 2020, particularly at grade C. Although again it is worth pointing out that variance explained by centre variables was very low in all years and smaller in 2020 than previous years.
Generalisability of results and limitations
Caution needs to be taken when extrapolating conclusions from this analysis to other instances of teacher judgement. For a few reasons, the generation of CAGs in 2020 may have been a unique scenario regarding the development of teacher grades compared to other teacher judgement situations. Some of these effects may therefore be limited to the case study of 2020 presented here and would need to be taken into consideration when generalising findings further.
Unusually for teacher judgements, CAGs were explicitly intended as a prediction of what students would have achieved in their exams. Whereas, in other situations teacher judgements tend to be more a holistic judgement of candidates’ current ability. This is likely to have led to different mental processes and procedures for allocating CAGs.
Teachers assigning CAGs were also aware that their grades were intended to be standardised, which may have impacted their decision making. Some previous research suggests that the level of accountability teachers have for their judgment decisions can affect the accuracy of their judgements (Pit-ten Cate et al., 2016). This effect is evident in the interviews carried out by Holmes et al. (2021), who found some evidence of teachers attempting to second guess the standardisation procedure, as they did not know the full details of the process in advance. This may have resulted in slightly different behaviour between centres as some believed there may have been a generosity ‘tolerance’ which they aimed to not overstep, whereas others were less cautious. Some centres said they went as far as to adjust CAGs to almost exactly fit their distribution from previous years. There was also some evidence that centres were hesitant to submit too many top grades for fear this would lead to moderation, which may be an additional explanation for the tapering of generosity seen at the top end of the distribution.
There are additional limitations to the general conclusions it is possible to draw from this study. In particular there are factors that could have a substantial impact on teachers’ judgements which were not included in this analysis as the data was not available. For example, previous studies have found that factors such as teaching experience, familiarity with the assessments and training have an influence on the accuracy of teacher judgements (see Urhahne & Wijnia, 2021 for a review). If these unmeasured factors interact with any of the variables included in this analysis, any assumptions of the nature of the relationships found could be misleading.
One particular plausible influence on A level grades is university applications. It is plausible that for the subset of students applying for university, CAGs may have been influenced by the predicted grades already produced by teachers for UCAS applications. Predicted grades are used by universities as part of their admission process to decide which students to offer a place to, usually on the condition of the student then attaining a certain set of grades in their exams. Predictions for 2020 university entrance were submitted to UCAS by October 2019 for some courses and by January 2020 at the latest, five months before CAGs were submitted (by 12th June 2020). In addition, by the time CAGs were submitted candidates would also have received their offers from universities (by May 2020 for the majority of candidates) outlining the grades that were required for them to secure a place on their preferred course. Qualitative data from Holmes et al. (2021) suggests that at least some centres used predicted grades as a source of evidence when deciding on CAGs. As has been discussed previously, these grades tend to be aspirational, potentially in an attempt to encourage students to work harder (Diamond & Persson 2016; Papay et al. 2015). They may also represent teachers wanting the best for their students, giving them the best chance to get into their preferred university (Murphy & Wyness, 2020). In either case, there may have been additional optimism built into the predictions and subsequently, when allocating CAGs for these students, teachers may have been reluctant to reduce these grades to a less optimistic level, particularly where students had received offers that they would then not be able to meet.
However, without data on which students applied for university this hypothesis is difficult to test and the potential influence on the results presented here impossible to calculate. As university application is not independent from factors such as prior attainment or socio-economic status, it’s omission from this analysis may cause estimates of coefficients for these and other factors to be over or under estimated.
Conclusion
In conclusion, the results presented here are moderately reassuring about the validity of CAGs allocated in summer 2020, at least as far as data is available about centres and candidates. Although there was an overall increase in grades in 2020, the majority of the relationships between grades and centre and candidate characteristics were remarkably stable between previous years and 2020. It is also reassuring that there was no noticeable increase in between-centre variance in results as, if there were, it would have suggested that there were marked differences between centres in their approach to assigning grades in 2020. At subject level there was variation in the relative difficulty of different subjects and different subject types in 2020. Particularly there is evidence that subjects with higher proportions of non-exam assessment have been more generously awarded in 2020.
In this study it was only possible to look at relationships with variables which were available for analysis. There is still a large proportion of variance unexplained by our models, some of which may be explainable if data was available on other factors such as candidate’s motivation, classroom resources or teacher skill. We can therefore not say from the data currently available if this unexplained variation follows similar patterns to a normal year. Further insights are likely to require more qualitative investigation of teachers’ decision-making processes. Additional insights into assessment in England and the grading approach taken in summer 2020 will also be possible through the analysis of the updated version of the dataset used in this report, which is being made available to external researchers through the ONS SRS.
References
Benton, T. (2021). On using generosity to combat unreliability. Research Matters: A Cambridge Assessment publication, 31, 22–41.
BIS. (2011). Investigating the accuracy of predicted A level grades as part of the 2009 UCAS admission process. BIS.
BIS. (2013). Investigating the accuracy of predicted A level grades as part of the 2010 UCAS admission process. BIS.
Bramley, T. (2014). Multivariate representations of subject difficulty. Research Matters: A Cambridge Assessment Publication, 18, 42–48.
Burgess, S., & Greaves, E. (2013). Test scores, subjective assessment, and stereotyping of ethnic minorities. Journal of Labor Economics, 31(3), 535-576.
Campbell, T. (2015). Stereotyped at seven? Biases in teacher judgement of pupils’ ability and attainment. Journal of Social Policy, 44(3), 517-543.
Delap, M. R. (1995). Teachers’ Estimates of Candidates’ Performances in Public Examinations. Assessment in Education: Principles, Policy & Practice, 2(1), 75–9.
DfE. (2019). English Baccalaureate (EBacc).
Dhillon, D. (2005). Teachers’ estimates of candidates’ grades: Curriculum 2000 advanced level qualifications. British Educational Research Journal, 31(1), 69–88.
Diamond, R., & Persson, P. (2016). The long-term consequences of teacher discretion in grading of high-stakes tests (No. w22207). National Bureau of Economic Research.
Gill, T., & Benton, T. (2015). The accuracy of forecast grades for OCR GCSEs in June 2014: Statistics Report Series No.91. Statistics Report Series No.91. Cambridge Assessment.
He, Q. & Black, B. Impact of calculated grades, centre assessment grades and final grades on inter-subject comparability in GCSEs and A levels in 2020. Ofqual Report.
Holmes, S., Churchward, D., Howard, E., Keys, E., Leahy, F. & Tonin, D. (2021). Centre Assessment Grades: Teaching Staff Interviews, Summer 2020. Ofqual Report.
Kaiser, J., Möller, J., Helm, F., & Kunter, M. (2015). Das Schülerinventar: Welche Schülermerkmale die Leistungsurteile von Lehrkräften beeinflussen [The student inventory: how student characteristics bias teacher judgments]. Zeitschrift _Für _Erziehungswissenschaft, 18(2), 279–302.
Lee, M. W. & Newton, P. (2021). Systematic divergence between teacher and test-based assessment: literature review. Ofqual Report.
Lee, M. W. & Walter, M. (2020). Equality impact assessment: literature review. Ofqual Report.
Lee, M. W., Stringer, N. & Zanini, N. (2020). Student-level equalities analyses for GCSE and A level. Ofqual Report.
Murphy, R., & Wyness, G. (2020). Minority Report: the impact of predicted grades on university admissions of disadvantaged groups. Education Economics, 28(4), 333-350.
Nakagawa, S., & Schielzeth, H. (2013). A general and simple method for obtaining R2 from generalized linear mixed‐effects models. Methods in Ecology & Evolution, 4(2), 133-142.
Ofqual (2013). Review of Controlled Assessments in GCSEs. Ofqual Report.
Ofqual. (2017). Summary of changes to GCSEs from 2015..
Ofqual. (2018). Summary of changes to AS and A levels from 2015.
Ofqual. (2020a). Summer 2020 grades for GCSE, AS and A level, Extended Project Qualification and Advanced Extension Award in maths: Information for Heads of Centre, Heads of Department/subject leads and teachers on the submission of centre assessment grades.
Ofqual. (2020b). Awarding GCSE, AS, A level, advanced extension awards and extended project qualifications in summer 2020: interim report. Ofqual Report
Papay, John P., Richard J. Murnane, and John B. Willett. (2015). The Impact of Test-Score Labels on Human-Capital Investment Decisions. Journal of Human Resources, 40(4): 1167–1201.
Pit-ten Cate, I. M., Krolak-Schwerdt, S., & Glock, S. (2016). Accuracy of teachers’ tracking decisions: Short- and long-term effects of accountability. European Journal of Psychology of Education, 31(2), 225–243.
Ready, D. D., & Wright, D. L. (2011). Accuracy and inaccuracy in teachers’ perceptions of young children’s cognitive abilities: The role of child background and classroom context. American Educational Research Journal, 48(2), 335–360.
Russell Group. (2016). Informed choices: A Russell Group guide to making decisions about post-16 education.
Südkamp, A., Kaiser, J., & Möller, J. (2012). Accuracy of teachers’ judgments of students’ academic achievement: A meta-analysis. Journal of Educational Psychology, 104(3), 743–762
Taylor, R & Zanini, N. (2017). Native speakers in A level modern foreign languages. Ofqual report.
Thiede, K. W., Oswalt, S., Brendefur, J. L., Carney, M. B., & Osguthorpe, R. D. (2019). Teachers’ judgments of student learning of mathematics. In J. Dunlosky, & K. A. Rawson (Eds.), The Cambridge handbook of cognition and education (Vol. 26, pp. 678–695). Cambridge University Press.
UCAS (2016). Factors associated with predicted and achieved A level attainment.
Urhahne, D., & Wijnia, L. (2021). A Review on the Accuracy of Teacher Judgments. Educational Research Review, 32, 100374.
Walker, I., & Zhu, Y. (2013). Impact of university degrees on the lifecycle of earnings: some further analysis. Department for Business Innovation and Skills.
Wild, K. P., & Rost, D. H. (1995). Klassengr¨oße und Genauigkeit von Schülerbeurteilungen [Class size and the accuracy of teachers’ assessments]. Zeitschrift _für _Entwicklungspsychologie und Padagogische _Psychologie, 27(1), 78–90.
Wyness, G. (2016). Predicted grades: accuracy and impact. UCU.
Appendix A – Breakdown of missing data by centre type
Table A1. Percentage of entries in sample used for core analysis with missing NPD data from each centre type in each year.
| Centre Type | GCSE 2018 | GCSE 2019 | GCSE 2020 | A level 2018 | A level 2019 | A level 2020 |
|---|---|---|---|---|---|---|
| Mainstream secondary | 43.1 | 30.9 | 5.2 | 11 | 13.2 | 11.4 |
| FE/Tertiary College | 1.8 | 1.5 | 2.5 | 4.7 | 3.7 | 4.2 |
| Grammar | 0.6 | 0.2 | 0 | 0 | 0.1 | 0 |
| Independent | 54.2 | 67.2 | 91.9 | 35.6 | 36.8 | 36.2 |
| Sixth Form College | 0.3 | 0.2 | 0.4 | 48.7 | 46.2 | 48.2 |
Table A2. Percentage of entries in sample used for core analysis with missing IDACI score data from each centre type in each year.
| Centre Type | GCSE 2018 | GCSE 2019 | GCSE 2020 | A level 2018 | A level 2019 | A level 2020 |
|---|---|---|---|---|---|---|
| Mainstream secondary | 48.6 | 37.8 | 16 | 12 | 14.2 | 12.2 |
| FE/Tertiary College | 1.6 | 1.4 | 2.2 | 4.6 | 3.7 | 4.2 |
| Grammar | 0.8 | 0.3 | 0.3 | 0.1 | 0.2 | 0.1 |
| Independent | 48.7 | 60.4 | 81.2 | 35.1 | 36.3 | 35.9 |
| Sixth Form College | 0.3 | 0.2 | 0.3 | 48.1 | 45.6 | 47.7 |
Table A3. Percentage of entries with missing prior attainment data from each centre type in each year. For sample used for quantile model.
| Centre Type | GCSE 2018 | GCSE 2019 | GCSE 2020 | A level 2018 | A level 2019 | A level 2020 |
|---|---|---|---|---|---|---|
| Mainstream secondary | 77.1 | 75.2 | 74.7 | 19.7 | 17.9 | 18.1 |
| FE/Tertiary College | 0.2 | 0.2 | 0.3 | 24.3 | 25.6 | 28.4 |
| Grammar | 2.3 | 2.3 | 2.3 | 1.4 | 1.4 | 1.1 |
| Independent | 20.3 | 22.2 | 22.7 | 23.2 | 22.6 | 22.4 |
| Sixth Form College | 0.1 | 0.1 | 0.1 | 31.3 | 32.5 | 30 |
Appendix B – Summary of data for full dataset and sample used in analysis
Table B1. Numbers and percentages of entries in each group in sample used for analysis. Centre breakdowns represent number of total centres in each group, candidate breakdowns represent number of candidates in each group.
| GCSE 2018 | GCSE 2019 | GCSE 2020 | A level 2018 | A level 2019 | A level 2020 | |
|---|---|---|---|---|---|---|
| Total Entries | 481720 | 501001 | 517198 | 377447 | 387600 | 420129 |
| Total Centres | 3883 | 3990 | 4046 | 2513 | 2500 | 2475 |
| Centre Type: Mainstream secondary | 3099 (79.8%) | 3147 (78.9%) | 3179 (78.6%) | 1762 (70.5%) | 1779 (70.8%) | 1746 (70.5%) |
| Centre Type: College | 39 (1%) | 34 (0.9%) | 37 (0.9%) | 79 (3.2%) | 70 (2.8%) | 75 (3%) |
| Centre Type: Grammar | 73 (1.9%) | 73 (1.8%) | 73 (1.8%) | 70 (2.8%) | 70 (2.8%) | 72 (2.9%) |
| Centre Type: Independent | 662 (17%) | 725 (18.2%) | 750 (18.5%) | 494 (19.8%) | 493 (19.6%) | 485 (19.6%) |
| Centre Type: 6th Form | 10 (0.3%) | 11 (0.3%) | 7 (0.2%) | 95 (3.8%) | 101 (4%) | 97 (3.9%) |
| Total Students | 302110 | 315349 | 326896 | 129155 | 130944 | 141869 |
| Gender: Female | 152952 (50.6%) | 159682 (50.6%) | 165319 (50.6%) | 73700 (57.1%) | 73750 (56.3%) | 80431 (56.7%) |
| Gender: Male | 149158 (49.4%) | 155667 (49.4%) | 161577 (49.4%) | 55473 (42.9%) | 57204 (43.7%) | 61462 (43.3%) |
| SEN: No | 269251 (89.1%) | 279757 (88.7%) | 289037 (88.4%) | 105798 (83.9%) | 110460 (84.4%) | 118659 (83.6%) |
| SEN: Yes | 29486 (9.8%) | 32351 (10.3%) | 35379 (10.8%) | 5097 (4%) | 5375 (4.1%) | 6284 (4.4%) |
| SEN: Missing | 3373 (1.1%) | 3241 (1%) | 2482 (0.8%) | 15268 (12.1%) | 15109 (11.5%) | 16998 (12%) |
| FSM: No | 267690 (88.6%) | 275415 (87.3%) | 280768 (85.9%) | 108960 (84.4%) | 109928 (84%) | 117694 (82.9%) |
| FSM: Yes | 31047 (10.3%) | 36693 (11.6%) | 43647 (13.4%) | 4934 (3.8%) | 5907 (4.5%) | 7249 (5.1%) |
| FSM: Missing | 3373 (1.1%) | 3241 (1%) | 2482 (0.8%) | 15268 (11.8%) | 15109 (11.5%) | 16998 (12%) |
| Language group: English | 259458 (85.9%) | 269656 (85.5%) | 279532 (85.5%) | 99120 (76.7%) | 98740 (75.4%) | 105732 (74.5%) |
| Language group: Other | 38888 (12.9%) | 41851 (13.3%) | 44405 (13.6%) | 14422 (11.2%) | 16615 (12.7%) | 18637 (13.1%) |
| Language group: Unclassified | 391 (0.1%) | 601 (0.2%) | 478 (0.1%) | 352 (0.3%) | 480 (0.4%) | 575 (0.4%) |
| Language group: Missing | 3373 (1.1%) | 3241 (1%) | 2482 (0.8%) | 15268 (11.8%) | 15109 (11.5%) | 16998 (12%) |
| Ethnic Group: White | 233322 (77.2%) | 241226 (76.5%) | 248001 (75.9%) | 86654 (67.1%) | 85222 (65.1%) | 90277 (63.6%) |
| Ethnic Group: Asian | 29913 (9.9%) | 31906 (10.1%) | 33552 (10.3%) | 12899 (10%) | 14685 (11.2%) | 16789 (11.8%) |
| Ethnic Group: Black | 13938 (4.6%) | 15076 (4.8%) | 16429 (5%) | 5189 (4%) | 5823 (4.4%) | 6621 (4.7%) |
| Ethnic Group: Chinese | 971 (0.3%) | 1070 (0.3%) | 1145 (0.4%) | 740 (0.6%) | 814 (0.6%) | 807 (0.6%) |
| Ethnic Group: Missing | 3373 (1.1%) | 3241 (1%) | 2482 (0.8%) | 15268 (11.8%) | 15109 (11.5%) | 16998 (12%) |
| Ethnic Group: Mixed | 13839 (4.6%) | 15030 (4.8%) | 16523 (5.1%) | 5290 (4.1%) | 5734 (4.4%) | 6502 (4.6%) |
| Ethnic Group: Any Other | 3660 (1.2%) | 4262 (1.4%) | 4769 (1.5%) | 1729 (1.3%) | 1944 (1.5%) | 2141 (1.5%) |
| Ethnic Group: Unclassified | 3094 (1%) | 3538 (1.1%) | 3996 (1.2%) | 1394 (1.1%) | 1613 (1.2%) | 1810 (1.3%) |
Table B2. Numbers and percentages of entries in each group in full data for subjects on 9-1 grading scale before filtering. Centre breakdowns represent number and percentage of total centres in each group, candidate breakdowns represent number and percentage of candidates in each group.
| GCSE 2018 | GCSE 2019 | GCSE 2020 | A level 2018 | A level 2019 | A level 2020 | |
|---|---|---|---|---|---|---|
| Total Entries | 3879058 | 4307440 | 4412579 | 730044 | 719815 | 718869 |
| Total Centres | 5841 | 5892 | 5839 | 3046 | 2979 | 2858 |
| Centre Type: Mainstream secondary | 3221 (55.1%) | 3260 (55.3%) | 3285 (56.3%) | 1926 (63.2%) | 1891 (63.5%) | 1829 (64%) |
| Centre Type: College | 410 (7%) | 412 (7%) | 408 (7%) | 146 (4.8%) | 140 (4.7%) | 126 (4.4%) |
| Centre Type: Grammar | 73 (1.2%) | 73 (1.2%) | 73 (1.3%) | 73 (2.4%) | 73 (2.5%) | 72 (2.5%) |
| Centre Type: Independent | 908 (15.5%) | 943 (16%) | 943 (16.2%) | 588 (19.3%) | 591 (19.8%) | 577 (20.2%) |
| Centre Type: Missing | 131 (2.2%) | 63 (1.1%) | 15 (0.3%) | 43 (1.4%) | 20 (0.7%) | 2 (0.1%) |
| Centre Type: Other | 991 (17%) | 1030 (17.5%) | 1004 (17.2%) | 159 (5.2%) | 154 (5.2%) | 143 (5%) |
| Centre Type: 6th Form | 107 (1.8%) | 111 (1.9%) | 111 (1.9%) | 111 (3.6%) | 110 (3.7%) | 109 (3.8%) |
| Total Students | 889637 | 939157 | 961966 | 287412 | 284452 | 274669 |
| Gender: Female | 440507 (49.5%) | 464089 (49.4%) | 473479 (49.2%) | 157446 (54.8%) | 155852 (54.8%) | 151878 (55.3%) |
| Gender: Male | 449273 (50.5%) | 475073 (50.6%) | 488803 (50.8%) | 129998 (45.2%) | 128578 (45.2%) | 122822 (44.7%) |
| Gender: Missing | 10 (0%) | 186 (0%) | 263 (0%) | 13 (0%) | 107 (0%) | 26 (0%) |
| SEN: No | 638256 (71.7%) | 678836 (72.3%) | 688343 (71.6%) | 205041 (71.3%) | 201956 (71%) | 204073 (74.3%) |
| SEN: Yes | 94586 (10.6%) | 101115 (10.8%) | 108079 (11.2%) | 11485 (4%) | 11661 (4.1%) | 13319 (4.8%) |
| SEN: Missing | 157097 (17.7%) | 159512 (17%) | 166404 (17.3%) | 70915 (24.7%) | 70846 (24.9%) | 57430 (20.9%) |
| FSM: No | 646631 (72.7%) | 678047 (72.2%) | 679355 (70.6%) | 205988 (71.7%) | 201203 (70.7%) | 202893 (73.9%) |
| FSM: Yes | 86192 (9.7%) | 101874 (10.8%) | 117047 (12.2%) | 10536 (3.7%) | 12414 (4.4%) | 14499 (5.3%) |
| FSM: Missing | 157097 (17.7%) | 159512 (17%) | 166404 (17.3%) | 70915 (24.7%) | 70846 (24.9%) | 57430 (20.9%) |
| Language group: English | 615333 (69.2%) | 648706 (69.1%) | 664302 (69.1%) | 187048 (65.1%) | 181647 (63.9%) | 182772 (66.5%) |
| Language group: Other | 115950 (13%) | 128858 (13.7%) | 129973 (13.5%) | 28633 (10%) | 30908 (10.9%) | 33320 (12.1%) |
| Language group: Unclassified | 1510 (0.2%) | 2327 (0.2%) | 2086 (0.2%) | 842 (0.3%) | 1062 (0.4%) | 1303 (0.5%) |
| Language group: Missing | 157097 (17.7%) | 159512 (17%) | 166404 (17.3%) | 70915 (24.7%) | 70846 (24.9%) | 57430 (20.9%) |
| Ethnic Group: White | 558631 (62.8%) | 586964 (62.5%) | 593871 (61.7%) | 165619 (57.6%) | 159165 (56%) | 157778 (57.4%) |
| Ethnic Group: Any Other | 11976 (1.3%) | 13942 (1.5%) | 14713 (1.5%) | 3445 (1.2%) | 3699 (1.3%) | 3871 (1.4%) |
| Ethnic Group: Asian | 77049 (8.7%) | 84148 (9%) | 86464 (9%) | 23173 (8.1%) | 25051 (8.8%) | 27728 (10.1%) |
| Ethnic Group: Black | 39232 (4.4%) | 42840 (4.6%) | 45073 (4.7%) | 9955 (3.5%) | 10730 (3.8%) | 11755 (4.3%) |
| Ethnic Group: Chinese | 2793 (0.3%) | 3203 (0.3%) | 3104 (0.3%) | 1637 (0.6%) | 1607 (0.6%) | 1527 (0.6%) |
| Ethnic Group: Missing | 157097 (17.7%) | 159512 (17%) | 166404 (17.3%) | 70915 (24.7%) | 70846 (24.9%) | 57430 (20.9%) |
| Ethnic Group: Mixed | 33934 (3.8%) | 38075 (4.1%) | 41095 (4.3%) | 9739 (3.4%) | 10179 (3.6%) | 10977 (4%) |
| Ethnic Group: Unclassified | 9197 (1%) | 10737 (1.1%) | 12078 (1.3%) | 2957 (1%) | 3186 (1.1%) | 3764 (1.4%) |
Table B3. Numbers and percentages of entries in each group in filtered data used for GCSE analysis before and after sampling. Centre breakdowns represent number and percentage of total centres in each group, candidate breakdowns represent number and percentage of candidates in each group.
| Non-filtered 2018 | Non-filtered 2019 | Non-filtered 2020 | Filtered 2018 | Filtered 2019 | Filtered 2020 | |
|---|---|---|---|---|---|---|
| Total Entries | 2899049 | 3023895 | 3120345 | 481720 | 501001 | 517198 |
| Total Centres | 3967 | 4092 | 4120 | 3883 | 3990 | 4046 |
| Centre Type: Mainstream secondary | 3112 (78.4%) | 3165 (77.3%) | 3188 (77.4%) | 3099 (79.8%) | 3147 (78.9%) | 3179 (78.6%) |
| Centre Type: College | 48 (1.2%) | 51 (1.2%) | 55 (1.3%) | 39 (1%) | 34 (0.9%) | 37 (0.9%) |
| Centre Type: Grammar | 73 (1.8%) | 73 (1.8%) | 73 (1.8%) | 73 (1.9%) | 73 (1.8%) | 73 (1.8%) |
| Centre Type: Independent | 720 (18.1%) | 788 (19.3%) | 794 (19.3%) | 662 (17%) | 725 (18.2%) | 750 (18.5%) |
| Centre Type: 6th Form | 14 (0.4%) | 15 (0.4%) | 10 (0.2%) | 10 (0.3%) | 11 (0.3%) | 7 (0.2%) |
| Total Students | 450753 | 471072 | 491417 | 302110 | 315349 | 326896 |
| Gender: Female | 225761 (50.1%) | 235288 (49.9%) | 245353 (49.9%) | 152952 (50.6%) | 159682 (50.6%) | 165319 (50.6%) |
| Gender: Male | 224996 (49.9%) | 235786 (50.1%) | 246066 (50.1%) | 149158 (49.4%) | 155667 (49.4%) | 161577 (49.4%) |
| SEN: No | 396795 (88%) | 412803 (87.6%) | 429272 (87.4%) | 269251 (89.1%) | 279757 (88.7%) | 289037 (88.4%) |
| SEN: Yes | 48403 (10.7%) | 52693 (11.2%) | 57896 (11.8%) | 29486 (9.8%) | 32351 (10.3%) | 35379 (10.8%) |
| SEN: Missing | 5561 (1.2%) | 5577 (1.2%) | 4254 (0.9%) | 3373 (1.1%) | 3241 (1%) | 2482 (0.8%) |
| FSM: No | 395203 (87.7%) | 406873 (86.4%) | 417026 (84.9%) | 267690 (88.6%) | 275415 (87.3%) | 280768 (85.9%) |
| FSM: Yes | 49995 (11.1%) | 58623 (12.4%) | 70141 (14.3%) | 31047 (10.3%) | 36693 (11.6%) | 43647 (13.4%) |
| FSM: Missing | 5561 (1.2%) | 5577 (1.2%) | 4254 (0.9%) | 3373 (1.1%) | 3241 (1%) | 2482 (0.8%) |
| Language group: English | 387041 (85.9%) | 402929 (85.5%) | 420622 (85.6%) | 259458 (85.9%) | 269656 (85.5%) | 279532 (85.5%) |
| Language group: Other | 57587 (12.8%) | 61639 (13.1%) | 65817 (13.4%) | 38888 (12.9%) | 41851 (13.3%) | 44405 (13.6%) |
| Language group: Unclassified | 572 (0.1%) | 928 (0.2%) | 728 (0.1%) | 391 (0.1%) | 601 (0.2%) | 478 (0.1%) |
| Language group: Missing | 5561 (1.2%) | 5577 (1.2%) | 4254 (0.9%) | 3373 (1.1%) | 3241 (1%) | 2482 (0.8%) |
| Ethnic Group: White | 348964 (77.4%) | 360914 (76.6%) | 374292 (76.2%) | 233322 (77.2%) | 241226 (76.5%) | 248001 (75.9%) |
| Ethnic Group: Any Other | 5398 (1.2%) | 6218 (1.3%) | 6897 (1.4%) | 3660 (1.2%) | 4262 (1.4%) | 4769 (1.5%) |
| Ethnic Group: Asian | 44014 (9.8%) | 46783 (9.9%) | 49178 (10%) | 29913 (9.9%) | 31906 (10.1%) | 33552 (10.3%) |
| Ethnic Group: Black | 20739 (4.6%) | 22439 (4.8%) | 24613 (5%) | 13938 (4.6%) | 15076 (4.8%) | 16429 (5%) |
| Ethnic Group: Chinese | 1328 (0.3%) | 1486 (0.3%) | 1555 (0.3%) | 971 (0.3%) | 1070 (0.3%) | 1145 (0.4%) |
| Ethnic Group: Missing | 5561 (1.2%) | 5577 (1.2%) | 4254 (0.9%) | 3373 (1.1%) | 3241 (1%) | 2482 (0.8%) |
| Ethnic Group: Mixed | 20189 (4.5%) | 22334 (4.7%) | 24581 (5%) | 13839 (4.6%) | 15030 (4.8%) | 16523 (5.1%) |
| Ethnic Group: Unclassified | 4567 (1%) | 5323 (1.1%) | 6051 (1.2%) | 3094 (1%) | 3538 (1.1%) | 3996 (1.2%) |
Appendix C – Categorisation of subjects
Table C1. Rules used for allocating subjects to broad subject categories, with example subjects. Adapted from Bramley (2015).
| Subject Group | Rule | Example subjects |
|---|---|---|
| STEM | Science, Technology, Engineering and Mathematics subjects. | Mathematics, Statistics, Computing, Biology |
| Humanities | Knowledge, skills and understanding expressed mainly through extended writing. | Economics, English, Geography, Psychology |
| Languages | Require learning some of the vocabulary and grammar of a second language. | French, German, Spanish, Portuguese |
| Expressive | Knowledge, skills and understanding expressed mainly through performances or artefacts. | Drama, Music, Dance, Fine Art |
| Applied | Knowledge, skills and understanding lead more directly to jobs or job-related further courses. | Business, Physical Education, Engineering, Law |
Appendix D – Additional details of variables
Table D1. Cut off scores for A level quantile variables.
| Min | Cut-off 1 | Cut-off 2 | Cut-off 3 | Cut-off 4 | Max | |
|---|---|---|---|---|---|---|
| Prior attainment | -5.18 | -0.860 | -0.323 | 0.187 | 0.819 | 3.2 |
| IDACI score | 0.004 | 0.051 | 0.086 | 0.142 | 0.247 | 0.916 |
| Subject Cohort Size | 1 | 6 | 14 | - | - | 658 |
| Mean IDACI score | 0.005 | 0.108 | 0.136 | 0.165 | 0.226 | 0.781 |
| Mean prior attainment | 39.1 | 59.5 | 64.2 | - | - | 91.4 |
| Mean grade previous | 0 | 3.12 | 3.88 | - | - | 6 |
| Mean VA previous | -3.37 | -0.275 | 0.25 | - | - | 4.34 |
| Prop SEN | 0 | 0.0142 | 0.0457 | - | - | 1 |
| Prop EAL | 0 | 0.0361 | 0.134 | - | - | 1 |
Table D2. Cut off scores for GCSE quantile variables.
| Min | Cut-off 1 | Cut-off 2 | Cut-off 3 | Cut-off 4 | Max | |
|---|---|---|---|---|---|---|
| Prior attainment | 0 | 37 | 46.6 | 54.9 | 64.6 | 100 |
| IDACI score | 0.004 | 0.068 | 0.124 | 0.209 | 0.324 | 0.916 |
| Subject Cohort Size | 1 | 21 | 54 | - | - | 1882 |
| Mean IDACI score | 0.013 | 0.128 | 0.162 | 0.197 | 0.267 | 0.628 |
| Mean prior attainment | 0 | 47.3 | 53.1 | - | - | 87.9 |
| Mean grade previous | 0 | 5.29 | 6.52 | - | - | 10 |
| Mean VA previous | -4.21 | -0.143 | 0.171 | - | - | 4.93 |
| Prop SEN | 0 | 0.064 | 0.118 | - | - | 1 |
| Prop EAL | 0 | 0.034 | 0.125 | - | - | 1 |
Appendix E – Full A level model output
Table E1. Model output for Core A level model 4
| Variable | 2020 Coef | 2020 SE | 2020 p value | 2019 Coef | 2019 SE | 2019 p value | 2018 Coef | 2018 SE | 2018 p value |
|---|---|---|---|---|---|---|---|---|---|
| (Intercept) | 4.37 | 0.02 | <0.01 | 3.92 | 0.03 | <0.01 | 3.89 | 0.03 | <0.01 |
| MissingNPD | 0.02 | 0.05 | 0.78 | -0.02 | 0.06 | 0.72 | -0.01 | 0.06 | 0.82 |
| NormalisedMeanGCSE_UK | 1.07 | 0.03 | <0.01 | 1.00 | 0.04 | <0.01 | 0.95 | 0.04 | <0.01 |
| Prior_quinthigh | 0.00 | 0.01 | 0.79 | 0.04 | 0.02 | 0.01 | 0.00 | 0.02 | 0.94 |
| Prior_quintlow | -0.04 | 0.02 | 0.01 | -0.01 | 0.02 | 0.68 | 0.02 | 0.02 | 0.27 |
| Prior_quintvery high | 0.53 | 0.01 | <0.01 | 0.30 | 0.02 | <0.01 | 0.26 | 0.02 | <0.01 |
| Prior_quintvery low | -0.24 | 0.02 | <0.01 | -0.25 | 0.02 | <0.01 | -0.23 | 0.02 | <0.01 |
| GenderM | 0.06 | 0.00 | <0.01 | 0.22 | 0.01 | <0.01 | 0.24 | 0.01 | <0.01 |
| DOB_quarter2 | -0.02 | 0.01 | <0.01 | -0.05 | 0.01 | <0.01 | -0.06 | 0.01 | <0.01 |
| DOB_quarter3 | -0.07 | 0.01 | <0.01 | -0.10 | 0.01 | <0.01 | -0.10 | 0.01 | <0.01 |
| DOB_quarter4 | -0.10 | 0.01 | <0.01 | -0.14 | 0.01 | <0.01 | -0.14 | 0.01 | <0.01 |
| SEN_1 | 0.01 | 0.01 | 0.39 | 0.08 | 0.01 | <0.01 | 0.03 | 0.01 | 0.03 |
| LanguageGroup2_OTH | 0.02 | 0.01 | 0.01 | 0.02 | 0.01 | 0.10 | 0.01 | 0.01 | 0.58 |
| LanguageGroup3_UNCL | -0.01 | 0.03 | 0.85 | -0.03 | 0.04 | 0.50 | -0.03 | 0.05 | 0.55 |
| EthnicGroupAOEG | 0.03 | 0.02 | 0.06 | 0.01 | 0.02 | 0.53 | 0.04 | 0.02 | 0.05 |
| EthnicGroupASIA | -0.03 | 0.01 | <0.01 | -0.05 | 0.01 | <0.01 | -0.04 | 0.01 | <0.01 |
| EthnicGroupBLAC | -0.05 | 0.01 | <0.01 | -0.04 | 0.01 | <0.01 | -0.05 | 0.01 | <0.01 |
| EthnicGroupCHIN | 0.18 | 0.03 | <0.01 | 0.13 | 0.03 | <0.01 | 0.08 | 0.03 | 0.01 |
| EthnicGroupMIXD | -0.03 | 0.01 | <0.01 | -0.01 | 0.01 | 0.64 | -0.01 | 0.01 | 0.36 |
| EthnicGroupUNCL | -0.02 | 0.02 | 0.24 | -0.02 | 0.02 | 0.42 | -0.03 | 0.02 | 0.21 |
| IDACIScore_quintlow | 0.03 | 0.01 | <0.01 | 0.03 | 0.01 | <0.01 | 0.02 | 0.01 | 0.01 |
| IDACIScore_quintmedium | 0.02 | 0.01 | <0.01 | 0.01 | 0.01 | 0.08 | 0.01 | 0.01 | 0.13 |
| IDACIScore_quintMissing | -0.02 | 0.05 | 0.73 | 0.00 | 0.06 | 0.96 | 0.01 | 0.06 | 0.82 |
| IDACIScore_quintvery high | -0.01 | 0.01 | 0.11 | -0.02 | 0.01 | 0.01 | -0.02 | 0.01 | 0.04 |
| IDACIScore_quintvery low | 0.04 | 0.01 | <0.01 | 0.06 | 0.01 | <0.01 | 0.04 | 0.01 | <0.01 |
| FSMeligible1 | -0.04 | 0.01 | <0.01 | -0.02 | 0.01 | 0.07 | -0.06 | 0.01 | <0.01 |
| SubjectCohortSize_groupsmall | 0.06 | 0.01 | <0.01 | 0.02 | 0.01 | 0.02 | 0.03 | 0.01 | <0.01 |
| SubjectCohortSize_grouplarge | -0.03 | 0.00 | <0.01 | 0.02 | 0.01 | <0.01 | 0.02 | 0.01 | <0.01 |
| CentreTypeCollege | -0.07 | 0.03 | 0.03 | -0.06 | 0.04 | 0.15 | 0.03 | 0.04 | 0.43 |
| CentreTypeGrammar | -0.06 | 0.02 | 0.01 | -0.05 | 0.03 | 0.10 | -0.06 | 0.03 | 0.03 |
| CentreTypeIndependent | 0.14 | 0.01 | <0.01 | 0.07 | 0.02 | <0.01 | 0.07 | 0.02 | <0.01 |
| CentreTypeSixth Form | -0.06 | 0.02 | 0.01 | 0.06 | 0.03 | 0.03 | 0.06 | 0.03 | 0.02 |
| propSEN_school_grouphigh | 0.00 | 0.01 | 0.96 | 0.01 | 0.01 | 0.57 | 0.00 | 0.01 | 0.81 |
| propSEN_school_grouplow | 0.01 | 0.01 | 0.51 | 0.00 | 0.01 | 0.82 | -0.03 | 0.01 | 0.01 |
| meanIDACI_quinthigh | 0.01 | 0.02 | 0.50 | -0.02 | 0.02 | 0.25 | -0.05 | 0.02 | 0.01 |
| meanIDACI_quintlow | 0.00 | 0.01 | 0.85 | -0.02 | 0.02 | 0.33 | -0.02 | 0.02 | 0.35 |
| meanIDACI_quintMissing | 0.80 | 0.34 | 0.02 | -0.53 | 0.26 | 0.05 | -0.39 | 0.39 | 0.32 |
| meanIDACI_quintvery high | 0.06 | 0.02 | <0.01 | -0.05 | 0.02 | 0.02 | -0.02 | 0.02 | 0.27 |
| meanIDACI_quintvery low | -0.02 | 0.01 | 0.23 | 0.02 | 0.02 | 0.20 | 0.03 | 0.02 | 0.07 |
| propEAL_school_grouphigh | 0.01 | 0.01 | 0.50 | 0.03 | 0.02 | 0.08 | 0.03 | 0.02 | 0.03 |
| propEAL_school_grouplow | 0.03 | 0.01 | 0.02 | 0.01 | 0.01 | 0.53 | -0.03 | 0.01 | 0.04 |
| meanprior_school_grouphigh | -0.10 | 0.01 | <0.01 | 0.03 | 0.01 | 0.05 | 0.03 | 0.01 | 0.01 |
| meanprior_school_grouplow | 0.06 | 0.01 | <0.01 | -0.08 | 0.01 | <0.01 | -0.06 | 0.01 | <0.01 |
| RegionEast Midlands | -0.05 | 0.02 | 0.01 | -0.08 | 0.02 | <0.01 | -0.04 | 0.02 | 0.09 |
| RegionEast of England | -0.04 | 0.02 | 0.01 | -0.08 | 0.02 | <0.01 | -0.06 | 0.02 | 0.01 |
| RegionMissing | 0.07 | 0.04 | 0.05 | -0.08 | 0.04 | 0.06 | -0.08 | 0.05 | 0.07 |
| RegionNorth East | -0.02 | 0.03 | 0.54 | -0.03 | 0.03 | 0.26 | -0.03 | 0.03 | 0.28 |
| RegionNorth West | -0.04 | 0.02 | 0.05 | -0.09 | 0.02 | <0.01 | -0.08 | 0.02 | <0.01 |
| RegionSouth East | -0.03 | 0.02 | 0.07 | -0.05 | 0.02 | 0.01 | -0.03 | 0.02 | 0.15 |
| RegionSouth West | -0.02 | 0.02 | 0.24 | -0.04 | 0.02 | 0.11 | -0.04 | 0.02 | 0.05 |
| RegionWest Midlands | -0.04 | 0.02 | 0.01 | -0.09 | 0.02 | <0.01 | -0.10 | 0.02 | <0.01 |
| RegionYorkshire and the Humber | -0.03 | 0.02 | 0.10 | -0.06 | 0.02 | 0.01 | -0.04 | 0.02 | 0.09 |
| MeanGradePrevious_grouphigh | 0.11 | 0.01 | <0.01 | 0.11 | 0.01 | <0.01 | 0.10 | 0.01 | <0.01 |
| MeanGradePrevious_grouplow | -0.09 | 0.01 | <0.01 | -0.10 | 0.01 | <0.01 | -0.11 | 0.01 | <0.01 |
| MeanGradePrevious_groupMissing | 0.06 | 0.08 | 0.44 | 0.19 | 0.12 | 0.10 | -0.17 | 0.17 | 0.34 |
| MeanVAPrevious_grouphigh | 0.12 | 0.01 | <0.01 | 0.11 | 0.01 | <0.01 | 0.10 | 0.01 | <0.01 |
| MeanVAPrevious_grouplow | -0.12 | 0.01 | <0.01 | -0.11 | 0.01 | <0.01 | -0.09 | 0.01 | <0.01 |
| MeanVAPrevious_groupMissing | -0.05 | 0.08 | 0.56 | -0.31 | 0.12 | 0.01 | -0.02 | 0.17 | 0.92 |
| NormalisedMeanGCSE_UK:Prior_quinthigh | 0.00 | 0.04 | 0.98 | -0.08 | 0.05 | 0.08 | 0.08 | 0.05 | 0.08 |
| NormalisedMeanGCSE_UK:Prior_quintlow | -0.11 | 0.04 | 0.01 | -0.04 | 0.05 | 0.46 | 0.03 | 0.05 | 0.53 |
| NormalisedMeanGCSE_UK:Prior_quintvery high | -0.54 | 0.03 | <0.01 | -0.28 | 0.04 | <0.01 | -0.22 | 0.04 | <0.01 |
| NormalisedMeanGCSE_UK:Prior_quintvery low | -0.28 | 0.03 | <0.01 | -0.28 | 0.04 | <0.01 | -0.25 | 0.04 | <0.01 |
| MeanGradePrevious_grouphigh:MeanVAPrevious_grouphigh | 0.05 | 0.01 | <0.01 | 0.04 | 0.01 | <0.01 | 0.04 | 0.01 | <0.01 |
| MeanGradePrevious_grouplow:MeanVAPrevious_grouphigh | -0.04 | 0.01 | <0.01 | 0.00 | 0.01 | 0.77 | -0.01 | 0.01 | 0.65 |
| MeanGradePrevious_grouphigh:MeanVAPrevious_grouplow | 0.02 | 0.01 | 0.01 | 0.00 | 0.01 | 0.62 | -0.01 | 0.01 | 0.41 |
| MeanGradePrevious_grouplow:MeanVAPrevious_grouplow | 0.00 | 0.01 | 0.78 | -0.08 | 0.01 | <0.01 | -0.09 | 0.01 | <0.01 |
| MeanGradePrevious_grouphigh:MeanVAPrevious_groupMissing | -0.03 | 0.08 | 0.71 | 0.26 | 0.12 | 0.03 | -0.01 | 0.18 | 0.94 |
| MeanGradePrevious_grouplow:MeanVAPrevious_groupMissing | 0.16 | 0.09 | 0.09 | 0.19 | 0.14 | 0.16 | 0.00 | 0.18 | 0.99 |
Table E2. Model output for Binomial A level model 4 for A and above.
| Variable | 2020 Coef | 2020 SE | 2020 p value | 2019 Coef | 2019 SE | 2019 p value | 2018 Coef | 2018 SE | 2018 p value |
|---|---|---|---|---|---|---|---|---|---|
| (Intercept) | -0.52 | 0.07 | <0.01 | -2.08 | 0.08 | <0.01 | -1.87 | 0.07 | <0.01 |
| MissingNPD | 0.21 | 0.16 | 0.20 | -0.07 | 0.17 | 0.68 | 0.06 | 0.17 | 0.74 |
| Prior_Score | 2.47 | 0.08 | <0.01 | 1.83 | 0.10 | <0.01 | 1.92 | 0.11 | <0.01 |
| Prior_quinthigh | -0.04 | 0.04 | 0.22 | 0.04 | 0.04 | 0.30 | 0.00 | 0.04 | 0.94 |
| Prior_quintlow | -0.04 | 0.06 | 0.52 | 0.02 | 0.07 | 0.82 | 0.02 | 0.07 | 0.75 |
| Prior_quintvery high | 0.69 | 0.05 | <0.01 | 0.20 | 0.04 | <0.01 | 0.14 | 0.05 | <0.01 |
| Prior_quintvery low | -0.74 | 0.07 | <0.01 | -0.66 | 0.09 | <0.01 | -0.38 | 0.09 | <0.01 |
| GenderM | 0.17 | 0.01 | <0.01 | 0.45 | 0.02 | <0.01 | 0.47 | 0.02 | <0.01 |
| DOB_quarter2 | -0.08 | 0.02 | <0.01 | -0.10 | 0.02 | <0.01 | -0.10 | 0.02 | <0.01 |
| DOB_quarter3 | -0.14 | 0.02 | <0.01 | -0.20 | 0.02 | <0.01 | -0.18 | 0.02 | <0.01 |
| DOB_quarter4 | -0.22 | 0.02 | <0.01 | -0.27 | 0.02 | <0.01 | -0.27 | 0.02 | <0.01 |
| SEN_1 | -0.01 | 0.03 | 0.65 | 0.19 | 0.04 | <0.01 | 0.07 | 0.04 | 0.05 |
| LanguageGroup2_OTH | 0.06 | 0.02 | 0.01 | 0.06 | 0.03 | 0.02 | 0.00 | 0.03 | 0.93 |
| LanguageGroup3_UNCL | 0.02 | 0.10 | 0.84 | -0.11 | 0.12 | 0.40 | -0.07 | 0.14 | 0.61 |
| EthnicGroupAOEG | 0.09 | 0.05 | 0.10 | -0.02 | 0.06 | 0.75 | 0.02 | 0.06 | 0.76 |
| EthnicGroupASIA | -0.07 | 0.03 | 0.01 | -0.19 | 0.03 | <0.01 | -0.12 | 0.03 | <0.01 |
| EthnicGroupBLAC | -0.15 | 0.03 | <0.01 | -0.20 | 0.04 | <0.01 | -0.20 | 0.04 | <0.01 |
| EthnicGroupCHIN | 0.38 | 0.08 | <0.01 | 0.15 | 0.08 | 0.07 | 0.17 | 0.09 | 0.05 |
| EthnicGroupMIXD | -0.04 | 0.03 | 0.23 | -0.02 | 0.03 | 0.62 | -0.02 | 0.03 | 0.48 |
| EthnicGroupUNCL | -0.02 | 0.06 | 0.69 | -0.08 | 0.07 | 0.25 | -0.08 | 0.07 | 0.28 |
| IDACIScore_quinthigh | 0.06 | 0.02 | 0.01 | 0.07 | 0.02 | <0.01 | 0.06 | 0.02 | 0.02 |
| IDACIScore_quintlow | 0.05 | 0.02 | 0.03 | 0.00 | 0.02 | 0.86 | 0.02 | 0.02 | 0.33 |
| IDACIScore_quintMissing | -0.19 | 0.16 | 0.25 | 0.04 | 0.17 | 0.82 | -0.04 | 0.17 | 0.82 |
| IDACIScore_quintvery high | -0.02 | 0.02 | 0.42 | -0.03 | 0.03 | 0.21 | -0.04 | 0.03 | 0.14 |
| IDACIScore_quintvery low | 0.09 | 0.02 | <0.01 | 0.09 | 0.02 | <0.01 | 0.07 | 0.02 | 0.01 |
| FSMeligible1 | -0.07 | 0.03 | 0.01 | -0.01 | 0.04 | 0.73 | -0.12 | 0.04 | <0.01 |
| SubjectCohortSize_groupsmall | 0.18 | 0.02 | <0.01 | 0.03 | 0.03 | 0.21 | 0.03 | 0.03 | 0.33 |
| SubjectCohortSize_grouplarge | -0.08 | 0.02 | <0.01 | 0.07 | 0.02 | <0.01 | 0.04 | 0.02 | 0.01 |
| CentreTypeCollege | -0.12 | 0.10 | 0.23 | -0.24 | 0.11 | 0.02 | 0.06 | 0.11 | 0.55 |
| CentreTypeGrammar | -0.08 | 0.06 | 0.20 | -0.02 | 0.06 | 0.69 | -0.05 | 0.06 | 0.42 |
| CentreTypeIndependent | 0.33 | 0.04 | <0.01 | 0.20 | 0.04 | <0.01 | 0.18 | 0.04 | <0.01 |
| CentreTypeSixth Form | -0.16 | 0.06 | 0.01 | 0.09 | 0.06 | 0.14 | 0.08 | 0.06 | 0.20 |
| propSEN_school_grouphigh | 0.00 | 0.03 | 0.98 | 0.01 | 0.03 | 0.81 | 0.01 | 0.03 | 0.70 |
| propSEN_school_grouplow | 0.02 | 0.03 | 0.58 | 0.00 | 0.03 | 0.97 | -0.06 | 0.03 | 0.06 |
| meanIDACI_quinthigh | 0.01 | 0.04 | 0.88 | -0.06 | 0.04 | 0.14 | -0.09 | 0.04 | 0.04 |
| meanIDACI_quintlow | 0.01 | 0.04 | 0.72 | -0.03 | 0.04 | 0.49 | -0.04 | 0.04 | 0.32 |
| meanIDACI_quintMissing | 2.18 | 1.25 | 0.08 | -1.36 | 1.00 | 0.17 | -1.23 | 1.41 | 0.38 |
| meanIDACI_quintvery high | 0.10 | 0.05 | 0.04 | -0.11 | 0.05 | 0.03 | -0.04 | 0.05 | 0.40 |
| meanIDACI_quintvery low | -0.03 | 0.04 | 0.42 | 0.07 | 0.04 | 0.08 | 0.07 | 0.04 | 0.07 |
| propEAL_school_grouphigh | 0.03 | 0.03 | 0.35 | 0.05 | 0.04 | 0.21 | 0.08 | 0.04 | 0.03 |
| propEAL_school_grouplow | 0.05 | 0.03 | 0.08 | 0.01 | 0.03 | 0.86 | -0.06 | 0.03 | 0.05 |
| meanprior_school_grouphigh | -0.26 | 0.03 | <0.01 | 0.02 | 0.03 | 0.43 | 0.02 | 0.03 | 0.55 |
| meanprior_school_grouplow | 0.19 | 0.03 | <0.01 | 0.04 | 0.04 | 0.27 | 0.00 | 0.04 | 0.94 |
| RegionEast Midlands | -0.10 | 0.05 | 0.05 | -0.21 | 0.05 | <0.01 | -0.04 | 0.05 | 0.42 |
| RegionEast of England | -0.14 | 0.05 | <0.01 | -0.15 | 0.05 | <0.01 | -0.08 | 0.05 | 0.08 |
| RegionMissing | 0.14 | 0.10 | 0.13 | -0.06 | 0.11 | 0.60 | 0.00 | 0.11 | 0.99 |
| RegionNorth East | -0.09 | 0.07 | 0.21 | -0.11 | 0.07 | 0.13 | -0.07 | 0.07 | 0.29 |
| RegionNorth West | -0.10 | 0.05 | 0.06 | -0.19 | 0.05 | <0.01 | -0.08 | 0.05 | 0.11 |
| RegionSouth East | -0.07 | 0.04 | 0.11 | -0.09 | 0.05 | 0.05 | -0.01 | 0.05 | 0.84 |
| RegionSouth West | -0.08 | 0.05 | 0.15 | -0.05 | 0.05 | 0.40 | -0.05 | 0.05 | 0.32 |
| RegionWest Midlands | -0.13 | 0.05 | 0.01 | -0.19 | 0.05 | <0.01 | -0.17 | 0.05 | <0.01 |
| RegionYorkshire and the Humber | -0.12 | 0.05 | 0.02 | -0.13 | 0.06 | 0.02 | -0.03 | 0.05 | 0.65 |
| MeanGradePrevious_grouphigh | 0.27 | 0.02 | <0.01 | 0.26 | 0.02 | <0.01 | 0.23 | 0.02 | <0.01 |
| MeanGradePrevious_grouplow | -0.14 | 0.02 | <0.01 | -0.22 | 0.03 | <0.01 | -0.24 | 0.03 | <0.01 |
| MeanGradePrevious_groupMissing | 0.39 | 0.30 | 0.20 | 0.30 | 0.41 | 0.47 | 0.00 | 0.71 | 1.00 |
| MeanVAPrevious_grouphigh | 0.30 | 0.02 | <0.01 | 0.18 | 0.02 | <0.01 | 0.16 | 0.02 | <0.01 |
| MeanVAPrevious_grouplow | -0.25 | 0.02 | <0.01 | -0.20 | 0.03 | <0.01 | -0.15 | 0.02 | <0.01 |
| MeanVAPrevious_groupMissing | -0.31 | 0.30 | 0.30 | -0.47 | 0.41 | 0.26 | -0.33 | 0.71 | 0.64 |
| Prior_Score:Prior_quinthigh | 0.13 | 0.11 | 0.22 | -0.01 | 0.12 | 0.92 | 0.01 | 0.13 | 0.95 |
| Prior_Score:Prior_quintlow | -0.18 | 0.12 | 0.15 | 0.01 | 0.15 | 0.97 | -0.15 | 0.16 | 0.34 |
| Prior_Score:Prior_quintvery high | -0.68 | 0.09 | <0.01 | -0.10 | 0.10 | 0.33 | -0.19 | 0.11 | 0.09 |
| Prior_Score:Prior_quintvery low | -0.90 | 0.10 | <0.01 | -0.66 | 0.12 | <0.01 | -0.60 | 0.13 | <0.01 |
| MeanGradePrevious_grouphigh:MeanVAPrevious_grouphigh | 0.17 | 0.03 | <0.01 | 0.16 | 0.03 | <0.01 | 0.14 | 0.03 | <0.01 |
| MeanGradePrevious_grouplow:MeanVAPrevious_grouphigh | -0.17 | 0.04 | <0.01 | -0.06 | 0.05 | 0.17 | -0.09 | 0.05 | 0.07 |
| MeanGradePrevious_grouphigh:MeanVAPrevious_grouplow | -0.08 | 0.03 | 0.01 | -0.13 | 0.03 | <0.01 | -0.14 | 0.03 | <0.01 |
| MeanGradePrevious_grouplow:MeanVAPrevious_grouplow | 0.04 | 0.03 | 0.22 | -0.05 | 0.04 | 0.14 | -0.07 | 0.04 | 0.04 |
| MeanGradePrevious_grouphigh:MeanVAPrevious_groupMissing | 0.24 | 0.32 | 0.46 | 0.49 | 0.43 | 0.26 | 0.21 | 0.73 | 0.77 |
| MeanGradePrevious_grouplow:MeanVAPrevious_groupMissing | 0.75 | 0.36 | 0.04 | 0.56 | 0.49 | 0.26 | 0.42 | 0.75 | 0.57 |
Table E3. Model output for Binomial A level model 4 for C and above.
| Variable | 2020 Coef | 2020 SE | 2020 p value | 2019 Coef | 2019 SE | 2019 p value | 2018 Coef | 2018 SE | 2018 p value |
|---|---|---|---|---|---|---|---|---|---|
| (Intercept) | 4.72 | 0.10 | <0.01 | 3.69 | 0.08 | <0.01 | 3.29 | 0.08 | <0.01 |
| MissingNPD | -0.21 | 0.22 | 0.33 | 0.03 | 0.18 | 0.89 | 0.02 | 0.17 | 0.92 |
| Prior_Score | 2.18 | 0.12 | <0.01 | 2.10 | 0.11 | <0.01 | 1.84 | 0.11 | <0.01 |
| Prior_quinthigh | -0.09 | 0.07 | 0.17 | 0.20 | 0.05 | <0.01 | -0.04 | 0.05 | 0.39 |
| Prior_quintlow | -0.17 | 0.07 | 0.01 | 0.00 | 0.06 | 0.94 | 0.09 | 0.06 | 0.12 |
| Prior_quintvery high | -0.18 | 0.21 | 0.39 | 0.25 | 0.10 | 0.01 | -0.12 | 0.10 | 0.24 |
| Prior_quintvery low | -0.23 | 0.06 | <0.01 | -0.42 | 0.05 | <0.01 | -0.47 | 0.05 | <0.01 |
| GenderM | 0.03 | 0.02 | 0.14 | 0.45 | 0.02 | <0.01 | 0.45 | 0.02 | <0.01 |
| DOB_quarter2 | -0.01 | 0.02 | 0.58 | -0.10 | 0.02 | <0.01 | -0.15 | 0.02 | <0.01 |
| DOB_quarter3 | -0.15 | 0.02 | <0.01 | -0.21 | 0.02 | <0.01 | -0.22 | 0.02 | <0.01 |
| DOB_quarter4 | -0.23 | 0.02 | <0.01 | -0.31 | 0.02 | <0.01 | -0.31 | 0.02 | <0.01 |
| SEN_1 | 0.03 | 0.04 | 0.38 | 0.13 | 0.04 | <0.01 | 0.02 | 0.04 | 0.55 |
| LanguageGroup2_OTH | 0.06 | 0.03 | 0.06 | 0.03 | 0.03 | 0.31 | 0.01 | 0.03 | 0.64 |
| LanguageGroup3_UNCL | 0.03 | 0.13 | 0.84 | 0.04 | 0.13 | 0.76 | 0.02 | 0.14 | 0.89 |
| EthnicGroupAOEG | 0.12 | 0.07 | 0.08 | 0.06 | 0.06 | 0.37 | 0.16 | 0.06 | 0.01 |
| EthnicGroupASIA | -0.01 | 0.03 | 0.71 | -0.06 | 0.03 | 0.04 | -0.05 | 0.03 | 0.11 |
| EthnicGroupBLAC | -0.05 | 0.04 | 0.24 | 0.02 | 0.04 | 0.56 | -0.01 | 0.04 | 0.82 |
| EthnicGroupCHIN | 0.55 | 0.13 | <0.01 | 0.41 | 0.10 | <0.01 | 0.19 | 0.10 | 0.06 |
| EthnicGroupMIXD | -0.09 | 0.04 | 0.03 | -0.02 | 0.04 | 0.53 | -0.03 | 0.04 | 0.48 |
| EthnicGroupUNCL | -0.11 | 0.07 | 0.15 | 0.01 | 0.07 | 0.92 | -0.06 | 0.07 | 0.43 |
| IDACIScore_quinthigh | 0.11 | 0.03 | <0.01 | 0.07 | 0.03 | <0.01 | 0.04 | 0.02 | 0.11 |
| IDACIScore_quintlow | 0.06 | 0.03 | 0.05 | 0.06 | 0.03 | 0.02 | 0.04 | 0.02 | 0.13 |
| IDACIScore_quintMissing | 0.18 | 0.21 | 0.41 | -0.09 | 0.18 | 0.59 | -0.03 | 0.16 | 0.85 |
| IDACIScore_quintvery high | -0.03 | 0.03 | 0.25 | -0.06 | 0.03 | 0.02 | -0.02 | 0.02 | 0.41 |
| IDACIScore_quintvery low | 0.13 | 0.03 | <0.01 | 0.15 | 0.03 | <0.01 | 0.09 | 0.03 | <0.01 |
| FSMeligible1 | -0.12 | 0.04 | <0.01 | -0.08 | 0.03 | 0.02 | -0.14 | 0.04 | <0.01 |
| SubjectCohortSize_groupsmall | 0.31 | 0.04 | <0.01 | 0.05 | 0.03 | 0.09 | 0.08 | 0.03 | <0.01 |
| SubjectCohortSize_grouplarge | -0.11 | 0.02 | <0.01 | 0.03 | 0.02 | 0.06 | 0.03 | 0.02 | 0.06 |
| CentreTypeCollege | -0.12 | 0.12 | 0.31 | -0.10 | 0.11 | 0.34 | 0.12 | 0.11 | 0.28 |
| CentreTypeGrammar | -0.28 | 0.09 | <0.01 | -0.14 | 0.07 | 0.06 | -0.21 | 0.07 | 0.01 |
| CentreTypeIndependent | 0.68 | 0.06 | <0.01 | 0.26 | 0.05 | <0.01 | 0.22 | 0.05 | <0.01 |
| CentreTypeSixth Form | -0.12 | 0.08 | 0.14 | 0.14 | 0.07 | 0.05 | 0.11 | 0.07 | 0.11 |
| propSEN_school_grouphigh | -0.03 | 0.04 | 0.42 | 0.00 | 0.03 | 0.90 | 0.01 | 0.03 | 0.66 |
| propSEN_school_grouplow | 0.01 | 0.04 | 0.81 | -0.01 | 0.03 | 0.73 | -0.05 | 0.03 | 0.15 |
| meanIDACI_quinthigh | 0.02 | 0.06 | 0.67 | -0.02 | 0.05 | 0.63 | -0.10 | 0.05 | 0.03 |
| meanIDACI_quintlow | -0.03 | 0.05 | 0.59 | -0.05 | 0.04 | 0.25 | -0.05 | 0.04 | 0.25 |
| meanIDACI_quintMissing | 11.77 | 338.56 | 0.97 | -1.04 | 0.72 | 0.15 | -1.58 | 1.04 | 0.13 |
| meanIDACI_quintvery high | 0.16 | 0.06 | 0.01 | -0.05 | 0.06 | 0.37 | -0.03 | 0.06 | 0.64 |
| meanIDACI_quintvery low | -0.08 | 0.05 | 0.13 | 0.02 | 0.05 | 0.67 | 0.03 | 0.05 | 0.49 |
| propEAL_school_grouphigh | -0.05 | 0.05 | 0.32 | 0.06 | 0.04 | 0.15 | 0.07 | 0.04 | 0.09 |
| propEAL_school_grouplow | 0.08 | 0.04 | 0.08 | 0.01 | 0.04 | 0.79 | -0.04 | 0.03 | 0.20 |
| meanprior_school_grouphigh | -0.06 | 0.04 | 0.12 | 0.09 | 0.04 | 0.01 | 0.12 | 0.04 | <0.01 |
| meanprior_school_grouplow | 0.11 | 0.04 | 0.01 | -0.14 | 0.04 | <0.01 | -0.09 | 0.04 | 0.01 |
| RegionEast Midlands | -0.21 | 0.07 | <0.01 | -0.11 | 0.06 | 0.08 | -0.08 | 0.06 | 0.20 |
| RegionEast of England | -0.12 | 0.07 | 0.08 | -0.15 | 0.06 | 0.01 | -0.10 | 0.06 | 0.06 |
| RegionMissing | 0.05 | 0.13 | 0.74 | -0.19 | 0.12 | 0.12 | -0.20 | 0.12 | 0.10 |
| RegionNorth East | -0.05 | 0.10 | 0.60 | -0.07 | 0.08 | 0.39 | -0.09 | 0.08 | 0.27 |
| RegionNorth West | -0.11 | 0.07 | 0.12 | -0.17 | 0.06 | 0.01 | -0.17 | 0.06 | 0.01 |
| RegionSouth East | -0.11 | 0.06 | 0.07 | -0.06 | 0.05 | 0.24 | -0.03 | 0.05 | 0.52 |
| RegionSouth West | -0.10 | 0.07 | 0.19 | -0.08 | 0.06 | 0.17 | -0.11 | 0.06 | 0.08 |
| RegionWest Midlands | -0.12 | 0.07 | 0.07 | -0.14 | 0.06 | 0.01 | -0.19 | 0.05 | <0.01 |
| RegionYorkshire and the Humber | -0.13 | 0.08 | 0.09 | -0.10 | 0.06 | 0.12 | -0.07 | 0.06 | 0.24 |
| MeanGradePrevious_grouphigh | 0.33 | 0.03 | <0.01 | 0.24 | 0.03 | <0.01 | 0.27 | 0.03 | <0.01 |
| MeanGradePrevious_grouplow | -0.33 | 0.03 | <0.01 | -0.29 | 0.02 | <0.01 | -0.28 | 0.02 | <0.01 |
| MeanGradePrevious_groupMissing | -0.01 | 0.51 | 0.99 | 0.07 | 0.48 | 0.88 | -1.42 | 0.69 | 0.04 |
| MeanVAPrevious_grouphigh | 0.31 | 0.03 | <0.01 | 0.24 | 0.03 | <0.01 | 0.21 | 0.02 | <0.01 |
| MeanVAPrevious_grouplow | -0.32 | 0.03 | <0.01 | -0.28 | 0.03 | <0.01 | -0.20 | 0.03 | <0.01 |
| MeanVAPrevious_groupMissing | -0.18 | 0.51 | 0.73 | -0.45 | 0.48 | 0.35 | 1.01 | 0.69 | 0.14 |
| Prior_Score:Prior_quinthigh | 0.22 | 0.18 | 0.22 | -0.45 | 0.15 | <0.01 | 0.25 | 0.15 | 0.10 |
| Prior_Score:Prior_quintlow | -0.29 | 0.16 | 0.07 | -0.06 | 0.14 | 0.67 | 0.20 | 0.15 | 0.16 |
| Prior_Score:Prior_quintvery high | 0.19 | 0.21 | 0.38 | -0.31 | 0.13 | 0.02 | 0.17 | 0.14 | 0.21 |
| Prior_Score:Prior_quintvery low | -0.25 | 0.13 | 0.05 | -0.48 | 0.11 | <0.01 | -0.39 | 0.12 | <0.01 |
| MeanGradePrevious_grouphigh:MeanVAPrevious_grouphigh | 0.07 | 0.05 | 0.16 | 0.15 | 0.04 | <0.01 | 0.07 | 0.04 | 0.05 |
| MeanGradePrevious_grouplow:MeanVAPrevious_grouphigh | -0.08 | 0.05 | 0.09 | -0.03 | 0.04 | 0.39 | 0.01 | 0.04 | 0.76 |
| MeanGradePrevious_grouphigh:MeanVAPrevious_grouplow | -0.04 | 0.05 | 0.37 | -0.04 | 0.04 | 0.33 | -0.11 | 0.04 | <0.01 |
| MeanGradePrevious_grouplow:MeanVAPrevious_grouplow | 0.14 | 0.04 | <0.01 | -0.05 | 0.03 | 0.13 | -0.06 | 0.03 | 0.08 |
| MeanGradePrevious_grouphigh:MeanVAPrevious_groupMissing | -0.29 | 0.58 | 0.62 | 0.45 | 0.53 | 0.39 | -1.23 | 0.72 | 0.09 |
| MeanGradePrevious_grouplow:MeanVAPrevious_groupMissing | 0.26 | 0.60 | 0.66 | 0.04 | 0.54 | 0.94 | -1.09 | 0.73 | 0.13 |
Table E4. Model output for A level quantile prior attainment model.
| Variable | 2020 Coef | 2020 SE | 2020 p value | 2019 Coef | 2019 SE | 2019 p value | 2018 Coef | 2018 SE | 2018 p value |
|---|---|---|---|---|---|---|---|---|---|
| (Intercept) | 4.28 | 0.03 | <0.01 | 3.84 | 0.03 | <0.01 | 3.86 | 0.03 | <0.01 |
| MissingNPD | 0.01 | 0.05 | 0.88 | -0.01 | 0.06 | 0.85 | -0.03 | 0.06 | 0.62 |
| Prior_quant1 | -1.33 | 0.01 | <0.01 | -1.24 | 0.01 | <0.01 | -1.25 | 0.01 | <0.01 |
| Prior_quant2 | -0.87 | 0.01 | <0.01 | -0.81 | 0.01 | <0.01 | -0.83 | 0.01 | <0.01 |
| Prior_quant3 | -0.58 | 0.01 | <0.01 | -0.52 | 0.01 | <0.01 | -0.52 | 0.01 | <0.01 |
| Prior_quant4 | -0.30 | 0.01 | <0.01 | -0.24 | 0.01 | <0.01 | -0.24 | 0.01 | <0.01 |
| Prior_quant6 | 0.29 | 0.01 | <0.01 | 0.28 | 0.01 | <0.01 | 0.29 | 0.01 | <0.01 |
| Prior_quant7 | 0.63 | 0.01 | <0.01 | 0.61 | 0.01 | <0.01 | 0.59 | 0.01 | <0.01 |
| Prior_quant8 | 1.02 | 0.01 | <0.01 | 0.99 | 0.01 | <0.01 | 0.97 | 0.01 | <0.01 |
| Prior_quant9 | 1.57 | 0.01 | <0.01 | 1.65 | 0.01 | <0.01 | 1.54 | 0.01 | <0.01 |
| Prior_quantMissing | 0.10 | 0.01 | <0.01 | 0.19 | 0.01 | <0.01 | 0.16 | 0.01 | <0.01 |
| GenderM | 0.02 | 0.00 | <0.01 | 0.18 | 0.01 | <0.01 | 0.19 | 0.01 | <0.01 |
| DOB_quarter2 | -0.01 | 0.01 | 0.01 | -0.05 | 0.01 | <0.01 | -0.05 | 0.01 | <0.01 |
| DOB_quarter3 | -0.05 | 0.01 | <0.01 | -0.09 | 0.01 | <0.01 | -0.09 | 0.01 | <0.01 |
| DOB_quarter4 | -0.08 | 0.01 | <0.01 | -0.12 | 0.01 | <0.01 | -0.12 | 0.01 | <0.01 |
| SEN_1 | <0.01 | 0.01 | 0.99 | 0.05 | 0.01 | <0.01 | 0.01 | 0.01 | 0.66 |
| LanguageGroup2_OTH | 0.02 | 0.01 | 0.01 | 0.01 | 0.01 | 0.23 | -0.01 | 0.01 | 0.53 |
| LanguageGroup3_UNCL | -0.02 | 0.03 | 0.56 | -0.05 | 0.04 | 0.25 | -0.11 | 0.04 | 0.02 |
| EthnicGroupAOEG | 0.00 | 0.02 | 0.87 | -0.01 | 0.02 | 0.62 | 0.02 | 0.02 | 0.41 |
| EthnicGroupASIA | -0.05 | 0.01 | <0.01 | -0.08 | 0.01 | <0.01 | -0.05 | 0.01 | <0.01 |
| EthnicGroupBLAC | -0.10 | 0.01 | <0.01 | -0.07 | 0.01 | <0.01 | -0.08 | 0.01 | <0.01 |
| EthnicGroupCHIN | 0.15 | 0.03 | <0.01 | 0.14 | 0.03 | <0.01 | 0.08 | 0.03 | 0.02 |
| EthnicGroupMIXD | -0.03 | 0.01 | <0.01 | -0.02 | 0.01 | 0.19 | -0.02 | 0.01 | 0.17 |
| EthnicGroupUNCL | -0.05 | 0.02 | 0.01 | -0.03 | 0.02 | 0.18 | -0.08 | 0.02 | <0.01 |
| IDACIScore_quintlow | 0.02 | 0.01 | <0.01 | 0.03 | 0.01 | <0.01 | 0.02 | 0.01 | 0.04 |
| IDACIScore_quintmedium | 0.02 | 0.01 | 0.04 | 0.02 | 0.01 | 0.03 | 0.01 | 0.01 | 0.34 |
| IDACIScore_quintMissing | -0.02 | 0.05 | 0.64 | -0.01 | 0.06 | 0.91 | 0.02 | 0.06 | 0.76 |
| IDACIScore_quintvery high | -0.02 | 0.01 | 0.01 | -0.03 | 0.01 | <0.01 | -0.02 | 0.01 | 0.01 |
| IDACIScore_quintvery low | 0.03 | 0.01 | <0.01 | 0.06 | 0.01 | <0.01 | 0.03 | 0.01 | <0.01 |
| FSMeligible1 | -0.04 | 0.01 | <0.01 | -0.02 | 0.01 | 0.09 | -0.07 | 0.01 | <0.01 |
| SubjectCohortSize_groupsmall | 0.06 | 0.01 | <0.01 | 0.02 | 0.01 | <0.01 | 0.02 | 0.01 | 0.01 |
| SubjectCohortSize_grouplarge | -0.02 | 0.00 | <0.01 | 0.03 | 0.00 | <0.01 | 0.02 | 0.00 | <0.01 |
| CentreTypeCollege | -0.43 | 0.03 | <0.01 | -0.46 | 0.03 | <0.01 | -0.35 | 0.03 | <0.01 |
| CentreTypeGrammar | -0.08 | 0.03 | <0.01 | -0.07 | 0.04 | 0.05 | -0.07 | 0.04 | 0.05 |
| CentreTypeIndependent | 0.23 | 0.02 | <0.01 | 0.16 | 0.02 | <0.01 | 0.15 | 0.02 | <0.01 |
| CentreTypeSixth Form | -0.15 | 0.02 | <0.01 | -0.10 | 0.03 | <0.01 | -0.10 | 0.03 | <0.01 |
| propSEN_school_grouphigh | 0.02 | 0.01 | 0.18 | 0.01 | 0.01 | 0.41 | 0.00 | 0.01 | 0.91 |
| propSEN_school_grouplow | 0.01 | 0.01 | 0.73 | -0.04 | 0.02 | 0.01 | -0.05 | 0.02 | <0.01 |
| meanIDACI_quinthigh | -0.03 | 0.02 | 0.09 | -0.06 | 0.02 | 0.01 | -0.08 | 0.02 | <0.01 |
| meanIDACI_quintlow | -0.01 | 0.02 | 0.52 | -0.04 | 0.02 | 0.03 | -0.03 | 0.02 | 0.11 |
| meanIDACI_quintMissing | 0.51 | 0.20 | 0.01 | -0.57 | 0.23 | 0.01 | 0.06 | 0.26 | 0.81 |
| meanIDACI_quintvery high | 0.04 | 0.02 | 0.04 | -0.06 | 0.02 | 0.02 | -0.04 | 0.02 | 0.07 |
| meanIDACI_quintvery low | -0.03 | 0.02 | 0.06 | -0.03 | 0.02 | 0.23 | -0.02 | 0.02 | 0.40 |
| propEAL_school_grouphigh | 0.02 | 0.01 | 0.18 | 0.01 | 0.02 | 0.76 | 0.00 | 0.02 | 0.91 |
| propEAL_school_grouplow | 0.03 | 0.01 | 0.02 | 0.01 | 0.02 | 0.55 | -0.03 | 0.02 | 0.08 |
| meanprior_school_grouphigh | -0.04 | 0.01 | <0.01 | 0.10 | 0.02 | <0.01 | 0.10 | 0.02 | <0.01 |
| meanprior_school_grouplow | 0.00 | 0.01 | 0.93 | -0.14 | 0.02 | <0.01 | -0.11 | 0.02 | <0.01 |
| meanprior_school_groupMissing | 0.04 | 0.07 | 0.57 | -0.22 | 0.07 | <0.01 | -0.21 | 0.08 | 0.01 |
| RegionEast Midlands | -0.07 | 0.02 | <0.01 | -0.09 | 0.03 | <0.01 | -0.05 | 0.03 | 0.05 |
| RegionEast of England | -0.04 | 0.02 | 0.03 | -0.06 | 0.03 | 0.01 | -0.06 | 0.03 | 0.02 |
| RegionMissing | -0.05 | 0.04 | 0.15 | -0.14 | 0.05 | <0.01 | -0.11 | 0.05 | 0.02 |
| RegionNorth East | -0.01 | 0.03 | 0.81 | -0.04 | 0.04 | 0.33 | -0.07 | 0.04 | 0.07 |
| RegionNorth West | -0.03 | 0.02 | 0.20 | -0.08 | 0.03 | <0.01 | -0.09 | 0.03 | <0.01 |
| RegionSouth East | -0.02 | 0.02 | 0.23 | -0.03 | 0.02 | 0.20 | -0.05 | 0.02 | 0.04 |
| RegionSouth West | -0.02 | 0.02 | 0.29 | -0.03 | 0.03 | 0.21 | -0.05 | 0.03 | 0.07 |
| RegionWest Midlands | -0.06 | 0.02 | <0.01 | -0.09 | 0.02 | <0.01 | -0.10 | 0.02 | <0.01 |
| RegionYorkshire and the Humber | -0.06 | 0.02 | 0.01 | -0.09 | 0.03 | <0.01 | -0.06 | 0.03 | 0.02 |
| MeanGradePrevious_grouphigh | 0.11 | 0.01 | <0.01 | 0.13 | 0.01 | <0.01 | 0.12 | 0.01 | <0.01 |
| MeanGradePrevious_grouplow | -0.10 | 0.01 | <0.01 | -0.10 | 0.01 | <0.01 | -0.11 | 0.01 | <0.01 |
| MeanGradePrevious_groupMissing | -0.01 | 0.05 | 0.85 | 0.09 | 0.06 | 0.16 | 0.02 | 0.08 | 0.80 |
| MeanVAPrevious_grouphigh | 0.11 | 0.01 | <0.01 | 0.11 | 0.01 | <0.01 | 0.09 | 0.01 | <0.01 |
| MeanVAPrevious_grouplow | -0.12 | 0.01 | <0.01 | -0.10 | 0.01 | <0.01 | -0.09 | 0.01 | <0.01 |
| MeanVAPrevious_groupMissing | 0.03 | 0.05 | 0.62 | -0.21 | 0.06 | <0.01 | -0.19 | 0.08 | 0.01 |
| MeanGradePrevious_grouphigh:MeanVAPrevious_grouphigh | 0.06 | 0.01 | <0.01 | 0.02 | 0.01 | 0.03 | 0.04 | 0.01 | <0.01 |
| MeanGradePrevious_grouplow:MeanVAPrevious_grouphigh | -0.03 | 0.01 | <0.01 | -0.01 | 0.01 | 0.22 | 0.00 | 0.01 | 0.70 |
| MeanGradePrevious_grouphigh:MeanVAPrevious_grouplow | 0.02 | 0.01 | <0.01 | 0.00 | 0.01 | 0.70 | <0.01 | 0.01 | 0.99 |
| MeanGradePrevious_grouplow:MeanVAPrevious_grouplow | 0.00 | 0.01 | 0.81 | -0.08 | 0.01 | <0.01 | -0.09 | 0.01 | <0.01 |
| MeanGradePrevious_grouphigh:MeanVAPrevious_groupMissing | -0.09 | 0.05 | 0.08 | 0.20 | 0.07 | <0.01 | 0.21 | 0.08 | 0.01 |
| MeanGradePrevious_grouplow:MeanVAPrevious_groupMissing | 0.04 | 0.06 | 0.52 | 0.02 | 0.08 | 0.79 | 0.10 | 0.09 | 0.28 |
Appendix F – Full GCSE model output
Table F1. Model output for Core GCSE model 4
| Variable | 2020 Coef | 2020 SE | 2020 p value | 2019 Coef | 2019 SE | 2019 p value | 2018 Coef | 2018 SE | 2018 p value |
|---|---|---|---|---|---|---|---|---|---|
| (Intercept) | 5.77 | 0.03 | <0.01 | 5.30 | 0.03 | <0.01 | 5.31 | 0.03 | <0.01 |
| MissingNPD | 0.24 | 0.08 | <0.01 | -0.14 | 0.08 | 0.07 | 0.03 | 0.08 | 0.73 |
| Prior_Score | 1.40 | 0.04 | <0.01 | 1.33 | 0.04 | <0.01 | 1.31 | 0.04 | <0.01 |
| Prior_quinthigh | -0.01 | 0.01 | 0.39 | 0.01 | 0.02 | 0.60 | 0.02 | 0.02 | 0.12 |
| Prior_quintlow | -0.10 | 0.02 | <0.01 | -0.06 | 0.02 | 0.02 | -0.07 | 0.03 | 0.01 |
| Prior_quintvery high | 0.39 | 0.02 | <0.01 | 0.39 | 0.02 | <0.01 | 0.41 | 0.02 | <0.01 |
| Prior_quintvery low | -0.45 | 0.02 | <0.01 | -0.44 | 0.02 | <0.01 | -0.45 | 0.02 | <0.01 |
| GenderM | -0.51 | 0.01 | <0.01 | -0.49 | 0.01 | <0.01 | -0.48 | 0.01 | <0.01 |
| DOB_quarter2 | -0.02 | 0.01 | <0.01 | -0.03 | 0.01 | <0.01 | -0.02 | 0.01 | <0.01 |
| DOB_quarter3 | -0.06 | 0.01 | <0.01 | -0.07 | 0.01 | <0.01 | -0.08 | 0.01 | <0.01 |
| DOB_quarter4 | -0.07 | 0.01 | <0.01 | -0.12 | 0.01 | <0.01 | -0.11 | 0.01 | <0.01 |
| SEN_1 | -0.39 | 0.01 | <0.01 | -0.33 | 0.01 | <0.01 | -0.34 | 0.01 | <0.01 |
| LanguageGroup2_OTH | 0.29 | 0.01 | <0.01 | 0.32 | 0.01 | <0.01 | 0.34 | 0.01 | <0.01 |
| LanguageGroup3_UNCL | -0.01 | 0.06 | 0.89 | 0.02 | 0.06 | 0.70 | 0.06 | 0.07 | 0.36 |
| EthnicGroupAOEG | 0.32 | 0.02 | <0.01 | 0.32 | 0.02 | <0.01 | 0.35 | 0.02 | <0.01 |
| EthnicGroupASIA | 0.31 | 0.01 | <0.01 | 0.35 | 0.01 | <0.01 | 0.33 | 0.01 | <0.01 |
| EthnicGroupBLAC | 0.15 | 0.01 | <0.01 | 0.20 | 0.01 | <0.01 | 0.18 | 0.01 | <0.01 |
| EthnicGroupCHIN | 0.61 | 0.04 | <0.01 | 0.58 | 0.04 | <0.01 | 0.60 | 0.04 | <0.01 |
| EthnicGroupMIXD | 0.08 | 0.01 | <0.01 | 0.13 | 0.01 | <0.01 | 0.09 | 0.01 | <0.01 |
| EthnicGroupUNCL | -0.01 | 0.02 | 0.79 | 0.00 | 0.02 | 0.94 | 0.02 | 0.03 | 0.39 |
| IDACIScore_quinthigh | -0.10 | 0.01 | <0.01 | -0.12 | 0.01 | <0.01 | -0.13 | 0.01 | <0.01 |
| IDACIScore_quintlow | 0.12 | 0.01 | <0.01 | 0.12 | 0.01 | <0.01 | 0.12 | 0.01 | <0.01 |
| IDACIScore_quintMissing | -0.19 | 0.07 | 0.01 | -0.11 | 0.07 | 0.12 | -0.20 | 0.07 | <0.01 |
| IDACIScore_quintvery high | -0.18 | 0.01 | <0.01 | -0.22 | 0.01 | <0.01 | -0.23 | 0.01 | <0.01 |
| IDACIScore_quintvery low | 0.21 | 0.01 | <0.01 | 0.24 | 0.01 | <0.01 | 0.25 | 0.01 | <0.01 |
| FSMeligible1 | -0.39 | 0.01 | <0.01 | -0.34 | 0.01 | <0.01 | -0.34 | 0.01 | <0.01 |
| SubjectCohortSize_groupsmall | 0.09 | 0.01 | <0.01 | 0.07 | 0.01 | <0.01 | 0.07 | 0.01 | <0.01 |
| SubjectCohortSize_grouplarge | -0.05 | 0.01 | <0.01 | -0.05 | 0.01 | <0.01 | -0.09 | 0.01 | <0.01 |
| CentreTypeCollege | -0.33 | 0.08 | <0.01 | -0.54 | 0.09 | <0.01 | -0.76 | 0.09 | <0.01 |
| CentreTypeGrammar | 0.24 | 0.03 | <0.01 | 0.27 | 0.04 | <0.01 | 0.26 | 0.04 | <0.01 |
| CentreTypeIndependent | 0.55 | 0.02 | <0.01 | 0.49 | 0.02 | <0.01 | 0.53 | 0.03 | <0.01 |
| CentreTypeSixth Form | -0.27 | 0.18 | 0.14 | -0.41 | 0.21 | 0.05 | -0.35 | 0.20 | 0.08 |
| propSEN_school_grouphigh | 0.02 | 0.01 | 0.04 | 0.00 | 0.01 | 0.90 | 0.02 | 0.01 | 0.13 |
| propSEN_school_grouplow | -0.01 | 0.01 | 0.40 | 0.00 | 0.01 | 0.74 | 0.03 | 0.01 | 0.07 |
| meanIDACI_quinthigh | -0.02 | 0.02 | 0.29 | -0.01 | 0.02 | 0.51 | -0.06 | 0.02 | <0.01 |
| meanIDACI_quintlow | 0.02 | 0.02 | 0.29 | 0.01 | 0.02 | 0.72 | 0.04 | 0.02 | 0.04 |
| meanIDACI_quintMissing | 0.62 | 1.39 | 0.66 | 0.97 | 1.07 | 0.36 | NA | NA | NA |
| meanIDACI_quintvery high | 0.03 | 0.02 | 0.10 | 0.01 | 0.02 | 0.65 | -0.07 | 0.02 | <0.01 |
| meanIDACI_quintvery low | 0.01 | 0.02 | 0.67 | 0.03 | 0.02 | 0.14 | 0.08 | 0.02 | <0.01 |
| propEAL_school_grouphigh | 0.01 | 0.01 | 0.51 | -0.01 | 0.01 | 0.37 | 0.03 | 0.02 | 0.12 |
| propEAL_school_grouplow | -0.03 | 0.01 | 0.01 | -0.04 | 0.01 | 0.01 | -0.05 | 0.02 | <0.01 |
| meanprior_school_grouphigh | 0.11 | 0.01 | <0.01 | 0.15 | 0.01 | <0.01 | 0.19 | 0.02 | <0.01 |
| meanprior_school_grouplow | -0.07 | 0.01 | <0.01 | -0.12 | 0.02 | <0.01 | -0.12 | 0.02 | <0.01 |
| RegionEast Midlands | -0.14 | 0.02 | <0.01 | -0.13 | 0.02 | <0.01 | -0.19 | 0.03 | <0.01 |
| RegionEast of England | -0.13 | 0.02 | <0.01 | -0.14 | 0.02 | <0.01 | -0.15 | 0.03 | <0.01 |
| RegionMissing | -0.01 | 0.04 | 0.87 | -0.09 | 0.04 | 0.03 | -0.11 | 0.05 | 0.03 |
| RegionNorth East | -0.10 | 0.03 | <0.01 | -0.13 | 0.03 | <0.01 | -0.15 | 0.03 | <0.01 |
| RegionNorth West | -0.13 | 0.02 | <0.01 | -0.16 | 0.02 | <0.01 | -0.20 | 0.02 | <0.01 |
| RegionSouth East | -0.16 | 0.02 | <0.01 | -0.17 | 0.02 | <0.01 | -0.19 | 0.02 | <0.01 |
| RegionSouth West | -0.09 | 0.02 | <0.01 | -0.11 | 0.02 | <0.01 | -0.16 | 0.03 | <0.01 |
| RegionWest Midlands | -0.13 | 0.02 | <0.01 | -0.13 | 0.02 | <0.01 | -0.18 | 0.02 | <0.01 |
| RegionYorkshire and the Humber | -0.09 | 0.02 | <0.01 | -0.09 | 0.02 | <0.01 | -0.13 | 0.03 | <0.01 |
| MeanGradePrevious_grouphigh | 0.26 | 0.01 | <0.01 | 0.28 | 0.01 | <0.01 | 0.22 | 0.01 | <0.01 |
| MeanGradePrevious_grouplow | -0.16 | 0.01 | <0.01 | -0.13 | 0.01 | <0.01 | -0.07 | 0.01 | <0.01 |
| MeanGradePrevious_groupMissing | -0.63 | 0.21 | <0.01 | -0.19 | 0.12 | 0.13 | 0.03 | 0.24 | 0.91 |
| MeanVAPrevious_grouphigh | 0.24 | 0.01 | <0.01 | 0.25 | 0.01 | <0.01 | 0.24 | 0.01 | <0.01 |
| MeanVAPrevious_grouplow | -0.20 | 0.01 | <0.01 | -0.23 | 0.01 | <0.01 | -0.17 | 0.01 | <0.01 |
| MeanVAPrevious_groupMissing | 0.53 | 0.21 | 0.01 | 0.02 | 0.12 | 0.89 | 0.03 | 0.24 | 0.92 |
| Prior_Score:Prior_quinthigh | -0.04 | 0.05 | 0.43 | 0.09 | 0.05 | 0.07 | 0.06 | 0.05 | 0.24 |
| Prior_Score:Prior_quintlow | -0.23 | 0.05 | <0.01 | -0.15 | 0.05 | <0.01 | -0.14 | 0.05 | 0.01 |
| Prior_Score:Prior_quintvery high | -0.50 | 0.04 | <0.01 | -0.36 | 0.04 | <0.01 | -0.36 | 0.04 | <0.01 |
| Prior_Score:Prior_quintvery low | -0.57 | 0.04 | <0.01 | -0.50 | 0.04 | <0.01 | -0.49 | 0.04 | <0.01 |
| MeanGradePrevious_grouphigh:MeanVAPrevious_grouphigh | 0.04 | 0.01 | <0.01 | 0.04 | 0.01 | <0.01 | -0.01 | 0.01 | 0.63 |
| MeanGradePrevious_grouplow:MeanVAPrevious_grouphigh | -0.04 | 0.01 | <0.01 | -0.01 | 0.01 | 0.48 | -0.04 | 0.01 | <0.01 |
| MeanGradePrevious_grouphigh:MeanVAPrevious_grouplow | -0.05 | 0.01 | <0.01 | -0.06 | 0.02 | <0.01 | -0.05 | 0.02 | <0.01 |
| MeanGradePrevious_grouplow:MeanVAPrevious_grouplow | -0.10 | 0.01 | <0.01 | -0.11 | 0.01 | <0.01 | -0.11 | 0.01 | <0.01 |
| MeanGradePrevious_grouphigh:MeanVAPrevious_groupMissing | -0.78 | 0.22 | <0.01 | -0.28 | 0.14 | 0.04 | 0.01 | 0.25 | 0.98 |
| MeanGradePrevious_grouplow:MeanVAPrevious_groupMissing | -0.89 | 0.25 | <0.01 | -0.17 | 0.20 | 0.39 | 0.16 | 0.26 | 0.54 |
Table F2. Model output for Binomial GCSE model 4 for grade 7 and above.
| Variable | 2020 Coef | 2020 SE | 2020 p value | 2019 Coef | 2019 SE | 2019 p value | 2018 Coef | 2018 SE | 2018 p value |
|---|---|---|---|---|---|---|---|---|---|
| (Intercept) | -1.15 | 0.05 | <0.01 | -1.78 | 0.05 | <0.01 | -1.74 | 0.05 | <0.01 |
| MissingNPD | 0.06 | 0.17 | 0.73 | 0.03 | 0.18 | 0.86 | 0.23 | 0.18 | 0.20 |
| Prior_Score | 1.92 | 0.08 | <0.01 | 1.77 | 0.08 | <0.01 | 1.62 | 0.08 | <0.01 |
| Prior_quinthigh | 0.01 | 0.03 | 0.82 | 0.03 | 0.03 | 0.33 | 0.03 | 0.03 | 0.33 |
| Prior_quintlow | -0.12 | 0.06 | 0.05 | -0.04 | 0.07 | 0.54 | -0.02 | 0.07 | 0.83 |
| Prior_quintvery high | 0.37 | 0.03 | <0.01 | 0.37 | 0.03 | <0.01 | 0.43 | 0.03 | <0.01 |
| Prior_quintvery low | -0.39 | 0.11 | <0.01 | -0.53 | 0.12 | <0.01 | -0.45 | 0.12 | <0.01 |
| GenderM | -0.72 | 0.01 | <0.01 | -0.59 | 0.01 | <0.01 | -0.56 | 0.01 | <0.01 |
| DOB_quarter2 | -0.05 | 0.01 | <0.01 | -0.03 | 0.01 | 0.06 | -0.03 | 0.02 | 0.07 |
| DOB_quarter3 | -0.08 | 0.01 | <0.01 | -0.10 | 0.02 | <0.01 | -0.10 | 0.02 | <0.01 |
| DOB_quarter4 | -0.10 | 0.01 | <0.01 | -0.15 | 0.01 | <0.01 | -0.15 | 0.02 | <0.01 |
| SEN_1 | -0.39 | 0.02 | <0.01 | -0.26 | 0.02 | <0.01 | -0.26 | 0.03 | <0.01 |
| LanguageGroup2_OTH | 0.40 | 0.02 | <0.01 | 0.39 | 0.02 | <0.01 | 0.44 | 0.02 | <0.01 |
| LanguageGroup3_UNCL | 0.02 | 0.13 | 0.90 | 0.07 | 0.12 | 0.56 | 0.08 | 0.15 | 0.57 |
| EthnicGroupAOEG | 0.42 | 0.04 | <0.01 | 0.41 | 0.04 | <0.01 | 0.44 | 0.05 | <0.01 |
| EthnicGroupASIA | 0.42 | 0.02 | <0.01 | 0.47 | 0.02 | <0.01 | 0.40 | 0.02 | <0.01 |
| EthnicGroupBLAC | 0.12 | 0.03 | <0.01 | 0.23 | 0.03 | <0.01 | 0.17 | 0.03 | <0.01 |
| EthnicGroupCHIN | 0.91 | 0.08 | <0.01 | 0.75 | 0.08 | <0.01 | 0.80 | 0.08 | <0.01 |
| EthnicGroupMIXD | 0.10 | 0.02 | <0.01 | 0.21 | 0.02 | <0.01 | 0.15 | 0.03 | <0.01 |
| EthnicGroupUNCL | -0.02 | 0.05 | 0.76 | 0.06 | 0.05 | 0.22 | 0.05 | 0.06 | 0.39 |
| IDACIScore_quinthigh | -0.14 | 0.02 | <0.01 | -0.17 | 0.02 | <0.01 | -0.15 | 0.02 | <0.01 |
| IDACIScore_quintlow | 0.15 | 0.02 | <0.01 | 0.13 | 0.02 | <0.01 | 0.14 | 0.02 | <0.01 |
| IDACIScore_quintMissing | 0.11 | 0.16 | 0.48 | -0.11 | 0.17 | 0.52 | -0.12 | 0.17 | 0.47 |
| IDACIScore_quintvery high | -0.24 | 0.02 | <0.01 | -0.27 | 0.02 | <0.01 | -0.26 | 0.02 | <0.01 |
| IDACIScore_quintvery low | 0.25 | 0.02 | <0.01 | 0.28 | 0.02 | <0.01 | 0.28 | 0.02 | <0.01 |
| FSMeligible1 | -0.46 | 0.02 | <0.01 | -0.36 | 0.02 | <0.01 | -0.34 | 0.02 | <0.01 |
| SubjectCohortSize_groupsmall | 0.15 | 0.02 | <0.01 | 0.08 | 0.03 | <0.01 | 0.12 | 0.03 | <0.01 |
| SubjectCohortSize_grouplarge | -0.08 | 0.02 | <0.01 | -0.07 | 0.02 | <0.01 | -0.11 | 0.02 | <0.01 |
| CentreTypeCollege | -0.58 | 0.19 | <0.01 | -0.29 | 0.21 | 0.18 | -0.56 | 0.23 | 0.01 |
| CentreTypeGrammar | 0.32 | 0.06 | <0.01 | 0.31 | 0.06 | <0.01 | 0.26 | 0.06 | <0.01 |
| CentreTypeIndependent | 0.74 | 0.04 | <0.01 | 0.50 | 0.04 | <0.01 | 0.51 | 0.04 | <0.01 |
| CentreTypeSixth Form | -0.21 | 0.35 | 0.56 | -0.32 | 0.41 | 0.44 | -0.14 | 0.36 | 0.71 |
| propSEN_school_grouphigh | 0.01 | 0.02 | 0.71 | 0.00 | 0.02 | 0.94 | 0.03 | 0.02 | 0.26 |
| propSEN_school_grouplow | 0.01 | 0.02 | 0.83 | 0.05 | 0.02 | 0.03 | 0.04 | 0.02 | 0.13 |
| meanIDACI_quinthigh | -0.04 | 0.03 | 0.24 | -0.02 | 0.03 | 0.51 | -0.10 | 0.03 | <0.01 |
| meanIDACI_quintlow | 0.00 | 0.03 | 0.95 | 0.00 | 0.03 | 0.96 | 0.06 | 0.03 | 0.08 |
| meanIDACI_quintMissing | 10.02 | 196.97 | 0.96 | -9.23 | 137.59 | 0.95 | NA | NA | NA |
| meanIDACI_quintvery high | 0.08 | 0.03 | 0.02 | 0.06 | 0.04 | 0.11 | -0.08 | 0.04 | 0.03 |
| meanIDACI_quintvery low | 0.01 | 0.03 | 0.84 | 0.02 | 0.03 | 0.45 | 0.12 | 0.03 | <0.01 |
| propEAL_school_grouphigh | 0.06 | 0.02 | 0.01 | 0.01 | 0.03 | 0.81 | 0.05 | 0.03 | 0.06 |
| propEAL_school_grouplow | -0.05 | 0.02 | 0.04 | -0.05 | 0.02 | 0.04 | -0.08 | 0.02 | <0.01 |
| meanprior_school_grouphigh | 0.12 | 0.02 | <0.01 | 0.20 | 0.02 | <0.01 | 0.22 | 0.02 | <0.01 |
| meanprior_school_grouplow | -0.07 | 0.03 | 0.01 | -0.17 | 0.03 | <0.01 | -0.11 | 0.03 | <0.01 |
| RegionEast Midlands | -0.26 | 0.04 | <0.01 | -0.20 | 0.04 | <0.01 | -0.28 | 0.04 | <0.01 |
| RegionEast of England | -0.22 | 0.04 | <0.01 | -0.20 | 0.04 | <0.01 | -0.20 | 0.04 | <0.01 |
| RegionMissing | -0.01 | 0.07 | 0.90 | -0.12 | 0.08 | 0.12 | -0.04 | 0.09 | 0.69 |
| RegionNorth East | -0.19 | 0.05 | <0.01 | -0.22 | 0.05 | <0.01 | -0.23 | 0.06 | <0.01 |
| RegionNorth West | -0.22 | 0.04 | <0.01 | -0.22 | 0.04 | <0.01 | -0.25 | 0.04 | <0.01 |
| RegionSouth East | -0.24 | 0.04 | <0.01 | -0.20 | 0.04 | <0.01 | -0.24 | 0.04 | <0.01 |
| RegionSouth West | -0.14 | 0.04 | <0.01 | -0.16 | 0.04 | <0.01 | -0.20 | 0.04 | <0.01 |
| RegionWest Midlands | -0.23 | 0.04 | <0.01 | -0.18 | 0.04 | <0.01 | -0.24 | 0.04 | <0.01 |
| RegionYorkshire and the Humber | -0.14 | 0.04 | <0.01 | -0.13 | 0.04 | <0.01 | -0.21 | 0.04 | <0.01 |
| MeanGradePrevious_grouphigh | 0.40 | 0.02 | <0.01 | 0.32 | 0.02 | <0.01 | 0.31 | 0.02 | <0.01 |
| MeanGradePrevious_grouplow | -0.19 | 0.02 | <0.01 | -0.18 | 0.02 | <0.01 | -0.13 | 0.02 | <0.01 |
| MeanGradePrevious_groupMissing | -1.13 | 0.49 | 0.02 | 0.02 | 0.29 | 0.95 | 0.61 | 0.54 | 0.26 |
| MeanVAPrevious_grouphigh | 0.37 | 0.02 | <0.01 | 0.34 | 0.02 | <0.01 | 0.31 | 0.02 | <0.01 |
| MeanVAPrevious_grouplow | -0.29 | 0.02 | <0.01 | -0.33 | 0.02 | <0.01 | -0.25 | 0.02 | <0.01 |
| MeanVAPrevious_groupMissing | 1.03 | 0.49 | 0.04 | -0.14 | 0.29 | 0.63 | -0.42 | 0.54 | 0.44 |
| Prior_Score:Prior_quinthigh | -0.04 | 0.09 | 0.63 | -0.04 | 0.10 | 0.65 | 0.10 | 0.10 | 0.32 |
| Prior_Score:Prior_quintlow | -0.27 | 0.12 | 0.02 | -0.20 | 0.13 | 0.13 | 0.02 | 0.13 | 0.90 |
| Prior_Score:Prior_quintvery high | -0.49 | 0.08 | <0.01 | -0.45 | 0.08 | <0.01 | -0.35 | 0.08 | <0.01 |
| Prior_Score:Prior_quintvery low | -0.55 | 0.11 | <0.01 | -0.59 | 0.12 | <0.01 | -0.38 | 0.12 | <0.01 |
| MeanGradePrevious_grouphigh:MeanVAPrevious_grouphigh | 0.04 | 0.03 | 0.10 | 0.08 | 0.03 | <0.01 | 0.00 | 0.03 | 0.88 |
| MeanGradePrevious_grouplow:MeanVAPrevious_grouphigh | -0.12 | 0.03 | <0.01 | 0.02 | 0.04 | 0.66 | -0.08 | 0.04 | 0.03 |
| MeanGradePrevious_grouphigh:MeanVAPrevious_grouplow | -0.09 | 0.03 | 0.01 | -0.04 | 0.03 | 0.24 | -0.02 | 0.03 | 0.61 |
| MeanGradePrevious_grouplow:MeanVAPrevious_grouplow | -0.06 | 0.03 | 0.03 | -0.04 | 0.03 | 0.25 | -0.06 | 0.03 | 0.05 |
| MeanGradePrevious_grouphigh:MeanVAPrevious_groupMissing | -1.24 | 0.52 | 0.02 | 0.03 | 0.32 | 0.92 | 0.49 | 0.56 | 0.38 |
| MeanGradePrevious_grouplow:MeanVAPrevious_groupMissing | -1.43 | 0.63 | 0.02 | 0.11 | 0.48 | 0.81 | 1.24 | 0.61 | 0.04 |
Table F3. Model output for Binomial GCSE model 4 for C and above.
| Variable | 2020 Coef | 2020 SE | 2020 p value | 2019 Coef | 2019 SE | 2019 p value | 2018 Coef | 2018 SE | 2018 p value |
|---|---|---|---|---|---|---|---|---|---|
| (Intercept) | 3.38 | 0.06 | <0.01 | 2.42 | 0.05 | <0.01 | 2.41 | 0.05 | <0.01 |
| MissingNPD | 0.38 | 0.19 | 0.05 | -0.57 | 0.15 | <0.01 | -0.39 | 0.14 | 0.01 |
| Prior_Score | 1.69 | 0.08 | <0.01 | 1.60 | 0.07 | <0.01 | 1.59 | 0.07 | <0.01 |
| Prior_quinthigh | -0.03 | 0.04 | 0.52 | -0.03 | 0.03 | 0.30 | 0.06 | 0.03 | 0.06 |
| Prior_quintlow | -0.04 | 0.05 | 0.38 | -0.03 | 0.04 | 0.49 | -0.02 | 0.04 | 0.69 |
| Prior_quintvery high | 0.28 | 0.08 | <0.01 | 0.21 | 0.06 | <0.01 | 0.29 | 0.06 | <0.01 |
| Prior_quintvery low | -0.20 | 0.04 | <0.01 | -0.29 | 0.04 | <0.01 | -0.26 | 0.04 | <0.01 |
| GenderM | -0.75 | 0.01 | <0.01 | -0.70 | 0.01 | <0.01 | -0.69 | 0.01 | <0.01 |
| DOB_quarter2 | 0.00 | 0.02 | 0.88 | -0.04 | 0.01 | <0.01 | -0.02 | 0.01 | 0.14 |
| DOB_quarter3 | -0.05 | 0.02 | <0.01 | -0.11 | 0.01 | <0.01 | -0.10 | 0.01 | <0.01 |
| DOB_quarter4 | -0.09 | 0.02 | <0.01 | -0.15 | 0.01 | <0.01 | -0.14 | 0.01 | <0.01 |
| SEN_1 | -0.68 | 0.02 | <0.01 | -0.53 | 0.02 | <0.01 | -0.55 | 0.02 | <0.01 |
| LanguageGroup2_OTH | 0.41 | 0.02 | <0.01 | 0.44 | 0.02 | <0.01 | 0.47 | 0.02 | <0.01 |
| LanguageGroup3_UNCL | 0.12 | 0.14 | 0.40 | -0.01 | 0.12 | 0.93 | -0.04 | 0.13 | 0.78 |
| EthnicGroupAOEG | 0.48 | 0.05 | <0.01 | 0.39 | 0.05 | <0.01 | 0.47 | 0.05 | <0.01 |
| EthnicGroupASIA | 0.44 | 0.03 | <0.01 | 0.45 | 0.02 | <0.01 | 0.42 | 0.02 | <0.01 |
| EthnicGroupBLAC | 0.28 | 0.03 | <0.01 | 0.27 | 0.03 | <0.01 | 0.27 | 0.03 | <0.01 |
| EthnicGroupCHIN | 1.07 | 0.15 | <0.01 | 0.96 | 0.13 | <0.01 | 0.93 | 0.12 | <0.01 |
| EthnicGroupMIXD | 0.08 | 0.03 | <0.01 | 0.14 | 0.02 | <0.01 | 0.12 | 0.02 | <0.01 |
| EthnicGroupUNCL | -0.09 | 0.05 | 0.06 | -0.06 | 0.05 | 0.22 | 0.01 | 0.05 | 0.78 |
| IDACIScore_quinthigh | -0.16 | 0.02 | <0.01 | -0.15 | 0.02 | <0.01 | -0.19 | 0.02 | <0.01 |
| IDACIScore_quintlow | 0.19 | 0.02 | <0.01 | 0.20 | 0.02 | <0.01 | 0.16 | 0.02 | <0.01 |
| IDACIScore_quintMissing | -0.51 | 0.16 | <0.01 | -0.20 | 0.13 | 0.14 | -0.29 | 0.13 | 0.02 |
| IDACIScore_quintvery high | -0.28 | 0.02 | <0.01 | -0.28 | 0.02 | <0.01 | -0.33 | 0.02 | <0.01 |
| IDACIScore_quintvery low | 0.36 | 0.02 | <0.01 | 0.38 | 0.02 | <0.01 | 0.36 | 0.02 | <0.01 |
| FSMeligible1 | -0.61 | 0.02 | <0.01 | -0.48 | 0.02 | <0.01 | -0.51 | 0.02 | <0.01 |
| SubjectCohortSize_groupsmall | 0.20 | 0.03 | <0.01 | 0.10 | 0.03 | <0.01 | 0.10 | 0.03 | <0.01 |
| SubjectCohortSize_grouplarge | -0.15 | 0.02 | <0.01 | -0.15 | 0.02 | <0.01 | -0.19 | 0.02 | <0.01 |
| CentreTypeCollege | -0.43 | 0.16 | 0.01 | -0.72 | 0.16 | <0.01 | -1.01 | 0.16 | <0.01 |
| CentreTypeGrammar | 0.69 | 0.12 | <0.01 | 0.38 | 0.08 | <0.01 | 0.56 | 0.09 | <0.01 |
| CentreTypeIndependent | 0.81 | 0.07 | <0.01 | 0.77 | 0.05 | <0.01 | 0.83 | 0.06 | <0.01 |
| CentreTypeSixth Form | -0.50 | 0.37 | 0.18 | -0.51 | 0.33 | 0.13 | -0.32 | 0.35 | 0.36 |
| propSEN_school_grouphigh | 0.06 | 0.02 | 0.01 | 0.01 | 0.02 | 0.82 | 0.02 | 0.02 | 0.41 |
| propSEN_school_grouplow | -0.03 | 0.03 | 0.27 | -0.03 | 0.02 | 0.26 | 0.02 | 0.02 | 0.44 |
| meanIDACI_quinthigh | -0.03 | 0.03 | 0.31 | -0.03 | 0.03 | 0.32 | -0.06 | 0.03 | 0.08 |
| meanIDACI_quintlow | 0.00 | 0.04 | 0.91 | 0.00 | 0.03 | 0.92 | 0.03 | 0.04 | 0.41 |
| meanIDACI_quintMissing | 7.23 | 324.75 | 0.98 | 10.51 | 139.21 | 0.94 | NA | NA | NA |
| meanIDACI_quintvery high | 0.01 | 0.04 | 0.75 | 0.01 | 0.03 | 0.84 | -0.08 | 0.04 | 0.03 |
| meanIDACI_quintvery low | -0.05 | 0.04 | 0.12 | -0.01 | 0.03 | 0.75 | 0.08 | 0.03 | 0.02 |
| propEAL_school_grouphigh | -0.03 | 0.03 | 0.27 | -0.04 | 0.02 | 0.10 | 0.04 | 0.03 | 0.10 |
| propEAL_school_grouplow | -0.05 | 0.03 | 0.06 | -0.05 | 0.02 | 0.04 | -0.03 | 0.03 | 0.19 |
| meanprior_school_grouphigh | 0.13 | 0.03 | <0.01 | 0.13 | 0.02 | <0.01 | 0.20 | 0.03 | <0.01 |
| meanprior_school_grouplow | -0.06 | 0.03 | 0.03 | -0.13 | 0.02 | <0.01 | -0.14 | 0.03 | <0.01 |
| RegionEast Midlands | -0.09 | 0.05 | 0.04 | -0.11 | 0.04 | 0.01 | -0.19 | 0.05 | <0.01 |
| RegionEast of England | -0.10 | 0.04 | 0.02 | -0.12 | 0.04 | <0.01 | -0.15 | 0.04 | <0.01 |
| RegionMissing | 0.03 | 0.08 | 0.73 | -0.10 | 0.07 | 0.17 | -0.04 | 0.09 | 0.65 |
| RegionNorth East | -0.05 | 0.06 | 0.40 | -0.14 | 0.05 | 0.01 | -0.11 | 0.06 | 0.05 |
| RegionNorth West | -0.09 | 0.04 | 0.03 | -0.13 | 0.04 | <0.01 | -0.17 | 0.04 | <0.01 |
| RegionSouth East | -0.15 | 0.04 | <0.01 | -0.17 | 0.04 | <0.01 | -0.19 | 0.04 | <0.01 |
| RegionSouth West | -0.07 | 0.05 | 0.15 | -0.10 | 0.04 | 0.01 | -0.17 | 0.05 | <0.01 |
| RegionWest Midlands | -0.09 | 0.04 | 0.03 | -0.11 | 0.04 | <0.01 | -0.19 | 0.04 | <0.01 |
| RegionYorkshire and the Humber | -0.05 | 0.04 | 0.22 | -0.05 | 0.04 | 0.21 | -0.09 | 0.04 | 0.05 |
| MeanGradePrevious_grouphigh | 0.85 | 0.04 | <0.01 | 0.69 | 0.03 | <0.01 | 0.48 | 0.03 | <0.01 |
| MeanGradePrevious_grouplow | -0.33 | 0.02 | <0.01 | -0.25 | 0.02 | <0.01 | -0.17 | 0.02 | <0.01 |
| MeanGradePrevious_groupMissing | -0.02 | 0.57 | 0.97 | -0.66 | 0.30 | 0.03 | -0.39 | 0.66 | 0.55 |
| MeanVAPrevious_grouphigh | 0.36 | 0.02 | <0.01 | 0.34 | 0.02 | <0.01 | 0.32 | 0.02 | <0.01 |
| MeanVAPrevious_grouplow | -0.22 | 0.03 | <0.01 | -0.21 | 0.02 | <0.01 | -0.14 | 0.02 | <0.01 |
| MeanVAPrevious_groupMissing | -0.14 | 0.57 | 0.80 | 0.40 | 0.30 | 0.18 | 0.33 | 0.65 | 0.61 |
| Prior_Score:Prior_quinthigh | -0.18 | 0.12 | 0.15 | 0.17 | 0.10 | 0.08 | -0.05 | 0.10 | 0.62 |
| Prior_Score:Prior_quintlow | -0.09 | 0.10 | 0.36 | -0.01 | 0.09 | 0.88 | -0.01 | 0.09 | 0.92 |
| Prior_Score:Prior_quintvery high | -0.51 | 0.11 | <0.01 | -0.23 | 0.09 | 0.01 | -0.32 | 0.09 | <0.01 |
| Prior_Score:Prior_quintvery low | -0.25 | 0.09 | <0.01 | -0.28 | 0.07 | <0.01 | -0.23 | 0.07 | <0.01 |
| MeanGradePrevious_grouphigh:MeanVAPrevious_grouphigh | -0.19 | 0.05 | <0.01 | -0.15 | 0.04 | <0.01 | -0.07 | 0.04 | 0.06 |
| MeanGradePrevious_grouplow:MeanVAPrevious_grouphigh | -0.05 | 0.03 | 0.08 | -0.08 | 0.03 | <0.01 | -0.07 | 0.03 | 0.01 |
| MeanGradePrevious_grouphigh:MeanVAPrevious_grouplow | 0.17 | 0.07 | 0.02 | -0.13 | 0.05 | 0.01 | 0.01 | 0.05 | 0.80 |
| MeanGradePrevious_grouplow:MeanVAPrevious_grouplow | -0.13 | 0.03 | <0.01 | -0.15 | 0.03 | <0.01 | -0.14 | 0.03 | <0.01 |
| MeanGradePrevious_grouphigh:MeanVAPrevious_groupMissing | -0.73 | 0.60 | 0.23 | -1.28 | 0.33 | <0.01 | -0.80 | 0.68 | 0.24 |
| MeanGradePrevious_grouplow:MeanVAPrevious_groupMissing | -0.27 | 0.66 | 0.68 | -0.44 | 0.50 | 0.37 | -0.51 | 0.71 | 0.48 |
Table F4. Model output for GCSE quantile prior attainment model.
| Variable | 2020 Coef | 2020 SE | 2020 p value | 2019 Coef | 2019 SE | 2019 p value | 2018 Coef | 2018 SE | 2018 p value |
|---|---|---|---|---|---|---|---|---|---|
| (Intercept) | 5.64 | 0.03 | <0.01 | 5.22 | 0.03 | <0.01 | 5.19 | 0.04 | <0.01 |
| MissingNPD | -0.02 | 0.07 | 0.76 | -0.14 | 0.07 | 0.05 | -0.03 | 0.07 | 0.66 |
| Prior_quant1 | -1.67 | 0.01 | <0.01 | -1.65 | 0.01 | <0.01 | -1.65 | 0.01 | <0.01 |
| Prior_quant2 | -1.10 | 0.01 | <0.01 | -1.08 | 0.01 | <0.01 | -1.09 | 0.01 | <0.01 |
| Prior_quant3 | -0.72 | 0.01 | <0.01 | -0.71 | 0.01 | <0.01 | -0.70 | 0.01 | <0.01 |
| Prior_quant4 | -0.37 | 0.01 | <0.01 | -0.36 | 0.01 | <0.01 | -0.35 | 0.01 | <0.01 |
| Prior_quant6 | 0.37 | 0.01 | <0.01 | 0.38 | 0.01 | <0.01 | 0.38 | 0.01 | <0.01 |
| Prior_quant7 | 0.74 | 0.01 | <0.01 | 0.78 | 0.01 | <0.01 | 0.76 | 0.01 | <0.01 |
| Prior_quant8 | 1.22 | 0.01 | <0.01 | 1.27 | 0.01 | <0.01 | 1.26 | 0.01 | <0.01 |
| Prior_quant9 | 1.87 | 0.01 | <0.01 | 1.95 | 0.01 | <0.01 | 1.92 | 0.01 | <0.01 |
| Prior_quantMissing | -0.27 | 0.01 | <0.01 | -0.18 | 0.01 | <0.01 | -0.23 | 0.01 | <0.01 |
| GenderM | -0.50 | 0.01 | <0.01 | -0.48 | 0.01 | <0.01 | -0.46 | 0.01 | <0.01 |
| DOB_quarter2 | <0.01 | 0.01 | 0.98 | -0.01 | 0.01 | 0.05 | 0.00 | 0.01 | 0.67 |
| DOB_quarter3 | -0.01 | 0.01 | 0.13 | -0.04 | 0.01 | <0.01 | -0.03 | 0.01 | <0.01 |
| DOB_quarter4 | -0.02 | 0.01 | <0.01 | -0.04 | 0.01 | <0.01 | -0.03 | 0.01 | <0.01 |
| SEN_1 | -0.63 | 0.01 | <0.01 | -0.60 | 0.01 | <0.01 | -0.63 | 0.01 | <0.01 |
| LanguageGroup2_OTH | 0.11 | 0.01 | <0.01 | 0.13 | 0.01 | <0.01 | 0.16 | 0.01 | <0.01 |
| LanguageGroup3_UNCL | -0.16 | 0.06 | 0.01 | 0.04 | 0.06 | 0.48 | 0.12 | 0.07 | 0.08 |
| EthnicGroupAOEG | 0.19 | 0.02 | <0.01 | 0.26 | 0.02 | <0.01 | 0.22 | 0.02 | <0.01 |
| EthnicGroupASIA | 0.37 | 0.01 | <0.01 | 0.43 | 0.01 | <0.01 | 0.40 | 0.01 | <0.01 |
| EthnicGroupBLAC | 0.15 | 0.01 | <0.01 | 0.18 | 0.01 | <0.01 | 0.17 | 0.01 | <0.01 |
| EthnicGroupCHIN | 0.76 | 0.04 | <0.01 | 0.73 | 0.04 | <0.01 | 0.75 | 0.04 | <0.01 |
| EthnicGroupMIXD | 0.10 | 0.01 | <0.01 | 0.15 | 0.01 | <0.01 | 0.11 | 0.01 | <0.01 |
| EthnicGroupUNCL | -0.07 | 0.02 | <0.01 | -0.01 | 0.03 | 0.75 | -0.04 | 0.03 | 0.17 |
| IDACIScore_quintlow | -0.10 | 0.01 | <0.01 | -0.12 | 0.01 | <0.01 | -0.13 | 0.01 | <0.01 |
| IDACIScore_quintmedium | 0.11 | 0.01 | <0.01 | 0.13 | 0.01 | <0.01 | 0.12 | 0.01 | <0.01 |
| IDACIScore_quintMissing | 0.01 | 0.07 | 0.84 | -0.04 | 0.07 | 0.51 | -0.11 | 0.07 | 0.10 |
| IDACIScore_quintvery high | -0.18 | 0.01 | <0.01 | -0.22 | 0.01 | <0.01 | -0.22 | 0.01 | <0.01 |
| IDACIScore_quintvery low | 0.22 | 0.01 | <0.01 | 0.25 | 0.01 | <0.01 | 0.26 | 0.01 | <0.01 |
| FSMeligible1 | -0.41 | 0.01 | <0.01 | -0.36 | 0.01 | <0.01 | -0.37 | 0.01 | <0.01 |
| SubjectCohortSize_groupsmall | 0.08 | 0.01 | <0.01 | 0.09 | 0.01 | <0.01 | 0.08 | 0.01 | <0.01 |
| SubjectCohortSize_grouplarge | -0.05 | 0.01 | <0.01 | -0.07 | 0.01 | <0.01 | -0.12 | 0.01 | <0.01 |
| CentreTypeCollege | -0.20 | 0.09 | 0.03 | -0.44 | 0.10 | <0.01 | -0.58 | 0.11 | <0.01 |
| CentreTypeGrammar | 0.34 | 0.04 | <0.01 | 0.39 | 0.05 | <0.01 | 0.40 | 0.05 | <0.01 |
| CentreTypeIndependent | 1.06 | 0.02 | <0.01 | 0.91 | 0.03 | <0.01 | 0.99 | 0.03 | <0.01 |
| CentreTypeSixth Form | 0.30 | 0.20 | 0.13 | -0.06 | 0.23 | 0.80 | 0.06 | 0.22 | 0.80 |
| propSEN_school_grouphigh | 0.02 | 0.01 | 0.19 | 0.00 | 0.02 | 0.96 | 0.02 | 0.02 | 0.39 |
| propSEN_school_grouplow | -0.03 | 0.02 | 0.05 | -0.02 | 0.02 | 0.34 | <0.01 | 0.02 | 0.99 |
| meanIDACI_quinthigh | -0.06 | 0.02 | 0.01 | -0.09 | 0.02 | <0.01 | -0.09 | 0.03 | <0.01 |
| meanIDACI_quintlow | 0.03 | 0.02 | 0.14 | -0.02 | 0.02 | 0.32 | 0.06 | 0.02 | 0.01 |
| meanIDACI_quintMissing | -1.92 | 1.05 | 0.07 | -1.20 | 0.70 | 0.09 | -2.75 | 0.80 | <0.01 |
| meanIDACI_quintvery high | 0.00 | 0.02 | 0.93 | -0.05 | 0.03 | 0.05 | -0.07 | 0.03 | 0.01 |
| meanIDACI_quintvery low | -0.02 | 0.02 | 0.26 | -0.06 | 0.02 | 0.01 | 0.03 | 0.03 | 0.27 |
| propEAL_school_grouphigh | -0.02 | 0.02 | 0.33 | -0.05 | 0.02 | <0.01 | -0.01 | 0.02 | 0.74 |
| propEAL_school_grouplow | -0.09 | 0.02 | <0.01 | -0.08 | 0.02 | <0.01 | -0.08 | 0.02 | <0.01 |
| meanprior_school_grouphigh | 0.24 | 0.02 | <0.01 | 0.30 | 0.02 | <0.01 | 0.35 | 0.02 | <0.01 |
| meanprior_school_grouplow | -0.15 | 0.02 | <0.01 | -0.20 | 0.02 | <0.01 | -0.22 | 0.02 | <0.01 |
| meanprior_school_groupMissing | -0.19 | 0.17 | 0.24 | -0.54 | 0.30 | 0.07 | 0.00 | 0.20 | 0.99 |
| RegionEast Midlands | -0.21 | 0.03 | <0.01 | -0.23 | 0.03 | <0.01 | -0.28 | 0.03 | <0.01 |
| RegionEast of England | -0.19 | 0.03 | <0.01 | -0.21 | 0.03 | <0.01 | -0.21 | 0.03 | <0.01 |
| RegionMissing | -0.15 | 0.04 | <0.01 | -0.29 | 0.05 | <0.01 | -0.25 | 0.06 | <0.01 |
| RegionNorth East | -0.20 | 0.03 | <0.01 | -0.24 | 0.04 | <0.01 | -0.24 | 0.04 | <0.01 |
| RegionNorth West | -0.21 | 0.02 | <0.01 | -0.24 | 0.03 | <0.01 | -0.26 | 0.03 | <0.01 |
| RegionSouth East | -0.18 | 0.02 | <0.01 | -0.21 | 0.03 | <0.01 | -0.22 | 0.03 | <0.01 |
| RegionSouth West | -0.12 | 0.03 | <0.01 | -0.18 | 0.03 | <0.01 | -0.21 | 0.03 | <0.01 |
| RegionWest Midlands | -0.18 | 0.02 | <0.01 | -0.19 | 0.03 | <0.01 | -0.24 | 0.03 | <0.01 |
| RegionYorkshire and the Humber | -0.17 | 0.03 | <0.01 | -0.19 | 0.03 | <0.01 | -0.21 | 0.03 | <0.01 |
| MeanGradePrevious_grouphigh | 0.29 | 0.01 | <0.01 | 0.33 | 0.01 | <0.01 | 0.22 | 0.01 | <0.01 |
| MeanGradePrevious_grouplow | -0.19 | 0.01 | <0.01 | -0.15 | 0.01 | <0.01 | -0.11 | 0.01 | <0.01 |
| MeanGradePrevious_groupMissing | -0.25 | 0.15 | 0.10 | -0.05 | 0.11 | 0.64 | 0.25 | 0.13 | 0.06 |
| MeanVAPrevious_grouphigh | 0.21 | 0.01 | <0.01 | 0.25 | 0.01 | <0.01 | 0.21 | 0.01 | <0.01 |
| MeanVAPrevious_grouplow | -0.19 | 0.01 | <0.01 | -0.24 | 0.01 | <0.01 | -0.18 | 0.01 | <0.01 |
| MeanVAPrevious_groupMissing | 0.20 | 0.15 | 0.18 | -0.16 | 0.11 | 0.17 | -0.18 | 0.13 | 0.18 |
| MeanGradePrevious_grouphigh:MeanVAPrevious_grouphigh | 0.04 | 0.01 | <0.01 | 0.01 | 0.01 | 0.39 | 0.01 | 0.01 | 0.39 |
| MeanGradePrevious_grouplow:MeanVAPrevious_grouphigh | -0.01 | 0.01 | 0.60 | -0.07 | 0.01 | <0.01 | -0.03 | 0.01 | 0.05 |
| MeanGradePrevious_grouphigh:MeanVAPrevious_grouplow | -0.05 | 0.01 | <0.01 | -0.06 | 0.02 | <0.01 | -0.04 | 0.02 | 0.01 |
| MeanGradePrevious_grouplow:MeanVAPrevious_grouplow | -0.07 | 0.01 | <0.01 | -0.10 | 0.01 | <0.01 | -0.09 | 0.01 | <0.01 |
| MeanGradePrevious_grouphigh:MeanVAPrevious_groupMissing | -0.17 | 0.16 | 0.29 | 0.25 | 0.12 | 0.04 | 0.39 | 0.14 | 0.01 |
| MeanGradePrevious_grouplow:MeanVAPrevious_groupMissing | -0.32 | 0.20 | 0.12 | 0.14 | 0.17 | 0.41 | 0.18 | 0.17 | 0.28 |
-
Throughout this report, when we refer to ‘exams’ in a normal year, we mean normal assessment arrangements. Final qualification grades in a normal year for some subjects include a combination of results gained from exams and other non-exam assessments (NEA). ↩