Ethnicity Pay Gap Report: 1 April 2021 to 31 March 2022
Published 30 March 2023

© Crown copyright 2023
This publication is licensed under the terms of the Open Government Licence v3.0 except where otherwise stated. To view this licence, visit nationalarchives.gov.uk/doc/open-government-licence/version/3 or write to the Information Policy Team, The National Archives, Kew, London TW9 4DU, or email: psi@nationalarchives.gov.uk.
Where we have identified any third party copyright information you will need to obtain permission from the copyright holders concerned.
This publication is available at https://www.gov.uk/government/publications/ethnicity-pay-gap-report-april-2021-to-march-2022/ethnicity-pay-gap-report-1-april-2021-to-31-march-2022
Foreword
This is the third year that we are voluntarily reporting on our ethnicity pay gap. We are committed to taking a proactive approach and see this as an opportunity to build stronger relationships with our workforce and beyond through openness and transparency as well as demonstrating our commitment to do better. This work also drives some of our efforts to ensure that the CMA continues to build a diverse and inclusive organisation and benefits from all that this brings. It is well proven that more diverse organisations perform better and having a more diverse and inclusive workforce will make sure that we draw on a breadth of skills and perspectives in order to represent the communities that we serve and make the best decisions possible.
The ethnicity pay gap, not to be confused with the issue of equal pay, shows the difference in the average hourly rate of pay between Black, Asian and Minority Ethnic and White employees in an organisation, expressed as a percentage of average White employee earnings. This is calculated using the same calculation methodology as for gender pay gap reporting.
Our ethnicity pay gap is primarily driven by a lack of representation of ethnically diverse colleagues at senior grades. Over the last 3 years, we have improved in this area, and our minority ethnic representation at Senior Civil Servant level (SCS) at the time of reporting was 4.8% (up from 0.0% in 2019 to 2020 and 1.8% in 2020 to 2021). However, we clearly aren’t where we want to be, and we know that this must continue to be an area of focus for us.
We are determined to do more than just meet our statutory obligations. The CMA is determined to build a diverse and inclusive workforce, including at senior levels, that reflects and understands the public we serve. Diversity of experience and thinking is also critical to delivering the best outcomes we can.
A critical part of our approach to Equality, Diversity and Inclusion is accountability. We believe that it is important to be open about where we are now and how much progress we still have to made. By being open, we hope to set ourselves up for taking greater steps forward in the future and reducing our ethnicity pay gaps further.
We are committed to changing, and our Action Plan will ensure that we maintain our accountability for progress and maintain momentum. We will be prioritising some top actions that will make the most difference, our ‘Accelerators’. These include a full review of our performance management framework, reviewing our recruitment process to identify and address the potential barriers that applicants might currently face, and implementing our outreach programme.
The Board and the Executive team fully endorse the range of initiatives detailed within the plan to ensure that we do all we can to close our ethnicity pay gaps.
Sarah Cardell, Chief Executive
Amelia Fletcher, Non-Executive Director and Wellbeing, Inclusion, Diversity and Equality Steering Group (WIDE) Chair
Introduction
The CMA is a non-ministerial government department in the United Kingdom responsible for promoting competition for the benefit of consumers, both within and outside the UK. Our aim is to make markets work well for consumers, businesses and the economy, strengthening business competition and preventing and reducing anti-competitive activities.
As an organisation, the CMA remains committed to promoting equality and diversity amongst our workforce. In August 2020, we published our ‘Equality, Diversity and Inclusion Strategy 2020 to 2024’ and ‘Equality, Diversity Action Plan 2020 to 2022’ which set out our ambitious programmes of work which seek to embed a diverse and inclusive culture within the CMA. We continue to take steps to minimise the ethnicity pay gap and our approach to pay seeks to reward staff fairly, regardless of ethnicity.
This report sets out the CMA’s ethnicity pay gap and how we plan to address the gap.
Context
The background to racial disparity in the UK is well documented in a range of recent reviews and reports that outline the challenges and opportunities for employers in achieving workplace equality.
At the CMA, we have a clearly stated commitment to racial equality. As a signatory to the Race at Work Charter, the publication of this Ethnicity Pay Gap reports fulfils our charter commitment to ‘capture ethnicity data and publicise progress’.
Unlike gender pay gap reporting, ethnicity pay gap reporting is completed on a voluntary basis. Of those organisations that have published ethnicity pay gap data, there is a trend towards a concentration of staff from ethnic minorities in junior roles and an absence or underrepresentation of these staff at senior levels. However, as reporting is currently voluntary, there is limited data available to allow us to compare ourselves to other organisations.
The CMA ethnicity pay gap is driven largely by similar challenges, as identified in the CMA’s first and second ethnicity pay gap reports. While we are pleased to see an ongoing increase in representation of staff from minority ethnic backgrounds since 2015, the low concentration at higher grades remains a significant issue for the CMA for many reasons, including being a substantial driver for our ethnicity pay gap figures. We have already put a range of measures in place to address underrepresentation at senior grades, particularly within the SCS.
Ethnicity pay gap reporting
What is the Ethnicity Pay Gap?
The ethnicity pay gap shows the difference in the average pay between staff from minority ethnic backgrounds in a workforce, compared to ‘White’ staff.
Where there is a positive percentage, this means that the average pay of a White member of staff is higher than that of a member of staff from an ethnic minority group. The higher the percentage, the greater the ethnicity pay gap. A negative pay mean means that the average pay of the ethnic minority group is higher than that of the White group.
The ethnicity pay gap is different to equal pay. Ethnic pay disparities are not primarily about those from a White background and other ethnic groups being paid differently for the same job. The Equality Act 2010 makes it unlawful to discriminate (both directly and indirectly) against employees because of their race. Therefore, unless there is a failure to comply with existing law, pay disparities between ethnic groups are likely to be due to other factors that impose a disadvantage on people from ethnic minorities without being explicitly discriminatory[footnote 1].
Development of employer guidance
In October 2018, as part of the government response to the McGregor-Smith recommendations, the Department for Business, Energy and Industrial Strategy (BEIS) initiated an employer consultation on ethnicity pay gap reporting. The consultation set out questions and options on what ethnicity pay information should be reported by employers to allow for meaningful actions to be taken.
In June 2020, the Commission on Race and Ethnic Disparities (CRED) was established by the UK government. The purpose of CRED, with support from the Race Disparity Unit of the Cabinet Office, is to investigate race and ethnic disparities in the UK.
In April 2021, CRED made a set of recommendations on ethnicity pay gap reporting published in the ‘The report of the Commission on Race and Ethnic Disparities’. On 17 March 2022, the government published a policy paper in response to the CRED report. Within that wide-ranging document the government confirmed it will not be legislating for ethnicity pay gap reporting at this stage, but committed to “support employers across the UK who want to publish their ethnicity pay gaps”. This will be done through the Department for Business, Energy and Industrial Strategy (BEIS) publishing new guidance on voluntary ethnicity pay gap reporting. At the time of this report the guidance has not yet been released but we will consider it for future ethnicity pay gap reporting.
CMA approach to ethnicity pay gap reporting
Last year, in the absence of employer guidance, the CMA took the approach to align with the recommendations set out by CRED. This included moving away from using the term ‘BAME’ to better understand disparities and outcomes for specific ethnic groups. As last year, this year’s report presents outcomes for specific ethnic minority groups:
- Black (including Black Caribbean and Black African)
- Asian (including Indian, Pakistani, Bangladeshi, Chinese, and other Asian categories)
- Mixed (including any mix of the above categories, including White)
- Other - This is where staff have disclosed that their ethnicity does not fall into the above categories or any of the White ethnic groups.
It is acknowledged that there may be differences in the outcomes between specific groups within the above categories (for example, Indian and Chinese). However, due to the small sample sizes within these sub-groups, the outcomes are reported within each of the above categories. In addition, where analysis by each ethnic minority group would break down data into small sample sizes (for example, pay gap analysis by grade), outcomes have been reported overall as ‘all ethnic minorities’.
There is currently no guidance on the pay measures that need to be reported as part of Ethnicity Pay Gap reporting nor any guidance on the methodology for calculation. Therefore, the CMA continues to take the approach to mirror the legislated pay measures used for Gender Pay Gap reporting[footnote 2], and the methods of calculation, but applied through a lens of ethnicity (where outcomes for ethnic minority groups are compared against White ethnic groups). Therefore, the pay measures contained in this report are:
- the mean and median ethnicity pay gaps for each ethnic minority group, compared against White ethnic groups;
- the mean and median ethnicity bonus gaps for each ethnic minority group, compared against White ethnic groups;
- the proportion of each ethnic group who received bonuses; and
- the proportion of employees in each pay quartile for each ethnic group.
Ethnicity Profile of the CMA
At 31 March 2022, the CMA had a total of 842 staff in the UK with 779 based in London, 50 in Edinburgh, 5 in Cardiff and 8 in Belfast. This is the number of staff deemed to be ‘full pay relevant’; those employees who are not being paid or are on reduced, statutory or no pay during March 2022 are excluded as they are not ‘full pay relevant’ employees.
The ethnicity profile of full pay relevant CMA staff at 31 March 2022 is below.
Figure 1: CMA Ethnicity Profile by grade as of 31 March 2022
| Grade | All Staff | White | Black | Asian | Mixed | Other | All Ethnic Minority Groups | Not Reportable** |
|---|---|---|---|---|---|---|---|---|
| AO, EO, HEO, SEO | 288 | 53.1% | 11.1% | 21.5% | 6.6% | 1.4% | 40.6% | 6.3% |
| G7, G6 | 430 | 70.7% | 2.6% | 10.0% | 4.2% | 1.6% | 18.4% | 10.9% |
| SCS PB1, PB2, PB3 | 124 | 85.5% | n/a | n/a | n/a | n/a | 4.8%* | 9.7% |
| Percentage of all staff | 842 | 66.9% | 5.1% | 13.1% | 4.4% | 1.4% | 24.0% | 9.1% |
*The profile of ethnic minority staff at SCS grades has been combined to avoid disclosure of individual ethnic backgrounds, due to small population sizes.
**This covers all full pay relevant employees who have chosen the ‘Prefer not to say’ option or who have not disclosed their ethnicity.
| Grade* | All staff |
|---|---|
| AO | 20 |
| EO | 66 |
| HEO | 142 |
| SEO | 60 |
| G7 | 231 |
| G6 | 199 |
| SCS PB1 | 99 |
| SCS PB2 / PB3 | 25 |
A breakdown of the number of staff at each grade within the CMA.
We know that there is higher representation of staff from ethnic minority backgrounds at junior grades, as well as lower representation of these staff at senior grades relative to the overall CMA population.
In particular, the low proportion of staff from ethnic minorities in the SCS is unacceptable and is a continued priority focus for the CMA Board and Senior Executive Team. The ambition is that the organisational diversity of the CMA at all levels should reflect that of the UK public and the consumers we serve, and we will take all possible steps to achieve this ambition.
It should be highlighted that the proportion of staff from ethnic minority backgrounds within the CMA continues to increase from 22.0% in 2019 to 2020 to 23.5% in 2020 to 2021 to 24.0% in 2021 to 2022, owing to the diversity of new joiners (where a third were of ethnic minority backgrounds). This compares favourably to the wider Civil Service where only 15.0% of employees were of minority ethnic backgrounds in March 2022[footnote 3].
Representation in the SCS has improved from 0.0% in 2019 to 2020 to 1.8% in 2020 to 2021 to 4.8% in 2021 to 2022. We expect this to further improve in subsequent years through our programmes of work detailed in our action plan. In the wider Civil Service, the representation of staff from ethnic minority backgrounds at SCS grades is 10.3% as at 31 March 2022[footnote 4].
Improving the ethnicity balance in senior grades will be one of the key ways in which we will reduce the pay gaps at the CMA.
Calculating the ethnicity pay gap
Ordinary pay
Ordinary pay, expressed as hourly pay, is used to calculate the mean and median ethnicity pay gaps. Ordinary pay includes basic pay, any allowances and any bonus payments made in March 2022. Salary sacrifice amounts are deducted from this value.
The calculation for the mean and median ordinary pay only includes ‘full pay relevant’ employees; that is, those employees who were on full pay in March 2022 as described in the Ethnicity Profile of the CMA section.
The ethnicity pay gap calculations are based on the number of individual employees, and not on full-time equivalents. This means that each part-time employee counts as one employee.
The following table shows the mean pay gap (the difference in the average hourly pay for each ethnic group compared to the White ethnic group) and the median pay gap (the difference in the median hourly pay for each ethnic group compared to the White ethnic group). The 2019 to 2020 and 2020 to 2021 pay gaps have been provided for comparison.
Figure 2: Mean and median ethnicity pay gaps for 2021 to 2022
| Ethnic Group | 2021 to 22 Mean Pay Gap | 2021 to 2022 Median Pay Gap | 2020 to 2021 Mean Pay Gap | 2020 to 2021 Median Pay Gap |
|---|---|---|---|---|
| Black | 36.7% | 35.3% | 28.8% | 33.8% |
| Asian | 24.1% | 27.8% | 33.0% | 25.9% |
| Mixed | 26.5% | 23.6% | 10.2% | 24.5% |
| Other | 10.7% | 4.4% | 7.8% | 10.7% |
| All Minority Ethnic Groups | 26.4% | 27.3% | 26.4% | 28.8% |
| 2019 to 2020 Mean Pay Gap* | 2019 to 2020 Median Pay Gap* |
|---|---|
| 29.3% | 34.8% |
*Minority ethnic groups were reported collectively as ‘BAME’ in 2019 to 2020 so individual pay gaps are not available for each ethnic group.
The most significant factor in our ordinary pay gaps is the distribution of our ethnic minority staff – specifically, the overrepresentation at junior grades and underrepresentation at senior grades (as shown in Figure 1). This applies to each of our ethnic groups but particularly so for Black and Asian ethnic groups, where 74.4% and 56.4% of these groups, respectively, are in grades AO to SEO.
We are pleased to see a positive direction of travel with reductions in the median pay gap by 1.5% for all ethnic minority groups since 2020 to 2021. The factors which have contributed to reducing this pay gap include:
- following the 2020 to 2021 pay gap report, we have seen an increase in representation of ethnic minority staff at higher grades, with increases of 0.5% for G6 and G7, and 3% for SCS grades.
- although the proportion of recipients and level of DDaT allowances (see paragraph 29b) continue to be higher for White staff, this disparity has reduced since 2020 to 2021. The number of recipients from ethnic minority backgrounds has increased from 23.1% to 30.4%, and the difference between levels of allowances paid has reduced from 43.5% to 11.6%.
Despite this reduction in the median pay gap, the mean pay gap has remained at 26.4%. Beyond the ongoing factor of lack of representation at senior grades which contributes to the pay gap, additional factors for the maintenance of this pay gap include:
- due to the 2021 Public Sector Pay Pause, our 2021 to 2022 Pay Settlement did not include base pay increases to the vast majority of staff. We have previously made base pay awards based on staff position within their respective pay range (with those lowest in the pay range receiving the highest pay awards), which has the effect of providing accelerated pay progression for those lowest in their pay range and contributed to reducing pay gaps.
- although we have seen an increase in representation of ethnic minority staff at senior grades, there has also been an increase of staff from ethnic minority backgrounds at more junior grades. Of all ethnic minority relevant joiners for 2021 to 2022, 63.0% were at grades AO to HEO, compared with 40.7% of all relevant White joiners.
- additionally, representation at SCS has also increased for White staff from 2020 to 2021 to 2021 to 2022 (83.8% to 85.5%) and has decreased for grades AO to SEO (53.8% to 53.1%). This is due to a decrease in staff who are not reportable.
The following table shows the mean and median ethnicity pay gaps for 2021 to 2022 broken down by grade*. These have been reported as a combination of all ethnic minorities rather than providing a breakdown for each ethnic group due to the small population sizes within each grade.
Figure 3: Mean and median ethnicity pay gaps by grade for 2021 to 2022
| Grade | All Minority Ethnic Groups Mean Pay Gap | All Minority Ethnic Groups Median Pay Gap |
|---|---|---|
| AO | 0.2% | 1.1% |
| EO | 2.8% | 3.1% |
| HEO | 0.0% | 0.0% |
| SEO | 0.3% | 1.2% |
| G7 | 1.0% | 0.6% |
| G6 | 0.5% | 0.0% |
| SCS PB1 | 1.0% | 2.6% |
| SCS PB2 / PB3 | n/a | n/a |
| All Staff | 26.4% | 27.3% |
Looking at the mean and median pay gaps by grade, the data shows that there are only minor gaps at all grades with some grades evidencing no pay gap for ethnic minority staff. Our Pay Policy sets out rules for salaries on appointment which limits starting salaries to the grade minimum up to the grade midpoint; this has the effect of limiting differences in pay between existing staff and new starters which also has the potential to negatively impact our pay gaps.
As described father up in this section, although there was no Pay Award for 2021 to 2022, the small gaps can be attributed to our decision in our 2020 to 2021 Pay Settlements to make pay awards based on staff position within their respective pay range (with those lowest in the pay range receiving the highest pay awards).
The mean and median pay gaps by grade should be contrasted with the overall CMA mean and median pay gaps of 26.4% and 27.3%, respectively (presented at Figure 2). While the pay gaps at a grade level are minimal, the overall CMA mean and median pay gaps are primarily driven by the under-representation of ethnic minority staff in senior grades, particularly in the SCS, relative to their population in the organisation.
Bonus pay
Bonus pay, which is also calculated as mean and median, is based on bonus payments paid to staff throughout the 2021 to 2022 financial year.
As this covers a full year period, this calculation includes employees who are not ‘full pay relevant’ employees but will not include employees who left the CMA before 31 March 2022.
At the CMA, usually bonus pay includes any performance related pay (PRP). These are payments based on performance management outcomes for the previous financial year. In the case of staff in grades AO to Grade 6, these payments are negotiated annually with our recognised trade unions. For SCS staff, there are separate arrangements which are centrally set by government each year. However, due to the ongoing Covid-19 pandemic on an exceptional basis for the 2021 to 2022 pay award for staff at grades AO to Grade 6 it was agreed that there would not be a link between performance ratings and non-consolidated payments. An organisational award was paid instead.
In addition, staff in grades AO to Grade 6 have a Staff Recognition Scheme which provides non-consolidated cash awards between £25 and £750. Any scheme awards made during the 2021 to 2022 financial year are also included in bonus pay calculations.
It should be noted that bonus calculations must also include ‘Pivotal Role Allowances’. These are payments, approved by a subgroup of the Civil Service Board and Chief Secretary to Treasury, aimed at retaining SCS staff in highly specialised roles and those delivering high-risk, major projects within the Civil Service. The allowances were paid to a small number of SCS staff in the 2021 to 2022 financial year on completion of project milestones.
Taking into account all types of bonus payments, the proportion of staff in receipt of bonuses by ethnic group is set out below. The 2019 to 2020, and 2020 to 2021 proportions have also been provided for comparison.
Figure 4: Proportion of staff in receipt of bonuses for 2021 to 2022
| Ethnic Group | 2021 to 2022 | 2020 to 2021 |
|---|---|---|
| White | 79.0% | 69.8% |
| Black | 86.0% | 63.2% |
| Asian | 80.2% | 62.2% |
| Mixed | 83.8% | 66.7% |
| Other | 91.7% | 70.0% |
| All Minority Ethnic Groups | 82.8% | 63.6% |
| Ethnic group | 2019 to 2020* |
|---|---|
| White | 68.0% |
| All Minority Ethnic Groups | 76.6% |
*Minority ethnic groups were reported collectively as ‘BAME’ in 2019 to 2020 so individual outcomes are not available for each ethnic group.
We note that there are increases to the proportion of staff from all ethnic groups that received bonuses when compared to 2020 to 2021. We attribute this to the fact that organisational awards were awarded to the majority of staff in grades AO to Grade 6 in 2021 to 2022, whereas they were not awarded in 2020 to 2021; this has a particular impact on ethnic minority groups as the majority of staff of these groups in 2021 to 2022 were in grades AO to Grade 6.
The following table shows the mean bonus gap (which is the difference in the average bonus pay for each ethnic group compared to the White ethnic group) and the median bonus gap (which is the difference in the median bonus pay for each ethnic group compared to the White ethnic group). The 2019 to 2020 and 2021 to 2022 bonus gaps have been provided as a comparator.
Figure 5: Mean and median bonus pay gaps for 2021 – 2022
| Ethnic Group | 2021 to 2022 Mean Bonus Pay Gap | 2021 to 2022 Median Bonus Pay Gap* | 2020 to 2021 Mean Bonus Gaps | 2020 to 2021 Median Bonus Gap |
|---|---|---|---|---|
| Black | 54.2% | 15.0% | 60.8% | 42.9% |
| Asian | 45.5% | 10.3% | 53.4% | 58.2% |
| Mixed | 44.0% | -3.7% | 57.6% | 65.3% |
| Other | 48.9% | 10.3% | 67.2% | 55.4% |
| All Minority Ethnic Groups | 47.4% | 10.3% | 56.4% | 59.3% |
| Ethnic Group | 2019 to 2020 Mean Bonus Gap** | 2019 to 2020 Median Bonus Gap** |
|---|---|---|
| All Minority Ethnic Groups | 57.9% | 44.2% |
*Where we have a negative percentage, this means that the average pay of staff within the relevant cohort is higher than the pay of White staff at the same grade.
**Minority ethnic groups were reported collectively as ‘BAME’ in 2019 to 2020 so individual pay gaps are not available for each ethnic group.
We observe that both mean and median bonus pay gaps have reduced, with median reducing significantly for all ethnic minority groups. The main contributing factor to this is payment of the organisational award, paid to all AO to Grade 6 staff in receipt of a performance rating, irrespective of the actual rating itself.
Additionally, whilst there were no SCS Pay Band 1 staff of ethnic minority backgrounds in receipt of a bonus for 2020 to 2021, this year there is increased representation at this level and subsequent bonus payments.
Despite this reduction, we know that the bonus gap continues to be affected by the following factors:
- the value of bonuses for SCS staff is significantly higher than staff in grades AO to G6. This is due to the size of the ‘non-consolidated performance pay pots’ which are set centrally by government; eligible SCS staff share 3.3% of the previous year’s SCS paybill for bonuses compared with 1.5% for staff at grades AO to Grade 6. The difference in the size of the pots and that this group is not ethnically diverse widens the bonus gap significantly.
- organisational award payments made in 2021 to 2022 for staff in grades AO to Grade 6 were tiered based on grade. Given that these payments were tiered, and ethnic minority staff are overrepresented in junior grades, relative to their population, this has contributed to the bonus pay gaps.
- the inclusion of Pivotal Role Allowances in bonus calculations, as all current recipients fall under the White ethnic group.
The following table shows the mean and median ethnicity bonus gaps for 2021 to 2022 broken down by grade. These have been reported as a combination of all ethnic minorities rather than providing a breakdown for each ethnic group due to the small population sizes within each grade.
Figure 6: Mean and median ethnicity bonus gaps by grade for 2021 to 2022
| Grade | All Minority Ethnic Groups Mean Bonus Gap* | All Minority Ethnic Groups Median Bonus Gap* |
|---|---|---|
| AO | 32.1% | 66.7% |
| EO | -3.6% | -3.2% |
| HEO | -18.7% | -6.3% |
| SEO | 5.0% | 9.8% |
| G7 | 9.0% | 5.0% |
| G6 | 6.7% | 12.3% |
| SCS PB1 | 60.5% | 89.6% |
| SCS PB2 / PB3 | n/a | n/a |
*Where we have a negative percentage, this means that the average bonuses of staff within the relevant cohort is higher than the average bonuses of White staff at the same grade.
The table shows there is a very high mean and median bonus gap at AO grade. As shown in Figure 2 we have 20 staff at AO grade, and a small number of these received bonus pay during the year. The size of this group has an impact on the bonus pay gaps.
Looking at the mean and median bonus gaps by grade, we note that there are gaps at several grades. We attribute these gaps to the following factors: - for all AO to Grade 6 ethnic minority staff in receipt of a Staff Recognition Scheme payment in 2021 to 2022, the average level award for each grade is less than their White counterparts, with the overall average award, in general, for White staff being 16.9% higher than that for ethnic minority staff. - we also see bonus relevant ethnic minority staff being less likely to be awarded a Staff Recognition Scheme payment; 59.2% of AO to Grade 6 White eligible staff received a payment, compared to 50.8% of eligible staff from an ethnic minority background. - there is also, in general, a greater proportion of relevant White staff who received the organisational award. 78.9% of White AO to Grade 6 bonus relevant staff received an organisational award, compared with 74.1% of staff from ethnic minority backgrounds.
Pay quartiles
The hourly pay quartiles are calculated by listing all employees in order of hourly pay and splitting them into 4 equal parts. The chart below shows the proportion of staff by ethnicity that are in each pay quartile.
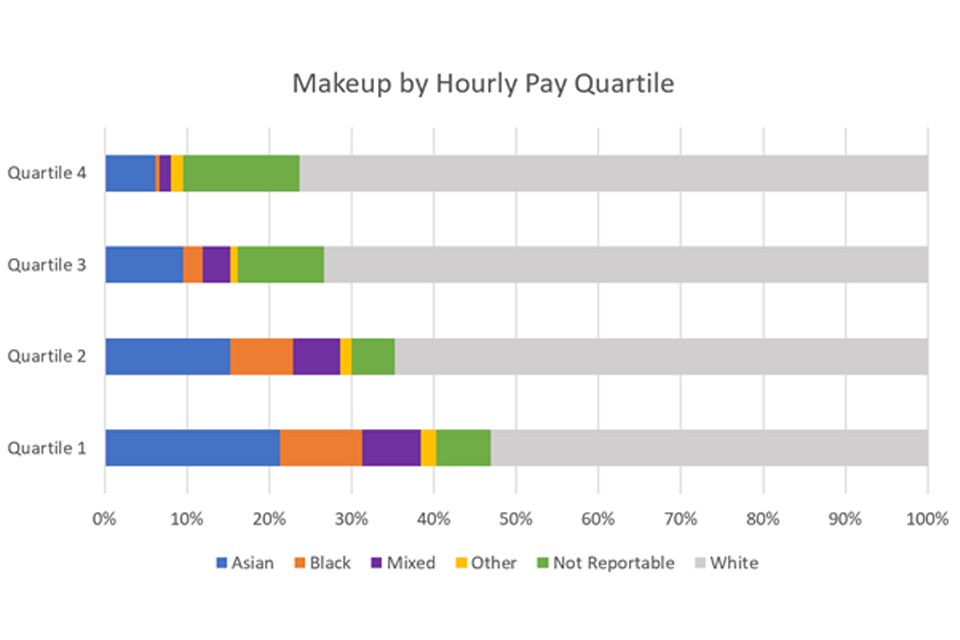
Figure 7: Proportion of staff by ethnic group in each pay quartile for 2020 to 2021
Image description: A bar chart in which the vertical axis shows the pay quartiles and the horizontal axis shows the proportion of staff from Asian, Black, Mixed, Other and White ethnic groups in each pay quartile. The chart shows that the White staff make up the largest proportion of each pay quartile, and the proportion of staff from ethnic minority groups decreases as the pay quartile increases. In the upper quartile the proportions are: White staff 76.3%, Asian staff 6.2%, Black staff 0.5%, staff from a Mixed background 1.4%, staff identifying as Other 1.4% and staff who have not reported their ethnic group 14.2%. In the upper middle quartile the proportions are: White staff 73.3%, Asian staff 9.5%, Black staff 2.4%, staff from a Mixed background 3.3%, staff identifying as Other 1.0% and staff who have not reported 10.5%. In the lower middle quartile the proportions are: White staff 64.8%, Asian staff 15.2%, Black staff 7.6%, staff from a Mixed background 5.7%, staff identifying as Other 1.4% and staff who have not reported 5.2%. In the lower quartile the proportions are: White staff 53.1%, Asian staff 21.3%, Black staff 10.0%, staff from a Mixed background 7.1%, staff identifying as Other 1.9%, and staff who have not reported their ethnicity 6.6%.
The concentration of staff from minority ethnic backgrounds in the lower quartile reflects the overall ethnic profile of the CMA and the fact that these staff are in more junior roles. The upper quartile, which is mainly comprised of Grade 6 competition specialists and SCS staff, has the lowest proportion of ethnic minority staff. Increasing ethnic minority representation at senior grades, particularly the SCS, will improve the ethnicity balance in the upper quartile and reduce our pay gaps.
Closing the Gap – Actions for the CMA
As an employer, we are committed to promoting equality and diversity amongst our workforce. We take steps to ensure we are a great employer that values and welcomes the different ideas, skills, behaviours and experiences of our colleagues. We also aim to foster a culture that promotes wellbeing and mental health and provides support so all our colleagues can thrive.
We continue to take steps to minimise the ethnicity pay gap and our approach to pay seeks to reward staff fairly, regardless of ethnic background. We are committed to reducing, and eventually eliminating, the ethnicity pay gap.
Our Equality, Diversity and Inclusion Strategy 2020 to 2024 describes how equality, diversity and inclusion are essential to the way that we operate, both as the UK’s competition authority and as an employer.
To deliver our Equality, Diversity and Inclusion Strategy 2020 to 2024, we have developed and published a detailed 2 year action plan that outlines how we will deliver the final 2 years of our 4 year EDI strategy.
Our Equality, Diversity and Inclusion Action Plan is focused on: - recruitment and ‘growing our own’ - career progression and development - improving senior representation - pay and reward - promoting a culture of inclusivity
As well as outlining our future actions, the plan sets out the initiatives we have already implemented and will continue to deliver over the next 2 years.
Within each area we will be prioritising some top actions where we will particularly focus our energy to make the most difference, our ‘Accelerators’.
The CMA Board, Executive and Chief Executive are committed to our ambitious yet achievable plans that will deliver change, not just in our gender and ethnicity pay gaps, but more broadly so the CMA is a truly inclusive and representative place to work.
Declaration
The CMA confirms that all calculations have been carried out with all efforts made to ensure a robust and methodical approach to the production of our findings.
-
Ethnicity Pay Reporting, Government Consultation, BEIS, October 2018, page 12 ↩
-
The Equality Act 2010 (Gender Pay Gap Information) Regulations 2017 ↩
-
Statistical Bulletin - Civil Service Statistics 2022 published July 2022 ↩
-
Statistical Bulletin - Civil Service Statistics 2022 published July 2022 ↩