Laboratory surveillance of Enterococcus spp. bacteraemia (England): 2022
Published 15 February 2024
Applies to England

© Crown copyright 2024
This publication is licensed under the terms of the Open Government Licence v3.0 except where otherwise stated. To view this licence, visit nationalarchives.gov.uk/doc/open-government-licence/version/3 or write to the Information Policy Team, The National Archives, Kew, London TW9 4DU, or email: psi@nationalarchives.gov.uk.
Where we have identified any third party copyright information you will need to obtain permission from the copyright holders concerned.
This publication is available at https://www.gov.uk/government/publications/enterococcus-spp-bacteraemia-voluntary-surveillance-2022/laboratory-surveillance-of-enterococcus-spp-bacteraemia-england-2022
Introduction
The following analysis is based on the surveillance of voluntary reporting of diagnoses of bloodstream infections (BSI) caused by Enterococcus spp. reported by laboratories in England since 2013. Voluntary surveillance data for England was extracted on 19 May 2023 from both the communicable disease reporting (CDR) and antimicrobial resistance (AMR) modules of the UK Health Security Agency’s (UKHSA) Second Generation Surveillance System (SGSS).
Rates of laboratory reported bacteraemia were calculated using mid-year resident population estimates for the respective year and geography (1). Geographical analyses were based on the patient’s residential postcode. Where this information was unknown, the postcode of the patient’s General Practitioner was used. Failing that, the postcode of the reporting laboratory was used. Cases were further assigned to one of 9 local area regions (UKHSA Centres), formed from the administrative local authority boundaries (2).
The following report will look at the trends and geographical distribution of enterococcal bacteraemia in England. Cases are further broken down by species, age and sex. Antimicrobial susceptibility trends are based on SGSS AMR data and reported for the five-year period: 2018 to 2022.
Data tables are available featuring the data presented in this report.
It should be noted that SGSS is a live database and therefore data are subject to change. As such, the data presented here for earlier years may differ from that in previous publications.
Main points
The main conclusions of this report are that:
- the rate of reported Enterococcus spp. bacteraemia in England has shown a consistent annual rise from 9.7 per 100,000 population in 2013 to 15.9 per 100,000 population in 2021, marking a cumulative increase of 63.5% during this period
- the overall rate of Enterococcus spp. bacteraemia in England appears to have plateaued in 2022 (15.6 per 100,000 population),
- regionally, Enterococcus spp. bacteraemia rates in England ranged from 14.2 per 100,000 population in the East of England to 18.4 per 100,000 population in the South West, with all but two regions showing a slight decrease in the rate of Enterococcus spp. bacteraemia during 2022 compared to reported rates during 2021
- those over 75 years of age had the highest reported rates of Enterococcus spp. bacteraemia (75.0 per 100,000 population); the rate of Enterococcus spp. bacteraemia differed between sexes with males over 75 years (115.3 per 100,000 population) having a higher rate compared to females over 75 years (44.4 per 100,000 population)
- overall, males had a higher rate of Enterococcus spp. bacteraemia in all age groups, except for the 15 to 44 year age group where rates appeared similar across sex (males: 3.7 per 100,000 population and females: 4.1 per 100,000 population)
- in 2022, 91.1% of isolates from enterococcal bloodstream episodes were identified to species level; among identified species, the dominant species in 2022 was Enterococcus faecium (45.9%) followed by Enterococcus faecalis (45.1%) consistent with what was observed in 2021 when E. faecium overtook E. faecalis as the most frequently reported Enterococcus spp. in cases of bacteraemia
- the percentage of E. faecium isolates resistant to glycopeptides has remained relatively stable at 21% between 2018 and 2022, and resistance to linezolid has remained low at 1% in 2022
- in 2022, AMR in E. faecalis bacteraemia remained rare, at around 2-3% resistance to several antimicrobial agents (ampicillin/amoxicillin, vancomycin, teicoplanin) and 1% to linezolid; these resistance rates are consistent with what had been observed in previous years.
Trends
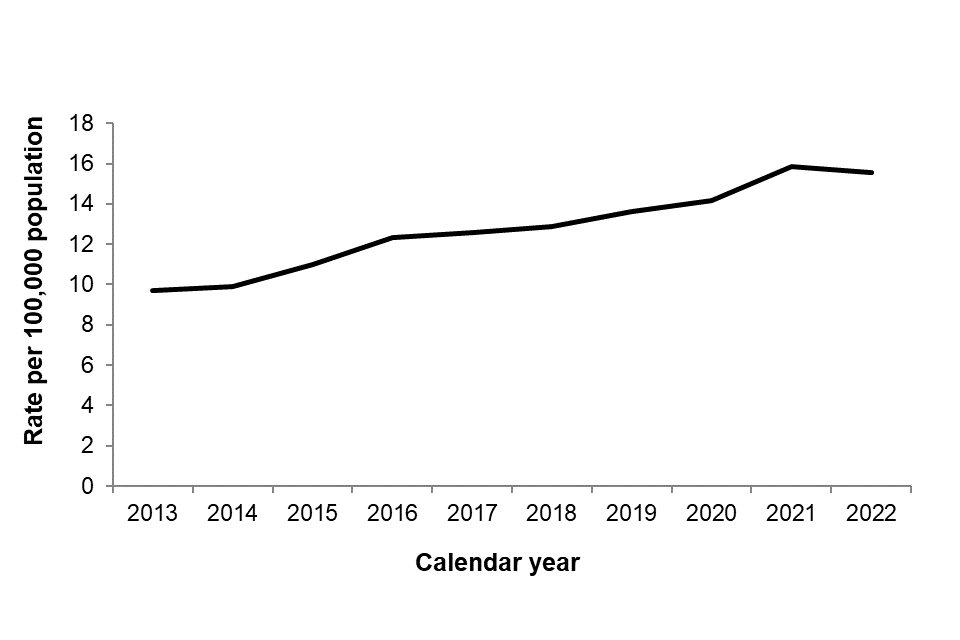
The rate of reported bacteraemia caused by Enterococcus spp. in England has been increasing year-on-year between 2013 and 2021 (Figure 1), from 9.7 per 100,000 population in 2012 to 15.9 per 100,000 population in 2021 (overall increase of 63.5%). The rate of Enterococcus spp. bacteraemia stabilised in 2022 at 15.6 per 100,000 population. It should be acknowledged that the COVID-19 pandemic has influenced healthcare delivery and the overall composition of hospital patients in England, potentially affecting the patterns of Enterococcus spp. bacteraemia (3, 4). Consequently, it is advisable to closely monitor trends in Enterococcus spp. bacteraemia in the post-pandemic period.
Figure 1. Rates of Enterococcus spp. bacteraemia per 100,000 population in England: 2013 to 2022
Geographic distribution
Over the past 5 years, the rate of enterococcal bacteraemia has been on a consistent rise annually, reaching a peak in 2021 and plateauing in 2022, a trend observed across most regions In England. In 2022, the local area region with the highest rate of Enterococcus spp. bacteraemia was the South West (18.4 per 100,000 population) (Figure 2, Table 1). The lowest reported rate in 2022 was in the East of England (14.2 per 100,000 population). In 2022, the reported rate of Enterococcus spp. bacteraemia in most regions plateaued or slightly decreased relative to 2021, with the exception of Yorkshire and the Humber and the North East, which both observed rate increases between 2021 and 2022 of 3.3% and 17.6%, respectively.
Between 2018 and 2022, the North West of England observed the highest percentage increase from a rate of 12.0 per 100,000 in 2018 to 17.1 per 100,000 in 2022 (42.9% increase). To note, variances in reporting and the occurrence of local outbreaks, in addition to diversities in local demographics could potentially account for the differences between different regions observed.
Table 1. Enterococcus spp. bacteraemia per 100,000 population by region (England): 2018 to 2022
| Region / Local Area | Rate in 2018 | Rate in 2019 | Rate in 2020 | Rate in 2021 | Rate in 2022 |
|---|---|---|---|---|---|
| London | 12.4 | 12.8 | 12.3 | 12.5 | 14.7 |
| North East | 12.0 | 15.3 | 15.9 | 17.6 | 17.1 |
| North West | 13.3 | 12.2 | 12.9 | 15.0 | 15.5 |
| Yorkshire and Humber | 13.9 | 13.9 | 14.2 | 15.6 | 15.4 |
| East Midlands | 11.6 | 11.9 | 12.1 | 14.5 | 14.2 |
| East of England | 14.6 | 12.8 | 14.3 | 15.5 | 15.3 |
| West Midlands | 11.1 | 12.9 | 13.2 | 16.0 | 15.0 |
| South East | 12.8 | 13.8 | 15.0 | 15.6 | 14.7 |
| South West | 15.8 | 16.9 | 16.2 | 18.7 | 18.4 |
| England total | 12.9 | 13.6 | 14.1 | 15.9 | 15.6 |
Figure 2. Geographical distribution of Enterococcus spp. bacteraemia rates per 100,000 population (England): 2022

Note: The rate scale begins at 14 per 100,000 population.
Species distribution
Consistent with a recent shift in dominant species that had been observed in 2021 and described in other reports (5), the most frequently reported species in 2022 was E. faecium (3,990 reports, 45.3%) followed by E. faecalis (3,654 reports, 41.5%) (Table 2). By contrast, between 2018 to 2020, the dominant species was E. faecalis.
Over 90% of isolates from Enterococcus spp. bacteraemia episodes reported in 2022 were identified to species level in England (Table 2). The reporting of speciation has also improved between 2018 and 2022, where the proportion of specimens not further speciated beyond “Enterococcus spp.” has been on a decreasing trajectory (12.4% to 9.0% respectively).
Table 2. Reports of Enterococcus spp. bacteraemia by species (England): 2018 to 2022
| Enterococcus species | Reports (%): 2018 | Reports (%): 2019 | Reports (%): 2020 | Reports (%): 2021 | Reports (%): 2022 |
|---|---|---|---|---|---|
| Total | 7,174 (100) | 7,620 (100) | 7,960 (100) | 8,972 (100) | 8,800 (100) |
| E. avium | 74 (1.0) | 60 (0.8) | 72 (0.9) | 79 (0.9) | 86 (1.0) |
| E. casseliflavus | 73 (1.0) | 77 (1.0) | 80 (1.0) | 85 (0.9) | 79 (0.9) |
| E. durans | 15 (0.2) | 16 (0.2) | 19 (0.2) | 22 (0.2) | 19 (0.2) |
| E. faecalis | 3,137 (43.7) | 3,289 (43.2) | 3,386 (42.5) | 3,636 (40.5) | 3,654 (41.5) |
| E. faecium | 2,795 (39.0) | 3,151 (41.4) | 3,364 (42.3) | 3,995 (44.5) | 3,990 (45.3) |
| E. gallinarum | 117 (1.6) | 97 (1.3) | 86 (1.1) | 117 (1.3) | 77 (0.9) |
| E. raffinosus | 55 (0.8) | 73 (1.0) | 72 (0.9) | 60 (0.7) | 84 (1.0) |
| Enterococcus spp., other named ǂ | 18 (0.3) | 16 (0.2) | 19 (0.2) | 19 (0.2) | 15 (0.2) |
| Enterococcus spp., sp. not recorded | 890 (12.4) | 841 (11.0) | 862 (10.8) | 959 (10.7) | 796 (9.0) |
ǂ: Including E. cecorum, E. columbae, E. gilvus, E. hirae, E. italicus, E. malodoratus, E. mundtii, E. phoeniculicola, E. saccharolyticus and E. thailandicus.
Age and sex distribution
As noted in previous reports, Enterococcus spp. bacteraemia is reported most frequently in younger and older age groups (Figure 3) (6).
Figure 3. Enterococcus spp. bacteraemia rates by age and sex (England): 2022
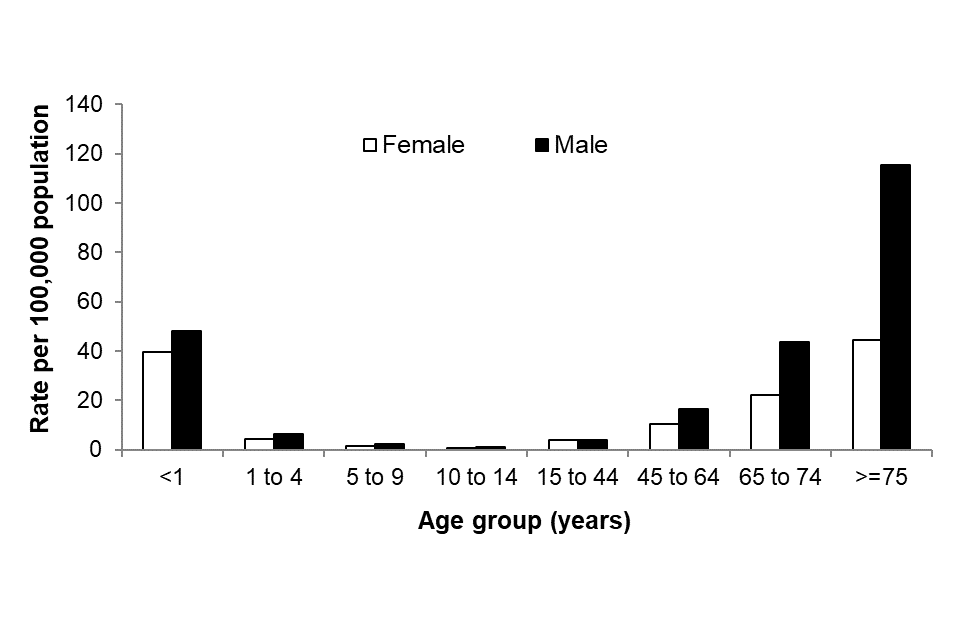
In 2022, as seen in previous years (6), the highest overall rate of bacteraemia caused by enterococci was in persons 75 years old and over (75.0 per 100,000 population). This was followed by under 1 year olds (45.0 cases per 100,000 population). In the rest of the paediatric population, the overall rate of Enterococcus spp. bacteraemia in the 1 to 4 year, 5 to 9 year and 10 to 14 year age groups was 5.5, 1.9 and 1.0 per 100,000 population, respectively (Figure 3). For more information on paediatric bloodstream infections, please refer to the Health Protection Report: Laboratory surveillance of paediatric bacterial bloodstream infections and antimicrobial resistance in England: 2018 to 2022 (7).
In all age groups, except in 15 to 44 years, males experienced a higher rate of Enterococcus spp. bacteraemia compared to females. Differences between rates in males and females were more prominent in the older age groups, particularly in the over 75 year olds (115.3 per 100,000 population compared to 44.4 per 100,000 population seen in females). Being male or being over 70 years old have both been associated with an increased risk of developing enterococcal BSI (8).
Antimicrobial resistance
Resistance of Enterococcus spp. to glycopeptides (vancomycin or teicoplanin) is monitored in the English Surveillance Programme for Antimicrobial Utilisation and Resistance (ESPAUR) annual report (9).
The two most frequently isolated Enterococcus species are E. faecalis and E. faecium. When compared to E. faecalis, E. faecium has been linked to bacteraemia in a subset of patients with more severe illness, and consequently is associated with higher mortality (8).
The percentage of E. faecium isolates from bacteraemia episodes reported as resistant to glycopeptides from 2018 to 2022 has remained relatively stable at 21%. The percentage of E. faecium isolates that were resistant to linezolid remained low, at around 1% resistant in 2022 (Table 3a). Resistance in E. faecium to linezolid slightly decreased from 2% of resistant isolates in 2021 to 1% of resistant isolates in 2022.
In 2021, AMR in E. faecalis bacteraemia remained rare with approximately 2% of isolates being reported as resistant to an antimicrobial agent (Table 3b).
The switch from E. faecium becoming the more dominant species in England could have significant treatment implications in light of higher resistance rates compared to those seen in E. faecalis bacteraemia, with a need to consider the most appropriate empirical treatment regime prior to confirmation of antimicrobial susceptibilities.
Table 3a. Antimicrobial susceptibility for E. faecium bacteraemia isolates (England): 2018 to 2022
| ANTIMICROBIAL | 2018 | 2019 | 2020 | 2021 | 2022 |
|---|---|---|---|---|---|
| Ampicillin / Amoxicillin | |||||
| Number tested (n) | 2,698 | 2,877 | 2,919 | 3,515 | 3,383 |
| % susceptible | 9 | 9 | 8 | 8 | 8 |
| % susceptible, increased exposure | <1 | <1 | <1 | <1 | <1 |
| % resistant | 91 | 91 | 92 | 92 | 92 |
| Vancomycin | |||||
| Number tested (n) | 2,794 | 3,025 | 3,155 | 3,817 | 3,714 |
| % susceptible | 78 | 79 | 81 | 79 | 79 |
| % susceptible, increased exposure | 0 | 0 | 0 | 0 | 0 |
| % resistant | 22 | 21 | 19 | 21 | 21 |
| Teicoplanin | |||||
| Number tested (n) | 2,546 | 2,836 | 2,932 | 3,616 | 3,575 |
| % susceptible | 77 | 79 | 81 | 78 | 77 |
| % susceptible, increased exposure | 0 | 0 | 0 | 0 | 0 |
| % resistant | 23 | 21 | 19 | 22 | 23 |
| Linezolid | |||||
| Number tested (n) | 2,578 | 2,812 | 2,924 | 3,608 | 3,480 |
| % susceptible | 99 | 98 | 99 | 98 | 99 |
| % susceptible, increased exposure | 0 | <1 | 0 | 0 | 0 |
| % resistant | 1 | 2 | 1 | 2 | 1 |
Table 3b. Antimicrobial susceptibility for E. faecalis bacteraemia isolates (England): 2018 to 2022
| ANTIMICROBIAL | 2018 | 2019 | 2020 | 2021 | 2022 |
|---|---|---|---|---|---|
| Ampicillin / Amoxicillin~ | |||||
| Number tested (n) | 2,872 | 2,907 | 2,801 | 3,174 | 2,996 |
| % susceptible | 98 | 98 | 98 | 98 | 98 |
| % susceptible, increased exposure | <1 | <1 | <1 | <1 | <1 |
| % resistant | 2 | 2 | 2 | 2 | 2 |
| Vancomycin | |||||
| Number tested (n) | 2,986 | 3,082 | 3,000 | 3,475 | 3,339 |
| % susceptible | 98 | 98 | 98 | 98 | 98 |
| % susceptible, increased exposure | 0 | 0 | 0 | 0 | 0 |
| % resistant | 2 | 2 | 2 | 2 | 2 |
| Teicoplanin | |||||
| Number tested (n) | 2,685 | 2,844 | 2,832 | 3,300 | 3,171 |
| % susceptible | 98 | 98 | 98 | 97 | 97 |
| % susceptible, increased exposure | 0 | <1 | 0 | <1 | 0 |
| % resistant | 2 | 2 | 2 | 3 | 3 |
| Linezolid | |||||
| Number tested (n) | 2,625 | 2,810 | 2,755 | 3,195 | 3,060 |
| % susceptible | 99 | 100 | 99 | 99 | 99 |
| % susceptible, increased exposure | <1 | 0 | 0 | 0 | 0 |
| % resistant | <1 | <1 | 1 | 1 | 1 |
~Resistance to ampicillin/amoxicillin in E. faecalis is rare; E. faecalis samples resistant to ampicillin/amoxicillin have not been confirmed by the reference laboratory.
Microbiology services
The percentage of reports of enterococcal bacteraemia in which the organism was not fully identified has decreased year on year from 12.0% in 2018 to 8.9% in 2022 (Table 2). As noted previously, the ability to define enterococci at species levels would assist in providing appropriate treatment regimes, in addition to monitoring trends of the most prevalent species, together with emerging enterococci (10).
Laboratories are requested to send any E. faecalis resistant to ampicillin/penicillin and any enterococcal isolates with suspected linezolid or tigecycline resistance, and isolates that show resistance to teicoplanin but not vancomycin, to UKHSA’s Antimicrobial Resistance and Healthcare Associated Infections (AMRHAI) Reference Unit for further investigation (amrhai@ukhsa.gov.uk) (10, 11). AMRHAI will also examine isolates with suspected high-level daptomycin MICs (a daptomycin MIC for E. faecium >4mg/L and for E. faecalis >2mg/L), although it should be noted that there are no EUCAST clinical breakpoints. For advice on treatment of antibiotic-resistant infections due to these opportunistic pathogens, laboratories should contact the AMRHAI Reference Unit in the first instance, who will arrange for a Medical Microbiologist to assist, if required.
Acknowledgements
These reports would not be possible without the weekly contributions from microbiology colleagues in laboratories across England, without whom there would be no surveillance data. The support from colleagues within the UKHSA and UKHSA AMRHAI Reference Unit (10), in particular, is valued in the preparation of the report. Feedback and specific queries about this report are welcome and can be sent to hcai.amrdepartment@ukhsa.gov.uk
References
1. Office for National Statistics (ONS). Mid-year population estimates for England, Wales and Northern Ireland
2. UKHSA. UKHSA regions, local centres and emergency contacts
4. Buetti N and others (2021). COVID-19 increased the risk of ICU-acquired bloodstream infections: a case-cohort study from the multicentric OUTCOMEREA network. Intensive Care Medicine: volume 47 issue 2, pages 180-187
5. Horner C and others (2021). Replacement of Enterococcus faecalis by Enterococcus faecium as the predominant enterococcus in UK bacteraemias. JAC-Antimicrobial Resistance: volume 3 issue 4
6. UKHSA (2021). Laboratory surveillance of Enterococcus spp. bacteraemia in England: 2020
7. UKHSA (2023). Laboratory surveillance of paediatric bloodstream infections and antimicrobial resistance in England: 2022
8. Billington E and others (2014). Incidence, Risk Factors, and Outcomes for Enterococcus spp. Blood Stream Infections: A Population-Based Study. International Journal of Infectious Diseases: volume 26, pages 76 to 78
9. UKHSA (2023). English Surveillance Programme for Antimicrobial Utilisation and Resistance (ESPAUR) Report 2022-2023
10. PHE (2021). UK SMI ID4: identification of Streptococcus species, Enterococcus species and morphologically similar organisms
11. UKHSA (2022). UK Health Security Agency Reference Laboratories, Colindale: Bacteriology Reference Department user manual