DIT: gender pay gap report and data 2019
Published 23 January 2020

© Crown copyright 2020
This publication is licensed under the terms of the Open Government Licence v3.0 except where otherwise stated. To view this licence, visit nationalarchives.gov.uk/doc/open-government-licence/version/3 or write to the Information Policy Team, The National Archives, Kew, London TW9 4DU, or email: psi@nationalarchives.gov.uk.
Where we have identified any third party copyright information you will need to obtain permission from the copyright holders concerned.
This publication is available at https://www.gov.uk/government/publications/dit-gender-pay-gap-report-and-data-2019/dit-gender-pay-gap-report-and-data-2019
Introduction
The Department for International Trade (DIT) has prepared this report to help us to understand the extent and drivers of our gender pay gap – the difference in the average pay received by our male and female employees. It meets the legal requirement for public authorities to publish their gender pay gap on an annual basis.
In 2017 the government introduced world-leading legislation that made it statutory for organisations with 250 or more employees to report annually on their gender pay gap. Government departments are covered by the Equality Act 2010 (Specific Duties and Public Authorities) Regulations 2017 which came into force on 31 March 2017.
These regulations underpin the Public Sector Equality Duty and require the relevant organisations to publish their gender pay gap data by 30 March every year, including:
- mean and median gender pay gaps
- the mean and median gender bonus gaps
- the proportion of men and women who received bonuses
- the proportions of male and female employees in each pay quartile
The gender pay gap shows the difference in the average pay between all men and women in a workforce. Understanding the composition and drivers of this gap helps us to investigate the causes, and to identify practical measures we can take to address the gap.
The gender pay gap is different from equal pay. Equal pay addresses the pay differences between men and women who carry out the same jobs, similar jobs or work of equal value. It is unlawful to pay people unequally because they are a man or a woman.
DIT supports the fair treatment and reward of all staff irrespective of gender. In October 2017 the Civil Service Diversity and Inclusion Strategy was published. This important document sets out new programmes and initiatives to realise our ambition to become the UK’s most inclusive employer by 2020.
In January 2019 DIT launched our Gender Pay Gap (GPG) Action Plan, which includes a range of evidence-based actions to close the gap. We are in the process of reviewing and updating the action plan to ensure we focus on activities that have the greatest impact, as well as improving monitoring and governance.
The Civil Service, including DIT, wants to create a diverse and representative workplace – one that will attract and retain talented people from all backgrounds, and give everyone, including those already working for us, the opportunity to achieve their full potential.
This report fulfils the department’s reporting requirements, analyses the figures in more detail and sets out what we are doing to close the gender pay gap in the organisation.
The 2019 Gender Pay Gap and Bonus Pay for Department for International Trade
| Gender pay gap (ordinary pay) | Bonus pay gap | |
|---|---|---|
| Mean | 5.5% | 2.5% |
| Median | 12.9% | 0.0% |
The department’s workforce
DIT was created in July 2016 following the EU Exit referendum. We are the UK’s international economic department responsible for bringing together policy, promotion and financial expertise to break down barriers to trade and investment and help businesses succeed, delivering a new trade policy framework for the UK as it leaves the EU. DIT promotes British trade and investment across the world and is building the global appetite for UK goods and services.
The 2019 gender pay gap analysis includes those staff deemed to be full paid relevant employees [footnote 1] based in the UK and overseas, on DIT payroll (and FCO payroll for those working overseas).
The department uses 8 civil service job grades (listed below from junior to senior).
Number of DIT employees by grade and gender
| Grade | Number of female staff | Female % of DIT staff | Female % of grade | Number of male staff | Male % of DIT | Male % of grade | Total |
|---|---|---|---|---|---|---|---|
| Administrative Officer (AO) | 24 | 1% | 53% | 21 | 1% | 47% | 45 |
| Executive Officer (EO) | 86 | 5% | 48% | 93 | 5% | 52% | 179 |
| Higher Executive Officer (HEO) | 183 | 10% | 47% | 205 | 11% | 53% | 388 |
| Fast Stream (FS) | 15 | 1% | 42% | 21 | 1% | 58% | 36 |
| Senior Executive Officer (SEO) | 126 | 7% | 40% | 186 | 10% | 60% | 312 |
| Grade 7 (G7) | 226 | 13% | 43% | 301 | 17% | 57% | 527 |
| Grade 6 (G6) | 86 | 5% | 46% | 103 | 6% | 54% | 189 |
| Senior Civil Service (SCS) | 43 | 2% | 37% | 74 | 4% | 63% | 117 |
| Total | 789 | 44% | 44% | 1,004 | 56% | 56% | 1,793 |
Rounding means that percentages may not sum to 100%.
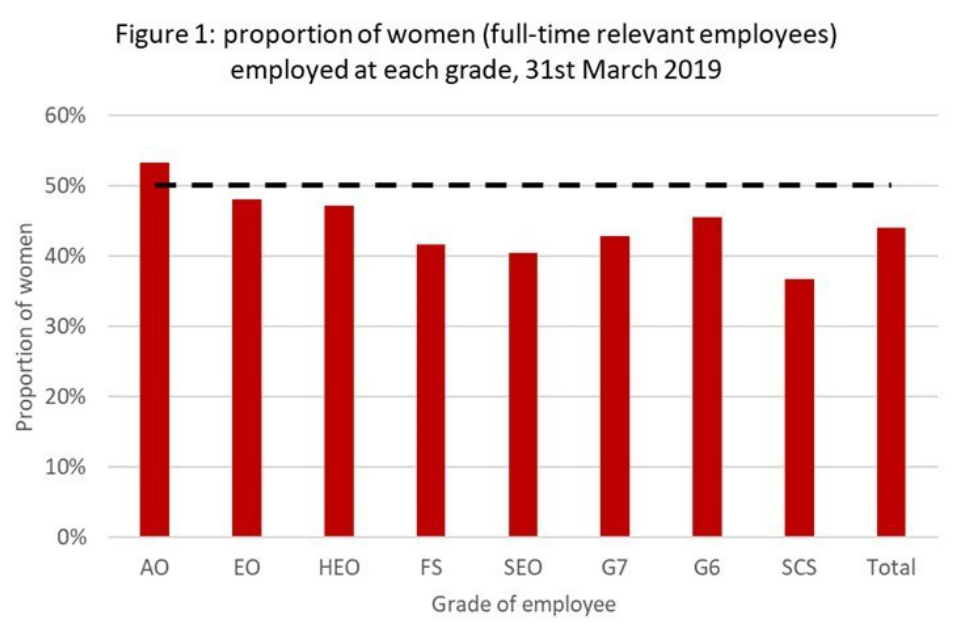
Gender balance at different grades is one of the main contributing factors to an organisation’s gender pay gap.
Rounding means that percentages may not sum to 100%.
The gender pay gap analysis provided in this report is based on the methodology set out in the Equality Act (Specific Duties and Public Authorities) Regulations 2017.
The gender pay gap for ordinary pay
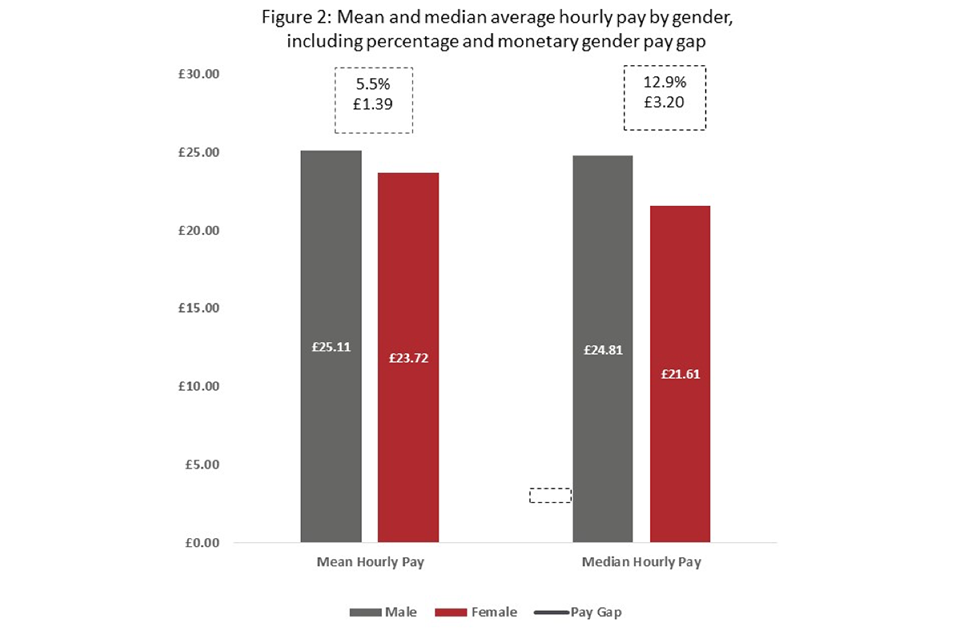
The 2019 mean gender pay gap (the difference between men’s and women’s average hourly pay) is 5.5% and the median gender pay gap is 12.9%.
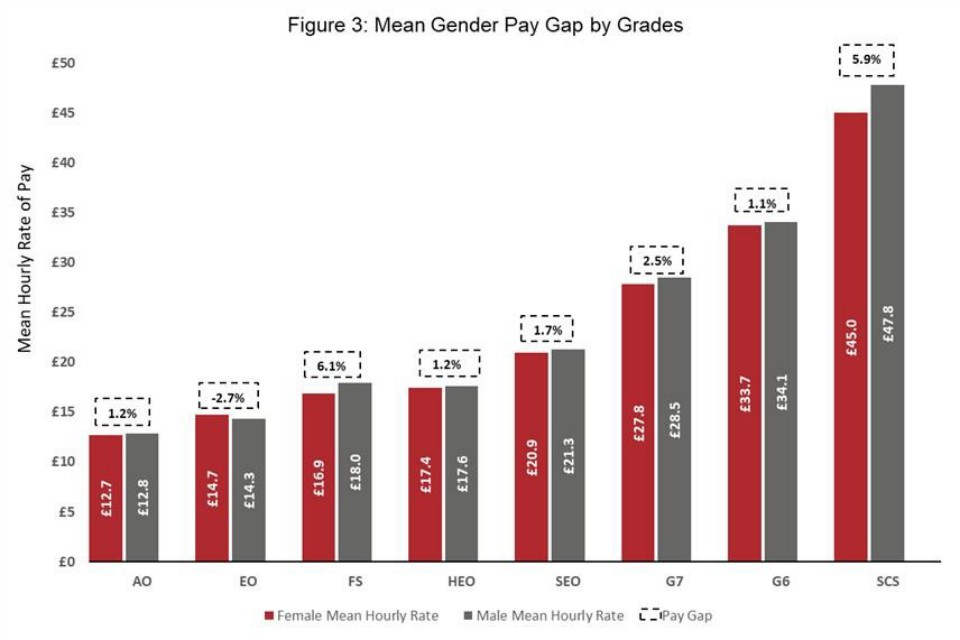
Further analysis shows that on average, men are paid more than women at every grade except EO, as shown in Figure 3 below.
The mean and median ordinary pay gap 2017 to 2019
| 2017 | 2018 | 2019 | |
|---|---|---|---|
| Mean | 3.6% | 4.7% | 5.5% |
| Median | 2.7% | 9.4% | 12.9% |
| [footnote 2] DIT’s 2017 report did not include civil servants based overseas. |
This report shows the reasons for the gap, why the gap has increased over the previous year as well as setting out the further work we will undertake to address this.
Pay quartile distribution
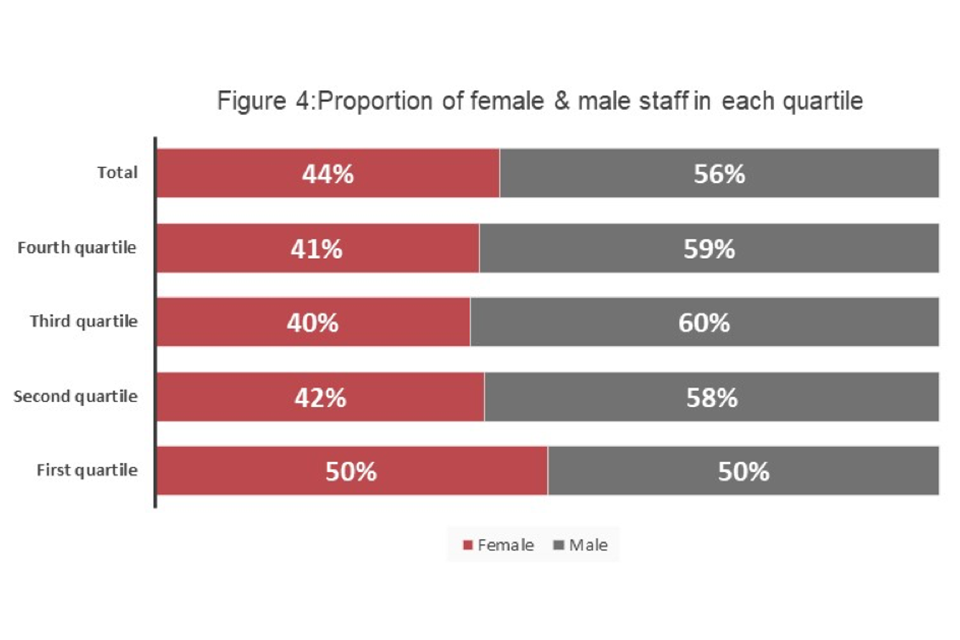
The pay quartile distribution data in figure 4 shows, for ordinary pay [footnote 3] , the proportion of men and women that are in each pay quartile, when staff are arranged in order of hourly pay rate.
In DIT, there are nearly equal numbers of men and women in the first (lowest) pay quartile. Above that, the number of women employed is consistently lower than men across the remaining 3 quartiles, the proportion of women ranging between 40% and 42% in the quartiles.
What lies behind DIT’s gender pay gap increase in 2019?
DIT has undergone significant expansion since its creation in 2016. The department’s employee population grew by 58% between July 2016 and March 2019. We have recruited to a large number of posts across the department, in the UK and abroad. For the purpose of GPG reporting, (that is employees on full pay as at 31 March 2019) the headcount increased from 1,597 in 2018 to 1,793 which is a 12% increase.
The proportion of male and female staff in each quartile has changed from last year, particularly at the first quartile which was 46% female and is now 50% female, and at the second quartile which was 45% female and is now 42% female. The differences in male and female representation in the third and fourth quartile have only changed marginally over the year.
Women made up 47% of the total entrants in the last year in Grade 7 and above roles compared with 53% of entrants who were men.
Conscious recruitment efforts have been made to attract more women into the department, for example using software that ensures the language in our adverts is gender neutral. This is evident in the proportion of women included in the 2019 analysis which has increased slightly from 43% in 2018 to 44%; the proportion of men in the department has decreased from the previous year (from 57% to 56%). Nevertheless, this leaves the overall proportion of men higher than the proportion of women. Moreover, the proportion of men occupying roles from Grade 7 upwards is greater than the proportion of women (57% men; 43% women).
This year’s GPG data set includes civil servants working overseas and in the UK. Of the 134 DIT civil servants working overseas - all of whom are at HEO grade or above - 72% are men and 28% are women. This is a slight change from 2018 where the proportions were 75% men and 25% women. Inclusion of this group adds to the higher proportion of men overall.
Whilst the gender balance at different grades is one of the main contributing factors to an organisation’s gender pay gap, there is also a gender pay gap within each grade, as shown in figure 3, particularly at Fast Stream and SCS grades (6.1% and 5.9% respectively).
The bonus pay gap
DIT offers both end of year performance awards to staff who receive the highest performance ratings, and an in-year reward scheme to recognise strong contributions in year.
Whereas the gender pay gap for ordinary pay is calculated as a ‘snapshot’ at the end of March 2019, and so includes any bonus payments paid in that month, the gender differential in bonus pay is calculated to take into account all bonus payments made in the year up to that point. So for this analysis, in-year reward payments and end of year bonus payments (relating to the 2017 to 2018 performance year) made in the 12 months ending 31 March 2019 were included.
End of year performance awards and in-year awards in DIT are not pro-rated for part time staff (so these staff receive the full value of the bonus). Therefore, the bonus pay gap is not affected by the number of part time staff in either gender.
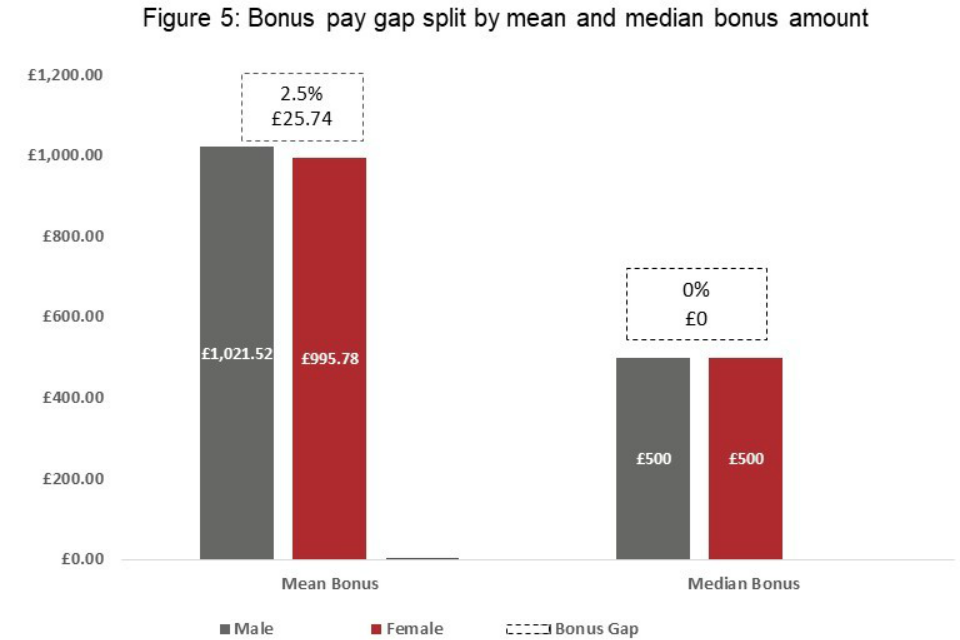
The mean gender bonus gap (difference between average bonus received by men and women) saw a small increase from 0.2% to 2.5% - a cash difference of £25.74. The median gender bonus gap (difference between the employee in the middle of the range of male bonus and the employee in the middle the range of female bonus) is 0%. The mean gap shows that overall, men received higher bonus payments.
The mean and median bonus pay gap 2017 to 2019
| 2017 | 2018 | 2019 | |
|---|---|---|---|
| Mean | -14.4% | 0.21% | 2.5% |
| Median | 3.1% | 0.0% | 0.0% |
| [footnote 2] DIT’s 2017 report did not include civil servants based overseas. |
A higher proportion of women received a bonus payment (58%) compared to the proportion of men who received a bonus payment (55%), with the highest percentage difference being at Grade 7 (64% of women, and 53% of men).
In general, a bigger increase in the mean than the median indicates that a small number of individuals’ bonuses have a large effect; rather than a more widespread disparity across the workforce. The median bonus gap has remained at 0% from the 2018 report. The mean bonus gap meanwhile saw a small increase from 0.2% to 2.5%.
Although the overall proportion of women receiving a bonus (58%) is higher than the proportion of men (55%), women are likely to receive smaller bonuses than men because of their distribution across the grade structure: staff in higher grades generally receive larger bonuses. Men received a higher bonus than women in Grade 7 and Grade 6 bands (£158 and £127 higher respectively). Women received a higher average mean bonus at all other grades. The overall male mean bonus for 2019 was £1,022, compared to £996 for women.
Actions
DIT recognises that the department’s gender pay gap has widened from 2018 to 2019. DIT is committed to reducing the overall gap through the following interventions which are aligned to the actions described in Search and compare gender pay gap data.
Progress so far
Gender Pay Gap Action Plan
We launched our Gender Pay Gap Action Plan in January 2019. The action plan includes a range of evidence-based actions to close the gap and was informed by guidance on actions to close the gap developed by the Behavioural Insights Team and the Government Equalities Office.
Recruitment
As recruitment in the Civil Service is governed by the Civil Service Commission, we ensure all candidates are assessed consistently.
At a senior level, external competitions are chaired by a Civil Service Commissioner who ensures that the recruitment is open, fair and merit-based and diversity is monitored at each stage of selection. In addition, any all-male shortlists for the Senior Civil Service are reported to the Permanent Secretary.
We ensure the selection process is clear on our job adverts, providing prospective candidates with transparency regarding the selection panel, assessments and criteria. We are committed to representative selection panels and require panels to be diverse and to include a trained Independent Panel Member or Senior HR representative who is key to ensuring diversity and independence in the process overall.
Software
We utilise software that allows us to finetune the language of our adverts to make them gender neutral or appeal to more women (particularly in under-represented areas like digital, data and technology).
Civil Service Success Profiles
In November 2018, we introduced Civil Service Success Profiles designed to make the process for recruitment more flexible, accessible and inclusive, offering different methods of recruitment based on behaviours, strengths, ability, experience, and technical skills.
Interviews and assessments
At all recruitment levels, we use structured interviews and we can use a range of assessments including situational judgment tests, technical interviews and media scenarios. These reduce the reliance on candidates performing well at a single interview as well as testing a range of skills. These assessments aid the panel in making their final decision and are not an automatic pass or fail.
For Senior Civil Service appointments, we also include a mandatory leadership assessment and this assessment is conducted by an independent psychologist/assessor.
Job advertising
DIT has a dedicated careers page on the Civil Service careers website to widen our attraction pool. All externally advertised jobs at SCS2 and above are also advertised via Find Your Flex. We actively promote flexible working arrangements to all our staff and promote shared parental leave policies.
Salaries
As part of our obligations under Cabinet Office Transparency Data requirements, the salaries of our SCS staff continue to be published on data.gov.uk.
As of September 2018, the Permanent Secretary signs off all advertised SCS salaries and salaries offered to appointable candidates.
Diversity and inclusion
DIT operates 12 diversity and inclusion staff networks and we have created our Diversity and Inclusion Action Plan in collaboration with them. We are working with the Gender Network to evaluate the progress and impact of the Gender Pay Gap Action Plan.
Next steps
We know that addressing the gender pay gap and gender balance will take time.
As well as identifying immediate actions, we want to:
- invest in long-term programmes such as talent and leadership schemes
- tackle social and cultural challenges such as attracting women into traditionally male oriented professions and roles within the department
We will:
- review and update our Gender Pay Gap Action Plan to focus on activities that have the greatest impact, as well as improving monitoring and governance
- target the causes of why there are fewer women in overseas posts through analysis and a sustained communication campaign sharing the positive experiences of women working overseas
- gather data to show the impact of intersectionality on the gender pay gap; this will allow us to take informed decisions about targeting activities towards certain protected characteristics
- nurture our internal talent through our own programmes and appoint cohort sponsors to ensure participants have role models within the department
- aim to attract and hire more returners by targeting places where returners are likely to be looking, ensuring the recruitment process is returner-friendly, and offer support throughout the assessment process
- analyse labour market trends to understand their impact on DIT’s external recruitment practices, particularly at the most senior levels and feeder grades to the SCS, to ensure that these roles are attractive and accessible to female talent
Calculations and quality statement
Our calculations have followed the legislative requirements of the Equality Act (Specific Duties and Public Authorities) Regulations 2017. The data reported is accurate as of 31st March 2019, as extracted by our service provider, UK Shared Business Services and in line with the Cabinet Office Guidance. Data is not held centrally which allows March in-year bonuses to be apportioned to the relevant number of months, therefore any in-year bonuses paid in March are included in full.
DIT’s workforce is based across the UK and also overseas, on the OneHMG platform. As per the regulations[footnote 4], the 2019 gender pay gap analysis includes those staff deemed to be full paid relevant employees[footnote 5] based in the UK, on DIT payroll as well as overseas Civil Servants on the OneHMG platform. Locally employed staff overseas, contractors and agency workers are not included.
Part-time staff are included in the analysis, as the ordinary pay is calculated on an hourly pay rate. On the bonus pay gap, part-time staff are equally included as any end of year performance awards and in-year awards in DIT are not pro-rated for part time staff.
The majority of fast stream staff working at DIT are centrally recruited and employed by Cabinet Office: this group will therefore be included in analysis of the gender pay gap for the Cabinet Office rather than DIT.
Bonus data includes all end of year bonuses made for the 2017/18 performance year as well as in-year rewards made between 1 April 2018 and 31 March 2019.
The gender pay gap includes bonuses paid in the month of March, while all bonuses paid in the year to March (inclusive) are included in the bonus pay gap calculations.
-
A ‘full pay relevant employee’ is an employee on the snapshot date, 31 March 2019 who received their normal March salary. ↩
-
DIT’s 2017 report did not include civil servants based overseas, as it was impractical to obtain the data for these staff that year. Overseas staff are all at HEO and above, with a higher proportion of men occupying DIT roles overseas. ↩ ↩2
-
‘Ordinary pay’ is the snapshot of pay received on 31 March 2019: it includes any in-year bonus payments made in that month’s pay. Analysis of the bonus pay gap in this report reflects all bonuses paid in the full year to 31st March 2019. ↩
-
Equality Act 2010 (Specific duties and Public Authorities) Regulation 2017. ↩
-
A ‘full pay relevant employee’ is an employee on the snapshot date, 31 March who receives their normal March salary. ↩