DCMS Economic Estimates 2019 (provisional): Gross Value Added
Updated 3 September 2024

© Crown copyright 2024
This publication is licensed under the terms of the Open Government Licence v3.0 except where otherwise stated. To view this licence, visit nationalarchives.gov.uk/doc/open-government-licence/version/3 or write to the Information Policy Team, The National Archives, Kew, London TW9 4DU, or email: psi@nationalarchives.gov.uk.
Where we have identified any third party copyright information you will need to obtain permission from the copyright holders concerned.
This publication is available at https://www.gov.uk/government/statistics/dcms-economic-estimates-2019-gross-value-added/dcms-economic-estimates-2019-provisional-gross-value-added
Notice of revision, 19 February 2021
Some of the figures in this release were revised on 19 February 2021. The measure affected, GVA for ‘All DCMS sectors (including Tourism)’, has been revised down by 1% for all years from 2016 to 2019. The change does not affect GVA totals for individual sectors or subsectors, nor the key trends or conclusions.
The figures were corrected to account for the overlap between part of the tourism sector (‘Other consumption products’) and other DCMS industries. We have not revised historic releases as GVA figures are updated in each publication due to planned annual revisions to the National Accounts.
Released: 19 February 2021
Geographic Coverage: United Kingdom
1. Introduction
This release provides estimates of the contribution of DCMS Sectors to the UK economy from 2010 to 2019, measured by gross value added (GVA). The results are not affected by the coronavirus (COVID-19) pandemic in 2020 as the latest year for which data is reported is 2019.
GVA is a measure of the increase in the value of the economy due to the production of goods and services. Its relationship to GDP is as follows:
GVA = GDP + Subsidies - Taxes
GVA is measured either at:
- current basic prices (‘nominal GVA’), which give the best ‘instantaneous’ measure of the value to the economy, but are not adjusted for the effect of inflation
- chained volume measures (‘real terms GVA’), where the effect of inflation is removed
We use current prices to report current sector estimates and chained volume measures for any comparisons over time.
The DCMS sectors covered in this report are:
- Civil Society
- Creative Industries
- Cultural Sector
- Digital Sector
- Gambling
- Sport
- Telecoms
- Tourism
This release is shorter than earlier GVA releases. All of the data breakdowns released in previous years are still available in the accompanying data tables, consisting of current prices and chained volume measures for DCMS sectors and subsectors from 2010 to 2019, and a GVA index expressed in chained volume measures. Data is also available in the tables for the Audio Visual sector, Computer Games sub sector and Sport Satellite Account GVA. We encourage our users to provide feedback on this new format. Contact details for DCMS statisticians can be found in the Further Information section at the end of this release.
Methodological information on the sector definitions, data sources, derivation of GVA and limitations of the approach can now be found in the accompanying technical report. The technical report also includes a summary of alternative economic measures of DCMS Sectors produced by other organisations, including some of DCMS’ arm’s length bodies.
All GVA figures in this report are subject to change when National Accounts are published in 2021. The 2019 figures are provisional (denoted by “2019p” in tables and charts) and will be revised in the next annual update of these statistics.
In June 2019, the DCMS Sector Economic Estimates: GVA were badged as National Statistics. This affirms that the statistics have met the requirements of the Code of Practice for Statistics.
2. GVA in All DCMS sectors
We use current prices to report current sector estimates and chained volume measures for any comparisons over time.
In 2019, DCMS Sectors contributed £291.9 billion to the UK economy. This was 14.8% of total UK GVA, up from 14.5% in 2018 (measured in current prices).
Between 2018 and 2019, the GVA of the DCMS Sector total grew faster in real terms (adjusted for inflation) than the UK economy as a whole. The DCMS Sector total increased by 3.5% from 2018 to 2019 (compared to 1.4% for the UK), but note that this figure excludes Civil Society, for which a value adjusted for inflation is not available.
Between 2010 and 2019, the gross value added of DCMS Sectors (excluding Tourism and Civil Society) increased by 30.0% in real terms, compared to 17.7% for the UK (Figure 1). Tourism is excluded for this figure because data for the Tourism sector is only available from 2016 (due to data and methodology revisions).

Figure 1. Index of real-terms GVA growth for All DCMS Sectors (excl. Tourism and Civil Society) and for total UK: 2010 to 2019 (2010=100)
3. GVA in individual DCMS sectors
3.1 Sector overlap
Some large industries are found within multiple sectors and are likely to drive trends in the same way for both sectors.
For example, 27.7% of DCMS Sector GVA is within both the Creative Industries and the Digital Sector. These overlaps include activities such as computer programming and software publishing. A further 7.9% of DCMS Sector GVA is accounted for by overlaps between the Creative Industries, Digital Sector and Cultural Sector (these include activities such as broadcasting and motion picture, video and TV production). When calculating the DCMS sector total, the GVA from industries within the overlap is counted once. Users should be aware that the estimate for ‘All DCMS Sectors’ is lower than the sum of the individual sectors. This overlap between DCMS sectors is illustrated in the figure below.
Whilst sectors can overlap, subsectors within a sector are mutually exclusive. Subsector information is provided for Creative Industries, Cultural Sector and Digital Sector.
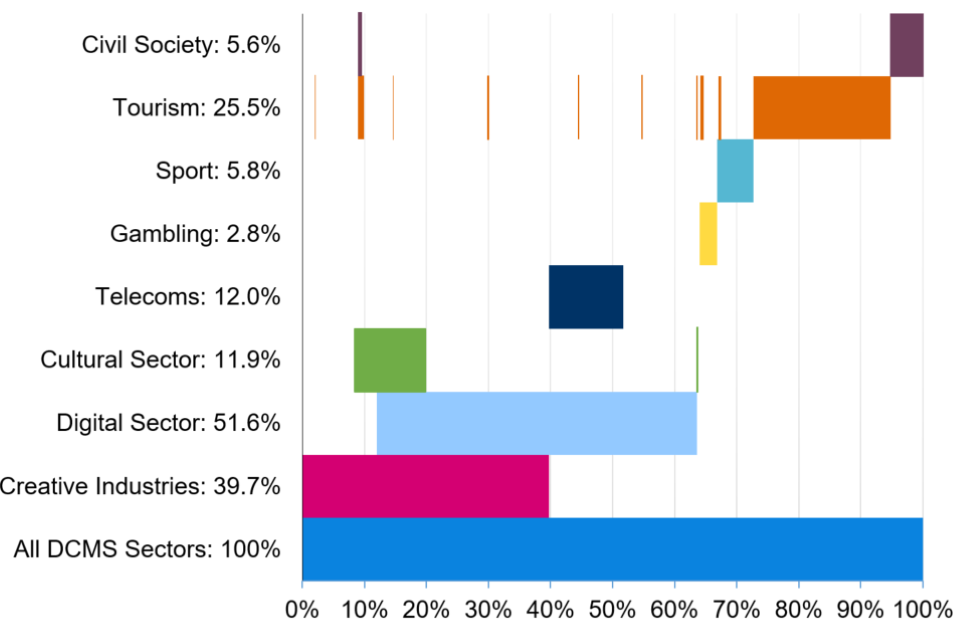
Figure 2. GVA and overlaps in DCMS Sectors, 2019
For more information, Chapter 2 of the technical report visually outlines the overlap between SIC codes in DCMS sectors, but not the value of GVA within these overlaps.
3.2 Sector findings
Of the DCMS Sectors, the Digital Sector contributed the most in GVA to the UK economy (£150.6bn), followed by Creative Industries (£115.9bn) and Tourism (£74.5bn). By comparison, the construction industry contributed £129.3bn, the automobile industry contributed £49.1bn, and agriculture £13.0bn[footnote 1].
The Creative Industries account for the majority of the growth in DCMS Sector GVA since 2010. 71.9% of the growth seen in the DCMS Sector total (excl. Tourism and Civil Society) was due to the Creative Industries, followed by the Digital Sector at 64.4%[footnote 2]. However, the Digital Sector has accounted for the majority of growth in the DCMS Sector total (excl. Civil Society) since 2018, at 91.7%.
Civil Society
Civil Society contributed £16.2bn in 2019. The contribution of Civil Society to the UK economy has increased from 0.6% in 2010 to 0.8% in 2019 (an estimate for the Civil Society sector expressed in chained volume measures is not currently available, so we can’t compare growth in the Civil Society sector to real terms growth in other DCMS sectors).
These estimates are likely to be an underestimate for the Civil Society sector. Further information on the Civil Society definition can be found in the technical report.
Note that volunteering, a key element of Civil Society, has not been included in the figures due to being part of the informal economy. As estimated in the ONS published Household Satellite Account, volunteering contributed £24bn in 2016 (this includes only formal volunteering activities). The 2018 estimate for volunteering has been delayed due to COVID-19.
Creative Industries
The Creative Industries contributed £115.9bn in 2019, accounting for 5.9% of UK GVA. The GVA of Creative Industries has increased by 5.6% between 2018 and 2019 and by 43.6% between 2010 and 2019 in real terms.
Creative Industries GVA has been growing faster than the UK economy since 2011, with large increases in GVA in real terms seen in both 2015 and 2019 (Figure 3).

Figure 3. Index of real-terms GVA growth for Creative Industries, All DCMS Sectors (excl. Tourism and Civil Society) and for total UK: 2010 to 2019 (2010=100)
The ‘IT, software and computer services’ subsector contributed the most towards Creative Industries GVA in 2019 at £47.0bn, accounting for 40.6%. This subsector accounted for 53% of growth in Creative Industries GVA between both 2018 and 2019, and 2010 and 2019. This subsector also sits entirely within the Digital sector, which may explain similar trends seen in both the Creative Industries and Digital Sector.
‘Film, TV, video, radio and photography’ was the next biggest contributor to growth in this sector, accounting for 39% of growth in Creative Industries GVA between 2018 and 2019. It was also the fastest growing sector between 2018 and 2019, increasing by 12.1% in real terms.
‘Advertising and marketing’ was the second biggest contributor to growth between 2010 and 2019, accounting for 19% of growth in Creative Industries GVA.
‘Design and designer fashion’ GVA has more than doubled in real terms between 2010 and 2019.
Cultural Sector
The Cultural Sector contributed £34.6bn in 2019, accounting for 1.8% of UK GVA. The GVA of the Cultural Sector has increased by 9.5% since 2018 and by 27.0% since 2010 in real terms.
Cultural Sector GVA has grown at a similar rate to the UK economy since 2010, with larger year-on-year fluctuations seen in 2015 and 2019 (Figure 4).

Figure 4. Index of real-terms GVA growth for Cultural Sector, All DCMS Sectors (excl. Tourism and Civil Society) and for total UK: 2010 to 2019 (2010=100)
The ‘Film, TV and music’ subsector contributed the most towards the Cultural Sector in 2019 (£21.7bn), accounting for 62.9%. This subsector accounted for 86% of growth in Cultural Sector GVA between 2018 and 2019 and 64% of growth between 2010 and 2019. It was also the fastest growing subsector between 2018 and 2019, increasing by 13.4% in real terms.
The ‘Arts’ sector was the next biggest contributor to growth in this sector, accounting for 6% of growth in Cultural Sector GVA between 2018 and 2019 and 25% of growth between 2010 and 2019.
These figures are likely to be an underestimate of the Cultural Sector. Further information on the limitations of the Culture Sector definition can be found in the technical report.
Digital Sector
The Digital Sector contributed £150.6bn in 2019, accounting for 7.6% of UK GVA. The GVA of the Digital Sector has increased by 6.1% between 2018 and 2019 and by 26.5% between 2010 and 2019 in real terms.
Digital Sector GVA was growing more slowly than the UK economy from 2010 to 2015. After growth in 2016, Digital Sector GVA has been increasing in line with the UK economy up until 2018, with further growth in 2019 (Figure 5).

Figure 5. Index of real-terms GVA growth for Digital Sector, All DCMS Sectors (excl. Tourism and Civil Society) and for total UK: 2010 to 2019 (2010=100)
‘Computer programming, consultancy and related activities’ contributed the most towards Digital Sector GVA (£55.6bn), accounting for 36.9% in 2019. This subsector accounted for 46% of growth in Digital Sector GVA between 2018 and 2019 and 58% of growth between 2010 and 2019. Some SIC codes within this sub sector overlap with the Creative Industries, which may explain similar trends seen for both the Digital Sector and Creative Industries.
‘Film, TV, video, radio and music’ was the next biggest contributor to growth in this sector, accounting for 31% of growth between 2018 and 2019.
‘Telecoms’ has been the biggest contributor of growth to Digital Sector GVA between 2010 and 2019, accounting for 20% of growth.
‘Information and service activities’ has been the fastest growing sector between 2018 and 2019, increasing by 20.7%.
‘Software publishing’ GVA has more than doubled between 2010 and 2019.
Gambling
Gambling contributed £8.3bn in 2019, accounting for 0.4% of UK GVA. The GVA of Gambling has increased by 45.1% between 2010 and 2019, but decreased by 2.7% between 2018 and 2019, in real terms.
Sport
Sport contributed £17.0bn in 2019, accounting for 0.9% of UK GVA. The GVA of Sport has increased by 2.9% between 2018 and 2019 and by 20.4% between 2010 and 2019, in real terms.
The figures above are based on the standard definition of the Sport sector, which includes only SIC codes which are predominantly sport. A different measure of the sport sector, the Sport Satellite Account, is also reported in the tables published alongside this report. The Sport Satellite Account is a more inclusive approach to measuring the sport sector, as it tries to account for the underlying economic influence sport has on sectors which are not primarily sport. For example, GVA for the sport sector is estimated at £48.9 bn in 2019 based on the Sport Satellite Account. However, there are limitations with the Sport Satellite Account approach. Further information can be found in the technical report.
Telecoms
Telecoms (which is also wholly within the Digital Sector) contributed £35.1bn in 2019, accounting for 1.8% of UK GVA. The GVA of Telecoms has increased by 0.2% between 2018 and 2019 and by 21.5% between 2010 and 2019, in real terms.
Tourism
Tourism contributed £74.5bn in 2019, accounting for 3.8% of UK GVA. The GVA of Tourism has increased by 1.1% between 2018 and 2019 and by 11.4% between 2016 and 2019 in real terms (the largest relative growth since 2016 out of all DCMS sectors). The increase in Tourism GVA has accounted for 33% of the overall DCMS increase in GVA between 2016 and 2019.
Figures for the tourism sector are only available from 2016 due to data and methodology revisions.
4. Further information
The next update to these statistics will be released in late 2021 once the National Accounts have been published.
DCMS has developed a suite of economic estimates to understand the economic impact its sectors have on the UK economy. In combination with other economic indicators, GVA estimates help build a comprehensive picture of the UK economy, and of the DCMS Sectors’ importance within it. Upcoming work in the DCMS Economic Estimates series include:
- Regional GVA
- Business Demographics
- Trade in Services.
The responsible statistician for this release is Emma Scholey. For enquiries on this release, please email evidence@dcms.gov.uk.
For general enquiries contact: Department for Digital, Culture, Media and Sport, 100 Parliament Street, London, SW1A 2BQ. For media enquiries contact: 020 7211 2210.
DCMS statisticians can also be followed on Twitter via @DCMSInsight.
The DCMS-Sector Economic Estimates were designed as National Statistics on 26 June 2019. This followed a report by the Office for Statistics Regulation in December 2018, which stated that the series could be designated as National Statistics subject to meeting certain requirements. Since the report, we have striven to improve our publications by providing summaries of other notable sources of data, more detail on the nature and extent of the overlap between the sectors, and further information on the quality and limitations of the data. We will continue to improve the series in the future, in line with the recommendations of the report. We encourage our users to engage with us so that we can improve our statistics and identify gaps in the statistics that we produce.
-
The construction industry is defined as Section F, the automobile industry is defined as Divisions 29 and 45, and the agriculture industry is defined as Section A. ↩
-
Users should be aware that there is overlap between DCMS sectors so the estimate for ‘All DCMS Sectors’ is lower than the sum of the individual sectors. Some large industries are found within multiple sectors and are likely to drive trends in the same way for both sectors. ↩