Cyber security longitudinal study - wave two
Updated 19 December 2022

© Crown copyright 2022
This publication is licensed under the terms of the Open Government Licence v3.0 except where otherwise stated. To view this licence, visit nationalarchives.gov.uk/doc/open-government-licence/version/3 or write to the Information Policy Team, The National Archives, Kew, London TW9 4DU, or email: psi@nationalarchives.gov.uk.
Where we have identified any third party copyright information you will need to obtain permission from the copyright holders concerned.
This publication is available at https://www.gov.uk/government/publications/cyber-security-longitudinal-survey-wave-two-results/cyber-security-longitudinal-study-wave-two
Executive summary – key findings
The Cyber Security Longitudinal Survey (CSLS) aims to better understand cyber security policies and processes within medium and large businesses and high-income charities, and to explore the links over time between these policies and processes and the likelihood and impact of a cyber incident.
This is the second research year (or wave) of a three-year study, and therefore this report includes comparisons with CSLS Wave One in 2021, as well as descriptive findings for all businesses and charities interviewed in Wave Two and summaries specific to organisations interviewed in both waves. Further insight into longitudinal trends in the findings will be available in the Wave Three report, upon completion of the three-year study. The main stage survey for Wave Two took place between 8 April and 28 June 2022. Qualitative interviews took place between June and July 2022.
This report also summarises additional insight from 30 follow-up qualitative interviews with survey respondents, that covered topics such as cyber security resilience, awareness and usage of the Cyber Essentials standard, record keeping, internal and external reporting, responsibility for cyber security, and monitoring of supply chains. These are intertwined with reporting on quantitative findings.
Overall, the cyber resilience profile of organisations continues to vary between businesses and charities as well as by business size and sector. Businesses are more likely than charities to have formal, written cyber security policies and processes in place. Large businesses (250+ staff), and particularly very large businesses (500+ staff), demonstrate greater cyber maturity compared to medium businesses and charities. However, overall, organisations’ approach to cyber is likely to be more reactive than proactive, with many struggling to get senior level buy-in to improve their cyber defences. Below is a more detailed summary of key findings from each chapter of this report.
The survey results are subject to margins of error, which vary with the size of the sample and the percentage figure concerned. For all percentage results, subgroup differences by size, sector and survey answers have been highlighted only where statistically significant[footnote 1] [footnote 2] (at the 95% level of confidence).
Cyber profile of organisations
In the last few years, technology has dramatically changed the way that people work, ranging from remote working through to the use of cloud storage. In response, organisations have had to adapt to these changing needs and consider the ways that cyber security requirements have changed in this new environment. To understand some of the ways that larger organisations have changed, a selection of new technologies were included in this survey.
An organisation’s cyber profile refers to the organisation’s baseline set of minimal cyber security requirements for mitigating described threats and vulnerabilities. As in Wave One (2021), almost all businesses and charities (98% and 97% respectively) use a cloud-based or physical server to store data or use a virtual private network (VPN) that allows staff to connect remotely.
Around eight in ten businesses (82%) and charities (75%) with a VPN require their staff to use it when accessing the organisation’s network or files from outside the workplace. These figures are in line with the Wave One survey. The requirement is most strongly enforced among businesses that have a specific cyber security insurance policy.
Although more businesses use physical than cloud-based servers, the opposite is true among charities, where there remains greater adoption of cloud-based data storage. Eight in ten charities store data or files in the cloud.
Businesses employ more controls than charities in terms of how staff access their network when working remotely. A majority of charities (54%) allow access via personally owned devices, compared to around one in three businesses (36%). Both figures are similar to the baseline survey (59% and 37% respectively).
Figure E.1: Businesses and charities overall and by business size (showing weighted %)
Are staff permitted to access your organisation’s network or files through personally owned devices? (% Yes)
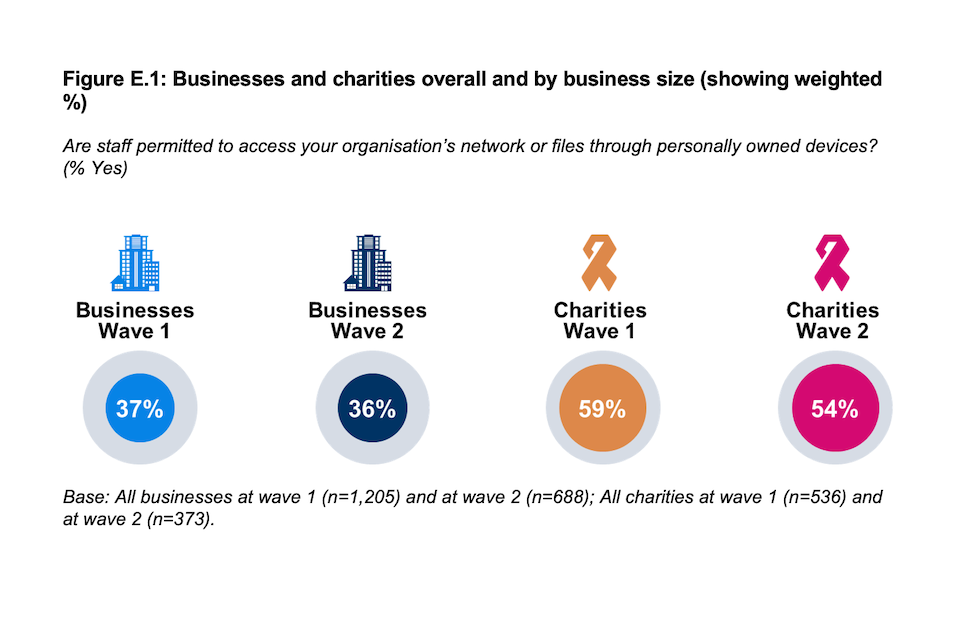
Are staff permitted to access your organisation’s network or files through personally owned devices? (% Yes.) Businesses wave one: 37%; Businesses wave two: 36%; Charities wave one 59%; Charities wave two 54%.
Base: All businesses at wave 1 (n=1,205) and at wave 2 (n=688); All charities at wave 1 (n=536) and at wave 2 (n=373).
Although correlation does not mean causation, the higher the proportion that allow staff to access their network via personal devices the more likely an organisation is to report a data security incident. This relationship is most evident within charities.
Cyber security policies
This chapter investigates the cyber security policies of businesses and charities. Monitoring changes to these policies over time helps us better understand how organisations are evolving their cyber defences. The chapter also helps explore the impact this may have on organisations’ resilience to incidents.
There has been an increase in the proportion of organisations adopting a more rigorous approach to cyber security. For both businesses and charities there is generally more documentation, greater uptake of specific cyber security insurance and more training of ‘non-specialist’ staff.
Approximately nine in ten organisations (86% of businesses and 91% of charities) have in place at least one of the five documents considered part of an effective cyber security strategy (see Figure 3.1 for more information). While this is almost identical to the Wave One share for charities (92%), it represents an increase among businesses (82% in Wave One).
In the last twelve months approximately six in ten businesses (58%) and charities (62%) have delivered cyber security training or awareness raising sessions specifically for staff and/or volunteers who are not directly involved in cyber security. Both shares represent an increase from the baseline survey (48% and 55% respectively).
Cyber security processes
This chapter provides insight on the uptake of cyber security certifications by organisations. It also explores the cyber security processes that organisations have in place, the technical controls required to attain Cyber Essentials certification, and actions taken over the last twelve months to improve or expand various aspects of organisations’ cyber security.
Compared to Wave One, more businesses (40% vs. 32%) and charities (36% vs. 29%) are certified to at least one of three certifications asked about (the Cyber Essentials standard, Cyber Essentials Plus standard and ISO 27001). The Cyber Essentials standard is most often adhered to by businesses (25%) and charities (28%) with both shares higher than in Wave One.
Figure E.2: Organisations with cyber security certification
Which of the following standards or accreditations, if any, does your organisation adhere to? (% Yes to at least one of three certifications asked about)
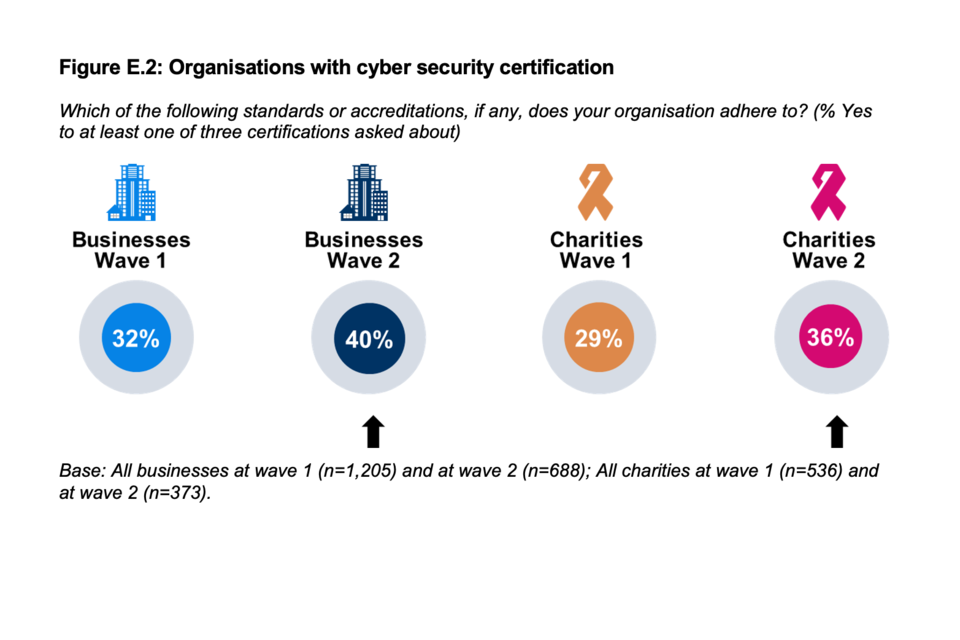
Organisations with cyber security certification. Businesses wave one: 32%; Businesses wave two: 40%; Charities wave one 29%; Charities wave two 36%.
Base: All businesses at wave 1 (n=1,205) and at wave 2 (n=688); All charities at wave 1 (n=536) and at wave 2 (n=373).
Even if they have not been Cyber Essentials certified, six in ten businesses (61%) and charities (58%) operate all five of the technical controls required to attain the Cyber Essentials standard. These figures are similar to the baseline survey.
Outside of the technical controls required to attain Cyber Essentials certification, most organisations have specific rules for storing and moving files containing people’s personal data (85% of businesses, 86% of charities), backing up data securely via a cloud device (75% vs. 85%), backing up data by other means (70% vs. 63%) and monitoring user activity (66% vs. 64% respectively). These findings were in line with the previous year. Charities are more likely than in Wave One and more inclined than businesses to securely back up data via a cloud service.
While the proportion has increased from Wave One, it remains the case that only around one in five businesses (19%) include cyber security in their annual reports. A similar proportion of charities (18%) do this, which is almost identical to Wave One.
Reflecting the findings of the baseline survey, almost nine in ten organisations (86% of businesses and 87% of charities) continue to take at least one action to identify the cyber security risks their organisation faces. One in five (21% of businesses and 19% of charities) report taking all four measures which is also in line with the Wave One survey. Medium-sized businesses show less willingness to take steps to identify cyber security risks and are half as likely as large businesses to have taken all four steps (18% vs. 37%).
Figure E.3: Actions taken to identify cyber security risks
Which of the following, if any, have you done over the last 12 months to identify cyber security risks to your organisation? (% Yes to Any)
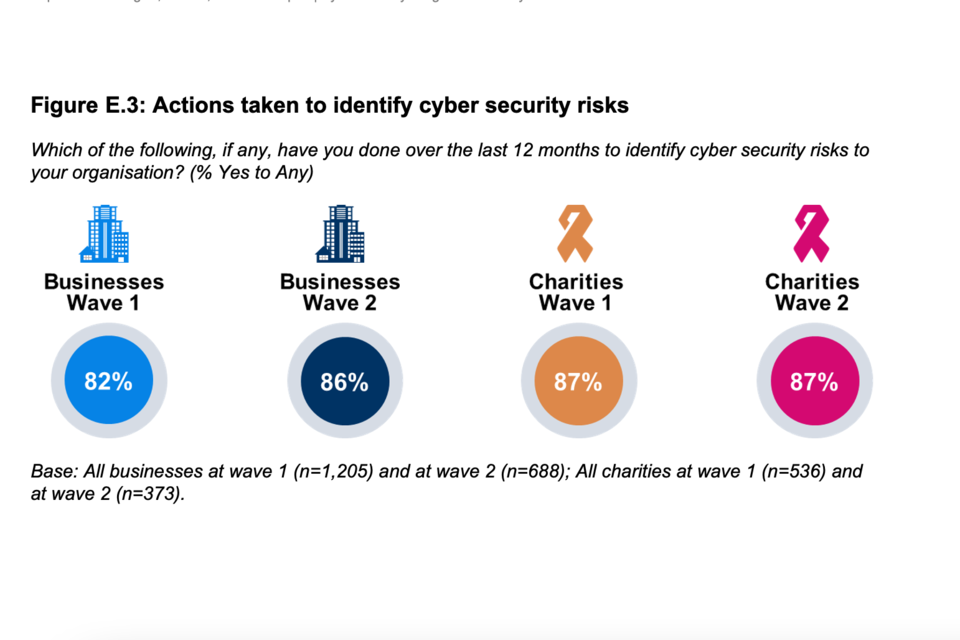
Actions taken to identify cyber security risks. Businesses wave one: 82%; Businesses wave two: 86%; Charities wave one 87%; Charities wave two 87%.
Base: All businesses at wave 1 (n=1,205) and at wave 2 (n=688); All charities at wave 1 (n=536) and at wave 2 (n=373).
The majority of both businesses and charities took steps to improve their cyber defences and over the past twelve months, almost nine in ten businesses (85%) and charities (86%) have taken at least one action to expand or improve an aspect of their cyber security. For businesses this represents an increase from Wave One (79%). Charities are equally as likely as businesses to have made efforts to expand or improve aspects of their cyber security although they are less likely than businesses to have strengthened the way they monitor systems or network traffic.
Fewer than three in ten businesses (26%) or charities (28%) have formally addressed the potential cyber security risks associated with their suppliers/ partners. These findings were in line with the baseline survey.
Board involvement
This chapter investigates the level of awareness and engagement with cyber security among board members, including any training received and its frequency.
More businesses than charities have board oversight of cyber security risks (54% vs. 41%). In neither type of organisation has there been a change since Wave One in the proportion reporting a board member with specific responsibility for cyber security matters.
Six in ten businesses (61%) and charities (60%) have a designated staff member responsible for cyber security, who reports directly to the board. For businesses this represents an increase (from 55% in Wave One).
Around half of businesses (49%) say their board discusses cyber security at least quarterly (when don’t know responses are excluded). This is higher than among charities (38%), as was the case in Wave One. These findings were in line with the previous year. Around one in six businesses (15%) and charities (18%) report that their board never discussed or received updates on cyber security over the last twelve months (again excluding don’t know responses), broadly in line with the baseline findings (19% of businesses and 20% of charities.)
It continues to be the case that board members have received cyber security training in fewer than half of organisations (45% of businesses and 34% of charities). However, for businesses this represents an increase from 35% in Wave One. Further, at least one member of the boards of businesses that have received a security certification are more likely to have received some training (65% of businesses adhering to ISO 27001, 66% of businesses that are adhering to Cyber Essentials Plus). This is almost double the proportion of businesses with no training (36%).
Where board members do receive cyber security training, this tends to happen no more than once a year. Around one quarter of businesses (23%) and almost four in ten charities (39%) report the training as being a one-off or less than once a year. Taken together the data suggest that senior level training is not widespread, nor delivered on a frequent basis.
Sources of information
This chapter discusses the use of information or guidance from the National Cyber Security Centre (NCSC) by businesses and charities[footnote 16]. It goes on to discuss the extent to which various stakeholders influence organisations’ policies and processes related to cyber security.
Around one in three businesses (32%) have used information or guidance from the NCSC in the last year, up from 23%) in Wave One. A similar increase is reported by charities (from 32% to 42%). Usage of the NCSC guidance is higher among those that have experienced a cyber security incident (38% usage among those that have experienced a cyber security incident vs 20%).
Figure E.4: Use of NCSC information or guidance
In the last 12 months, has your organisation used any information or guidance from the National Cyber Security Centre (NCSC) to inform your approach to cyber security? (% Yes)
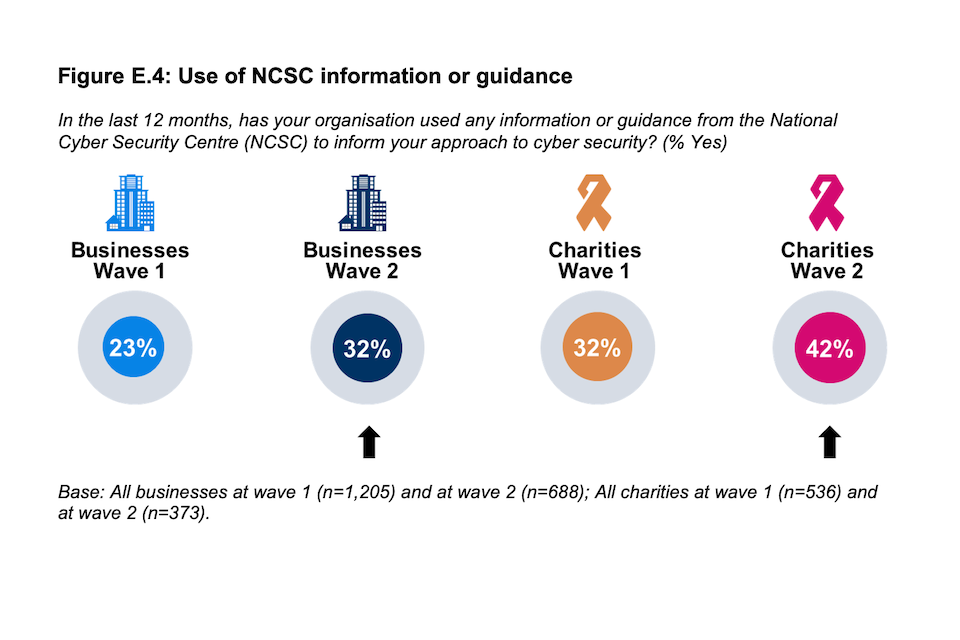
Use of NCSC information or guidance. Businesses wave one: 23%; Businesses wave two: 32%; Charities wave one 32%; Charities wave two 42%.
Base: All businesses at wave 1 (n=1,205) and at wave 2 (n=688); All charities at wave 1 (n=536) and at wave 2 (n=373).
Among organisations that have used NCSC guidance, GDPR guidance is the most common type of information used by both businesses (66%) and charities (63%). Businesses are more likely to have used the Cyber Assessment Framework, weekly threat reports and Cyber Security Board Toolkit than they were in Wave One.
External IT or cyber security consultants are the greatest external influence on the cyber security actions of both businesses (53%, up from 47% in Wave One) and charities (56%, consistent with Wave One). Insurers are the next largest influence on both types of organisations (35% of businesses; 41% of charities) and to a greater degree (up from 26% of businesses and 30% of charities in Wave One).
Businesses are more likely to have reviewed or changed their cyber security processes or policies as a result of another organisation in their sector experiencing a cyber security incident (16%) than as a result of another organisation implementing a similar measure (10%). The same applies to charities (20% vs. 14%). These findings are all consistent with Wave One.
Cyber incident management
This chapter captures the proportion of organisations that have written processes for cyber security incident management and what these may cover.
While the majority of organisations (businesses and charities) document processes for managing cyber security incidents, almost four in ten do not. Documentation of incident management is particularly prevalent among very large businesses with 500+ employees (71%). This is in line with findings from Wave One.
Among those businesses with written incident management processes, almost nine in ten (85%) include guidance for reporting incidents externally, for instance to regulators or insurers. This represents an increase from Wave One (77%).
The content of charities’ written incident management processes is very similar to that of businesses. For example, almost nine in ten charities with written processes (86%) include guidance for reporting incidents externally. The elements of charities’ incident management processes are almost identical to those reported in Wave One.
The overall incidence of such processes has not increased substantially since the baseline survey, and where processes are in place they tend to be treated as passive rather than dynamic tools. Relatively few organisations that have them in place (43% of businesses and 33% of charities) carry out exercises to test their efficacy.
Prevalence and impact of cyber security incidents
This chapter looks at the different kinds of cyber incidents experienced by organisations and their impact and outcome.
More charities report cyber security incidents in general (81%, up from 74% in Wave One) and phishing attacks (77%, up from 69% in Wave One). There are no notable changes among businesses.
Figure E.5: Prevalence of cyber security incidents
Have any of the following happened to your organisation in the last twelve months? (% Yes to Any)
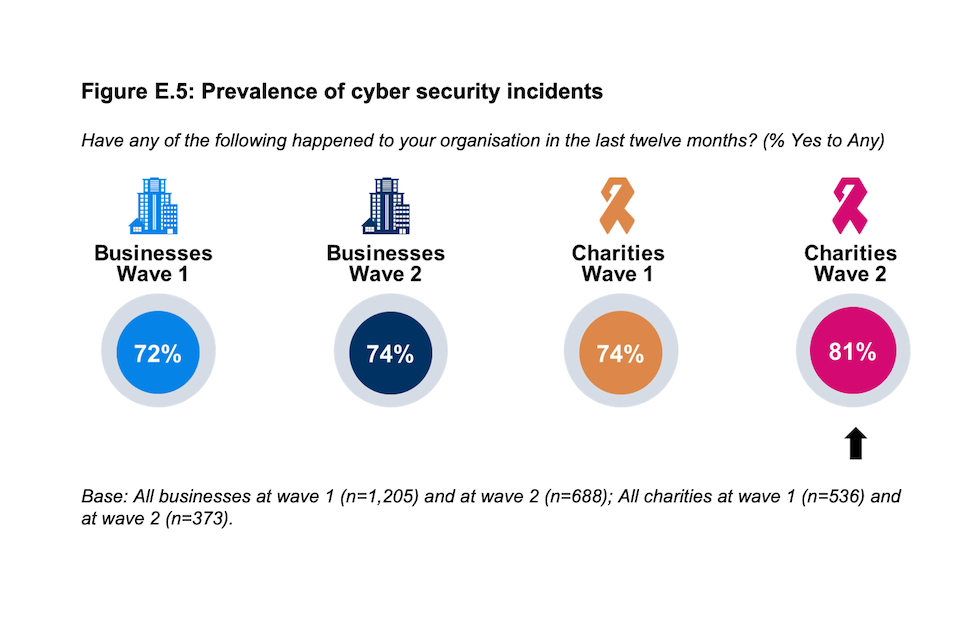
Prevalence of cyber security incidents. Businesses wave one: 72%; Businesses wave two: 74%; Charities wave one 74%; Charities wave two 81%.
Base: All businesses at wave 1 (n=1,205) and at wave 2 (n=688); All charities at wave 1 (n=536) and at wave 2 (n=373).
The frequency of cyber security incidents reported is consistent with Wave One – i.e., incidents are occurring with the same degree of frequency as reported in the baseline survey.
If phishing attacks are excluded from the analysis, the proportion of businesses experiencing cyber security incidents at least monthly has increased (from 53% to 60%).
The proportion of organisations that have been negatively impacted by cyber security incidents has remained constant (22% of businesses and 26% of charities experiencing at least one such incident in the last twelve months).
Among both businesses and charities, the wider organisational impact of cyber security incidents is almost identical to that recorded in Wave One.
Businesses (47%) are now more likely to have an established rule or policy not to make ransomware payments, both when compared to Wave One (an increase from 41%) and charities (39% in Wave Two, unchanged from 40% in Wave One).
Importantly, organisations that adhere to one or more cyber security certifications are more likely to report having experienced a cyber security incident. Four in five businesses (81%) adhering to the Cyber Essentials Plus standard experienced a phishing incident in the last year compared to 68% of businesses not adhering to any certifications. Additionally, nearly six in ten (57%) businesses adhering to the Cyber Essentials Plus standard say people impersonated their organisation in emails or online, compared to 41% of businesses not adhering to any certifications.
This would suggest that the organisations could be responding to threats to their cyber security by seeking to bolster their resilience through the certification. However, it is important to be cautious with this finding. It is also possible that the organisations that have achieved the Cyber Essentials certification have improved their monitoring protocols ensuring that they are to detect these attacks more effectively. Further, it is also a possible that organisations that are more likely to be exposed to a threat are also more likely to be aware of cyber security and these organisations therefore more likely to have acquired a Cyber Essentials certificate. As a result of this, pulling apart the correlations is difficult.
Glossary
| Term | Definition |
|---|---|
| Baseline survey | Also see the Wave One survey. The first research year of the survey that took place. |
| Cloud computing | Cloud computing uses a network of external servers accessed over the internet, rather than a local server or a personal computer, to store or transfer data. This could be used, for example, to host a website or corporate email accounts, or for storing or transferring data files. |
| Cyber security | Cyber security includes any processes, practices or technologies that organisations have in place to secure their networks, computers, programs or the data they hold from damage, attack or unauthorised access. |
| Cyber attack | A cyber attack is a malicious and deliberate attempt by an individual or organisation to breach the information system of another individual or organisation. |
| Cyber profile | A cyber profile is a baseline set of minimal cyber security requirements for mitigating described threats and vulnerabilities, as well as supporting compliance requirements for a defined scope and type of a particular use case (e.g., industry, information system(s)), using a combination of existing cyber security guidance, standards and/or specifications baseline documents or catalogues. |
| Impact | A negative impact on organisations did not have to involve a material loss. This could be issues relating to staff disruption or implementing new measures in the organisation. |
| Large business | Businesses with 250 employees or over |
| Longitudinal Survey | A longitudinal survey is a research design that involves repeated observations of the same variables (e.g., people or businesses) over short or long periods of time |
| Malware | Malware (short for “malicious software”) is a type of computer program designed to infiltrate and damage computers without the user’s consent (e.g., viruses, worms, Trojan horses etc). |
| Managed Service Provider (MSP) | A supplier that delivers a portfolio of IT services to business customers via ongoing support and active administration, all of which are typically underpinned by a Service Level Agreement. A Managed Service Provider may provide their own Managed Services or offer their own services in conjunction with other IT providers’ services. |
| Medium business | Businesses with 50 to 249 employees |
| Outcome | A negative outcome of an attack involved a material loss from an organisation, such as a loss of money or data. |
| Patch management | Having a policy to apply software security updates within 14 days of them being released |
| Penetration testing | Penetration testing is where staff or contractors try to breach the cyber security of an organisation on purpose, in order to show where there might be weaknesses in cyber security. |
| Personally-owned devices | Personally-owned devices are things such as smartphones, tablets, home laptops, desktop computers or USB sticks that do not belong to the company, but might be used to carry out business-related activities. |
| Phishing | Fraudulent attempts to extract important information, such as passwords, from staff with infiltration through a link or attachment sent via email. |
| Ransomware | A type of malicious software designed to block access to a computer system until a sum of money is paid. |
| Removable devices | Removable devices are portable things that can store data, such as USB sticks, CDs, DVDs etc. |
| Restricting IT admin and access rights | Restricting IT admin and access rights is where only certain users are able to make changes to the organisation’s network or computers, for example to download or install software. |
| Security breach | A security breach is any incident that results in unauthorised access of data, applications, services, networks and/or devices by bypassing their underlying security mechanisms. |
| Smart devices | Network connected devices, like personal assistants, locks, alarms, or thermostats. |
| Social engineering | Fraudulent attempts to extract important information, such as passwords, from staff with infiltration through an impersonation attempt of the organisation. |
| Threat intelligence | Threat intelligence is where an organisation may employ a staff member or contractor or purchase a product to collate information and advice around all the cyber security risks the organisation faces. |
| Two-Factor Authentication | Two-Factor, or Multi-Factor, Authentication is an electronic authentication method in which a user is granted access to a network or application only after successfully presenting two or more pieces of evidence to an authentication mechanism (e.g., a password and a one-time passcode). |
| Wave One Survey | Also see Baseline survey. The first research year of the survey that took place. |
Chapter 1- Introduction
1.1 Background to the research
Publication date: 2022
Geographic coverage: United Kingdom
The Department for Digital, Culture, Media and Sport (DCMS) commissioned the Cyber Security Longitudinal Survey of medium and large UK businesses (50+ employees) and high-income charities (annual income of more than £1m) as part of the National Cyber Security Programme. The findings will evaluate long-term links between the cyber security policies and processes adopted by these organisations, and the likelihood and impact of a cyber incident. It also supports the Government to shape future policy in this area, in line with the National Cyber Strategy 2022, and will inform future government cyber interventions and support future strategies with quality evidence.
There will be three annual waves of this study overall. Due to the longitudinal nature of the study, the aim is to track trends over time and speak largely with the same organisations in each wave. This report is based on Wave Two (2022) data that begins to provide longitudinal analysis when compared to the Wave One (2021) baseline data. The design of this research was influenced by a study DCMS previously commissioned to investigate the feasibility of creating a new longitudinal study of large organisations.
The core objectives of this study are to:
- Explore how and why UK organisations are changing their cyber security profile and how they implement, measure, and improve their cyber defences
- Provide a more in-depth picture of larger organisations, covering topics that are lightly covered in the Cyber Security Breaches Survey (CSBS), such as corporate governance, supply chain risk management, internal and external reporting, cyber strategy and cyber insurance
- Explore the effects of actions adopted by organisations to improve their cyber security on the likelihood and impact of a cyber incident
1.2 Difference from the Cyber Security Breaches Survey
This study differs from the CSBS in multiple important respects. Firstly, it uses a longitudinal approach, where the aim is to track changes in cyber resilience over time, whereas the CSBS uses a cross-sectional sample that provides a snapshot of cyber resilience. This three-year longitudinal study collects data from the same unit (businesses or charities) on more than one occasion, to analyse the link between large and medium organisations’ cyber security behaviours and the extent to which they influence the impact and likelihood of experiencing an incident over time. In comparison, results from CSBS track changes over time, and provides a static view of cyber resilience at a given time.
Secondly, this survey focuses only on medium, large and very large businesses, and high-income charities whereas the CSBS includes all businesses (micro, small, medium, and large), all charities, and educational institutions. Additionally, different questions are used, so while there are some similarities in the questions and topics covered by the two surveys, results are not comparable. Finally, as previously discussed, the two studies have different objectives.
The CSBS is an official government statistic, and representative of all UK businesses, charities, and educational institutions. Therefore, for overall statistics on cyber security, results from CSBS should be used. Further detail on overlapping questions can be found in the Cyber Security Longitudinal Survey Technical Report.
Please visit the gov.uk website to see publications of the Cyber Security Breaches Survey.
1.3 Methodology
There are two strands to the Cyber Security Longitudinal Survey:
- Ipsos undertook a random probability multimode[footnote 3] (telephone and online) survey covering 688 businesses and 373 UK registered charities between April and June 2022[footnote 4]. Of these, 883 interviews (83.2%) were completed via telephone and 178 interviews (16.8%) were completed through the online option. The data for businesses and charities have been weighted to be statistically representative of these two populations.
- Subsequently, 30 in-depth interviews were conducted in July and August 2022, to gain further qualitative insights from some of the organisations that participated in the quantitative survey.
This longitudinal study aims to track changes over time, so follows the same organisations in all three annual waves. In Wave One, 1,404 organisations (955 businesses and 450 charities) agreed to be recontacted in Wave Two. Around half (674 completed interviews with repeat organisations) of these were retained for Wave Two (2022). This constitutes the majority of completed interviews; 70% of businesses interviewed in Wave Two were also interviewed in Wave One, and the same applies to 64% of charities. To supplement the longitudinal panel sample, 387 interviews were completed from a fresh (or top-up) cross-sectional sample.
The Wave Two sample included eleven interviews with businesses that were eligible (had 50 or more employees) in Wave One but had dropped below this figure in Wave Two.
To avoid possible selection bias, the ‘fresh’ business sample was selected using random probability sampling. The business sample was proportionally stratified by region, and disproportionately stratified by size and sector. More technical details and a copy of the questionnaire are available in the separately published Technical Annex.
Profile of survey respondents
Figure 1.1 Businesses and charities overall and by business size (showing weighted %)
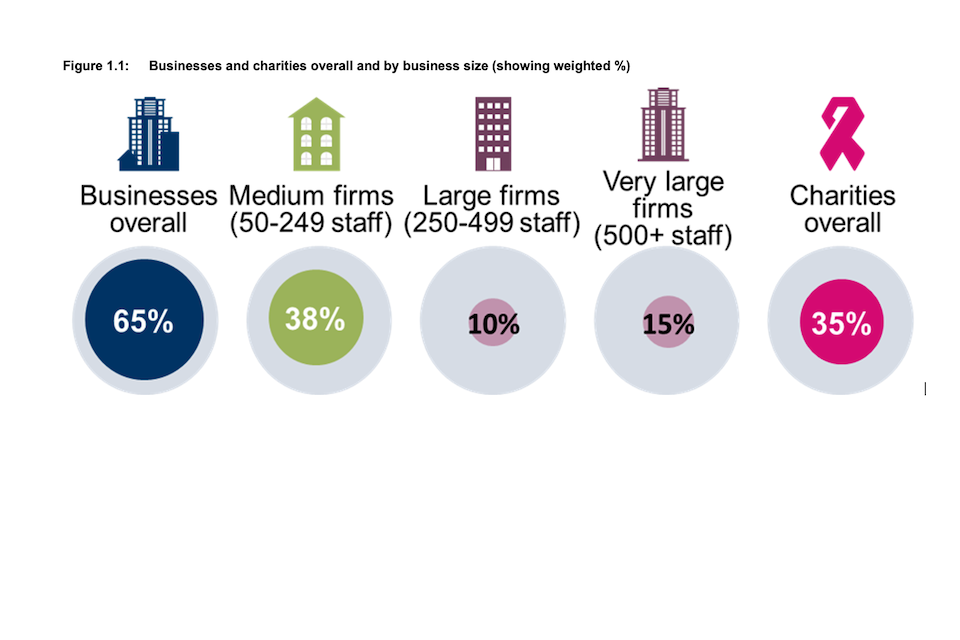
Figure 1.1 Businesses and charities overall and by business size
Base: All businesses (n=688); Medium firms (n=408); Large firms (n=108); Very large firms (n=160), includes 11 panel businesses confirmed as eligible in Wave One but now with fewer than 50 employees and one panel business that could not confirm their current number of employees; All charities (n=373).
Figure 1.2 Businesses and charities by nation and region (showing weighted %)
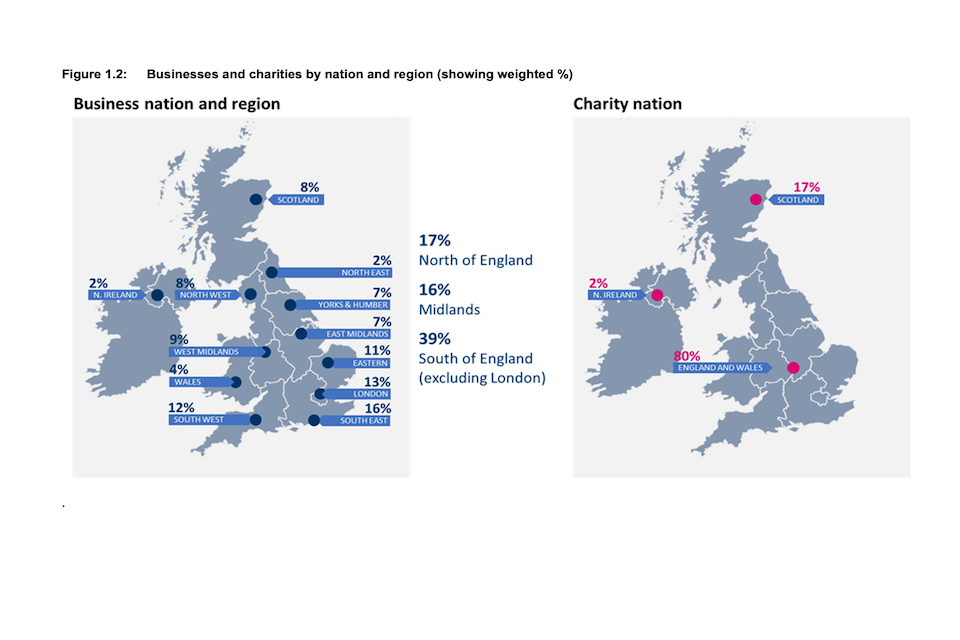
Figure 1.2: Businesses and charities by nation and region
Base: All businesses (n=688); All charities (n=373). Businesses in East Midlands (n=50); Eastern England (n=73); London (n=92); North East (n=12); North West (n=58); Northern Ireland (n=13); Scotland (n=54); South East (n=113); South West (n=85); Wales (n=27); West Midlands (n=63); Yorkshire and Humber (n=48); Charities in England and Wales (n=300); Northern Ireland (n=8); Scotland (n=65).
Figure 1.3 Businesses by sector (showing weighted %)
| Utilities and production | 18% |
| Administration and real estate | 15% |
| Retail and wholesale | 15% |
| Health, social care and social work | 9% |
| Professional, scientific and technical | 9% |
| Food and hospitality | 8% |
| Construction | 7% |
| Information and communications | 6% |
| Transport and storage | 5% |
| Finance and insurance | 4% |
| Education | 3% |
| Entertainment, service and membership organisations | 2% |
Base: All businesses (n=688); Administration and real estate (n=100); Construction (n=43); Education (n=17); Entertainment, service and membership organisations (n=19); Finance and insurance (n=28); Food and hospitality (n=63); Health, social care and social work (n=61); Information and communications (n=53); Professional, scientific and technical (n=45); Retail and wholesale (n=101); Transport and storage (n=35); Utilities and production (n=123)
Profile of qualitative respondents
Thirty follow-up interviews were carried out with representatives of organisations covered by the survey. They were selected in order to provide the following profile:
Table 1.1 Profile of qualitative respondents
| Category | Definition | Achieved |
|---|---|---|
| Type | Businesses | 20 |
| Charities | 10 | |
| Size (employees): Businesses only | Medium (50-249) | 8 |
| Large (250-499) | 6 | |
| Very large (500+) | 6 | |
| Sector: Businesses only | Broad mix of sectors | 20 |
| Region: Businesses only | Broad mix of regions | 20 |
Cyber roles and responsibilities
Where possible both the survey and follow-up qualitative interviews were addressed to the person at each organisation with greatest responsibility for cyber security. However, in many organisations there is nobody with specific responsibility for cyber security so, in these cases, interviews were completed with representatives that took responsibility for various aspects of IT and data security. This was particularly the case within organisations that do not have an in-house IT department.
There are variations by sector but in general large businesses (especially ‘very large’ enterprises) are the most likely to have employees with dedicated IT roles and they tend to have larger IT teams. This can be the case for many medium-sized businesses and charities, but often these smaller organisations fully outsource the management of IT and cyber security. This is in line with research from the 2022 Cyber Security Labour Market survey, which also found that medium and large businesses are the most likely to employ staff in dedicated cyber security related roles, rather than in general IT roles in which cyber security may not be their only or top priority.
Respondents with a general, or less technically specific role, tended to have lower awareness of cyber security issues. Meanwhile people at organisations where the cyber security role is combined with other responsibilities are often stretched. As a result, they may not be able to give cyber security matters as much attention as they would like.
1.4 Interpretation of findings
The survey results are subject to margins of error, which vary with the size of the sample and the percentage figure concerned. For all percentage results, subgroup differences by size, sector and other survey answers have only been highlighted where they are statistically significant[footnote 5] (at the 95% level of confidence).
There is a guide to statistical reliability at the end of this report.
Subgroup definitions and conventions
For the purposes of analysis, businesses are divided into medium (50-249 employees) and large enterprises (250+ employees).[footnote 6] In turn large businesses consist of both large (250-499 employees) and very large businesses (500+ employees). All charities included in the survey have a reported annual income of at least £1 million according to national charity regulator sample data.[footnote 7]
Where figures are marked with an asterisk (*) these refer to base sizes smaller than 50 and should be treated with caution.
1.5 Acknowledgements
Ipsos and DCMS would like to thank all the organisations and individuals that participated in the survey. We would also like to thank the organisations that endorsed the fieldwork and encouraged businesses and charities to participate, including:
- The National Cyber Security Centre (NCSC)
- The Home Office
- The Scottish Government
- The Charity Commission
- The Confederation of British Industry (CBI)
- The Institute of Chartered Accountants in England and Wales (ICAEW)
Chapter 2- Cyber profile of organisations
In the last few years, technology has dramatically changed the way that people work, ranging from remote working through to the use of cloud storage. In response, organisations have had to adapt to these changing needs and consider the ways that cyber security requirements have changed in this new environment. To understand some of the ways that larger organisations have changed, a selection of new technologies were included in this survey.
This chapter summarises the extent to which organisations use various types of data storage and the ways in which employees are able to access data. It also outlines the extent to which businesses and charities deploy cyber security tools that use Artificial Intelligence (AI) or machine learning. The final section of the chapter provides insight from the qualitative interviews and covers organisations’ use of external IT suppliers or cyber security consultants.
The ways in which organisations currently store and allow access to data show minimal changes from those reported in Wave One:
- As in the baseline survey, almost every business and charity (98% and 97% respectively in this wave) has a cloud or physical server to store data or uses a virtual private network (VPN) that allows staff to connect remotely.
- While more prevalent among charities (54% vs. 36% of businesses), the proportion of organisations that allow staff to access their network or files through personally owned devices is in line with Wave One (59% of charities and 37% of businesses).
- The proportion of businesses (82%) and charities (75%) that require staff to use their VPN when remotely accessing data is similar to that recorded in the baseline survey (79% and 72% respectively).
- For both businesses (25%) and charities (17%), the proportion employing AI or machine learning within their cyber security tools is in line with the baseline survey (20% of businesses and 15% of charities).
2.1 Data storage and access
In response to their workforces’ changing needs businesses and charities have had to reconsider the ways in which their data is stored and accessed. The ways in which organisations store and access their data files are very similar to those observed in the baseline survey. As in Wave One, almost all businesses (98%) and charities (97%) have one or more of a cloud or physical server to store data or use a virtual private network (VPN) that allows staff to connect remotely.
Businesses remain more likely than charities to use physical servers (81% vs.66%). In contrast, charities are more likely than businesses to store data or files in the cloud (80% vs. 70%).
To help build cyber resilience given the rise of remote working and concerns around access of sensitive data, Virtual Private Networks (VPN) have become a critical part of organisations’ cyber security. The proportion of organisations, either businesses or charities, with a VPN that allows staff to connect remotely is almost the same as that recorded in the baseline survey. As in Wave One, around seven in ten (72%) businesses have a VPN, as compared to around six in ten charities (63%).
Figure 2.1: How organisations store or access their data and files
Does your organisation use or provide any of the following?
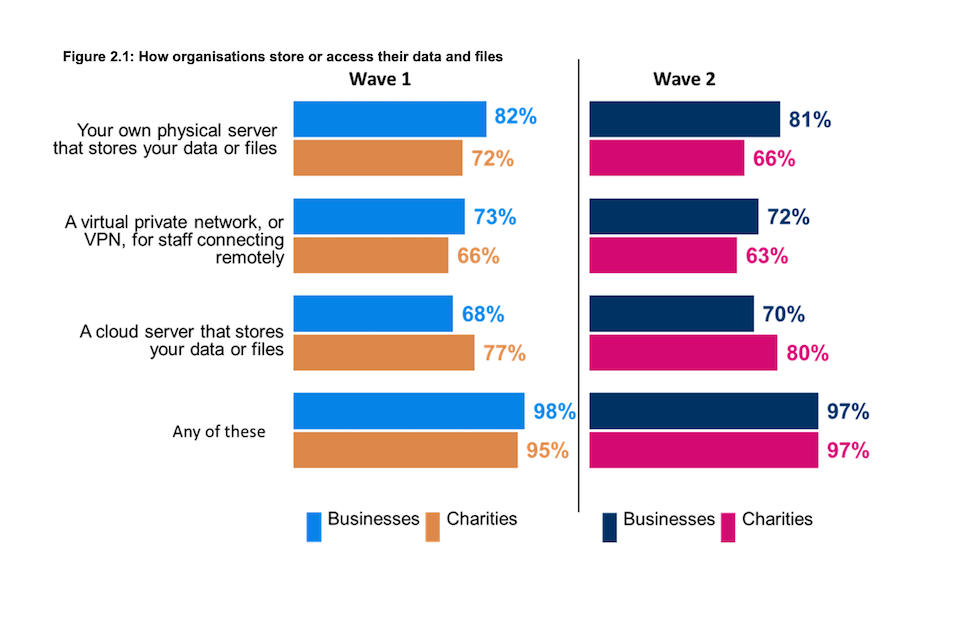
Figure 2.1: How organisations store or access their data and files
Base: All businesses at Wave 1 (n=1,205) and at Wave 2 (n=688); All charities at Wave 1 (n=536) and at Wave 2 (n=373). Don’t know not shown. Statistically significant changes between Wave 1 data and Wave 2 data are represented by an arrow.
2.2 Use of personal devices to access organisation’s network or files
The pandemic led many organisations to review their remote working capabilities and ensuring that employees can access sensitive data securely has become an important organisational need.
As in the baseline survey, charities are more likely than businesses to allow staff to access their organisation’s network or files through personally owned devices. A majority of charities (54%) allow this compared to around one in three businesses (36%). Neither figure is significantly different from Wave One.
This pattern also applies when looking specifically at the longitudinal sample within this study (organisations taking part in both Wave One and Wave Two). The share of businesses within this group that permit their staff to access their business’s network or files through personally owned devices is 37% (vs. 41% in Wave One), and for charities it is 54% (vs. 61% in Wave One).
Although correlation does not mean causation, those organisations that allow staff to access their network via personal devices appear more likely to have experienced a data security incident in the past twelve months. Of those businesses that have experienced an incident (other than ‘phishing’) in the past twelve months, 42% allow network access via personal devices. Where no incidents are reported the corresponding share is 28%. Among charities the difference is even greater with six in ten (60%) of those experiencing an incident allowing personal device access. For those charities experiencing no incidents the figure is lower (37%).
Figure 2.2: Use of personal devices to access organisation’s network or files
Are staff permitted to access your organisation’s network or files through personally owned devices? (% Yes)
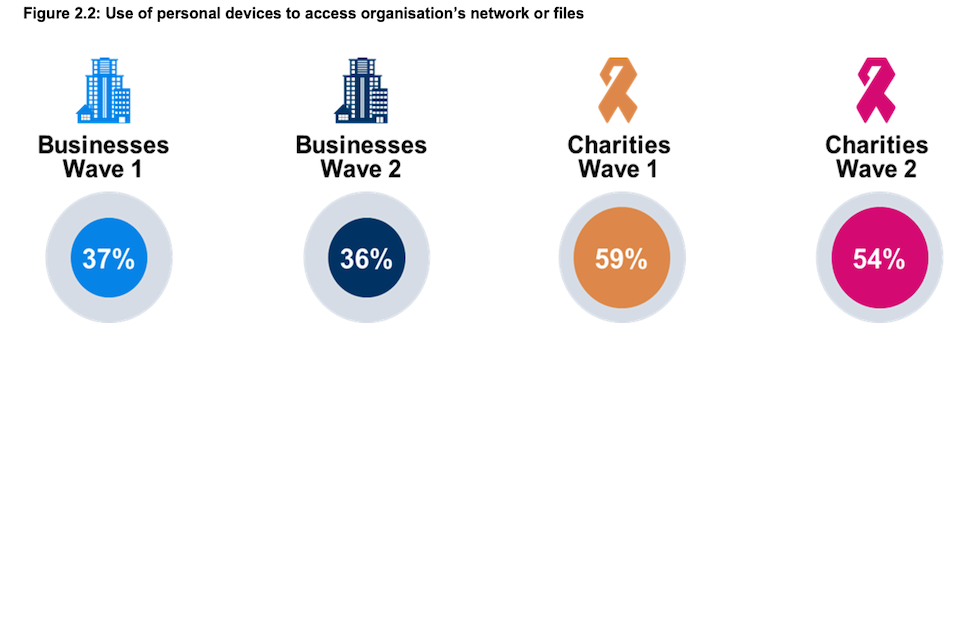
Figure 2.2: Use of personal devices to access organisation’s network or files
Base: All businesses at Wave 1 (n=1,205) and at Wave 2 (n=688); All charities at Wave 1 (n=536) and at Wave 2 (n=373). Statistically significant changes between Wave 1 data and Wave 2 data are represented by an arrow.
Among businesses with a VPN, four in five (82%) require their staff to use it when accessing the organisation’s network or files from outside the workplace. Although the figure is lower, three-quarters (75%) of charities with a VPN also require staff to use this when working remotely. Both figures are in line with the baseline survey (79% and 72% respectively for businesses and charities).
Perhaps reflecting the terms of the agreement, almost nine in ten (88%) businesses with a specific cyber security insurance policy require staff who are working remotely to connect via their VPN. However, this is not the case among charities. Charities with a specific cyber security insurance policy are no more likely than the average charity to require staff working outside the workplace to use their VPN for access (71% and 75% respectively).
The longitudinal sample behaves no differently to the overall sample in terms of the share of organisations that force staff to connect remotely using a VPN (83% of businesses in the longitudinal sample vs. 82% of all businesses, and 74% of charities in the longitudinal sample vs. 75% of all charities).
Figure 2.3: Use of VPNs outside the workplace
Are staff permitted to access your organisation’s network or files through personally owned devices (e.g., a personal smartphone or home computer)?
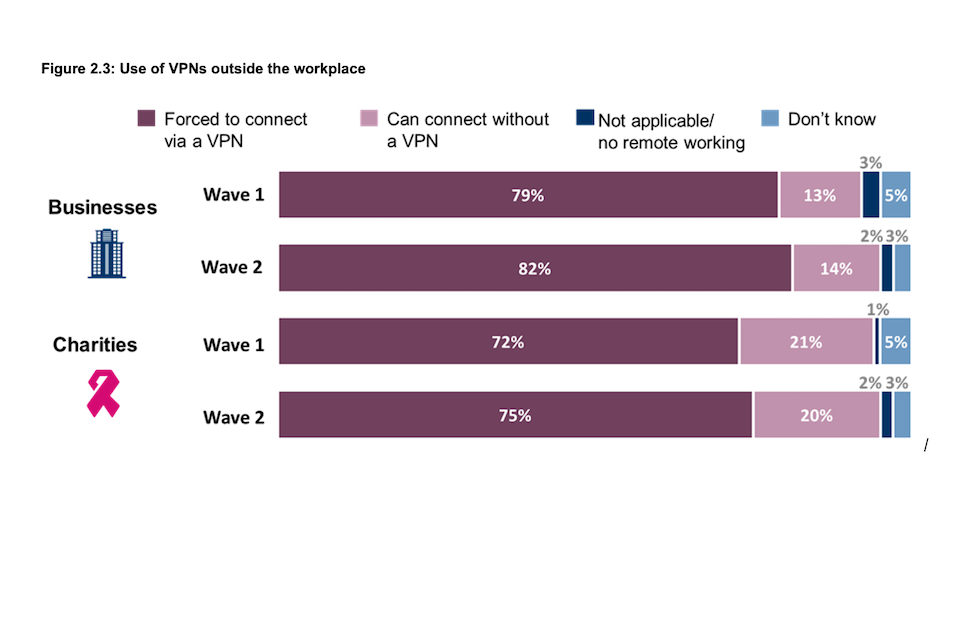
Figure 2.3: Use of VPNs outside the workplace
Base: All businesses with a VPN at Wave 1 (n=909) and at Wave 2 (n=525); All charities with a VPN at Wave 1 (n=354) and at Wave 2 (n=235). Statistically significant changes between Wave 1 data and Wave 2 data are represented by an arrow.
2.3 Use of artificial intelligence (AI) and machine learning
As pattern recognition algorithms can be applied to network data flows to automate threat detection, AI is an important element of cyber security. Meanwhile, machine learning is a subset of AI that can be used to support security measures by ensuring systems ‘remember’ and take account of any new patterns identified from recent incidents.
With one in four businesses (25%) using AI or machine learning, they are more likely than charities (17%) to be using cyber security tools that include this technology. Neither of these shares has changed significantly since the baseline survey (20% of businesses and 15% of charities).
The use of AI and machine learning is more prevalent in larger businesses with those employing 250+ employees (38%) twice as likely as medium-sized enterprises (21%) to say it is a feature of their cyber security tools. Possibly a function of the size of the organisation, use of AI and machine learning is also more common among businesses that have some form of accreditation or a specific cyber security insurance policy.
More than one-third (35%) of charities certified to the Cyber Essentials Plus standard report having cyber security tools that include AI and machine learning technology.
Figure 2.4: Use of AI or machine learning
Does your organisation deploy any cyber security tools that use AI or machine learning? (% yes)
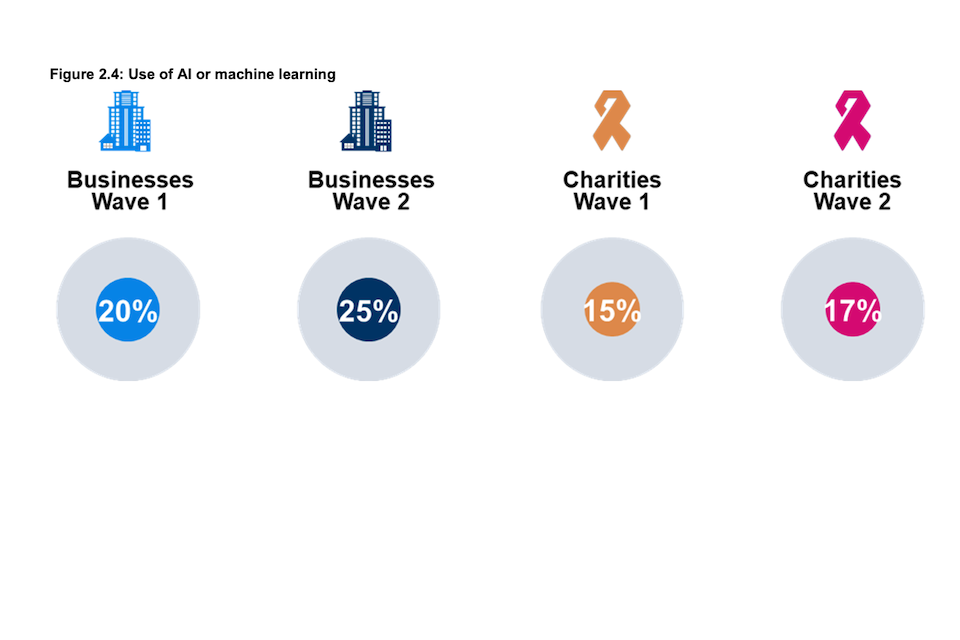
Figure 2.4: Use of AI or machine learning
Base: All businesses at Wave 1 (n=1,205) and at Wave 2 (n=688); All charities at Wave 1 (n=536) and at Wave 2 (n=373). Statistically significant changes between Wave 1 data and Wave 2 data are represented by an arrow.
2.4 Use of external IT providers
Many businesses and charities do not have the resources available to them to adequately adjust their cyber security infrastructure. To help them with this adjustment, they can outsource their technology requirements to external IT providers.
Within the qualitative interviews, businesses and charities were asked whether they use external IT suppliers or cyber security consultants. The majority did and for a variety of reasons. In some cases, organisations contracted external suppliers for specific, short-term tasks, such as penetration tests, or for site installations, while others received a more extensive IT management service.
Where external advice was used most extensively this tended to reflect a lack of in-house resources or knowledge. In some instances, especially for smaller organisations or organisations in less technical industries, this was considered more cost-effective than developing or maintaining in-house expertise.
We use external consultants to test security systems. We previously used NCC Group to do penetration tests then switched to a more local company for tests.
–Business, Medium, Information and Communication
Yes, we use several consulting companies. It saves us money as we started as a small family business so third-party companies remove the need for more hires. Consulting companies fulfil a fully managed cyber security service. Long-standing relationships that we trust.
–Business, Large, Administration
Yes, consultants are used. Data is hosted in a data centre – the platform is a service, so we get support for that. We also have other consultants from time to time, including one helping on ISO formalisation and some helping with pen tests. We go external because of a lack of skill in house, lack of knowledge, experience. It is often less expensive to have a consultant for a short period of time.
–Business, Medium, Information and Communication
They just cover my leave and are available for me to ask questions and seek advice. [They] do projects for us on request.
–Charity
Most relationships with external IT providers go back several years, such that some participants “inherited” the relationship on taking the role and therefore were not involved when the consultants were first engaged. In other cases, the relationship came out of their insurance arrangements or via other ‘channels.’ Only rarely were formal procurement procedures undertaken.
–Business, Large, Health, social care or social work
[We use] four different companies for penetration tests. [We are] provided with various cyber security specialists as part of our cyber insurance.
–Business, Large, Health, social care or social work
Yes, we use consultants, especially for pen tests. They are chosen through a strict procurement process. Costs are important here as well; it may sometimes prioritise the quality of consultancy. There has to be a level of trust when considering data and data security.
–Business, Medium, Information and Communication
Choosing external contractors will be decided by the manager who goes through a procurement process following approval and finance team review.
–Charity
Whichever approach was taken to choosing consultants, the trust involved in these relationships was highlighted as important to their continued success. Typically, these longer-term relationships with external consultants were characterised by a high level of trust in their expertise and security procedures.
Chapter 3- Cyber security policies
This chapter covers cyber security policies, including the documentation, cyber insurance policies and staff training organisations have in place that are crucial to building cyber resilience. Through the improvement of governance documentation and insurance policies, as well as ensuring that staff have the necessary skills, businesses and charities will be better placed to improve their cyber security.
In Wave Two, organisations do seem to be putting more cyber security policies in place, with businesses in particular having shown increased prevalence of many types of cyber security policy. Compared to Wave One, the findings of greatest note are:
- Approximately nine in ten organisations (86% of businesses and 91% of charities) have in place at least one of the five documents considered part of an effective cyber security strategy. While this is almost identical to the Wave One share for charities (92%), this represents an increase among businesses (82% in Wave One).
- The maintenance of a risk register that covers cyber security remains more common among charities (74%) than in businesses (50%).
- The proportions of businesses and charities with all five types of documentation in place are in line with Wave One, as are the shares for each of the individual documents.
- Both businesses (up from 53% to 61%) and charities (up from 66% to 74%) are more likely than in Wave One to possess some form of cyber security insurance, even if this is covered within a more general policy. The proportion of organisations with a specific cyber security policy is also higher than in Wave One (businesses up from 18% to 25%, charities from 24% to 32%).
- Both businesses and charities are more likely than in Wave One to have delivered cyber security training or awareness raising sessions specifically for individuals not directly involved in cyber security (businesses up from 48% to 58%, charities from 55% to 62%).
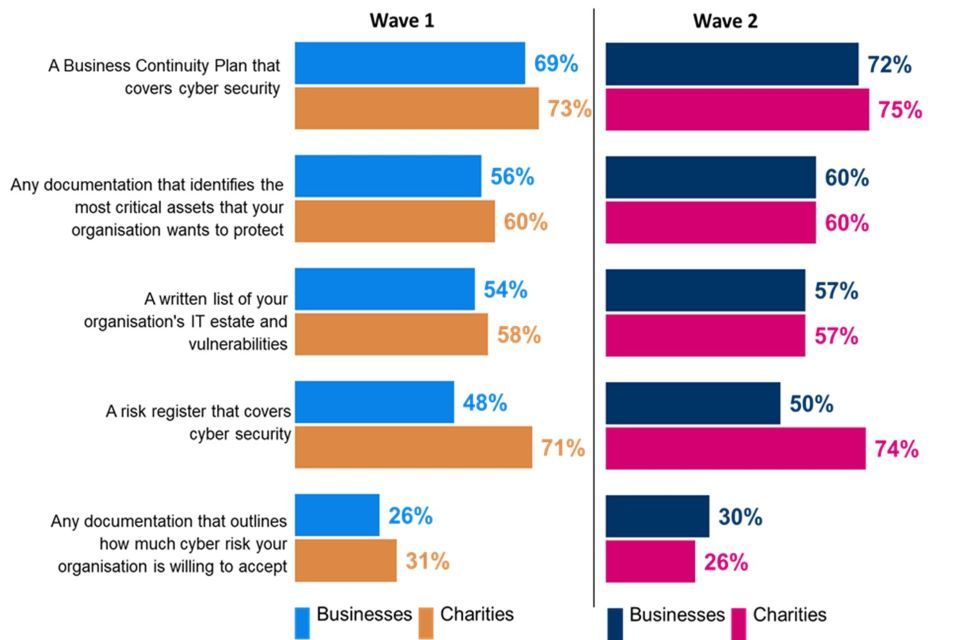
3.1 Governance and planning
As in Wave One, the survey asked about five types of documentation that organisations may have in place as part of an effective cyber security strategy. As detailed in Figure 3.1, these are: a Business Continuity Plan covering cyber security; documentation identifying critical assets; documentation of the organisation’s IT estate and vulnerabilities; a risk register that covers cyber security; and documentation of what is considered an acceptable level of cyber risk (‘risk appetite’).
The vast majority of organisations (86% of businesses and 91% of charities) have at least one of these documents in place. While the share of charities is almost identical to Wave One (92%), the share of businesses represents an increase (from 82%) since the baseline survey. One in five businesses (20%) and a slightly lower share of charities (15%) have all five types of documentation in place. There is little change from Wave One when a share of 17% was recorded for both business and charities.
As illustrated in Figure 3.1, a majority of businesses currently have each type of documentation in place, with the exception of ‘risk appetite’ documentation (30%). Most prevalent among businesses is a Business Continuity Plan (72%). However, as with all other types of documentation, usage is in line with Wave One.
Around one-quarter (26%) of very large businesses (500+ staff) have all five types of documentation in place, which is above the average figure. A ‘complete’ set of documentation is also more likely to be held where a business has some form of accreditation or board oversight of cyber security risk. For example, 48% of businesses certified to the ISO 27001 standard have all five types of documentation, as do 29% of businesses with a designated staff member responsible for cyber security who reports directly to the board.
The level of cyber security documentation within charities is similar to that of businesses. The only exception relates to the maintenance of a risk register that covers cyber security, which is more common in charities (74%) than in businesses (50%). Three-quarters of charities (75%) have a business continuity plan in place, but relatively few have established documentation that outlines the level of cyber security risk they are willing to take (26%). As with businesses, the shares for individual documents are in line with Wave One.
Figure 3.1: Documentation in place to help organisations manage their cyber security risks
Does your organisation have any of the following documentation in place to help manage cyber security risks?
Clustered bar charts for Wave 1 and Wave 2 showing the proportion of organisations who have documentation in place to help manage their cyber security risks. Responses are split between businesses and charities.
Base: All businesses at Wave 1 (n=1,205) and at Wave 2 (n=688); All charities at Wave 1 (n=536) and at Wave 2 (n=373). Statistically significant changes between Wave 1 data and Wave 2 data are represented by an arrow.
Figure 3.1.1: Documentation in place to help organisations manage their cyber security risks (NETS)
Does your organisation have any of the following documentation in place to help manage cyber security risks?
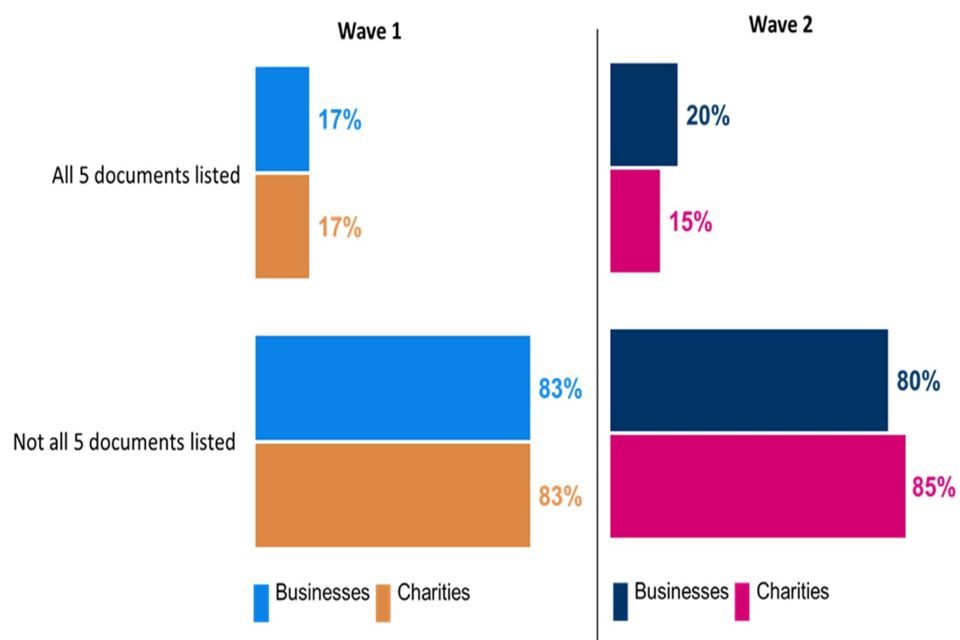
Clustered bar charts for Wave 1 and Wave 2 showing the proportion of organisations who have all 5 documents in place to help manage their cyber security risks, and the proportion who do not have all 5. Responses are split between businesses and charities.
Base: All businesses at Wave 1 (n=1,205) and at Wave 2 (n=688); All charities at Wave 1 (n=536) and at Wave 2 (n=373). Statistically significant changes between Wave 1 data and Wave 2 data are represented by an arrow.
3.2 Cyber insurance policies
Businesses and charities are both more likely than in Wave One to have some form of cyber insurance cover in place. Six in ten businesses have some form of cover (61%), compared with just over half (53%) in the baseline survey. The respective shares for charities are 74% and 66%.
The increase is driven by a general uplift in the proportion of organisations that have a specific cyber security policy, rather than this being covered as part of a broader insurance policy. One-quarter of businesses (25%) and one-third of charities (32%) have specific cyber security policies with both shares higher than in Wave One.
The Wave Two data shows that one in ten organisations (11% of businesses, 10% of charities) have no form of cyber security insurance in place. Many others remain unaware of what may be in place, and among businesses almost three in ten (28%) do not know what insurance cover they have against cyber incidents.
Insurance cover is more frequently in place where businesses have also made wider investment in cyber security protection. For example, businesses with all five types of documentation mentioned above are twice as likely to have specific insurance cover (41%) than those without all five (21%). In addition, 44% of businesses that are certified to the Cyber Essentials standard have specific cover, as do 36% of businesses with Cyber Essentials Plus certification and 30% with ISO 27001. The share among those businesses holding none of these three certifications is 21% and these businesses are equally as likely to have no insurance at all against cyber security incidents (18%).
Figure 3.2: Organisations with cyber insurance
Which of the following best describes your situation?
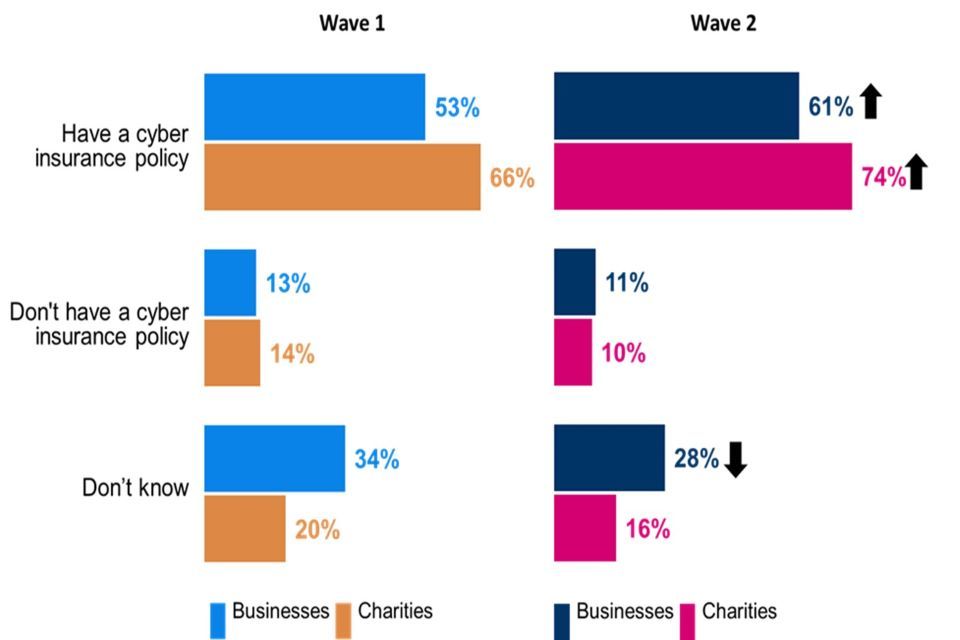
Clustered bar charts for Wave 1 and Wave 2 showing the proportion of organisations who have cyber insurance. Responses are split between businesses and charities.
Base: All businesses at Wave 1 (n=1,205) and at Wave 2 (n=688); All charities at Wave 1 (n=536) and at Wave 2 (n=373). Statistically significant changes between Wave 1 data and Wave 2 data are represented by an arrow.
The increase in the share of businesses with a specific cyber security insurance policy is reflected in the longitudinal sample interviewed in both Wave One and Wave Two (from 21% to 28%, which is higher than the 18% of the fresh business sample with a specific cyber insurance policy). In contrast, there is no difference in the shares of longitudinal and fresh charity sample with a specific cyber insurance policy (31% and 32% respectively).
Figure 3.3: Type of cyber insurance policy organisations have
Which of the following best describes your situation?
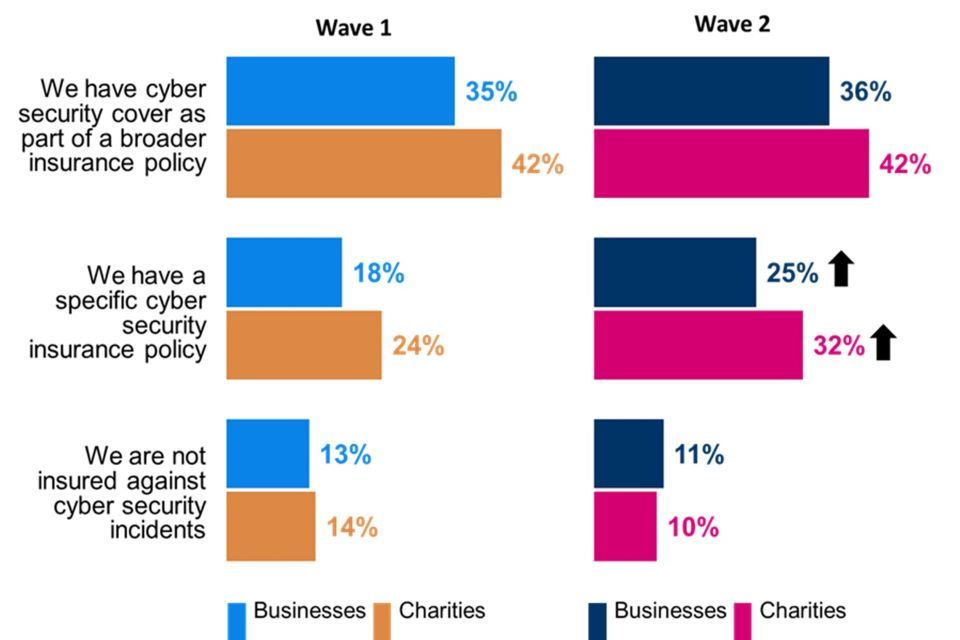
Clustered bar chart showing the proportion of organisations that different types of cyber security insurance. Responses are split between Wave 1 businesses, Wave 2 businesses, Wave 1 charities and Wave 2 charities.
Base: All businesses at Wave 1 (n=1,205) and at Wave 2 (n=688); All charities at Wave 1 (n=536) and at Wave 2 (n=373). Don’t know not shown. Statistically significant changes between Wave 1 data and Wave 2 data are represented by an arrow.
The qualitative interviews suggested that cyber security insurance can come at a considerable cost to the organisation, but where implemented it is regarded as being highly important. One business viewed it in the same way as buildings, contents, and public liability insurance. A charity representative said that although cyber insurance was a big cost it was “essential to protect themselves”.
In addition to the financial benefit and mitigation of potential losses, cyber security insurance can provide wider organisational benefits. Part of the process of obtaining this insurance is to review and document procedures, which can prove helpful.
We are learning and picking up from the questions we are being asked for cyber insurance forms.
–Business, Medium, Transport or Storage
Another business outlined how the feedback from seeking insurance cover was forcing the business to improve its systems and approach.
An assessment in March gave us a score of 2/4. In some areas we were down on that. We need to get to 2.5 to get meaningful cover in all the areas identified. That helps us make a judgement on what [we] need to do – we need additional investment.
–Business, Large, Information and communication
3.3 Staff training
In the past twelve months, approximately six in ten businesses (58%) and charities (62%) have delivered cyber security training or awareness raising sessions specifically for staff and/or volunteers who are not directly involved in cyber security. Both shares represent an increase from the baseline survey (48% and 55% respectively).
Large businesses with 250+ employees (68%) are more likely to have delivered such training than medium sized businesses (56%). Other types of business more likely to have delivered this training are those with documentation for all five of the technical controls required to attain Cyber Essentials, with one or more certifications, board oversight or specific cyber insurance policies. As such, training appears to be part of a generally more holistic approach to cyber security threats. Around one-quarter of those businesses ‘lacking’ all five of the technical controls required to attain Cyber Essentials (24%) have delivered relevant training to their general workforce in the past twelve months. Almost half of businesses not certified to any of the three standards (49%), and businesses with no cyber security insurance (42%) had delivered such training.
This trend was reflected among businesses interviewed in both Wave One and Wave Two (61% carried out general staff training sessions in the last twelve months, compared to 49% in Wave One, in line with the increase for all businesses). However, there was little change among charities interviewed in both waves (62% carried out training sessions in the last year, compared to 60% in Wave One).
Figure 3.4: Cyber security training or awareness raising delivered by organisations in the last 12 months
In the last 12 months, have you carried out any cyber security training or awareness raising sessions specifically for any staff or volunteers who are not directly involved in cyber security?
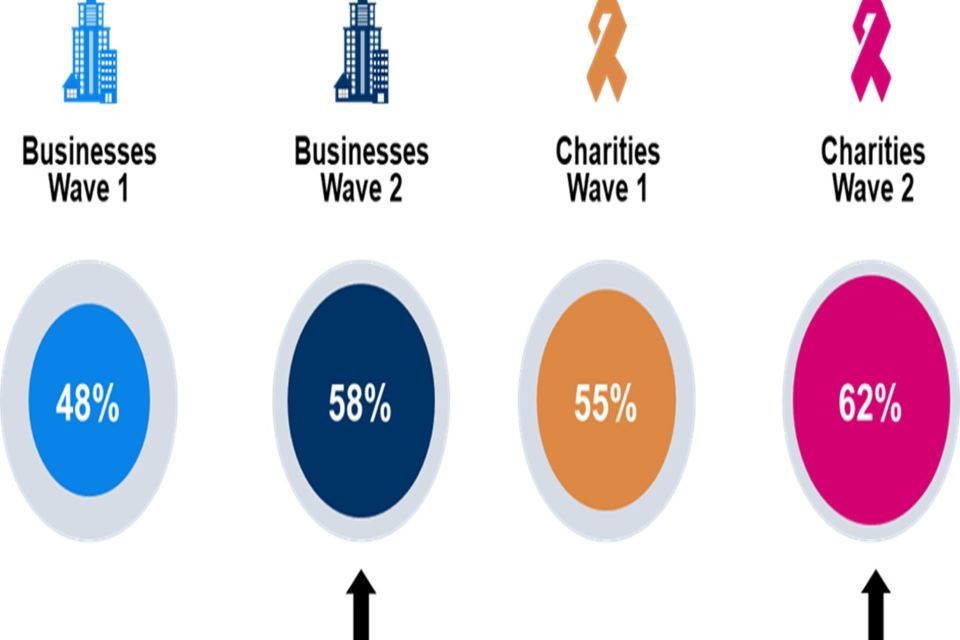
Chart showing the proportion of organisations who had cyber security training or awareness raising delivered by their organisation in the last 12 months. Responses are split between Wave 1 businesses, Wave 2 businesses, Wave 1 charities and Wave 2 charities.
Base: All businesses at Wave 1 (n=1,205) and at Wave 2 (n=688); All charities at Wave 1 (n=536) and at Wave 2 (n=373). Statistically significant changes between Wave 1 data and Wave 2 data are represented by an arrow.
The qualitative interviews suggested that for those involved in designing or managing these activities, the key is raising staff awareness of their responsibilities. This encompassed formal training, for example in ISO 27001 and GDPR compliance, as well as targeted activities such as sending an email reminder with a relevant screenshot if the system indicates that rules have been broken by individual staff members (such as unauthorised devices being connected).
The key thing is staff awareness. If you can crack that, you don’t have to worry about the tooling quite so much. Make people aware of the vulnerabilities. If you can get that embedded in people’s way of work life, everything else becomes non-essential. The problems always start with people, everything else is peripheral.
–Business, Medium, Information and Communication
Participants in these interviews were also asked if their organisation had conducted a cyber skills assessment of their workforce. Many had not done so, but for those that had, it typically involved a phishing test or a simulation that checked whether staff responded appropriately. Some organisations carried out broader exercises.
Yes - we recently did a general quiz with staff to gauge knowledge of the business which helped highlight the skilled staff and good general knowledge.
–Business, Medium, Media
Every new starter has to go through security training, about two hours, (there is also) an annual programme, also phishing. Phishing is more beneficial than annual training. The person broadcasts the fact they’ve received it to the rest of the company - doing [the respondent’s] job for me. People won’t listen to me, but they’ll listen to their colleagues.
–Business, Medium, Information and communication
Chapter 4- Cyber security processes
In addition to the policies, documentation and training that are being put in place, it is also vital that specific processes are outlined to help develop cyber resilience. This chapter discusses the cyber security processes and documentation organisations have in place, including any standards and certifications they hold. It goes on to describe the extent to which organisations monitor and evaluate their policies and where relevant whether any improvements have been made over the last twelve months. Understanding these changes will help to illustrate the actions that organisations are undertaking to help improve their cyber security.
Organisations are increasingly adhering to at least one cyber security certification (although it remains less than a majority) and have taken steps to develop an aspect of their cyber security. Compared to Wave One, the findings of greatest note are:
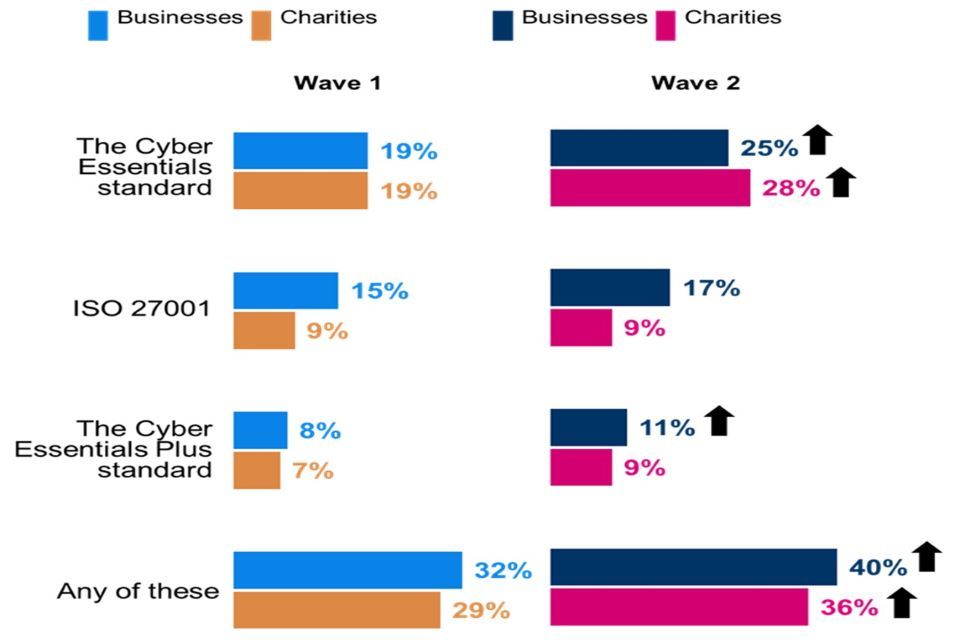
- A higher share of businesses (40%) and charities (36%) now adhere to at least one of the three cyber security related certifications asked about (Cyber Essentials, Cyber Essentials Plus, and ISO 27001).
- Businesses (up from 19% to 25%) and charities (from 19% to 28%) are more likely to adhere to the Cyber Essentials standard. The share of businesses adhering to the Cyber Essentials Plus standard (11%) is also higher than in Wave One (8%).
- Although still low, the proportion of businesses that include something about cyber security in their annual report has increased (from 14% to 19%). There is no equivalent change among charities (18% in both waves).
- Although it has not changed since the baseline survey, almost nine in ten organisations (86% of businesses and 87% of charities) continue to take at least one action to identify the cyber security risks their organisation faces.
- Businesses have increased their use of security monitoring tools and vulnerability audits compared to Wave One.
- There has been an increase in the proportion of businesses that have taken at least one step over the past twelve months to expand or improve some aspect of their cyber security (from 79% to 85%). This is primarily the result of greater use of authentication and access control (up from 59% to 65%), and processes for managing cyber security (up from 41% to 47%).
- Fewer than three in ten businesses (26%) and charities (28%) have formally addressed the potential cyber security risks associated with their suppliers or partner organisations. This is in line with Wave One.
4.1 Standards and certifications
To help instil good practice, organisations can apply to receive one of several cyber security certifications. Often based on standards taken from government guidance, achieving one of these certifications puts an organisation in a more resilient position. This survey focuses on three specific standards: Cyber Essentials, ISO 27001 and Cyber Essentials Plus.
Compared to the baseline study, higher proportions of businesses and charities now adhere to at least one of three cyber security certifications shown in Figure 4.1 (businesses increased from 32% to 40%, and charities from 29% to 36%). Cyber Essentials[footnote 8] is the standard most often adhered to by businesses (25%) and charities (28%), with both proportions higher than in Wave One (19% for both).
Almost two in ten businesses (17%) adhere to the ISO 27001[footnote 9] standard, while around one in ten are certified to the Cyber Essentials Plus[footnote 10] standard (11%). The proportion adhering to the Cyber Essentials Plus standard is higher than in the baseline survey (8%).
Charities are less likely than businesses to adhere to the ISO 27001 standard (9%) than businesses. Charities are just as likely to adhere to ISO 27001 as they are to the Cyber Essentials Plus standard (also 9%).
Around four in ten businesses (39%) and charities (40%) confirmed adhering to none of the three certifications asked about in the survey.
Large businesses (250+ staff) are more likely than medium sized enterprises (50-249) to be certified to each of the three standards. Half (50%) of large businesses adhere to at least one standard or accreditation, compared to four in ten medium sized companies (38%). Large businesses are particularly more likely than medium sized businesses to be certified to the Cyber Essentials (34% vs. 23%) and Cyber Essentials Plus (17% vs. 10%) standards.
The 28% share of charities adhering to the Cyber Essentials standard is reflected across both the longitudinal and fresh charity samples (27% and 28% respectively). Specifically looking at the longitudinal sample, this represents an eight-point[footnote 11] increase from the 19% recorded in Wave One.
Figure 4.1: Standards and accreditations held by organisations
Which of the following standards or accreditations, if any, does your organisation adhere to?
Clustered bar charts for Wave 1 and Wave 2 showing the standards and accreditations held by organisations. Responses are split between businesses and charities.
Base: All businesses at Wave 1 (n=1,205) and at Wave 2 (n=688); All charities at Wave 1 (n=536) and at Wave 2 (n=373). Don’t know not shown. Statistically significant changes between Wave 1 data and Wave 2 data are represented by an arrow.
Probably reflecting greater levels of monitoring and awareness, and as in Wave One, businesses that experienced a cyber incident in the last twelve months are more, not less, likely to adhere to a relevant standard or accreditation. It may show that their systems are effectively picking up incidents. It is of note that three in ten businesses that experienced a cyber security incident were certified to the Cyber Essentials standard (30%), compared to one in ten (11%) with no cyber security incident in the last year. Among charities, levels of certification were similar for charities that had and had not experienced a cyber incident in this time.
The qualitative research revealed mixed views on the usefulness, or otherwise, of Cyber Essentials. Some regarded it as a ‘tick box’ exercise that was only adopted because some clients required it. For others, it provides a beneficial framework that helps them adhere to high industry standards:
Gaining certification was a tick box exercise, we already had all the policies in place. Cyber Essentials wasn’t much of a leap.
–Business, Medium, Information and Communication
It’s a bit heavy duty for us but it seemed to fit in with clients’ requirements. It’s the industry standard without being too onerous or expensive like ISO.
–Business, Medium, Information and Communication
It aligns you with the best practice for security.
–Business, Large, Construction
From an internal IT point of view, we have a framework to follow and adhere to.
–Charity
4.2 Cyber Essentials processes
To attain Cyber Essentials accreditation, organisations are required to have five technical rules or controls in place. As illustrated by Figure 4.2, approximately six in ten businesses (61%) and charities (58%) do operate all five of these rules or controls. These figures are in line with the 57% recorded for both businesses and charities in Wave One.
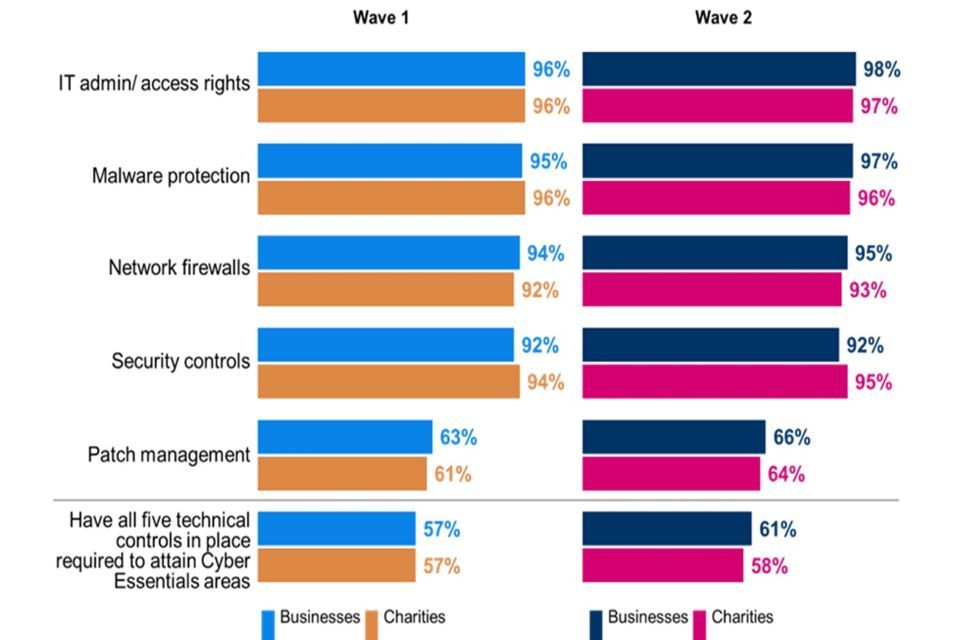
Regardless of whether certified against Cyber Essentials, 9 in 10 businesses and charities had the follow technical controls in place, which comprise 4 of the 5 technical controls required under the Cyber Essentials standard:
- Restriction of IT admin and access rights to specific users
- Up to date malware protection across all devices
- Firewalls that cover the entire IT network, as well as individual devices
- Security controls on the organisation’s own devices e.g., laptops
Only around two-thirds of organisations say they have a policy to apply software security updates within 14 days. i.e., patch management (66% of businesses and 64% of charities). However, for each of the five technical controls required to attain Cyber Essentials, the proportions are in line with Wave One, for both businesses and charities.
Figure 4.2: Technical controls in place in the areas required to attain Cyber Essentials
And which of the following rules or controls, if any, do you have in place?
Clustered bar charts for Wave 1 and Wave 2 showing the technical controls in place that are required in order for organisations to attain Cyber Essentials. Responses are split between businesses and charities.
Base: All businesses at Wave 1 (n=1,205) and at Wave 2 (n=688); All charities at Wave 1 (n=536) and at Wave 2 (n=373). Don’t know not shown. Statistically significant changes between Wave 1 data and Wave 2 data are represented by an arrow.
Large businesses (68%) are more likely than medium-sized enterprises (60%) to have in place all five technical controls required to attain Cyber Essentials certification. Among very large businesses (with 500+ staff) the share is 72%. This difference is ‘driven’ by variations in the extent to which businesses are applying patch management. Compared to medium-sized companies (64%), large businesses (75%) are implementing patch management to a much higher degree.
Businesses that have experienced a non-phishing incident (66%) are more likely than those who have not (54%) to have all technical controls required to attain Cyber Essentials in place. This potentially highlights how the greater use of controls helps identify and manage, rather than eradicate, cyber security incidents. This is also the case where there is board oversight of cyber security (75%), and where specific cyber security insurance has been taken out (75%). The same relationships are observed within charities.
Four other rules and controls were covered by this question, and in each case at least six in ten organisations say they have these controls in place:
- Specific rules for storing and moving files containing people’s personal data (85% of businesses and 86% of charities)
- Backing up data securely via cloud device (more likely among charities than businesses, 85% vs. 75%)
- Backing up data by other means (more likely among businesses than charities, 70% vs. 63%)
- Monitor user activity (66% of businesses and 64% of charities)
The 85% of charities securely backing up data via a cloud service, also represents an increase compared with Wave One (77%). However, there is little difference between the longitudinal and fresh charity samples on this measure (84% and 88% securely back up data via a cloud service respectively).
4.3 Reporting and identifying risks
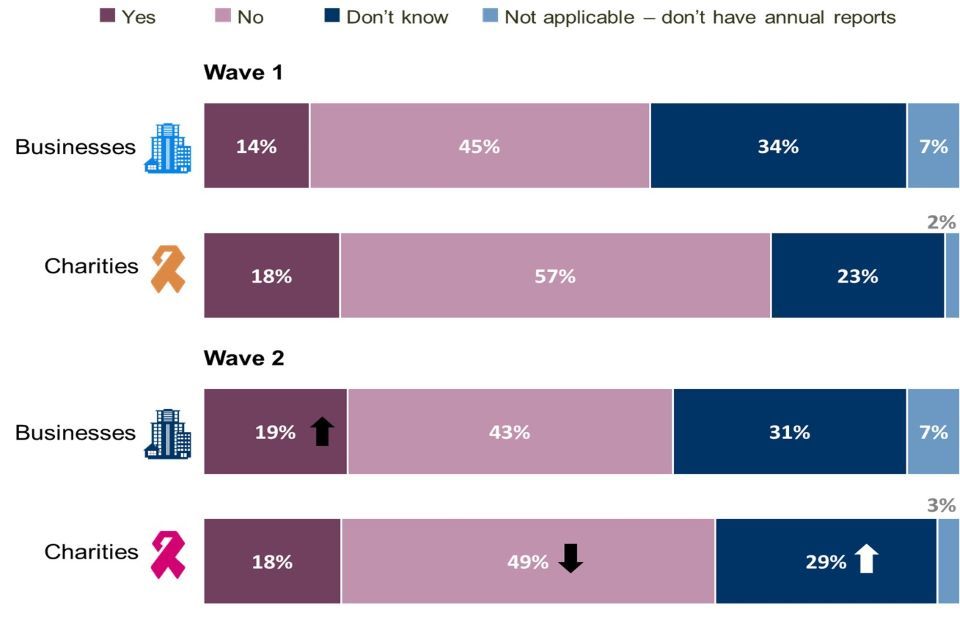
Annual reports
As illustrated by Figure 4.3, while the proportion has increased from Wave One (from 14% to 19%), fewer than one in five businesses include something about cyber security in their annual reports. Similarly, around one in five charities (18%) say cyber security is ‘covered’ in their annual report, which is identical to Wave One.
Figure 4.3: Reporting on Cyber Security
Did you include anything about cyber security in your organisation’s most recent annual report?
Stacked bar chart showing the proportion of organisations who included cyber security in their organisation’s most recent annual report. Responses are split between Wave 1 businesses, Wave 2 businesses, Wave 1 charities and Wave 2 charities.
Base: All businesses at Wave 1 (n=1,205) and at Wave 2 (n=688); All charities at Wave 1 (n=536) and at Wave 2 (n=373). Statistically significant changes between Wave 1 data and Wave 2 data are represented by an arrow.
Three in ten very large businesses with 500+ employees (31%) include cyber security in their annual report. This is also more prevalent among businesses certified to the ISO 27001 (30%) and Cyber Essentials Plus (39%) standards. These are the highest figures seen among business sub-groups. Coverage of cyber security in their most recent annual report is also more common among charities with recognised cyber security standards (e.g., ISO 27001 (31%), Cyber Essentials Plus (50%)).
Organisations in the longitudinal sample are as likely to confirm inclusion of cyber security in their annual report (18% of businesses and 19% of charities) as those interviewed for the first time in Wave Two (21% of businesses and 18% of charities).
The relatively low proportion of organisations including cyber security in their annual reports was reflected on in the qualitative research. Some respondents felt that this may change, but opinion was divided on usefulness:
I expect with how things are changing with ISO that that will change.
–Business, Medium, Information and Communication
My stance is it [cyber security] should be visible to our customers in our annual report because we’re quite strong and we should be quite proud of it - we put a lot of effort in to maintain it, so should be keen to broadcast.
–Business, Medium, Information and Communication
I’m not sure I see the value of having it added - who would be reading it?
–Business, Medium, Information and Communication
Identification of cyber security risks
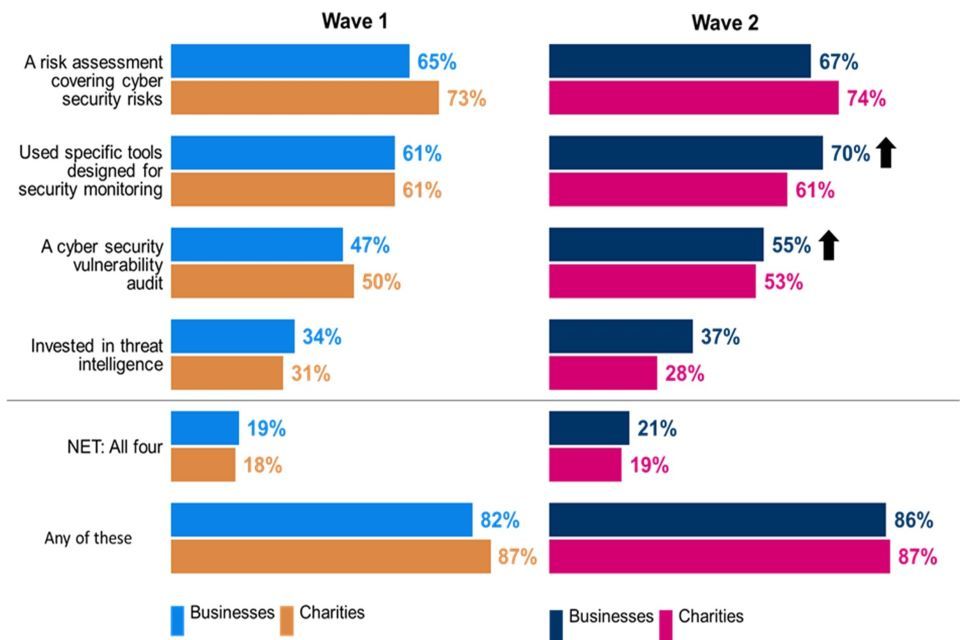
In order to ensure that organisations are able to plan and build processes that will protect them adequately it is vital that businesses and charities are able to identify their cyber security risks. Reflecting the findings of the baseline survey, almost nine in ten organisations (86% of businesses and 87% of charities) say they have taken one of the four actions detailed in Figure 4.4 in the last year to identify cyber security risks facing their organisation. One in five organisations (21% of businesses and 19% of charities) report taking all four measures, which is also in line with the Wave One survey.
A minimum of six in ten organisations (both businesses and charities) have conducted a cyber security risk assessment in the past twelve months or have used specific tools (such as Intrusion Detection Systems) designed to monitor such risks. Organisations that experienced a cyber security incident in the last twelve months are more likely to have conducted a risk assessment covering cyber security risks (72% compared to 61% who had not had an incident), or a cyber security vulnerability audit (58% compared to 43% who had not had an incident).
A majority of organisations have also completed a cyber security vulnerability audit. While the level of deployment by charities is unchanged from Wave One, a higher share of businesses have used specific security monitoring tools (70%, up from 61% in Wave One) and vulnerability audits (55%, up from 47% in Wave One).
Investment in threat intelligence remains relatively rare but has been undertaken by a higher proportion of businesses than charities (37% vs. 28%). Charities remain more likely than businesses to have undertaken a risk assessment covering cyber security risks (74% vs. 67%), but businesses are now more likely than charities to use specific tools designed for security monitoring (70% vs. 61%).
Figure 4.4: Steps taken to identify cyber security risks
Which of the following, if any, have you done in the last twelve months to identify cyber security risks to your organisation?
Clustered bar charts for Wave 1 and Wave 2 showing the steps organisations have taken to identify cyber risks. Responses are split between businesses and charities.
Base: All businesses at Wave 1 (n=1,205) and at Wave 2 (n=688); All charities at Wave 1 (n=536) and at Wave 2 (n=373). Don’t know not shown. Statistically significant changes between Wave 1 data and Wave 2 data are represented by an black arrow.
Compared to large businesses, medium-sized businesses are only half as likely to have taken all four steps to identify cyber security risks facing their organisation (18% vs. 37%). More than twice as many medium (17%) as large businesses (7%) say they have taken none of these steps. The respective proportions for each individual action are as follows:
- Specific tools designed for security monitoring (67% of medium-sized businesses vs. 77% of large businesses)
- Risk assessment covering cyber security risks (65% vs. 77%)
- Cyber security vulnerability audit (52% vs. 69%)
- Threat intelligence (33% vs. 52%)
At the beginning of each qualitative interview, organisations were asked to outline the main cyber security risks facing their organisation. Many mentioned phishing, ransomware, inadequate user skills among staff, and the ever-changing nature of the threats for which they need to keep up to date and prepare.
A lot of our users tend to be older; they think all the IT stuff is rubbish, security nonsense doesn’t apply to them. ‘Why would anybody attack us?’. It might be changing over time, but not fast enough.
–Charity
The biggest risk is around staff training than of someone being out to hack us. In my experience, it is the hardest to enforce. You can set rules for data security, but in practice our staff have other pressures, especially frontline care staff…. They don’t come in with IT skills or data awareness and risks are very hard to enforce….
–Charity
Phishing will always be a concern, but what keeps me up at night is a full-on ransomware attack.
–Business, Medium, Information and Communication
For charities and organisations dealing with sensitive personal information there seemed to be even more concern around cyber security and the risks they face:
We are very aware of cyber security, it sits alongside GDPR. Our reputation depends on it.
–Charity
4.4 Improvements made over the last twelve months
The survey covers the actions organisations can take to expand or improve aspects of their cyber security. Overall, there is a strong desire across both businesses and charities to improve their cyber defences and over the past twelve months nearly nine in ten businesses (85%) and charities (86%) have taken at least one step to expand or improve an aspect of their cyber security.
For businesses this represents an increase from Wave One (79%) and is primarily driven by greater use of authentication and access control (up from 59% to 65%) and processes for managing cyber security (41% to 47%). While overall shares are not significantly different from Wave One, at least half of all businesses have looked at their malware defences in the last year (59%) or strengthened the way they monitor systems or network traffic (50%). Fewer than half of businesses have expanded or improved their processes for managing cyber security incidents, though the proportion that have is higher compared to the baseline survey (47% vs. 41%).
In general charities are as likely as businesses to have made efforts to expand or improve aspects of their cyber security. Only with respect to strengthening the way they monitor systems or network traffic is the share of charities undertaking improvements lower than for businesses (43% vs. 50%).
Figure 4.5: Steps to expand or improve cyber security in last twelve months
In the last twelve months, has your organisation taken any steps to expand or improve any of the following aspects of your cyber security?
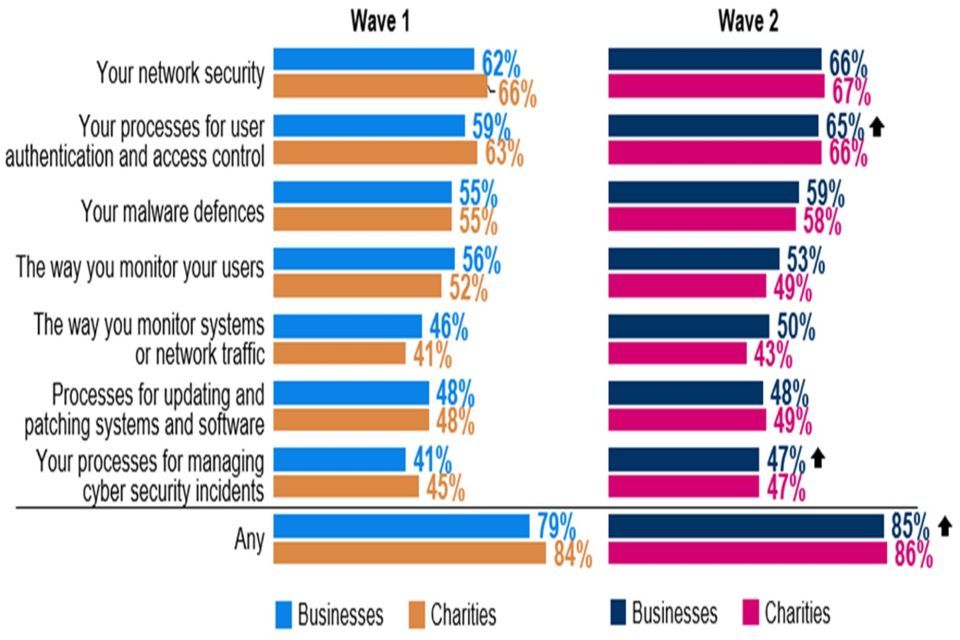
Clustered bar charts for Wave 1 and Wave 2 showing the steps organisations have taken to expand or improve their cyber security in the last twelve months. Responses are split between businesses and charities.
Base: All businesses at Wave 1 (n=1,205) and at Wave 2 (n=688); All charities at Wave 1 (n=536) and at Wave 2 (n=373). Don’t know not shown. ‘The way your monitor your users’ was only asked to organisations that said they monitored their users. Statistically significant changes between Wave 1 data and Wave 2 data are represented by an arrow.
Although the proportion is high for all businesses, large enterprises (92%) are more likely than medium-sized enterprises (84%) to have made at least one improvement to their cyber security processes over the last twelve months. Specifically, they are more likely to have expanded or improved: user authentication and access control (72% vs. 64%); processes for updating and patching systems and processes (59% vs. 46%); the way they monitor their users (46% vs. 33%); and the way they monitor systems or network traffic (58% vs. 48%).
As in Wave One, although the direction of the relationship is uncertain, there may be some evidence that experience of cyber security incidents drives action. Nine out of ten businesses (91%) and charities (90%) that experienced a cyber security incident in the last year also report taking steps to expand or improve their cyber security in this time. This compares to seven in ten businesses and charities (both 70%) that did not experience a cyber security incident in the last twelve months. This relationship, and the direction of relationship, will continue to be explored in Wave Three.
4.5 Supplier risks
A crucial aspect of an organisation’s cyber security is their relationship with their suppliers. Suppliers pose several risks for organisations, including:
- Third-party access to an organisation’s system
- Storage of personal data or intellectual property of client organisation
- Potential cyber threats to the supplier or originating with the supplier, including phishing attacks, viruses or malware
Understanding the steps that are being taken by organisations to mitigate these risk is therefore key to getting a full picture of their cyber resilience.
It remains the case that fewer than three in ten businesses (26%) or charities (28%) have formally addressed the potential cyber security risks associated with their suppliers and partner organisations.
Assessment or management of supplier-related cyber security risks remains more likely to have been conducted by large than medium-sized businesses (34% vs. 25%), while more than four in ten very large businesses (42%) have done this.
The proportion of businesses reviewing their external relationships for cyber security risk increases where there is board oversight of such matters, or a specific cyber security insurance policy is in place. However, organisations with cyber security certifications are most strongly correlated with such reviews. Around half of businesses certified to the ISO 27001 (52%) and Cyber Essentials Plus (48%) standards have assessed or managed the potential cyber security risks presented by their suppliers. Among charities, the respective shares are 50% and 41%.
Figure 4.6: Initiatives to assess or manage cyber security risks presented by suppliers / partners
In the last twelve months, has your organisation carried out any work to formally assess or manage the potential cyber security risks presented by any of these suppliers/suppliers or partners?
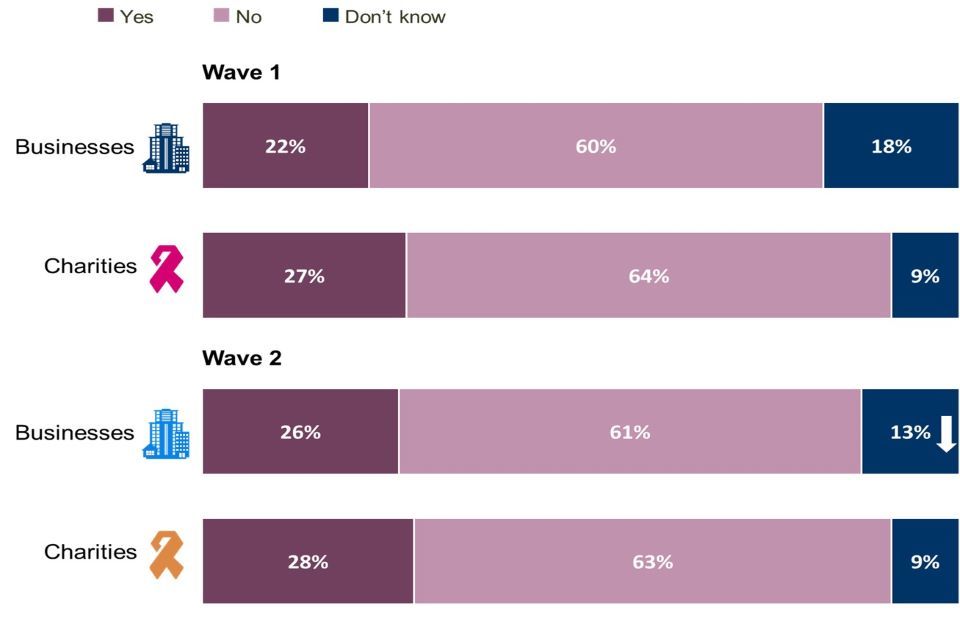
Stacked bar chart showing the proportion of organisations who have carried out work to formally assess or manage potential cyber security risks presented by their supply chains. Responses are split between Wave 1 businesses, Wave 2 businesses, Wave 1 charities and Wave 2 charities.
Base: All businesses at Wave 1 (n=1,205) and at Wave 2 (n=688); All charities at Wave 1 (n=536) and at Wave 2 (n=373). Statistically significant changes between Wave 1 data and Wave 2 data are represented by an arrow.
Organisations that had carried out supplier risk assessments were asked to detail the work they have done in this area during the last twelve months. In line with Wave One, more than eight in ten of these businesses (85%) and charities (84%) have taken at least one of five initiatives presented to them.
Almost six in ten of the businesses that have addressed supplier risks report having requested cyber security information from their supply chains (57%) or setting minimum cyber security standards in supplier contracts (56%). Although in absolute terms it is a relatively low proportion, it is notable that more than one in ten businesses that looked at cyber security risks in their supplier chain (12%) stopped working with a supplier following an incident. Only one per cent of charities report having stopped working with a supplier for similar reasons, a decrease when compared to Wave One (8%). This is the only action with a significant difference between waves.
Figure 4.7: Work done in last twelve months with suppliers to manage cyber security risk
Which of the following, if any, have you done with any of your suppliers/suppliers or partners in the last twelve months?
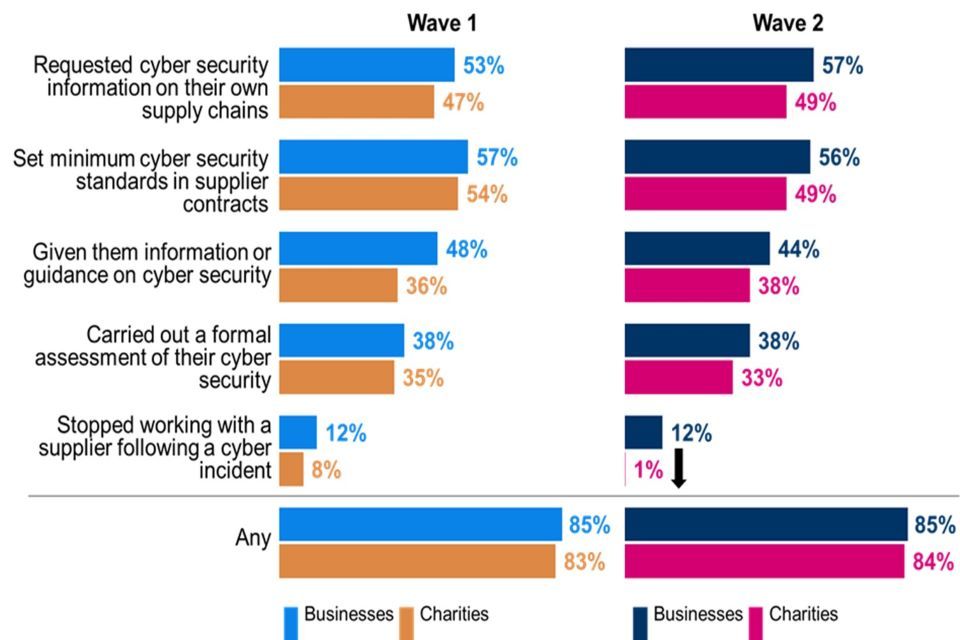
Clustered bar charts for Wave 1 and Wave 2 showing what work organisations have done in the last 12 months with their suppliers in order to manage cyber security risk. Responses are split between businesses and charities.
Base: All organisations reviewing immediate supplier risks. Businesses Wave 1 (n=306) and Wave 2 (n=205); charities Wave 1 (n=144) and at Wave 2 (n=104). Don’t know not shown. Statistically significant changes between Wave 1 data and Wave 2 data are represented by an arrow.
The small base sizes involved mean there are few significant differences between different sub-groups. However, large businesses (250+ staff) are more likely than medium-sized businesses to have given suppliers information or guidance on cyber security (59% vs. 40%).
Chapter 5- Board involvement
This chapter covers the extent to which the boards (directors, trustees, and senior leadership teams) of large businesses and charities engage with cyber security matters. It outlines the roles and responsibilities of board members in relation to cyber security, their general level of engagement with these matters and whether they have received training in this area. Given their seniority, board engagement with cyber security issues can have an important impact on the resilience of organisations. Understanding this involvement will help to give a sense of the priority that organisations are placing on cyber security.
Whilst board level staff do appear to be increasing their focus on cyber security, engagement remains low. Compared to Wave One the findings of greatest note are:
- The proportion of businesses and charities with a board member taking specific responsibility for cyber security has not changed since Wave One.
- The proportion of businesses with a designated staff member responsible for cyber security, who reports directly to the board, has increased (from 55% to 61%).
- Fewer businesses report they have neither of the above roles (down from 30% to 25%).
- There has been no change in the proportion of businesses (57%) and charities (61%) that integrate considerations of cyber security risks into their wider operations.
- Fewer businesses and charities report that their board has not discussed or received reports on cyber security over the last twelve months.
- There has been an increase in the proportion of businesses whose board members have received cyber security training (from 35% to 45%).
5.1 Roles and responsibilities
As in Wave One, businesses are more likely than charities to have one or more board members with oversight of cyber security risks (54% vs. 41%), though these proportions are in line with those in Wave One. When looking specifically at businesses in the longitudinal sample (interviewed in both waves), an increased share now has at least one board member whose role includes oversight of cyber security risks (56%, up from 48% in Wave One).
Six in ten organisations (61% of businesses and 60% of charities) have a designated staff member responsible for cyber security, who reports directly to the board. This is in line with Wave One among charities, but for businesses this represents an increase (from 55%).
As in Wave One, three in ten charities have neither a board member with oversight of cyber security risks nor a designated staff member who reports directly to the board. Fewer businesses now report having neither of these roles (25%, down from 30% in Wave One).
Figure 5.1: Cyber security roles and responsibilities within organisations
Does your organisation have any of the following?
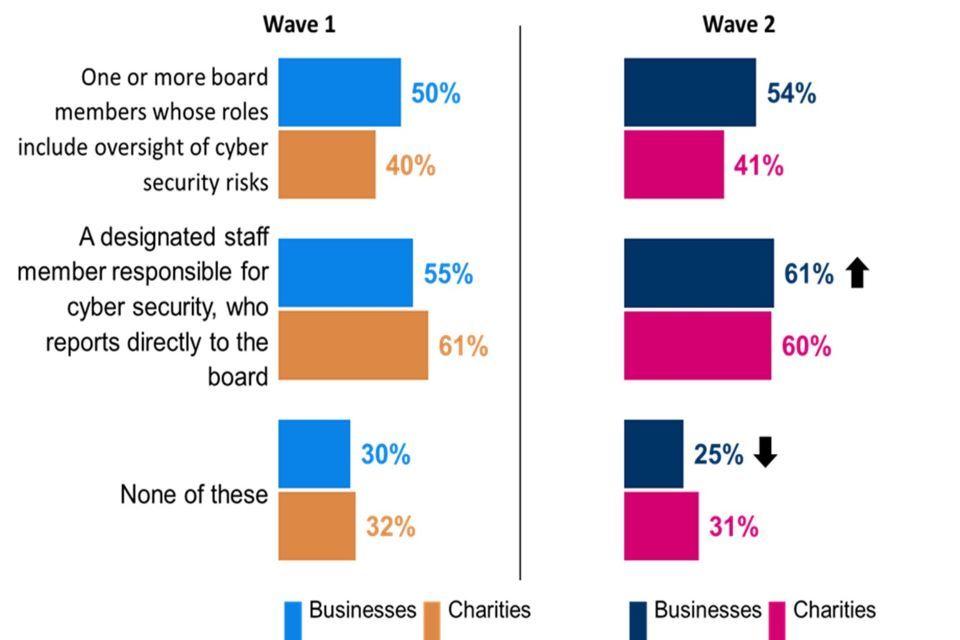
Clustered bar charts for Wave 1 and Wave 2 showing the cyber security roles and responsibilities within organisations. Responses are split between businesses and charities.
Base: Wave 1: All businesses (n=1,205); All charities (n=536); Wave 2: All businesses (n=688); All charities (n=373). Don’t know not shown. Statistically significant changes between Wave 1 data and Wave 2 data are represented by an arrow.
Among businesses there are no significant differences according to size. For example, medium-sized businesses are just as likely to report having a board member with an oversight of cyber security risks than very large businesses with 500+ employees (54% vs. 58%). The respective shares of medium-sized and very large businesses with staff members who report directly to the board are 60% and 65%.
Some organisations integrate cyber security risk considerations into their wider operations, while others choose to treat cyber security risks as more isolated or standalone issues. In Wave Two, around six in ten businesses (57%) and charities (61%) take the former position. Both shares are in line with Wave One (55% and 60% respectively).
Organisations adhering to one or more certifications are more likely to say their board integrates cyber risk considerations into wider business areas. For example, 69% of businesses certified to the ISO 27001 standard do this, as do 66% of businesses certified to the Cyber Essentials standard.
The qualitative interviews sought to understand roles and responsibilities in more detail. Respondents mentioned historic lack of understanding from board members associated with a variety of interconnected factors, including their age, lack of IT literacy or lack of board-level training. As a result, respondents, who are often personally identified as the “designated staff member” reporting directly to the board about cyber security issues, cited communication barriers and/or knowledge gaps when it comes to having conversations about cyber security with board members. However, other respondents reported a much more positive two-way relationship of trust was in place. There was general recognition that board members’ understanding around cyber security issues and their importance continues to increase over time.
My understanding is that the board is a very passive board and doesn’t stipulate very much in the way of governance and guidance.
–Business, Medium, Information and Communication
No one on the board has taken ownership. That should change – we’re planning some board specific training. At the moment we can write a paper that will go to the board for meetings, but IT matters are usually presented by the CEO. Can they engage with it? No, mostly they sit in silence because they don’t understand. The new board members are younger, a slight change there as well. One of them tends to ask the right questions.
–Charity, Scotland
Anything IT, the board will listen. They trust us to make that decision and deal with it.
–Business, Medium, Transport and Storage
I have the scope and ability to make decisions. I do feel they [the board] understand cyber security - it helps me that they have a high-level understanding of it; if not it would be a bit of a hard sell.
–Business, Medium, Information and Communication
5.2 Awareness and training
When asked about roughly how often their board discussed or received updates on cyber security over the last twelve months, around half (49%) of businesses say they did so at least quarterly (excluding don’t know responses). Businesses are more likely to have frequent board discussions or updates than charities, with 38% of charities reporting that their board does so at least quarterly. Both shares are in line with Wave One when 45% of businesses and 37% of charities reported at least quarterly board discussions or updates on cyber security.
Around one in six businesses (15%) and charities (16%) report that their board has never discussed or received reports on cyber security over the last twelve months (again excluding don’t know responses). Both shares are broadly in line with Wave One (19% of businesses and 20% of charities).
Figure 5.2: Frequency of board discussions or updates on cyber security
Over the last twelve months, roughly how often, if at all, has your board discussed or received updates on your organisation’s cyber security?
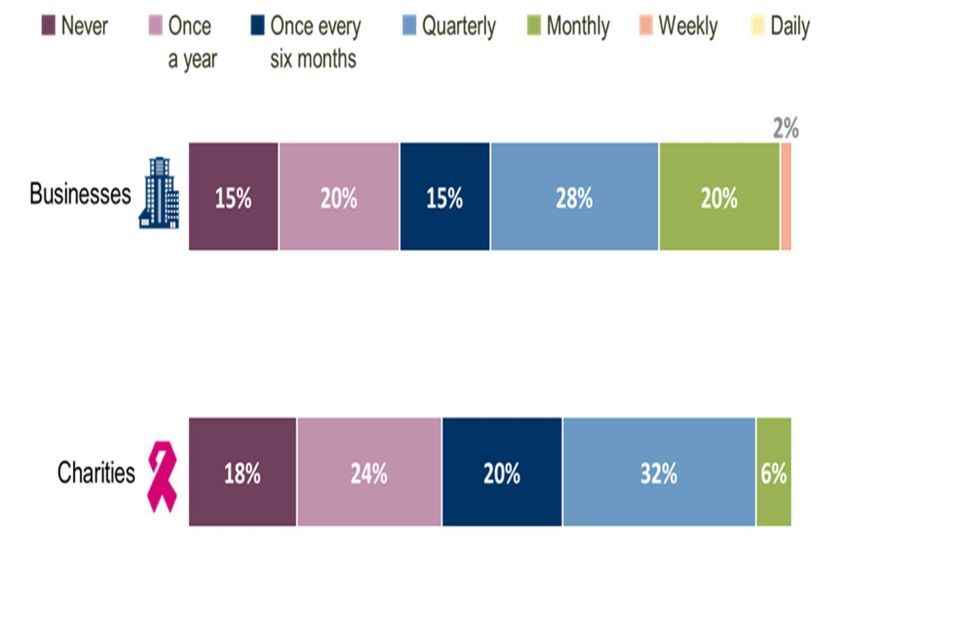
Stacked bar chart showing how often the boards of organisations discuss or receive updates on cyber security. Responses are split between Wave 1 businesses, Wave 2 businesses, Wave 1 charities and Wave 2 charities.
Base: All businesses excluding don’t know (n=599); All charities excluding don’t know (n=336). Statistically significant changes between Wave 1 data and Wave 2 data are represented by an arrow.
The share of businesses reporting at least quarterly board discussions or updates on cyber security in the last year ranges from just under half of medium-sized businesses to around seven in ten very large businesses with 500+ employees (47% vs. 69%), a wider gap than was observed in Wave One (43% vs. 55% respectively).
Quarterly board discussions or updates on cyber security are also more common among organisations adhering to certifications and standards, that manage supplier risk or have specific cyber security insurance. Once again, this illustrates how some organisations are considering cyber security risk across the organisation and looking to identify and mitigate potential damage throughout their operations.
The qualitative interviews contained further examples of boards being increasingly willing to engage with cyber security risks and issues, though this is not yet universal and there is still room for improvement.
The board aren’t spring chickens - they started when there were film reels - but understand how important everything is. They have meetings with big broadcasters who talk about cyber security, I’m promoting it and they see successful attacks. Since then, they’ve been very focused, willing to listen and invest.
–Business, Medium, Information and Communication
Historically the board have had exclusive interest in care and are sceptical of the technology side of things, but it’s changing - they are younger, some are recently retired, and bring their own previous experience of working with technology. Five years ago, it was much more negative, now I’m much more optimistic.
–Charity
The board will either say they don’t understand it so it’s fine, or they’ll want to know pointless details about things.
–Charity
As in the baseline survey, fewer than half of organisations (45% of businesses and 34% of charities) confirm that any of their board members has received cyber security training. However, this represents a significant increase among businesses (from 35% in Wave One). Around four in ten businesses and charities (40% and 42% respectively) confirmed that their board has not received any cyber security training.
Cyber security training is more likely to have been received by the board members of larger businesses. The proportion of large (53%) and very large (57%) businesses to confirm board-level cyber security training is higher than in medium-sized businesses (42%).
Businesses with all five of the technical controls required to attain Cyber Essentials in place are even more likely to report board-level cyber security training (72%). As with board level discussions, training is also more evident within organisations that adhere to a certification or standard, that manage supplier risk or have specific cyber security insurance. For example, two-thirds of businesses adhering to ISO 27001 certification (65%) or the Cyber Essentials Plus standard (66%) say that at least one of their board has received cyber security training. This is nearly double the 36% of businesses with no such certification.
There remains a gap between levels of board training and more general staff training on cyber security. The proportion of organisations reporting that their board members had received any cyber security training is lower than the proportion offering cyber security training to their staff in the last twelve months, across both businesses (58% said they offered training to staff in the last twelve months vs. 45% saying board members had received training at any time) and especially so for charities (62% vs. 34% respectively).
Figure 5.3: Board-level cyber security training
Have any of the board received any cyber security training? (% yes)
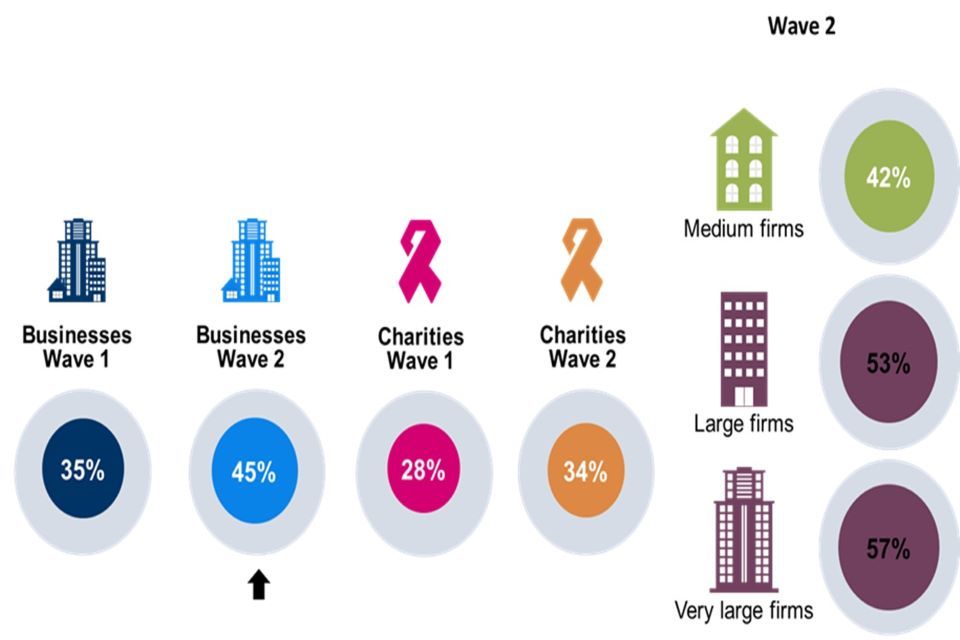
Chart showing the proportion of organisations in which at least one member of the board has received cyber security training. Responses are split between Wave 1 businesses, Wave 2 businesses, Wave 1 charities and Wave 2 charities. Wave 2 businesses are further split into medium, large, and very large firms.
Base: Wave 1: All charities (n=536), All businesses (n=1205) Wave 2: All charities (n=373), All businesses (n=688). Statistically significant changes between Wave 1 data and Wave 2 data are represented by an arrow.
These general trends are reflected when looking specifically at the longitudinal sample. The share of businesses interviewed in both waves reporting board-level cyber security training increased from 40% in Wave One to 48% in Wave Two. Among charities interviewed in both waves, the change (from 33% to 37%) is not statistically significant.
A new question was added in Wave Two to ascertain the frequency of board-level cyber security training where organisations reported such training had been received. Only around one-quarter (27%) of businesses that reported training had been received indicated this training took place more than once a year, a higher proportion than among charities that had reported training had been received (15%).
At the other end of the spectrum, one-quarter of businesses (23%) and almost four in ten charities (39%) said their board had received cyber security training less often than once a year or only once in total. Taken together the data suggest that senior level training is not widespread, nor is it delivered on a frequent basis. This is particularly true within charitable organisations.
Figure 5.4: Frequency of board training
On average, how often does the board receive cyber security training?
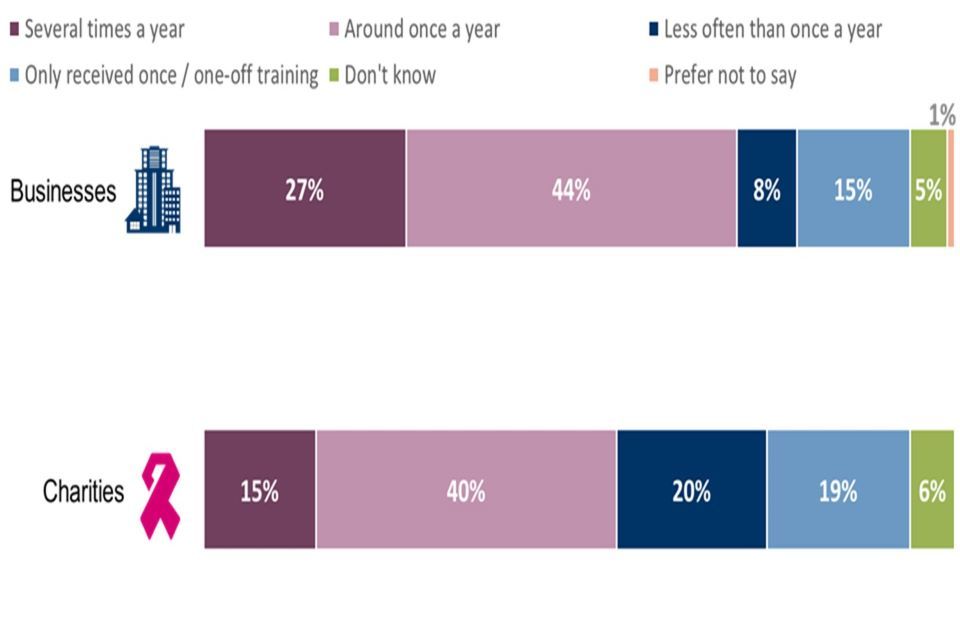
Stacked bar chart showing how often the boards of organisations receive cyber security training. Responses are split between businesses and charities
Base: All whose board has received cyber security training, businesses (n=324), charities (n=126). This question was asked for the first time in Wave 2, so it is not applicable to compare with Wave 1.
Chapter 6- Sources of information
This section discusses the use of information or guidance from the National Cyber Security Centre (NCSC) by businesses and charities. It goes on to discuss the extent to which various stakeholders influence organisations’ policies and processes related to cyber security. Understanding the degree to which organisations have been provided with the most up to date government guidance is a central part of ensuring that they are resilient to cyber threats.
The proportion of businesses and charities that have used NCSC guidance has increased but remains low. Compared to the first wave of the survey, the key findings are:
- Around one in three businesses (32%) have used information or guidance from the NCSC in the last year, up from 23%) in Wave One. A similar increase is reported by charities (from 32% to 42%). The increased use of NCSC information or guidance among businesses is largely driven by the 35% of the longitudinal sample that have used NCSC guidance in the last year.
- Businesses that have experienced a cyber security incident in the last 12 months, they are more likely to have used the NCSC guidance (38% usage of the guidance among those that have experienced an incident as compared 20% among those that have not experienced a security incident).
- Among organisations that have used NCSC guidance, GDPR guidance is the most common type of information used by both businesses (66%) and charities (63%). Businesses are more likely to have used the Cyber Assessment Framework (51% up from 41%), weekly threat reports (41% up from 32%) and the Cyber Security Board Toolkit (34% up from 23%) than they were in Wave One.
- External IT or cyber security consultants are the greatest external influence on the cyber security actions of both businesses (53%, up from 47% in Wave One) and charities (56%, consistent with Wave One). Insurers are the next largest influence on both types of organisation (35% of businesses; 41% of charities) and are a greater influence than they were in Wave One (up from 26% of businesses and 30% of charities in Wave One).
- Businesses are more likely to have reviewed or changed their cyber security processes or policies as a result of another organisation in their sector experiencing a cyber security incident (16%) than as a result of another organisation implementing a similar measure (10%). The same applies to charities (20% vs. 14%). These findings are all consistent with Wave One.
6.1 Use of NCSC guidance
Use of information or guidance from NCSC has increased among both businesses and charities. Around one in three businesses (32%) have used NCSC guidance in the last twelve months, compared with one in four (23%) that had done so in the baseline survey. The proportion of charities that have used NCSC guidance has increased by a similar amount (from 32% to 42%), and as such this usage remains higher among charities than businesses.
Figure 6.1: Use of NCSC Guidance
In the last twelve months, has your organisation used any information or guidance from the National Cyber Security Centre (NCSC) to inform your approach to cyber security? (% Yes)
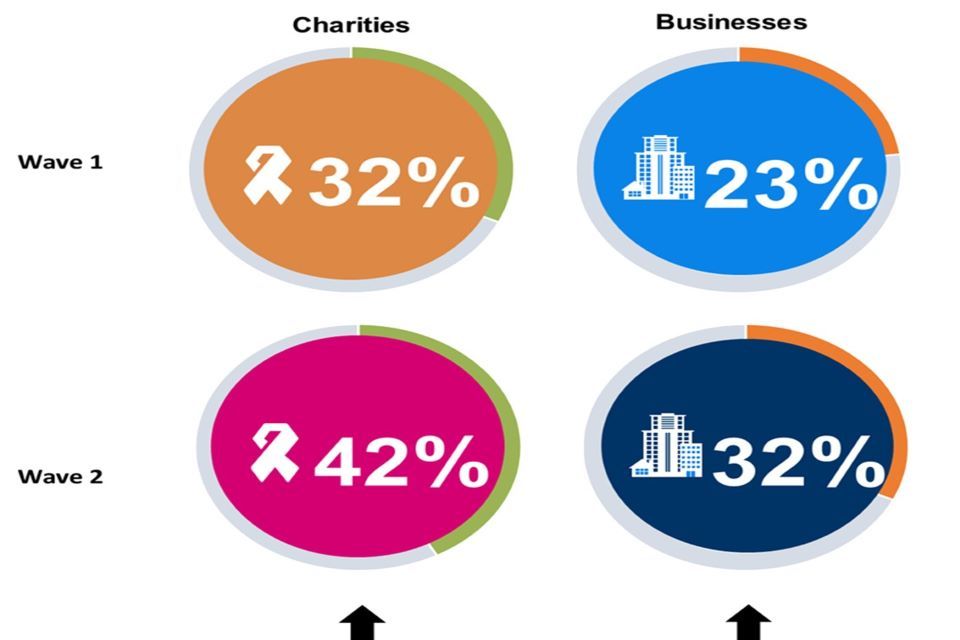
Chart showing the proportion of organisations that have used information or guidance from the NCSC. Responses are split between Wave 1 businesses, Wave 2 businesses, Wave 1 charities and Wave 2 charities
Base: All businesses at Wave 1 (n=1,205) and at Wave 2 (n=688); All charities at Wave 1 (n=536) and at Wave 2 (n=373). Statistically significant changes between Wave 1 data and Wave 2 data are represented by an arrow.
Large businesses with 250+ employees (42%) remain more likely than medium businesses with 50-249 employees (30%) to have used NCSC information in the last twelve months. Businesses adhering to the Cyber Essentials Plus (68%) or Cyber Essentials standards (51%) or certified to ISO 27001 (49%) are much more likely to have used NCSC guidance than businesses without any of these certifications (26%). In addition, businesses that have experienced a cyber security incident in the last year are around twice as likely as those who have not to have used NCSC guidance (38% vs. 20%). Charities that have experienced an incident are also around twice as likely as those that have not to have used NCSC guidance (47% vs 25%). These differences are consistent with the findings of the baseline study.
The increased use of NCSC information or guidance among businesses is driven by those in the longitudinal sample (interviewed in both Wave One and Wave Two) – some 35% had used NCSC guidance in the last twelve months, up from 26% in Wave One. In contrast, one-quarter of businesses interviewed for the first time in Wave Two (25%) had used NCSC guidance in the last year. Charities in the longitudinal sample and fresh sample (41% and 43% respectively) are similarly likely to use NCSC information or guidance.
Among businesses that have used NCSC information or guidance, two-thirds (66%) have used NCSC GDPR guidance.[footnote 12] Some specific guidance tools have been used more so than in Wave One: more businesses have used the Cyber Assessment Framework (51%, up from 41% in Wave One), weekly threat reports (41% vs. 32%), and the Cyber Security Board Toolkit (34% vs. 23%). However, use of the 10 Steps to Cyber Security remains the most common (54%, consistent with 57% in Wave One).
However, among charities, the types of guidance used are consistent with the baseline survey, with the 10 Steps to Cyber Security (65%) being the most commonly used again. As with businesses, more than six out of ten charities using NCSC guidance in the last year (63%) have accessed their GDPR guidance.
Figure 6.2: Use of NCSC guidance (among organisations using NCSC guidance)
Which of the following NCSC information or guidance, if any, have you used?
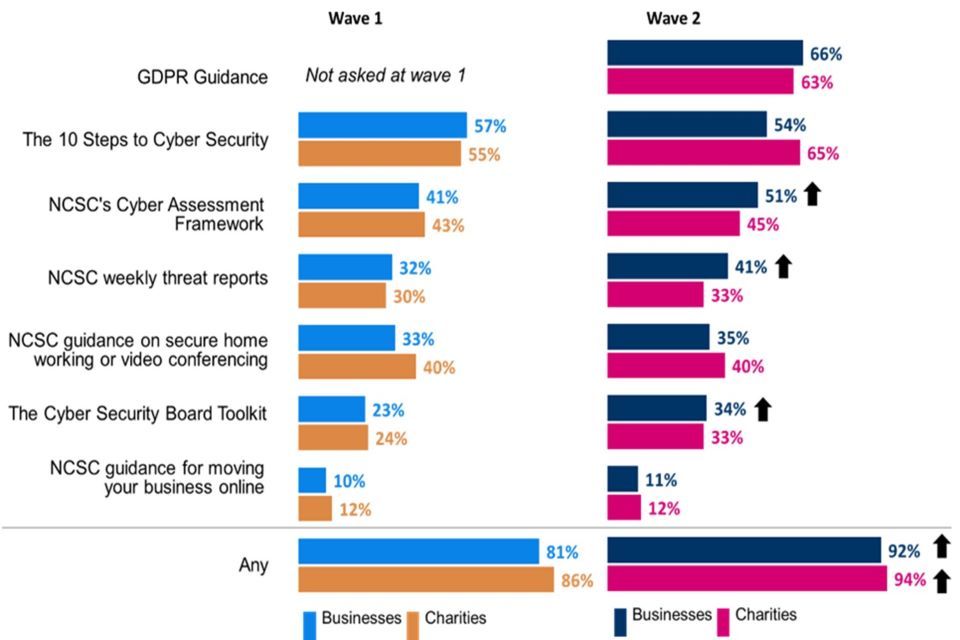
Clustered bar charts for Wave 1 and Wave 2 showing the use of different forms of NCSC information or guidance among organisations. Responses are split between businesses and charities.
Base: All businesses that have used NCSC guidance at Wave 1 (n=311) and at Wave 2 (n=245); All charities that have used NCSC guidance at Wave 1 (n=169) and at Wave 2 (n=155). Statistically significant changes between Wave 1 data and Wave 2 data are represented by an arrow.
In the qualitative interviews, participants that had accessed NCSC guidance tended to be positive, for example praising the quality of the information available and highlighting trust in the NCSC to provide unbiased guidance.
Strategically, NCSC is a great place to go to. They really know what they’re about - there is masses of information online, it’s really useful.
– Business, Large, Information and Communication
Their advice is unbiased, they’re not pushing [a] product, and the information they give me is from the best facts they have.
–Business, Medium, Transport or Storage
However, others were more likely to use other sources for everyday purposes or even identified perceived deficiencies in relevant information, for example guidance in relation to current or fast-moving events.
I have looked at the NCSC site, but not as a first source of information – I go there to check policy.
–Business, Medium, Information and Communication
My workload is high, I’m too busy to navigate unless I have a specific question. If there is a newsletter or report in my inbox, I’ll read it.
–Business, Medium, Administration and Support Services
There are some very good government sources like NCSC, but they are packaged, not up-to-date or granular. Government resources would not provide the latest news on cyber security to do with geopolitical events like Russia/Ukraine or China/Taiwan.
–Business, Large, Manufacturing
6.2 Other information sources/influencers
The survey asked about the extent to which each of six external sources has influenced organisations’ actions on cyber security in the last twelve months. As was the case in the baseline survey, the greatest external influence is external IT or cyber security consultants. Around half of businesses (53%) say feedback from this group has influenced their actions on cyber security, which is higher than in Wave One (47%). The next most important influences on businesses are their insurers (35%) and customers (27%), both of which have also increased compared with the baseline survey (from 26% and 21% respectively). Investors or shareholders continue to be the least commonly cited influence (13%).
External IT or cyber security consultants are also the most important influence on the actions of charities (56%), although for charities this proportion is consistent with the baseline survey (55%). Insurers also continue to be the next most common external influence for charities, and a higher proportion of charities (41%) report this to be the case than in Wave One (30%).
Figure 6.3: Influence of external sources on actions
Over the last 12 months, how much have your actions on cyber security been influenced by feedback from any of the following groups?
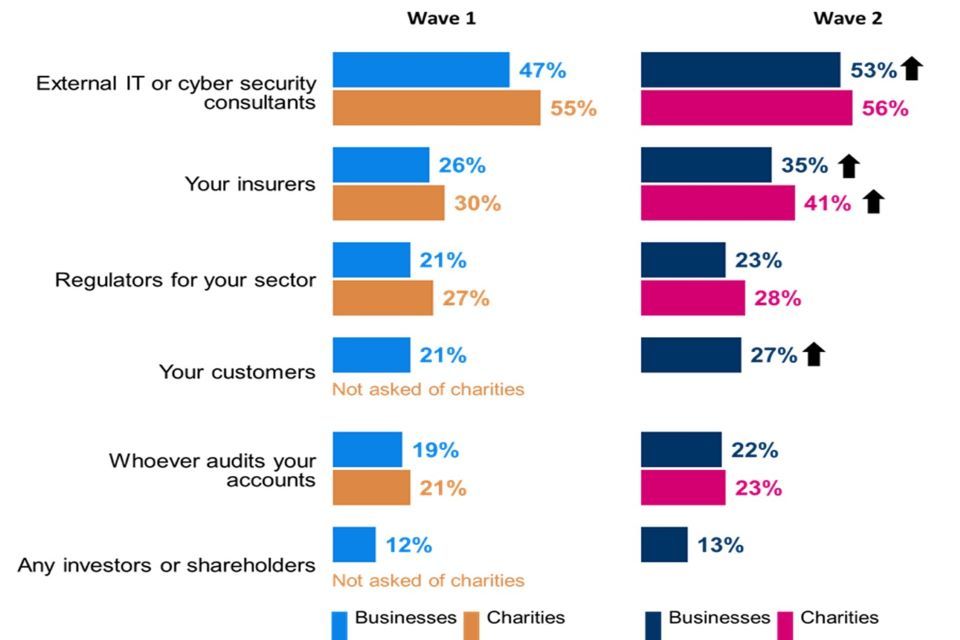
Clustered bar charts for Wave 1 and Wave 2 showing the proportion of organisations whose actions have been influenced by feedback from external groups. Responses are split between businesses and charities.
Base: All businesses at Wave 1 (n=1,205) and at Wave 2 (n=688); All charities at Wave 1 (n=536) and at Wave 2 (n=373). Statistically significant changes between Wave 1 data and Wave 2 data are represented by an arrow.
Among both businesses and charities, organisations adhering to relevant certifications (i.e., that have all five technical processes in place required to attain Cyber Essentials; that manage supplier risk; and that have board oversight of cyber security) tend to have been influenced more by these various stakeholders.
Around one in six businesses (16%) have reviewed or changed their cyber security policies in the last twelve months as a result of another organisation in their sector experiencing a cyber security incident. This is therefore a more common driver of change to policies and processes than another organisation in their sector implementing a similar measure (10%). Both of these proportions are consistent with the baseline survey.
The proportion of charities that report changing their cyber security policies or processes due to these factors is also consistent with Wave One: one in five (20%) have changed their policies or processes as a result of another organisation experiencing an incident, and around one in seven (14%) have done so as a result of another organisation implementing a similar measure.
Businesses and charities adhering to relevant certifications, those with all five technical processes in place required to attain Cyber Essentials, those with board oversight of cyber security and those that have experienced an incident are all more likely to have changed their cyber security policies or processes as a result of these external factors. There were no differences between the longitudinal and fresh samples, either for businesses or charities.
The qualitative interviews examined information sources and influencers in more detail. In addition to the groups outlined above, more informal networks were mentioned as important sources of information, as well as podcasts and relevant newsletters, forums, or communities.
I use external sources for real-time information and trends, latest news – the GRC podcast with Steve Gibson provides granular technical info that’s very up to date. I keep track of multiple resources on Twitter, forums etc.
–Business, Large, Manufacturing
I read the latest bulletins on cyber security, seminars through CSG (Computer Services Group). They are useful as a ‘non-techy’ person.
–Business, Large, Administration and Support Services
We bought out a small digi-tech company: they have a cyber security portal we have access to which covers new policies and issues. I also use the Data Protection Network – a consultancy covering GDPR policy and annual training; and there’s a weekly newsletter from FFT (Full Frame Technology) with news, articles etc. on the latest viruses.”
–Business, Medium, Information and Communication
Chapter 7- Cyber incident management
Where a cyber incident does occur, it is vital that organisations have the correct protocols in place to deal with these changes. This chapter covers the prevalence of written incident management processes within organisations. It goes on to detail what is included in these documents.
Broadly speaking the procedures for cyber incident management have not changed dramatically in the last twelve months. Compared to Wave One:
- The proportion of organisations that have written processes for managing cyber security incidents is broadly in line with Wave One (56% of businesses and 55% of charities, vs. 51% for both in Wave One).
- Among businesses with written incident management processes, there has been an increase in those including guidance for reporting incidents externally, for instance to regulators or insurers (up from 77% to 85%).
- The extent to which incident response policies and processes are being tested remains similar to Wave One with only a minority of relevant businesses (43%) and charities (33%) doing so in the last year.
7.1 Processes
A majority of organisations (56% of businesses and 55% of charities) have written processes in place for managing cyber security incidents. These include, for example, such elements as an incident response plan. The proportion of organisations with written processes in place is broadly in line with Wave One when 51% of both businesses and charities had such processes.
Around two in five organisations (36% of businesses and 39% of charities) do not have written processes in place, while fewer than one in ten are unsure (8% of businesses and 6% of charities).
Medium-sized businesses (54%) and large businesses with 250-499 employees (56%) are similarly likely to have written processes for managing cyber security incidents, but such processes are much more prevalent among very large businesses with 500+ employees (71%).
There is much higher than average prevalence of written processes where businesses adhere to one or more certifications (for example, 78% of businesses adhering to ISO 27001), where supplier risk is managed (82%), where specific cyber security insurance is in place (72%) and where there is a degree of board oversight. Similar findings are evident among charities, providing further evidence that those organisations attaching importance to cyber security are working to cover all aspects in as complete a manner as possible.
Businesses in the longitudinal sample (interviewed in both waves) are more likely than those interviewed for the first time in Wave Two to have written processes in place (59% vs. 48%). While there is a difference between the longitudinal and fresh samples, it is possible that organisations have responded to Wave One and then reviewed their cyber security processes. Given this, it is important to be cautious when interpreting this finding.
Although causality cannot be proved, there remains a link between experiencing a cyber security incident in the last twelve months and having written processes in place. Some 60% of businesses and 59% of charities having experienced an incident also have written processes in place, compared to 44% of businesses and 40% of charities that did not experience an incident. This gap is even larger when phishing incidents are excluded.
Among those businesses with written incident management processes, almost nine in ten (85%) include guidance for reporting incidents externally, for instance to regulators or insurers. This represents an increase from Wave One (77%). At least six in ten businesses include legal or regulatory requirements (66%) and communications and public engagement plans (60%) in their processes, which are both in line with the baseline survey.
The content of charities’ written incident management processes is very similar to that of businesses. For example, almost nine in ten charities (86%) with written processes include guidance for reporting incidents externally. As Figure 7.1 illustrates, the elements of charities’ incident management processes are almost identical to those reported in Wave One.
Figure 7.1: Organisations’ incident management processes
Which of these, if any, is covered in your written incident management processes?
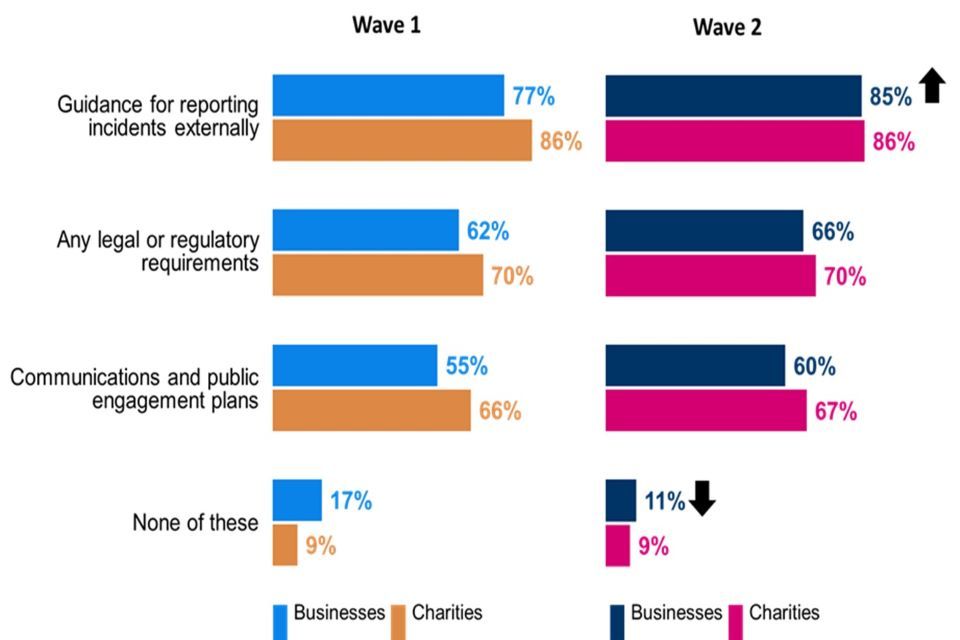
Clustered bar charts for Wave 1 and Wave 2 showing the proportion of organisations that include different forms of guidance or requirements in their written incident management processes. Responses are split between businesses and charities.
Base: All who have incident management processes: Businesses (Wave 1 n=643, Wave 2 n=404); Charities (Wave 1 n=272, Wave 2 n=206). Don’t know not shown. Statistically significant changes between Wave 1 data and Wave 2 data are represented by an arrow.
Coverage of legal or regulatory requirements is more likely among businesses that have all five technical controls required to attain Cyber Essentials in place (82%), that manage supplier risks (also 82%) and whose boards receive at least monthly cyber security updates (76%), compared to all businesses (66%).
Large businesses with 250+ employees (68%) are more likely than medium-sized businesses (58%) to include communications and public engagement plans in their written incident management processes but otherwise there is little variation by size.
While most organisations have written processes in place for managing cyber security incidents, only a minority of these have tested their incident response policies or processes in the last twelve months. Testing is more likely to have happened among businesses (43%) than charities (33%), but in both cases these shares are broadly in line with Wave One.
A majority of large businesses (with 250+ employees) have tested their incident response policies and procedures within the last twelve months (52%, versus 42% of medium-sized businesses). As might be expected, a majority of businesses and charities adhering to the Cyber Essentials standard and ISO 27001 certification have tested their process within the last year. However, only one-third (34%) of charities with specific cyber security insurance have tested their processes in the last year.
The qualitative research found that many organisations are content to take an informal approach when responding to cyber incidents. They saw little value in having a formal incident response plan. Typical comments were that things worked very informally in their organisation, or that in the event of an incident a common-sense approach was all that was required. In the absence of a formal incident plan some organisations relied on their IT consultants instead.
At the moment it is very ad hoc, and we have had a major incident where someone hacked the system in what is called a sequel injection attack that dropped the main protection database resulting in a four-hour outage while the team recovered.
–Business, Medium, Media and Broadcasting
Many organisations also reported that they did not have formal incident response plans. As in the quantitative research, organisations that did have formal written processes often did not test them. However, in contrast to Wave One, several of the organisations interviewed that did not have a formal incident response plan in place reflected on the value of having this in future or said that they had plans to do so. In some instances, the process of formalising the plan was part of cyber security accreditation.
As part of ISO 27001, we will be moving things to doing everything once a year… Nothing’s formal at the minute, but we are formalising things and moving forward.
–Business, Medium, Information and Communication
As in Wave One, the level of detail in the plans of those organisations that have formal incident reporting processes varied widely. Some plans simply set out to whom incidents should be reported and who should deal with them. Others were far more comprehensive, covering roles and responsibilities, communications and record keeping, with targets set for how quickly an incident should be resolved and responses depending on the type of incident. A few organisations used more general incident response plans for cyber security, as originally developed for IT or broader risk management.
The qualitative interviews highlighted the absence of a recognised standard for record keeping. Some organisations keep detailed records of incidents or potential incidents, while others only record major incidents or rely on their IT consultants to keep a log. Records are typically used to identify follow up actions and lessons learned or to review the organisation’s risk strategy.
We don’t tend to have defined processes in place… it’s more things happen, and I would report to my MD and board
–Business, Medium, Construction
The few organisations that did have detailed formal incident response plans tended to operate in the information and communications or finance sectors. They also tended to be organisations that had previously experienced cyber security incidents and had implemented their plans in part as a response to these incidents. Conversely, several organisations that operated without formal incident response plans did not feel it was necessary because they had not been subject to a significant cyber security incident. This reinforces the impression that despite widespread reports of the impact of major cyber attacks, many organisations still prefer to take a reactive rather than proactive approach.
Chapter 8- Prevalence and impact of cyber incidents
This section explores the type and frequency of cyber incidents that organisations have experienced over the last twelve months. It also discusses the impact that these incidents have on organisations.
While cyber incidents have become common, especially for businesses, the impact of these attacks has remained consistent since Wave One, Compared to Wave One the findings of greatest note are:
- A higher share of charities have experienced incidents (81%, up from 74% in Wave One). There was no significant change among businesses.
- Charities are more likely to report having experienced a phishing attack in Wave Two (up from 69% to 77%).
- The frequency of cyber security incidents reported is consistent with Wave One.
- If phishing attacks are excluded, the proportion of businesses that experience a cyber security incident at least monthly has increased (from 53% to 60%).
- The proportion of organisations negatively impacted by cyber security incidents has remained constant (22% of businesses and 26% of charities experiencing at least one such incident in the last twelve months).
- Among both businesses and charities, the wider organisational impact of cyber security incidents is almost identical to that recorded in Wave One.
- Businesses are now more likely than charities to have an established rule or policy not to make ransomware payments (47% vs. 39%), and more likely than in Wave One (an increase from 41%).
8.1 Experience of cyber incidents
Around three-quarters of businesses (74%) and eight in ten charities (81%) have experienced some form of cyber security incident over the last twelve months. As summarised in Figure 8.1, this includes any type of incident from phishing attacks to devices being infected with ransomware or malware, hacking of bank accounts, websites etc. The share for businesses is similar to Wave One (72%), but it is increased for charities (up from 74% of charities reporting incidents in Wave One).
On a related note, charities in the longitudinal sample (interviewed in both waves) are more likely to report a cyber security incident in Wave Two (83%, compared to 71% in Wave One). However, the Wave Two share is broadly in line with the 78% of charities in the fresh or top-up sample reporting a cyber security incident in the last year.
Even when phishing attacks are excluded, a majority of organisations still report at least one incident over the last year (53% of businesses and 51% of charities). Both of these shares are in line with Wave One.
Two types of activity dominate organisations’ experience of cyber security incidents. These are phishing and where people are impersonating the organisation in emails or online. With one exception, and for both businesses and charities, each type of incident has occurred to the same extent as in Wave One. The exception is phishing attacks on charities, where there has been an increase in the proportion of charities reporting phishing attacks (up from 69% to 77%).
As was the case in Wave One, approximately one in ten organisations (both businesses and charities) have experienced attempted hacking of their website, social media, or user accounts, or devices becoming infected with malware (other than ransomware), e.g., viruses, Trojans, or spyware.
Figure 8.1: Types of cyber incident experienced in the last twelve months
Have any of the following happened to your organisation in the last twelve months? (% yes)
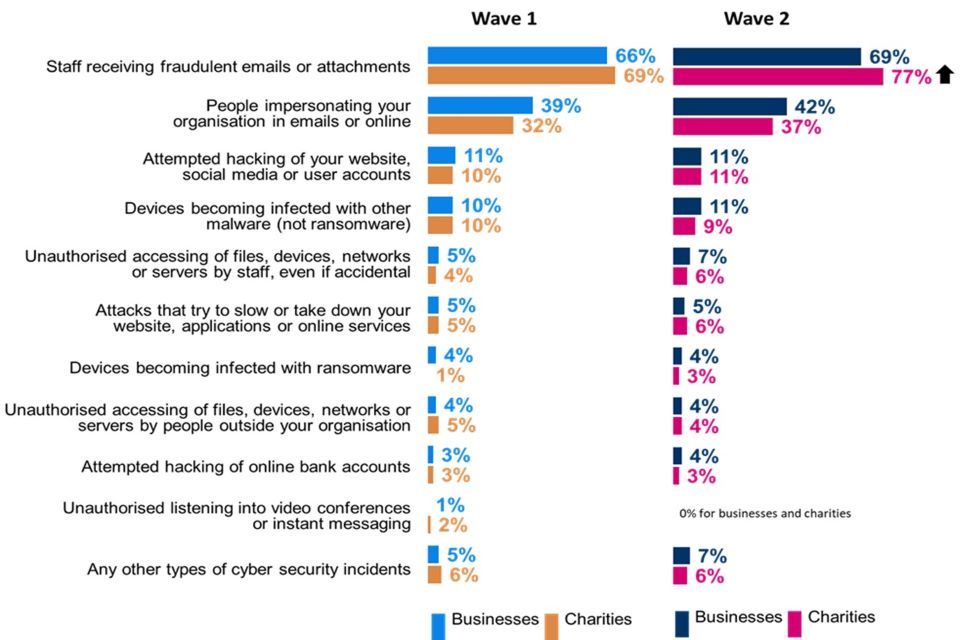
Clustered bar charts for Wave 1 and Wave 2 showing the proportion of organisations that have experienced various types of cyber incident. Responses are split between businesses and charities.
Base: All businesses (Wave 1 n=1,205, Wave 2=688); All charities (Wave 1 n=536, Wave 2 n=373). Don’t know not shown. Statistically significant changes between Wave 1 data and Wave 2 data are represented by an arrow.
Possibly reflecting their greater complexity and range of activities, two-thirds of large businesses (67%) report some form of incident other than phishing, compared to just half of medium-sized businesses (51%). A majority of businesses with 250+ employees (51%) report someone impersonating their organisation in emails or online in the last year, compared to 40% of medium-sized businesses.
Organisations adhering to one or more cyber security-related certifications may be more aware of incidents, as a higher proportion of those with certifications report having experienced an incident over the last twelve months. For example, four in five businesses (81%) adhering to the Cyber Essentials Plus standard experienced a phishing incident in the last year compared to 68% of businesses not adhering to any certifications. Similarly, nearly six in ten (57%) businesses adhering to the Cyber Essentials Plus standard say people impersonated their organisation in emails or online, compared to 41% of businesses not adhering to any certifications.
Related to this, organisations whose board is more actively involved in dealing with cyber security risks and issues are also more likely to be aware of incidents in the last twelve months. For instance, 85% of businesses whose board receives updates on cyber security at least every month report cyber security incidents compared to 54% of businesses whose board never receive updates on cyber security. There is unlikely to be a causal link, but the correlation may indicate that organisations that are more engaged in cyber security are more likely to monitor their systems and detect breaches, and to escalate incident reports.
Cyber security incidents tend not to be one-off events. More than eight in ten organisations (84% of businesses and 82% of charities) that experienced a cyber security incident in the last year say such incidents occurred more than once. A majority (59%) of businesses experiencing any form of incident say it happens at least once a month, while for one in three (34%) it is a weekly occurrence. Large businesses, however, are no more likely than medium businesses to experience frequent cyber security incidents. While in absolute terms large businesses may experience more incidents, they are no more likely than medium-sized businesses to experience frequent cyber incidents.
Although there could be differences in internal monitoring and reporting systems, at face value charities that report having experienced a cyber security incident in the last year appear to be targeted less frequently than businesses. They are less likely to experience cyber security incidents on at least a monthly (44%) or weekly (18%) basis.
The frequency of cyber security incidents reported in Wave Two is consistent with Wave One, i.e., incidents are occurring with the same degree of frequency as they were in the baseline survey.
Figure 8.2: Frequency of cyber security incidents
Approximately, how often in the last twelve months did you experience any of the cyber security incidents you mentioned?
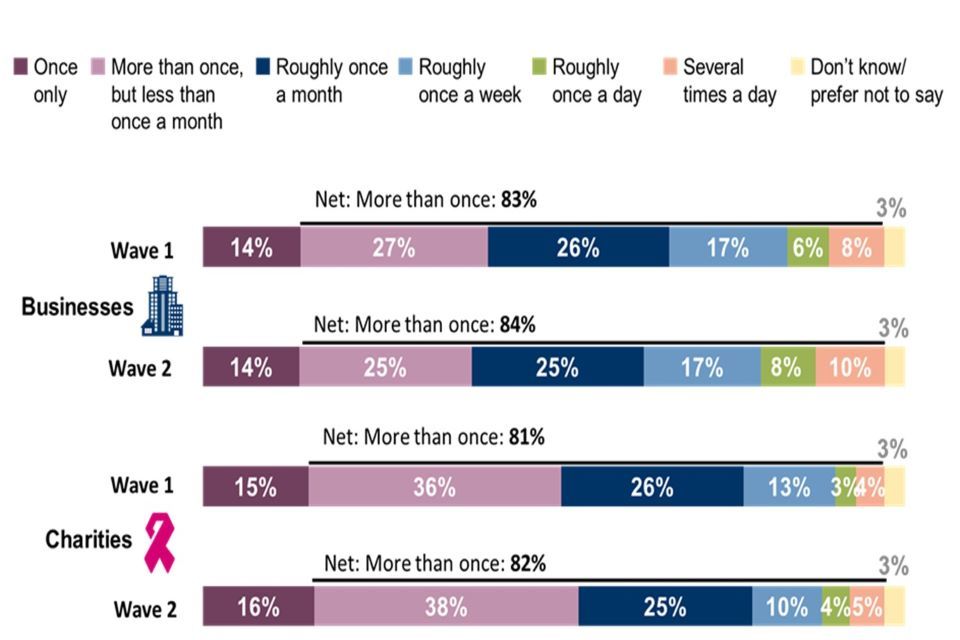
Stacked bar chart showing the frequency of cyber security incidents that organisations have experienced. Responses are split between Wave 1 businesses, Wave 2 businesses, Wave 1 charities and Wave 2 charities.
Base: All who have experienced any cyber security incidents in the last twelve months; Businesses (Wave 1, n=883; Wave 2, n=533); Charities (Wave 1, n=394; Wave 2, n=303). Statistically significant changes between Wave 1 data and Wave 2 data are represented by an arrow.
It is not just phishing attacks driving the frequency with which cyber security incidents occur. Even when phishing attacks are excluded, the vast majority of organisations that experienced an incident say these happened multiple times in the last twelve months (85% of businesses and 78% of charities). Non-phishing incidents are more frequently experienced by businesses with 60% reporting that they experienced these at least monthly (compared to 44% of charities). This monthly figure for businesses is higher than in Wave One (53%).
8.2 How are businesses affected?
While most organisations do not suffer any serious consequences as a result of cyber security incidents, around one-quarter have been negatively impacted (22% of businesses and 26% of charities that experienced an incident in the last year). These shares are in line with Wave One and as illustrated in Figure 8.3 the most common outcomes, mentioned by more than five per cent of organisations, are: * Temporary loss of access to files or network (ten per cent of businesses and nine per cent of charities) * Compromised accounts or systems used for illicit purposes (five per cent of businesses and eight per cent of charities)
The occurrence of all individual outcomes shown in Figure 8.3 are in line with Wave One overall. However, the longitudinal charity sample (interviewed in both waves) were less likely to experience their website, applications or online services being taken down or made slower as a result of a cyber incident in the last twelve months (down from 11% in Wave One to four per cent in Wave Two)
Figure 8.3: Outcome of cyber incident on organisation
Thinking of all the cyber security incidents experienced in the last twelve months, which, if any, of the following happened as a result? (Top mentions only shown)
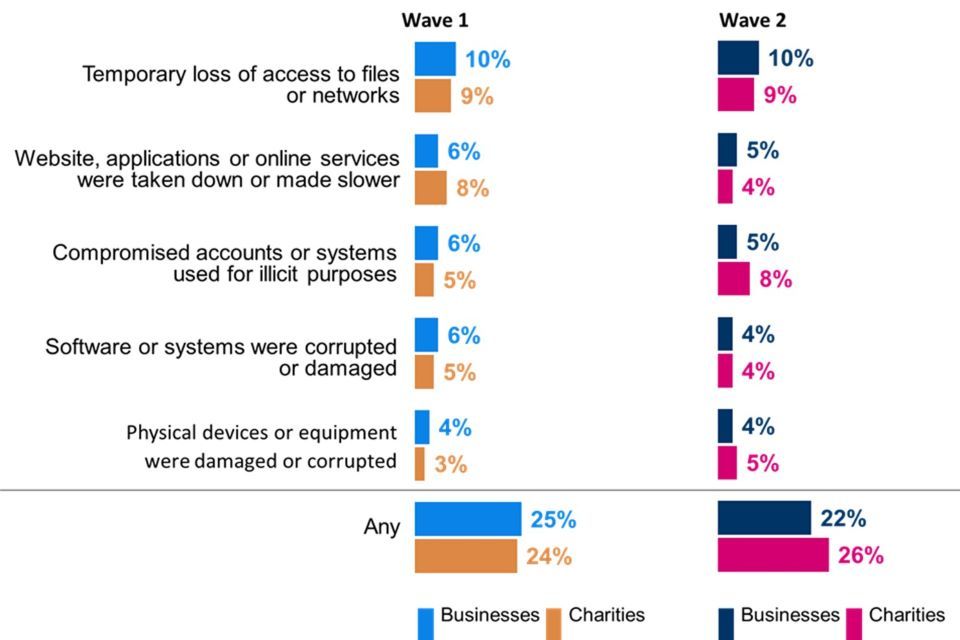
Clustered bar charts for Wave 1 and Wave 2 showing the outcomes of cyber security incidents that organisations experienced. Responses are split between businesses and charities.
Base: All who have experienced any cyber security incidents over the last twelve months; Businesses (Wave 1 n=883, Wave 2 n = 533); Charities (Wave 1 n=394, Wave 2 n=303). Don’t know not shown. Statistically significant changes between Wave 1 data and Wave 2 data are represented by an arrow.
Although rare, three per cent of businesses and four per cent of charities that experienced a cyber security incident in the last twelve months say money was stolen is a cause of concern. This is in line with Wave One (two per cent and four per cent respectively).
Very large businesses with 500+ employees are more likely to suffer certain outcomes of a cyber security incident than medium-sized businesses. For example, they are more likely to experience temporary loss of access to files or networks (17% vs. 10%), to have their website, applications or online services taken down or made slower (11% vs. 4%), and to have lost access to third-party services they rely on (nine per cent vs. three per cent).
Even incidents that do not result in negative financial consequences or data loss can have an impact on organisations. Therefore, organisations that experienced a cyber incident in the last twelve months were also asked about the wider impact of incidents on their organisation.
Figure 8.4 shows the most common organisational impacts of cyber incidents. It illustrates that around half (51% of businesses and 52% of charities) were impacted in at least one of the ways listed. Just over one in three (35% of businesses and 34% of charities) say that new measures were needed to prevent or protect against future incidents, and a similar proportion (33% and 36% respectively) report that additional staff time was required to deal with such incidents.
The wider organisational impacts of cyber security incidents, for both businesses and charities, are almost identical to the baseline survey findings.
Large businesses with 250+ staff (62%) are more likely than medium-sized businesses (48%) to report that cyber incidents have had wider organisational impacts. In particular, large businesses are more likely to say new measures are needed to prevent or protect against future incidents (46% vs. 32%).
Figure 8.4: Impact of incident on organisation
Have any of these incidents impacted your organisation in any of the following ways? (Only mentions with five per cent or higher are shown)
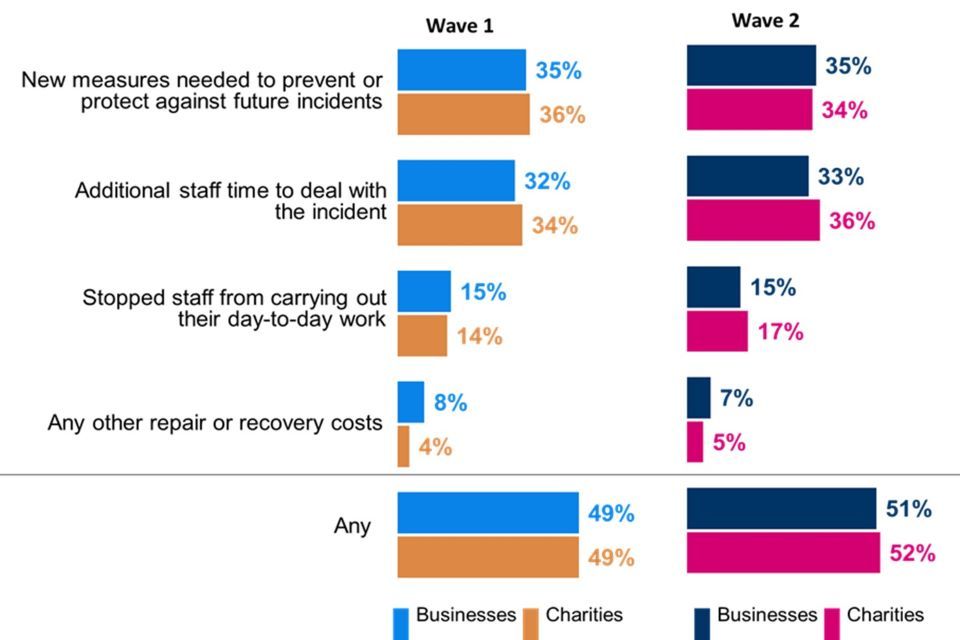
Clustered bar charts for Wave 1 and Wave 2 showing the impacts of cyber security incidents that organisations experienced. Responses are split between businesses and charities.
Base: All who have had any cyber security incidents over the last twelve months; Businesses (Wave 1 n=883, Wave 2 n=533); Charities (Wave 1 n=394, Wave 2 n=303). Don’t know not shown. Statistically significant changes between Wave 1 data and Wave 2 data are represented by an arrow.
8.3 Ransomware attack response policy
Just under half of businesses (47%) and around four in ten charities (39%) have a rule or policy not to make ransomware payments. The proportion of businesses with such a policy is higher than in Wave One (41%), while it is unchanged among charities (40%).
Approximately one-quarter of organisations (24% of businesses and 28% of charities) do not have a rule or policy on ransomware attacks, while the remainder (29% of businesses and 33% of charities) are unsure if a ransomware policy exists.
A majority of organisations with all five technical controls in place required to attain Cyber Essentials make it a rule not to make ransomware payments (55% of businesses, 60% of charities).
8.4 Time taken to restore business operations after cyber incident
The vast majority of incidents have a short-term impact on operations. Nine in ten organisations (93% of businesses and 91% of charities) that have experienced an incident in the last year took less than a day to restore business operations back to normal. At least seven in ten report that it took “no time at all” with businesses (78%) more likely to say this than charities (70%).
This may be in part driven by the high prevalence of phishing attacks among the incidents reported by organisations. Charities that reported non-phishing cyber security incidents are less likely to report that it took “no time at all” (57%, compared to 70% of charities when phishing incidents are included). For businesses, the equivalent shares are 72% (excluding phishing) and 78% (including phishing).
Eight in ten medium-sized businesses (80%) say it took “no time at all” to restore operations. This compares to two-thirds (66%) of very large businesses.
Fewer than one in ten organisations (six per cent of businesses and nine per cent of charities) say it took a day or longer to get operations back to normal following a cyber security incident in the last twelve months. One per cent of businesses and three per cent of charities say they were affected for a week or longer.
These findings resonate with the qualitative research as in these interviews no mentions were made of recent cyber security incidents that had resulted in a long-term impact on the organisation. Instead, participants placed a lot of emphasis on measures that prevent incidents from happening in the first place and having procedures in place to ensure any incident can be resolved quickly and therefore cause minimal disruption to the business.
You could measure the effectiveness of our cyber security processes on the back of the fact that we haven’t had a major incident”
–Business, Information and Communications, Large
No one can be in good shape on cyber security, you need to assess and progress on it the whole time. You’re defending so you’re on the weaker side, you have to adapt and evolve your processes the whole time.”
–Business, Information and Communications, Medium
Everyone is aware of their responsibilities depending on the severity of the incident. The incident response plan is reviewed [and tested] every year. When an incident happens, it is reported, IT takes action to limit the damage then isolate that PC and bring to the lab, check logs and correlate logs, then report back to the MD, he will discuss with the CEO and decide if we have to escalate to the authorities.
–Business, Construction, Large
When looking at changes compared to Wave One, significant differences were found among longitudinal charity organisations. For example, there has been an increase in the proportion of charities that experienced a cyber incident in the previous 12 months (83% in Wave Two compared to 71% in Wave One). This was largely driven by an increase in the specific incident of staff receiving fraudulent emails or attachments or arriving at fraudulent websites (78% in Wave One, 67% in Wave Two). Differences were also found in the proportion of charities that reported incidents occurring more than once a day (from 5% in Wave One to 12% in Wave Two). However, fewer charities experienced their website, applications or online services being taken down or made slower as a result of a cyber incident (down to 4%, from 11% in Wave One).
8.5 Financial cost of incidents
Following the approach taken by the Cyber Security Breaches Survey, this survey has attempted to capture the overall cost of cyber security incidents faced in the last twelve months, and separate, more granular questions breaking down different aspects of the cost of the single most disruptive incident that organisations recall facing in this period. Costs covered include short-term and long-term direct costs, staff time costs and other indirect costs.
Due to the costs of the one most disruptive incident being collected in four constituent questions, and the overall financial cost of all incidents being collected in one subsequent separate question, direct comparisons between the two data sources should be avoided.
- Respondents are not forced to give consistent answers in the survey script due to the complexities around doing that.
- Respondents may not consider all four granular cost elements when answering the overall cost question in the survey (or consider there to be some overlaps).
Overall cost of incidents
Table 8.1 below shows the estimated costs organisations incurred from all the identified incidents over the last twelve months. When asked about cost, organisations are asked to bear in mind all the potential impacts.
Table 8.1: Average cost of all incidents identified in last year
| All businesses | Medium businesses | Large businesses | All charities | |
|---|---|---|---|---|
| Across organisations identifying any incidents | ||||
| Mean cost | £2960 | £2060 | £7100 | £1978 |
| Median cost | £0 | £0 | £43 | £0 |
| Base | 510 | 286 | 89 | 297 |
| Only across organisations identifying incidents with an outcome | ||||
| Mean cost | £8920 | £5820 | £18010 | £4620 |
| Median cost | £1100 | £700 | £2310 | £1575 |
| Base | 195 | 149 | 20 | 111 |
Costs associated with the most disruptive incidents
Tables 8.2 to 8.5 show cost estimates for the single most disruptive incident that organisations have identified in the last twelve months. Again, these are presented for all incidents, as well as those with an actual outcome, such as a loss of assets or data.
In the survey, we defined short-term direct costs as being any external payments that were made when dealing with the incident. This includes, as examples offered to respondents:
- any payments to external IT consultants or contractors to investigate or fix the problem
- any payments to the attackers, or money they stole.
Table 8.2: Average short-term direct cost of most disruptive incident in last year
| All businesses | Medium businesses | Large businesses | All charities | |
|---|---|---|---|---|
| Across organisations identifying any incidents | ||||
| Mean cost | £1131 | £1122 | £1150 | £345 |
| Median cost | £0 | £0 | £0 | £0 |
| Base | 510 | 286 | 89 | 297 |
| Only across organisations identifying incidents with an outcome | ||||
| Mean cost | £3325 | £3320 | £3290 | £1236 |
| Median cost | £0 | £0 | £2500 | £0 |
| Base | 195 | 149 | 20 | 111 |
We defined long-term direct costs as external payments in the aftermath of the incident. The examples included in the survey were:
- any payments to external IT consultants or contractors to run cyber security audits, risk assessments or training
- the cost of new or upgraded software or systems
- recruitment costs if you had to hire someone new
- any legal fees, insurance excess, fines, compensation, or PR costs related to the incident.
Table 8.3: Average long-term direct cost of most disruptive incident in last year
| All businesses | Medium businesses | Large businesses | All charities | |
|---|---|---|---|---|
| Across organisations identifying any incidents | ||||
| Mean cost | £761 | £630 | £1280 | £824 |
| Median cost | £0 | £0 | £0 | £0 |
| Base | 510 | 286 | 89 | 297 |
| Only across organisations identifying incidents with an outcome | ||||
| Mean cost | £1730 | £1324 | £3667 | £915 |
| Median cost | £0 | £0 | £0 | £0 |
| Base | 195 | 149 | 20 | 111 |
We also asked about the costs of any staff time (i.e., indirect costs of the incident). This includes, for instance, how much staff would have got paid for the time they spent investigating or fixing problems caused by the incident. We explicitly asked respondents to include the cost of this time regardless of whether this duty was part of the staff member’s job function or not.
Table 8.4: Average staff time cost of the most disruptive incident in last year
| All businesses | Medium businesses | Large businesses | All charities | |
|---|---|---|---|---|
| Across organisations identifying any incidents | ||||
| Mean cost | £1012 | £832 | £1380 | £422 |
| Median cost | £1 | £1 | £20 | £5 |
| Base | 510 | 286 | 89 | 297 |
| Only across organisations identifying incidents with an outcome | ||||
| Mean cost | £2550 | £2487 | £3110 | £845 |
| Median cost | £200 | £200 | £210 | £295 |
| Base | 195 | 149 | 20 | 111 |
Finally, we asked about other indirect costs related to incidents, including the following areas (offered as examples to respondents):
- the cost of any time when staff could not do their jobs
- the value of lost files or intellectual property
- the cost of any devices or equipment that needed replacing
Table 8.5: Average indirect cost of the most disruptive incident in last year
| All businesses | Medium businesses | Large businesses | All charities | |
|---|---|---|---|---|
| Across organisations identifying any incidents | ||||
| Mean cost | £987 | £704 | £2080 | £107 |
| Median cost | £0 | £0 | £0 | £0 |
| Base | 460 | 271 | 80 | 280 |
| Only across organisations identifying incidents with an outcome | ||||
| Mean cost | £3510 | £2603 | £5940 | £354 |
| Median cost | £0 | £0 | £0 | £0 |
| Base | 175 | 136 | 19 | 93 |
The following key findings can be gleaned from these cost tables:
- The overall costs reported here (in Table 8.1) are in line with what was reported in CSLS Wave One and 2022 Cyber Security Breaches Survey.
- Short term direct costs are reported to be the highest among businesses. This is followed by indirect costs and staff costs.
- Among charities, long-term direct costs are reported to be the highest.
- Overall, businesses tend to identify higher costs than charities on average. This does not necessarily mean that charities face a lower risk – it could be that they tend to have a less comprehensive understanding of the cost implications, so report lower costs.
The median cost is typically £0 (nil) across businesses and charities – also a similar pattern to what is reported in the CSLS Wave One and 2022 Cyber Security Breaches Survey. This reflects the fact that most incidents do not have any material outcome (a loss of assets or data), so do not always need a response. By contrast, the typical organisation that has dealt with a negative outcome from incidents does report non-negligible costs (a median cost across the year of £1000 for businesses overall). Organisations that experienced incidents but are fortunate enough not to lose data or assets, therefore, run the risk of systematically underappreciating the seriousness of cyber security incidents.
Conclusions
These findings represent the second wave in this three-year Cyber Security Longitudinal Survey. The publication provides an insight into how the cyber security of medium-sized and large businesses, and large-income charities, have been responding to current challenges. These challenges include the post-COVID hybrid working environment, increasing inflation and supply chain issues. The publication also provides a staging post which measures changes to see how investment and attitudes to cyber security are evolving.
Reactive approach to cyber defences
Overall, both the Wave Two survey and qualitative research continue to indicate that making changes or improvements to cyber security is often reactive rather than proactive. Some of the changes recorded since Wave One, for example an increase in the usage of NCSC guidance, may be explained predominantly by changes in behaviour amongst the longitudinal sample interviewed in both waves.
The survey findings consistently show a link between organisations having experienced an incident in the last twelve months, having cyber security prevention measures in place and processes for how to manage an incident. This could indicate organisations more engaged with cyber security are more likely to detect incidents, and/or that organisations tend to put measures in place after they experience an incident.
Participants in the qualitative interviews again discussed how greater engagement with cyber security had been triggered by a cyber security incident or was required to secure public sector contracts, as evidence of meeting an accepted standard is often a prerequisite. Organisations, particularly medium-sized businesses, are also more likely to hire consultants or outsource cyber security, and then trust them to address all cyber security related issues on their behalf. In contrast, large organisations are more likely to have the financial means and cyber specialists to drive investment in cyber security.
Lack of board level engagement
The Wave Two findings continue to show relatively low levels of board engagement with cyber security. Only around half of businesses (54%) and four in ten charities (41%) have one or more board members with oversight of cyber security risks. This is in line with the baseline survey (50% and 40% respectively). The qualitative interviews shed light on the difficulties of engaging board members with cyber security, citing lack of IT skills and knowledge, age, and lack of training as barriers to engagement, though there is acknowledgement of changing and evolving attitudes and priorities.
The interviews also highlighted that charities and business sectors that are not so closely related to information technology and finance are likely to face greater barriers to board engagement. However, the survey suggests that board engagement with cyber security can be an important factor in having effective cyber procedures and policies in place. It suggests a correlation between board-level engagement (having a board that receives updates on cyber security at least monthly) and having cyber security certifications, policies, and procedures in place, as well as including information about cyber security in annual reports.
With a few limited exceptions detailed above, businesses and charities in the longitudinal sample (interviewed in both Wave One and Wave Two) behave similarly to businesses and charities interviewed for the first time in Wave Two.
On a positive note, no metrics measured in the survey saw a deterioration between Wave One and Wave Two. In many cases, a statistically significant improvement was recorded for businesses and/or charities. In many other cases, findings headed in a positive direction, but not to a large enough extent to be outside the margin of error. For all of these metrics, the Wave Three findings will give vital evidence regarding the speed and extent of changes in behaviours related to cyber security.
Areas of continued engagement
The summaries below therefore outline areas of continued relatively high (sometimes further increasing) engagement, areas of some improvement since Wave One, and areas of concern where improvement has not yet been recorded. It is the latter areas that perhaps indicate the most challenging areas for businesses and charities to change their behaviours and attitudes on in future.
While far from perfect, there are some areas of cyber security where organisations continue to show reasonable or higher levels of engagement:
- Three-quarters of businesses (74%) and six in ten charities (61%) have an insurance policy that covers cyber security, both increased since Wave One (66% and 53% respectively). The proportion of organisations with a specific cyber insurance policy is also higher (businesses up from 18% to 25%, charities up from 24% to 32%).
- In the last twelve months, more than four in five organisations (85% of businesses and 86% of charities) have taken some action to expand or improve some aspect of their cyber security. This represents an increase from Wave One for businesses (79%) and is consistent for charities (84% in Wave One). Around two-thirds of both businesses and charities have expanded or improved their network security and processes for user authentication and access control in the last year.
- Around three in five businesses and charities (61% and 58% respectively) have in place technical controls in place for each of the five areas required to attain Cyber Essentials certification, with nine in ten (91%) saying they restrict IT admin and access rights to specific users, have up-to-date malware across all their devices, firewalls that cover their entire IT network as well as individual devices, and security controls on their organisation’s own devices.
- In terms of governance and planning, around three-quarters of organisations (72% of businesses and 75% of charities) have a Business Continuity Plan that covers cyber security, similar to Wave One (69% and 73% respectively).
There are two fundamental underlying features driving the higher levels of engagement: businesses size and sector. Large businesses consistently lead the way on cyber security while medium sized businesses lagged behind, suggesting that the additional resources at the disposal of larger firms are more able to build cyber resilience. Similarly, businesses in the information and communication, finance and insurance sectors show higher levels of engagement, potentially reflecting the priorities and level of regulation in their particular industries.
Areas showing some improvement
Some other areas of cyber security including certification and staff training have seen improvements since Wave One, though there is still a long way to go, and the pace and sustainability of these improvements will be measured in Wave Three:
- Around four in ten (40% of businesses and 36% of charities) confirm having cyber security certification in place (either Cyber Essentials, Cyber Essentials Plus and/or ISO 27001). This is up from 32% of businesses and 29% of charities in Wave One.
- Around six in ten organisations (58% of businesses and 62% of charities) carried out cyber security training or awareness raising sessions over the last twelve months for employees or volunteers not directly involved in cyber security. This represents an increase from 48% of businesses and 55% of charities in Wave One.
- Almost half of businesses (45%) report that their board members have received any cyber security training, up from 35% in Wave One. Charities continue to lag on this measure, with one in three (34%) saying any of their board has received cyber security training. There also continues to be a gap between levels of staff training and board training on cyber security.
- A higher proportion of businesses report using specific tools designed for security monitoring in the last year (70%, vs. 61% in Wave One), and conducting a cyber security vulnerability audit (55%, vs, 47% in Wave One).
- One in three businesses (32%) have used information or guidance from the NCSC in the last year, up from 23% in Wave One. A similar increase is reported by charities (from 32% to 42%).
- Although still low, the proportion of businesses including cyber security content in their most recent annual report has increased from 14% to 19%.
Areas of continued concern
The results show that demonstrable progress has yet to be made on a number of areas since the baseline survey:
- Around three in five (61% of businesses and 63% of charities) did not carry out work to formally assess or manage the potential cyber security risks presented by suppliers in the last year. These proportions barely changed compared to Wave One (60% and 64% respectively).
- Only around two-thirds of organisations have patch management procedures in place (66% of businesses and 64% of charities). This is one of the technical controls required to attain Cyber Essentials certification, and these findings are broadly consistent with Wave One (63% and 61% respectively).
- Only around three in ten organisations (30% of businesses and 26% of charities) have any documentation in place outlining how much cyber risk they are willing to accept, again in line with the Wave One findings.
- A sizeable minority of organisations (one-quarter of businesses and three in ten charities) do not have a designated staff member responsible for cyber security who reports directly to the board.
- More than half of charities allow staff to access their network or files through personally owned devices (54%), broadly in line with Wave One (59%).
Supply chain management, seeking formal certifications, board engagement and training, and actively assessing cyber security risks therefore remain areas for improvement for which signs of progress will be monitored in Wave Three.
Underlying all of these factors is their status as less “visible”. Compared to Wave One and Wave Two, it appears that areas that are more ‘top of mind’ (e.g., staff training, formal certifications, and use of NCSC guidance) have seen more improvement than aspects that are less visible or ‘controllable’ (e.g., supply chain management, documentation of risk, and board-level engagement and training). It will be interesting to observe further changes (if any) on these measures in Wave Three.
When assessing progress and overall priorities, both the absolute results and relative changes compared to Wave One should be considered, as well as the salience and importance of each measure. For example, while fewer than one in five organisations included anything to do with cyber security in their most recent annual report, the qualitative interview data suggested this has (or would have) limited benefits. As such, further increasing the shares of organisations with insurance and a business continuity plan covering cyber security may still take priority.
The drivers of increased cyber resilience identified in the baseline survey still hold in Wave Two. However, as shown in Figures 9.1 and 9.2, some of these have increased in prevalence, including board engagement with cyber security, adhering to certifications, and having written processes in place for managing cyber security incidents. Despite this, there are key areas that are still low priorities for businesses, despite improvements between Wave One and Wave Two. This includes addressing cyber security with suppliers and including cyber security in their annual reports. This is perhaps hindered by a reactive approach to cyber security among many firms. This is especially the case among medium-sized businesses which consistently underperform the average for businesses on various metrics of cyber resilience. The converse also applies to organisations that have been impacted by a cyber security incident, which are much more likely to have improved their cyber security protocols in the last year.
Figure 9.1: Factors driving cyber resilience among medium and large businesses
A table showing the most prevalent factors that are driving cyber resilience for medium and large businesses.
Figure 9.2: Factors driving cyber resilience in large charities
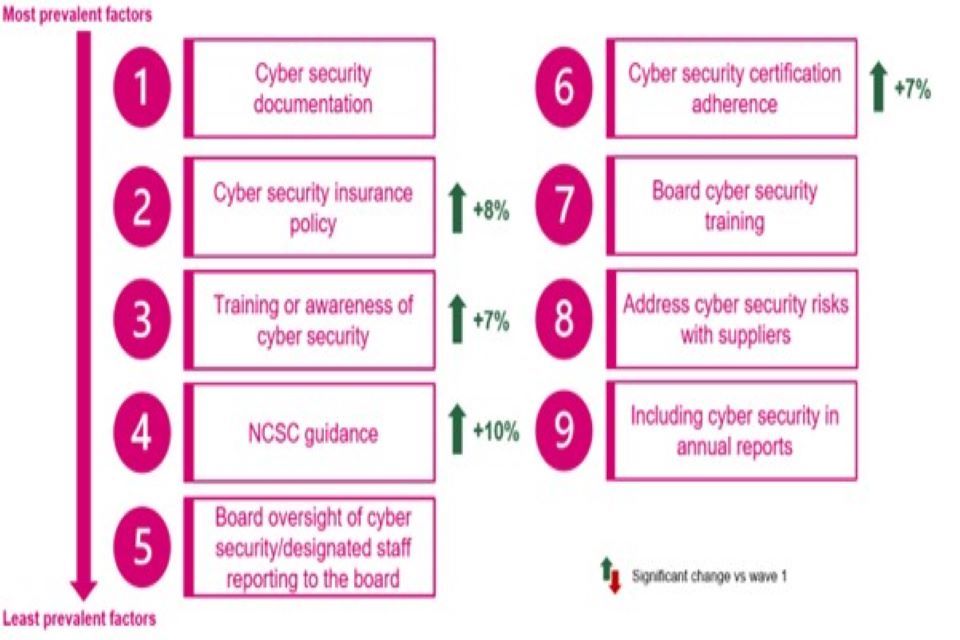
A table showing the most prevalent factors that are driving cyber resilience for high-income charities.
The third wave of the survey will provide further insight into these relationships and:
- their impact on improved resilience over time
- how changes and improvements in cyber security training, policies and processes evolve, and
- the extent to which those who have more robust processes in place are 1) protected from experiencing an incident over time, and 2) less impacted by incidents in terms of frequency, recovery times and costs etc.
Appendix A: Further information
The Department for Digital, Culture, Media and Sport would like to thank Ipsos and Steven Furnell of the University of Nottingham for their work in the development and carrying out of the survey and for their work compiling this report.
This research report is accompanied by infographics and a technical report which can be found on the same page as this report.
The responsible DCMS analyst and statistician for this release is Maddy Ell. For enquiries on this release, please contact us at evidence@dcms.gov.uk.
For general enquiries contact:
Department for Digital, Culture, Media and Sport
100 Parliament Street
London
SW1A 2BQ
Telephone: 020 7211 6000
For media enquiries only (24 hours) please contact the press office on 020 7211 2210.
DCMS statisticians can be followed on Twitter at @DCMSinsight.
This work was carried out in accordance with the requirements of the international quality standard for Market Research, ISO 20252, and with the Ipsos UK Terms and Conditions which can be found at www.ipsos.com/terms.
Appendix B: Guide to statistical reliability
The final data from the survey are based on weighted samples, rather than the entire population of UK businesses or charities. Percentage results are therefore subject to margins of error, which vary with the size of the sample and the percentage figure concerned. For example, for a question where 50% of the 688 businesses sampled in the survey give a particular answer, the chances are 95 in 100 that this result would not vary more or less than 3.7 percentage points from the true figure – the figure that would have been obtained had the entire UK business population responded to the survey. The margins of error that are assumed to apply in this report are given in the following table.[footnote 15]
Margins of error (in percentage points) applicable to %s at or near these levels
| 10% or 90% | 30% or 70% | 50% | |
|---|---|---|---|
| 688 businesses | ±2.2 | ±3.4 | ±3.7 |
| 408 medium businesses | ±2.9 | ±4.4 | ±4.8 |
| 268 large businesses | ±3.5 | ±5.4 | ±5.9 |
| 373 charities | ±3.0 | ±4.6 | ±5.0 |
There are also margins of error when looking at subgroup differences. A difference from the average must be of at least a certain size to be statistically significant. The following table is a guide to these margins of error for the subgroups that we have referred to several times across this report.
Differences required (in percentage points) from overall (business or charity) result for significance at or near these percentage levels.
| 10% or 90% | 30% or 70% | 50% | |
|---|---|---|---|
| 688 businesses | ±2.8 | ±4.4 | ±4.7 |
| 408 medium businesses | ±3.4 | ±5.2 | ±5.7 |
| 268 large businesses | ±4.0 | ±6.0 | ±6.6 |
| 373 charities | ±3.5 | ±5.3 | ±5.8 |
-
Subgroup differences highlighted are either those that emerge consistently across multiple questions or evidence of a particular hypothesis (i.e. not every single statistically significant finding has been commented on). ↩
-
Statistical significance is a determination that the results in the data are not explainable by chance alone. For more information on significance testing, see the Cyber Security Longitudinal Survey Wave Two Technical Report. ↩
-
The NCSC provides a range of guidance for organisations to use. This includes GDPR regulation (https://www.ncsc.gov.uk/information/gdpr), the Board Toolkit and CAF guidance among others. ↩
-
The survey was set up predominantly as a telephone survey but using a multimode (telephone and online) approach aims to maximise response rates by allowing respondents the choice of whether to complete the survey by telephone or online (via a unique survey link emailed if requested during the initial telephone conversation). Participants with a valid phone number were given the option to complete the survey over the phone or online. ↩
-
Including interviews from a pilot from 8-12 April 2022, and main fieldwork from 13 April-28 June 2022. ↩
-
Subgroup differences highlighted are either those that emerge consistently across multiple questions or those that evidence a particular hypothesis (i.e., not every single statistically significant finding has been commented on). ↩
-
Some references to very large businesses (500+ employees) are included where data is of particular interest. Unless stated otherwise, references to large businesses incorporate all businesses with 250+ employees. ↩
-
If organisations had been confirmed as eligible and included in Wave One, but by Wave Two had fewer than 50 employees (businesses) or an income below £1 million (charities), they were still considered eligible to participate in this wave. This applied to 11 panel businesses (plus one that did not know the current number of employees) and 45 panel charities. ↩
-
Developed and operated by the National Cyber Security Centre (NCSC), Cyber Essentials is a foundation level certification designed to provide a statement of the basic controls an organisation should have in place to mitigate the risk from common cyber threats. ↩
-
An international standard on how to manage information security. An Information Security Management System (ISMS) is a set of policies, procedures, and roles designed to ensure cyber security risks are identified and managed. ↩
-
The protections that need to be put in place are the same as for Cyber Essentials, but for Cyber Essentials Plus a hands-on technical verification is carried out. ↩
-
Percentage point refers to the arithmetical difference between two percentages. ↩
-
GDPR guidance not asked in the Wave One survey. ↩
-
Please note, there was a change to the questionnaire for Wave Two which means that cost comparisons between Wave One and Two are not possible. These changes were designed to improve the accuracy of the data collected by the survey by adding additional granularity to the data. A full description of these changes is included in the technical annex. ↩
-
The cost estimates in this section are presented to three significant figures, or to the nearest whole number (if under 100). The mean and median scores exclude “don’t know” and “refused” responses. They merge the answers from respondents who gave a numeric value as well as those who gave only a banded value (because they did not know the exact answer). For the latter, we have imputed numeric values from the given banded values. We lay out this approach in detail in the Technical Annex. ↩
-
In calculating these margins of error, the design effect of the weighting is reflected. This lowers the effective base size for businesses used in statistical significance testing. The overall effective base sizes are 551 for all businesses, 389 for medium businesses and 247 for large businesses. ↩