Criminal Justice Statistics quarterly: December 2019
Updated 26 November 2020
Applies to England and Wales

© Crown copyright 2020
This publication is licensed under the terms of the Open Government Licence v3.0 except where otherwise stated. To view this licence, visit nationalarchives.gov.uk/doc/open-government-licence/version/3 or write to the Information Policy Team, The National Archives, Kew, London TW9 4DU, or email: psi@nationalarchives.gov.uk.
Where we have identified any third party copyright information you will need to obtain permission from the copyright holders concerned.
This publication is available at https://www.gov.uk/government/statistics/criminal-justice-system-statistics-quarterly-december-2019/criminal-justice-statistics-quarterly-december-2019-html
We are trialling the publication of this statistical bulletin in HTML format alongside the usual PDF version and we are seeking user feedback on the use of HTML for the publication of statistical bulletins. Please send any comments to: datausers@justice.gov.uk.
Main Points
| 1.52 million individuals have been dealt with by the CJS (excluding cautions). | The total number of individuals formally dealt with by the criminal justice system (CJS) in England and Wales has been declining since 2015 and fell 1% in the latest year when excluding cautions. The number of prosecutions has been falling since 2010. |
| 1.37 million defendants were prosecuted in 2019. | Down 1% since 2018. The offence groups with the largest increase in prosecutions were violence against the person (up 26%, due to the new ‘assaults on emergency workers’ offence introduced in November 2018) and drug offences (up 13%). |
| The overall conviction ratio remained broadly stable at 87%. | In the latest year, the conviction ratio for indictable offences fell 1 percentage point to 83% and the conviction ratio for summary offences remains stable at 87%. |
| In the last 5 years the proportion of defendants remanded on bail has continued to fall, while the proportion not remanded continued to increase. | The proportion of defendants remanded in custody has remained broadly stable at magistrates’ court (4%) but has been increasing since 2016 at Crown Court (37%). |
| The custody rate for indictable offences fell to 32% from 33% in the latest year. | In 2019, the overall custody rate fell to 6% from 7% in 2018. The custody rate for indictable offences fell to 32% (up from 25% in 2009). Changes in custody rates for both of these groups are affected by the changing offence mix. |
| The average custodial sentence length (ACSL) increased to 21.4 months for indictable offences and was 18.9 months overall. | ACSL has steadily increased since 2009, when it was 16.5 months for indictable offences and 13.7 months overall. |
This is the 2019 Criminal Justice Statistics annual bulletin; it is based on data that has undergone additional quality assurance and includes cases for previous periods that have become available since earlier publications. The bulletin includes a wider range of commentary than the quarterly publications, and is accompanied by tools and experimental statistics providing additional insight for users. For technical detail about sources, quality and terminology, please refer to the accompanying guide to criminal justice statistics.
The COVID-19 pandemic has caused MoJ to have to change its data gathering, access and release practices, focusing efforts on priority analysis and statistics. Our statement explains this further and in particular, we are pausing access to the Police National Computer, to minimise non-essential travel by our analysts. In line with guidance from the Office for Statistics Regulation, the decision has been made to delay the publishing of cautions data and the offending histories chapter of this publication. We will keep users updated of any further changes via our published release calendar.
Statistician’s comment:
The number of defendants prosecuted has fallen over the last decade – and figures published today show a further slight decrease in 2019, though there were increases in some of the most serious offence groups, in particular violence. The increase in prosecutions and convictions for violence was driven by the legislation that introduced the new offence of ‘assaults on emergency workers’ from November 2018. The publication also shows that custody rates, which have risen over the last decade, fell slightly in the last year, in part because of the change in the offence mix – with a rise in the proportion of all sentences that were for offences which are less likely to result in a custodial sentence.
Although we often consider crimes to correlate with prosecutions, we would not expect prosecutions to move directly in line with the ONS published police recorded crime series, or Crime Survey for England and Wales as only those crimes that result in a charge are likely to flow into courts – in addition criminal court prosecutions cover a much broader range of offences than police recorded crime or the survey. The period of data covered by this report covers calendar year 2019, so court activity will not have been affected by the COVID-19 pandemic. We will consider how we can best cover this in future publications. In the meantime, HMCTS publish regular management information on court activity here: https://www.gov.uk/government/collections/hmcts-management-information.
Products published as part of the Criminal Justice Statistics (annual) publication
The following products are published as part of this release:
-
This statistical bulletin, with commentary on trends in criminal justice statistics. This annual edition includes an additional chapter on motoring offences.
-
An infographic showing visualisations of key messages.
-
A technical guide providing further information on how data is collected and processed, as well as information on legislation relevant to sentencing trends and background on the functioning of the criminal justice system.
-
A set of overview tables, covering each section of this bulletin: an overview, out of court disposals, prosecutions, convictions, remand decisions, sentencing, motoring and offending histories. The overview tables document also includes a diagram showing numerical flows through the criminal justice system.
-
A set of interactive data tools which were published on 28 May 2020:
-
Outcomes by Offence (which breaks down proceedings and outcomes by offence)
-
Court outcomes by Police Force Area
-
Penalty Notices for Disorder (Out of Court Disposals)
-
Prosecutions and Convictions
-
Magistrates’ Court Remands
-
Crown Court Remands
-
Sentencing
-
Motoring
-
Crown Courts
-
Magistrates’ Courts
-
Principal offence proceedings and outcomes by Home Office offence code and
-
Prosecutions and convictions on an all offence basis.
-
-
CSV files underpinning all data tools, together with two additional CSV files showing experimental statistics on information at the ‘detailed offence group’ (Home Office offence code level) – allowing users to examine the combinations of offences for which defendants were prosecuted and convicted.
-
A machine-readable offence group classification document outlining offence groupings down to the ‘detailed offence group’ (Home Office offence code level).
Introduction
This report presents key statistics on activity in the Criminal Justice System (CJS) for England and Wales. It provides commentary for January to December 2019 (referred to as the ‘latest year’) with accompanying analysis and presentation of longer term trends.
The contents of this bulletin will be of interest to government policy makers in the development of policy and their subsequent monitoring and evaluation. Others will be interested in the way different crimes are dealt with in the CJS, trends in sentencing outcomes and in anticipating impacts during 2020 of the COVID-19 pandemic. Where appropriate, comparisons are made with other sources covering activity in the CJS – in particular, numbers of crimes recorded by and the outcomes assigned to those crimes by the police (particularly charged/summonsed and out of court disposals), which is the starting point for a relatively small proportion by volume of all crimes dealt with by CJS agencies.
In this publication, criminal offences are divided into four main offence groups:
Indictable proceedings cover the more serious offences such as violent and sexual offences and robbery. Initial proceedings are heard at magistrates’ courts but may then be passed on to the Crown Court, either for sentencing, or for a full trial with a judge and jury. They are split into two categories:
-
Indictable only offences, which can only be tried on indictment in the Crown Court by a judge and jury[footnote 1]; and
-
Triable either-way offences, which are triable either summarily in a magistrates’ court or on indictment in the Crown Court;
Summary proceedings cover typically less serious offences which are almost always handled entirely in magistrates’ courts when dealt with in court, with the majority being completed at the first hearing. They are split into two categories:
- Summary non-motoring proceedings, such as TV licence evasion and less serious criminal damage; and
- Summary motoring proceedings, such as speeding and driving whilst disqualified.
The majority of information presented in this publication is reported on the principal offence and principal sentence. Where proceedings involve a defendant being prosecuted for more than one offence, the principal offence is reported. The basis for the selection of the principal offence is as follows:
-
Where a defendant is found guilty of one offence and acquitted of another, the offence selected is the one for which they are found guilty;
-
Where a defendant is found guilty of two or more offences, the offence selected is the one for which the heaviest sentence is imposed;
-
Where the same disposal is imposed for two or more offences, the offence selected is the one for which the statutory maximum penalty is the most severe.
The offence shown for each court proceeding is the one for which the court took its final decision and is not necessarily the same as the offence for which the defendant was initially prosecuted, for example where the defendant is tried for murder but found guilty of manslaughter. Unless otherwise stated, the sentence shown is the most severe sentence or order given for the principal offence (i.e. the principal sentence) with secondary sentences given for the principal offence and sentences for non-principal offences not being counted in the tables.
These statistics reflect all type of criminal offence dealt with by the courts, including those prosecuted by bodies other than the police (such as TV Licensing).
Changes and revisions in this publication
Some additions and amendments have been made to the interactive tools published alongside this publication:
-
Age range – previously the oldest age group identified in tables was over 60 but we have now split this into additional bands for 2017 and 2018, allowing data to be broken down further for the 60 to 69 age group and 70+.
-
Average fines and fine amounts have been added to the Proceedings and outcomes by Home Office offence code data tool.
-
Offence has been added to the Prosecutions and Convictions data tool.
1. Overview of the Criminal Justice System
1.52 million individuals have been dealt with by the CJS (excluding cautions[footnote 2])
The total number of individuals[footnote 3] formally dealt with by the criminal justice system (CJS)[footnote 4] in England and Wales has been declining since 2015 and fell 1% in the latest year when excluding cautions. The number of prosecutions has been falling since 2010.
Figure 1: Individuals dealt with formally by the CJS, offences resulting in a police charge/summons, 12 months ending December 2015 to December 2019 (Source: Tables Q1.1 and Q1.2)
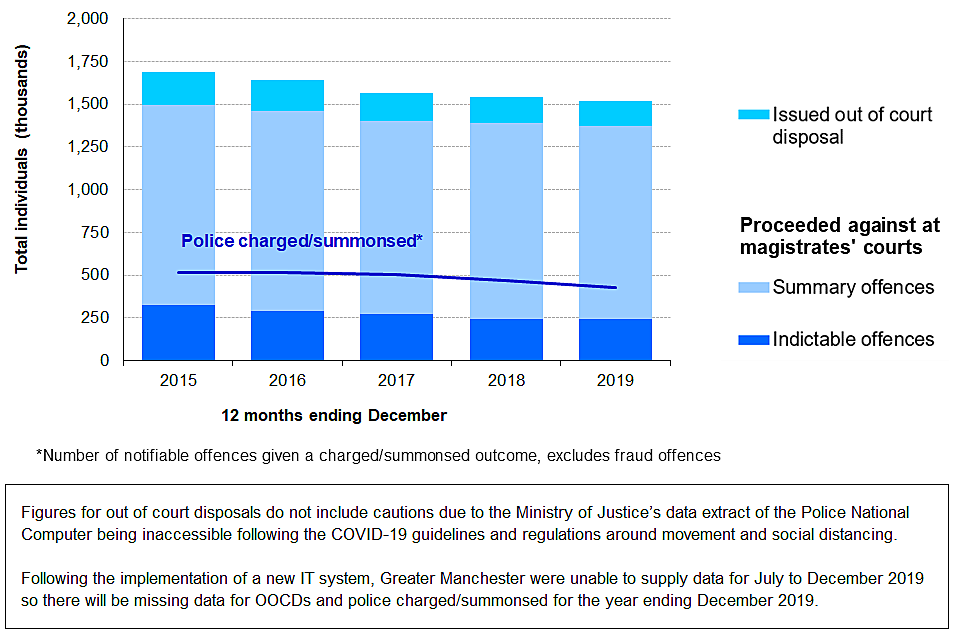
Figure 1: Individuals dealt with formally by the CJS, offences resulting in a police charge/summons, 12 months ending December 2015 to December 2019 (Source: Tables Q1.1 and Q1.2)
The number of individuals prosecuted at all courts fell by 1% compared to the previous year, and there was a 4% reduction in the use of out of court disposals in the latest year (when excluding cautions).
Comparisons with crime statistics
It is useful to consider associated crime data and the flow through to courts to provide additional context. However, it is essential to understand that a change in police recorded crime or the Crime Survey for England and Wales (CSEW) would not necessarily lead to a corresponding change in criminal court prosecutions. Police recorded crime measures everything the police record under a set of ‘notifiable offences[footnote 5], and only the subset of those which receive a charge/summons are likely to end up proceeding to court. In addition, court proceedings, as described in this publication, cover prosecutions for a far broader range of offences, including less serious summary offences that are excluded from the notifiable offence list. To highlight this, there were 1.38m prosecutions at magistrates’ courts in 2019, but 417,000 notifiable offences that received a charge or summons[footnote 6]. The flow chart below illustrates this.

Flowchart
The Crime Survey for England and Wales (CSEW)[footnote 7] provides a broad estimate of victimisation. It showed there were 5.8 million incidents of crime (excluding fraud and computer misuse) in 2019, down by 9% when compared to the previous year. When including fraud and computer misuse, this amounted to 10.4 million incidents of crime, down by 5% compared to the previous year. The CSEW covers crimes against households and individuals and includes crimes which do not come to the attention of the police. The CSEW excludes a range of other crimes that would be recorded by either the police (such as murder, possession offences and ‘victimless’ crimes) or other authorities (such as television licence evasion or rail fare evasion). This is because the survey asks householders for their experience as victims (rather than offenders).
Another source of crime information is police recorded crime, which increased by 4% compared to the previous year, to 5.0 million[footnote 8] [footnote 9], (5.6 million when including fraud offences). This increase is believed to be a driven by improved recording among police forces and victims’ greater willingness to report crimes, with genuine increases in some low volume crime types. Police recorded crime covers all indictable and triable either way offences. Additionally, a few closely associated summary offences are included.
Once a crime is recorded by the police, an investigation takes place and the force assigns one of a number of outcomes to the crime[footnote 10]. These include a suspect being charged or summonsed, given an out of court disposal or an explanation as to why no further action is taken, for example due to evidential difficulties, the offender having died, or no suspect being identified.
While it is reasonable to expect figures on prosecutions to broadly follow trends in police charges for similar offences, there are important distinctions to consider such as time lag, differences in counting and in coverage. More information can be found in the Guide to Criminal Justice Statistics published alongside this bulletin.
The number of recorded crimes where somebody was charged or summonsed by the police in 2019 was 417,300, a 7% decrease on 2018[footnote 11]. Meanwhile, the number of defendants prosecuted for indictable offences (excluding fraud, to be consistent with charges) increased over the same period by 1%. Variations between these two figures are expected given the factors outlined above.
New offences included in court data
This section highlights some offences that first became available in court data for 2019. It is a short summary showing new offences likely to be of particular interest only; www.legislation.gov.uk has details of all legislation that has come into force throughout the entire reporting period.
There can be a delay between the commencement of new offences and seeing them in court data, primarily due to the time it takes for an offence to be investigated, the police to assign it an outcome, and the prosecution, before resulting in a completed court case[footnote 12]. This delay can lead to the recording of a higher proportion of cautions (relative to prosecutions) in the year of commencement, compared with future years; the delay is shorter for cautions as they can be issued more quickly and therefore reach our data sooner. Cautions data is currently unavailable due to the MoJ’s PNC data extract being inaccessible following the COVID-19 guidelines and regulations around social distancing and travel, therefore it is only possible to show the number of defendants prosecuted here.
Voyeurism offences under section 67A of the Sexual Offences Act 2003 (Voyeurism (Offences) Act 2019)
New triable either way offences were introduced under the Sexual Offences Act 2003 relating to voyeuristic actions of placing equipment such as a camera or a mobile phone beneath a person’s clothes to take a photograph without their permission (colloquially known as ‘upskirting’). The maximum penalty for these offences is 2 years imprisonment. In 2019, there were 11 prosecutions and 10 convictions; of the 8 offenders sentenced, 7 received a community sentence.
Other offences introduced in 2019 include:
-
Triable either way offences under the Stalking Protection Act 2019 and breach of a stalking order/interim stalking order
-
Summary offences relating to fisherman working conditions under the Merchant Shipping (Work in Fishing Convention) Regulations 2018
Assaults on emergency worker offences under the Criminal Justice Act 1988 (Assaults on Emergency Workers (Offences) Act 2018)
In November 2018, triable either-way offences were introduced under the Criminal Justice Act 1988 relating to assault or assault by beating of an emergency worker, for which the maximum penalty is 12 months imprisonment. This publication presents the first full year of data for these offences; in 2019 there were 11,300 prosecutions, 9,400 convictions and 9,100 offenders sentenced. Further details for this offence are provided in the Court Proceedings and Convictions chapter and the Sentencing chapter.
2. Out of Court Disposals
The release of this quarter’s cautions data is delayed, as the Ministry of Justice’s data extract of the Police National Computer (PNC) has been inaccessible during the period of guidance on social distancing and restrictions on travel during the COVID-19 pandemic. The earliest we expect to be able to reinstate the series on cautions data is as part of the publication in August 2020, depending on when access to the PNC data is resumed. A separate series on cautions issued by the police for notifiable offences is published by the Home Office and is available in their Crime Outcomes data tables.
Out of court disposals[footnote 13] continued to decline.
Out of court disposals (OOCDs) are sanctions used by the police to address offences without the need to be dealt with at court. Excluding cautions, 144,000 out of court disposals were issued in 2019, compared with 151,000 in 2018, a fall of 4%.
The decrease in the number of OOCDs has followed policy changes relating to police practice and OOCD availability[footnote 14].
Figure 2.1: Out of court disposals issued (excluding cautions), by disposal type, England and Wales, 2015 to 2019
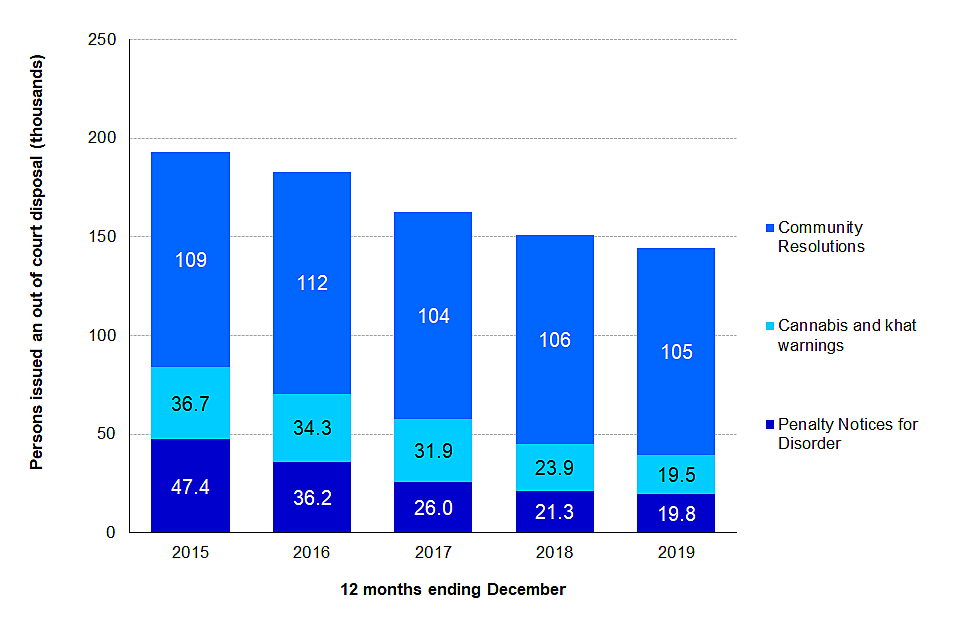
Figure 2.1: Out of court disposals issued (excluding cautions), by disposal type, England and Wales, 2015 to 2019
The number of Penalty Notices for Disorder (PNDs) issued has decreased by 7% in the last year.
PND use has been decreasing continuously over the last decade, from 170,000 in 2009, to 19,800 in 2019.
Nearly all (98%) PNDs were issued for higher tier offences, with four specific offences predominating. Drunk and disorderly behaviour accounted for 42% of all PNDs issued in 2019, followed by possession of cannabis (31%), causing harassment, alarm or distress (11%) and retail theft under £100 (9%). These proportions have changed since 2009, when the largest number of PNDs were issued for retail theft (28%).
The number of PNDs issued for possession of cannabis rose from 5,100 in 2018 to 6,000 in 2019, an increase of 18%.
Figure 2.2: Proportion of Penalty Notices for Disorder issued by offence, England and Wales, 2009 to 2019
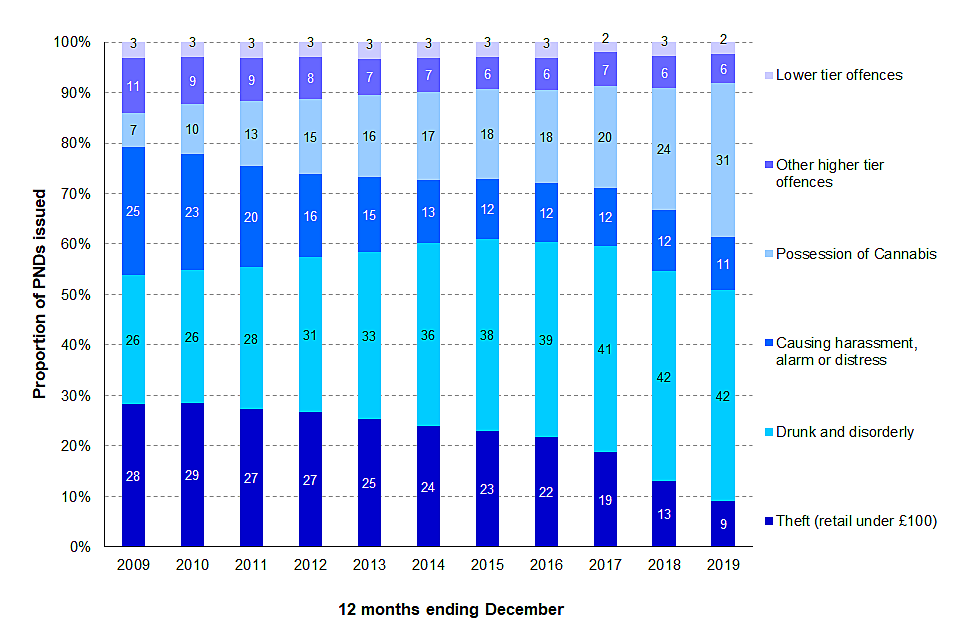
Figure 2.2: Proportion of Penalty Notices for Disorder issued by offence, England and Wales, 2009 to 2019
The proportion of PNDs issued in 2019 that were paid in full remained stable at 50%. The number of people issued with PNDs who were fined for late payment rose from 33% to 35%.
The use of cannabis and khat warnings has declined by 47% since 2015
In 2019, 19,500 cannabis and khat warnings were issued, a decrease of 18% from 2018.
The number of community resolutions[footnote 15] issued remained broadly stable.
In 2019, 105,000 community resolutions were administered by the police, compared to 106,000 in 2018. In the latest year, an increase in community resolutions for drug offences was offset by decreases across other offence groups.
3. Court Proceedings and Convictions
1.37 million defendants were prosecuted in 2019.
Down 1% since 2018. The offence groups with the largest increase in prosecutions were violence against the person (up 26%, due to the new ‘assaults on emergency workers’ offence introduced in November 2018) and drug offences (up 13%).
The overall conviction ratio[footnote 16] remained broadly stable at 87%.
In the latest year, the conviction ratio for indictable offences fell 1 percentage point to 83% and the conviction ratio for summary offences remains stable at 87%.
Defendants start proceedings at magistrates’ courts, regardless of the seriousness of the offence charged against them[footnote 17]. Less serious offences (summary offences) will be entirely dealt with by magistrates’ courts. The most serious indictable offences (indictable-only offences) must be tried at the Crown Court, the remaining indictable offences (triable-either-way) can either be tried at a magistrates’ court or Crown Court.
The number of defendants prosecuted saw a further decrease in 2019.
In 2019, 1.37 million defendants were prosecuted at magistrates’ courts, a reduction of 1% since 2018, and was the lowest since records began in 1970. The number of defendants prosecuted has fallen generally since 2009 (by 19% overall), with some short-term fluctuations.
Figure 3.1: Defendants prosecuted at magistrates’ courts, 2009 to 2019, and proportions of all proceedings for 2009, 2014, and 2019 (Source: Table Q3.2)
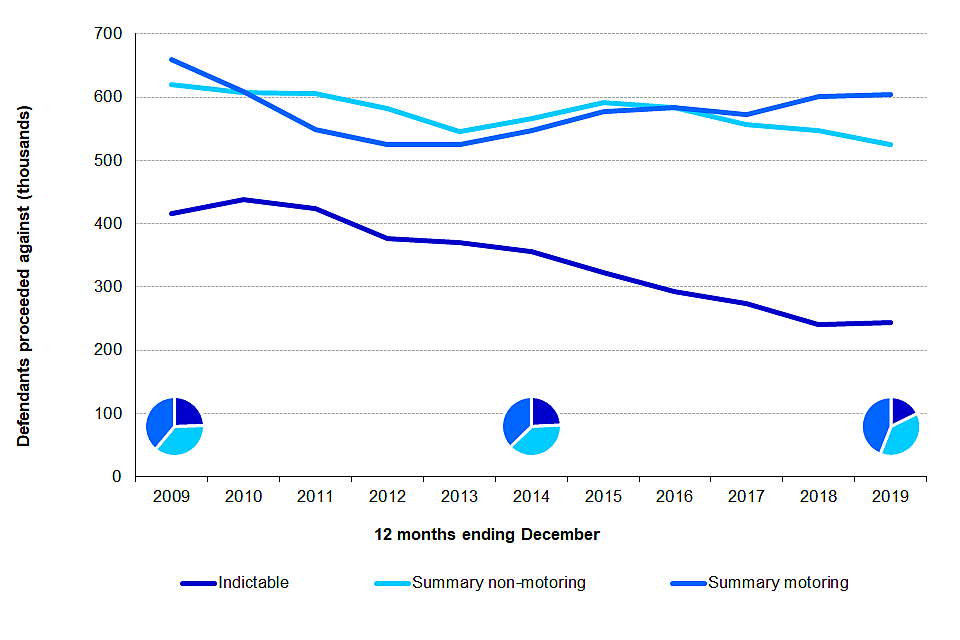
Figure 3.1: Defendants prosecuted at magistrates’ courts, 2009 to 2019, and proportions of all proceedings for 2009, 2014, and 2019 (Source: Table Q3.2)
In 2019, summary offences fell by 2% compared with a year ago, but still made up the majority (82%) of all prosecutions. Within this, prosecutions for summary motoring offences increased by 1% since 2018. Summary non-motoring offences continued the decline seen since 2015 and saw a 4% decrease in the number of prosecutions, from 548,000 in 2018 to 526,000 in 2019, the lowest in the decade. Prosecutions for indictable offences increased for the first time in 10 years, though this is due to the new offence of assaults on emergency workers being included in violence against the person offences from November 2018.
Prosecutions for violence against the person offences increased in the latest year driven by the introduction of legislation on assaults of emergency workers.
Prosecutions for violence against the person offences rose by 26% between 2018 and 2019 (to 46,400 defendants). This increase in prosecutions for violence against the person offences was driven by legislation on assaults on emergency workers which introduced a new offence in this group from November 2018. There were 11,300 prosecutions for these offences, and removing these would result in an annual decline of 4% compared to the previous year[footnote 18] . There was also an increase in prosecutions for drug offences, by 13% since 2018 (to 44,000 defendants). This contradicts the decrease in prosecutions for drug offences seen since 2013.
Figure 3.2: Prosecutions, convictions and conviction ratio for violence against the person offences, 2009 to 2019 (Source: Table Q3.2a, Q3.2b and Q3.3)
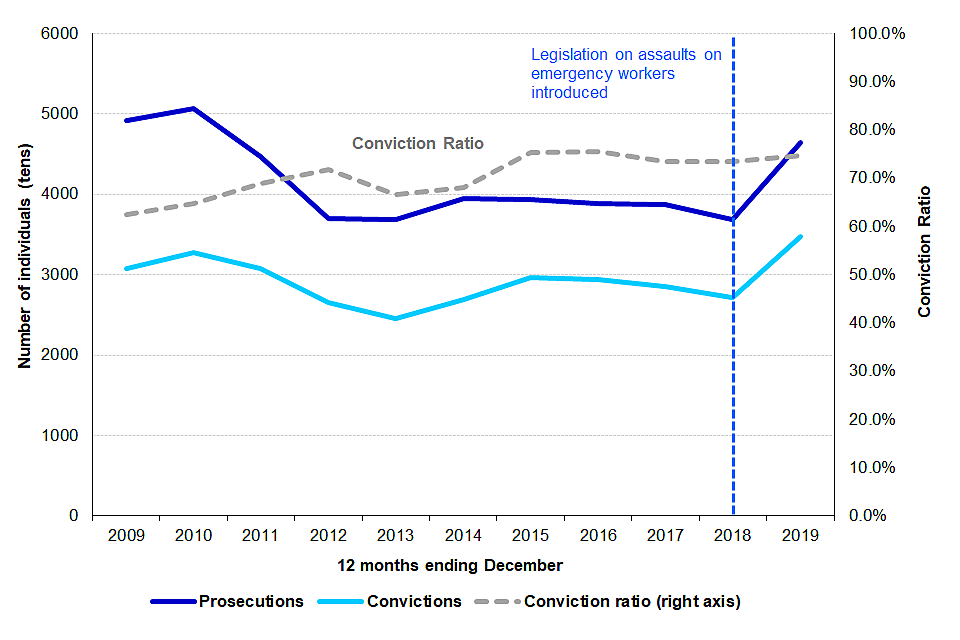
Figure 3.2: Prosecutions, convictions and conviction ratio for violence against the person offences, 2009 to 2019 (Source: Table Q3.2a, Q3.2b and Q3.3)
Theft offences continued to account for the greatest proportion (27%) of prosecutions amongst indictable offences in 2019.
Between 2018 and 2019, there were large falls in the number of defendants prosecuted for:
-
Criminal damage and arson (14% decrease to 2,200 defendants)
-
Theft offences (13% decrease to 65,900 defendants)
-
Fraud offences (11% decrease to 8,100 defendants)
-
Miscellaneous crimes against society (5% decrease to 29,900 defendants)
All these offence groups continued to show the downward trend observed since 2014.
The majority of triable-either-way offences are dealt with at magistrates’ court, the number sent to Crown court increased by 6%, the first increase since 2014.
Most prosecutions (71%) for triable-either-way offences were tried and completed within magistrates’ courts, remaining broadly stable since 2016.
The proportion of defendants prosecuted for triable-either-way offences sent for trial at the Crown Court has remained relatively stable since 2016, at 20% in 2019. Meanwhile, the majority of defendants prosecuted for indictable-only offences are sent for trial at Crown Court (86%), a decrease of 1 percentage point since 2018.
Figure 3.3: Defendants prosecuted for a triable-either-way offence by court assigned for trial, 2009 to 2019 (Source: Table Q3.1)
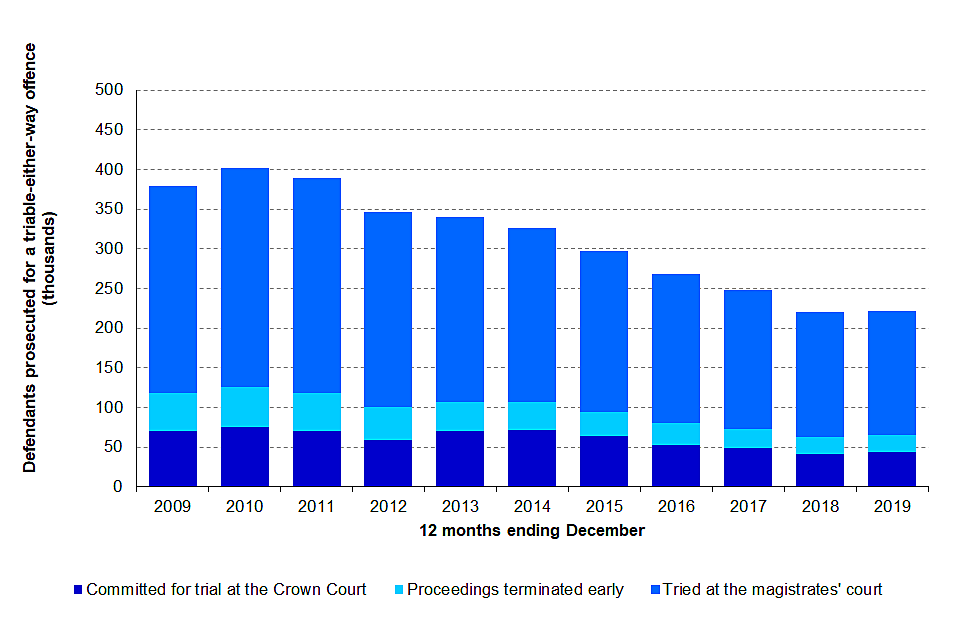
Figure 3.3: Defendants prosecuted for a triable-either-way offence by court assigned for trial, 2009 to 2019 (Source: Table Q3.1)
The conviction ratio[footnote 19] remained stable in the latest year.
The number of defendants convicted (defendants who are found guilty), decreased by 1% between 2018 and 2019. This fall is in line with the decrease in the number of prosecutions made and the breakdown of the individual offence types within convictions.
The overall conviction ratio increased year-on-year between 2013 and 2017. However, it has remained relatively stable since 2017, decreasing by 0.2 percentage point since 2018 to 86.7% in 2019.
Conviction ratios vary markedly for offence groups and this variation is driven by various factors, including the likelihood of a guilty plea for that offence, availability and accessibility lengths, witness and victim support, trial lengths, etc.). Because of the way conviction ratios are measured in our statistics, they can also be affected by trends in prosecutions, and the length of time offences take in court. This is because the conviction ratio is measured as the number of convictions at all courts in a time period divided by the number of prosecutions at magistrates’ courts in the same period. For offences where the case takes a long time, that means the convictions in the latest year can relate to prosecutions from earlier time periods.
This is especially the case for sexual offences, where criminal proceedings take the longest to reach a conclusion on average – and so the gap between prosecution and conviction is largest. In recent years, the conviction ratio for sexual offences has risen steadily, and that is at least in part due to the reduction in prosecutions – but in the latest year, prosecutions for sexual offences have risen for the first time in five years and any corresponding increase in convictions is only likely to be seen in future periods, meaning a reduction in the conviction ratio for the offence.
Figure 3.4: Prosecutions, convictions and conviction ratio for sexual offences, 2009 to 2019 (Source: Table Q3.2a, Q3.2b and Q3.3)
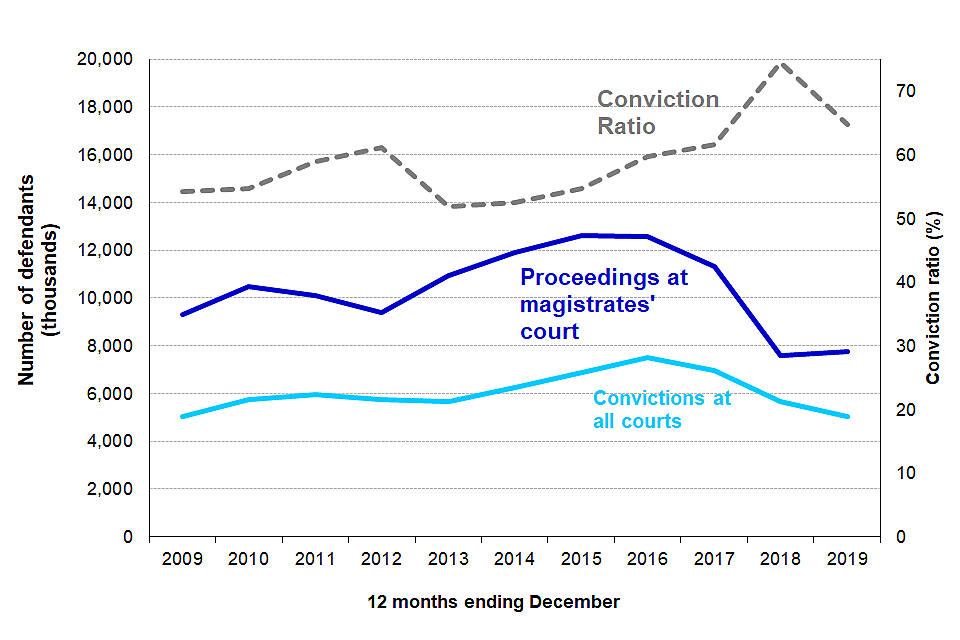
Figure 3.4: Prosecutions, convictions and conviction ratio for sexual offences, 2009 to 2019 (Source: Table Q3.2a, Q3.2b and Q3.3)
The Crown Prosecution Service publish an alternative conviction rate[footnote 20], where convictions and prosecutions relating to the same case are matched and recorded in the same year. This highlights an overall conviction rate for sexual offences of around 67%.
For other offences groups, and for all offences as a whole, the lag effect is far smaller on conviction ratios. In the latest year, conviction ratios ranged from around 65% for robbery (and sexual offences, though noting the above) to 94% for public order offences.
Figure 3.5: Conviction ratio for all defendant proceedings and convictions at all courts, 2009 to 2019 (Source: Table Q3.3)
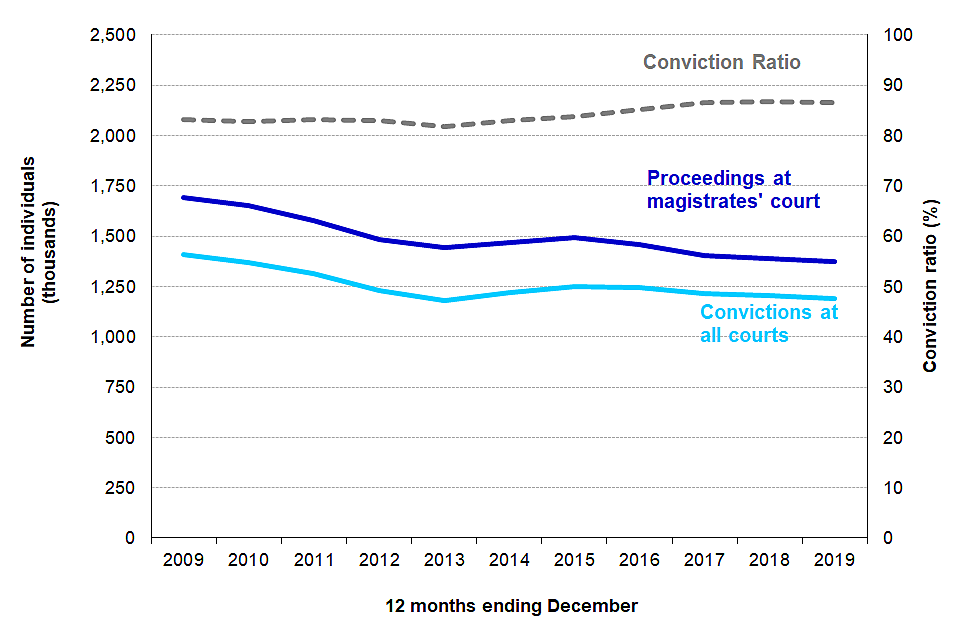
Figure 3.5: Conviction ratio for all defendant proceedings and convictions at all courts, 2009 to 2019 (Source: Table Q3.3)
Latest data for 2019 show that the guilty plea rates for drug and theft offences are the highest, at 79% (see Crown Court Guilty plea tool). It is also likely that evidence will be strong, since for many drug offences, the defendant is found in possession of the items for the offence they have been accused of and for public order, the offences are often breaches of particular orders (anti-social behaviour or non-molestation).
4. Remands
In the last 5 years the proportion of defendants remanded on bail has continued to fall, while the proportion not remanded continued to increase.
The proportion of defendants remanded in custody has remained broadly stable at magistrates’ court (4%) but has been increasing since 2016 at Crown Court (37%).
In 2019, 1.44 million defendants were directed to appear at magistrates’ courts (including those who failed to appear), decreasing 1% compared to 2018 (in line with prosecutions).
In the latest year, the proportion of defendants arrested and bailed by police prior to appearing at magistrates’ court decreased from 15% to 14%.
The proportion of defendants summonsed prior to appearing at the magistrates’ court increased from 76% to 78% compared with 2018, and 8% were remanded in custody by the Police, decreasing from 9%. The increasing proportion summonsed and decreasing proportion bailed and remanded in custody has been a consistent trend in the last 5 years.
In 2019, the remand status of defendants proceeded against at magistrates’ courts was broadly stable.
The proportion of defendants granted bail decreased slightly from 14% to 13% in the latest year. The proportion of defendants who were remanded in custody or had their case concluded at magistrates’ courts without being remanded remained stable at 4% and 83% respectively.
Figure 4.1: Defendants’ remand status with Police (prior to court), at Magistrates’ Court and at Crown Court, 2015 to 2019 (Source: Table Q4.1, Q4.2 and Q4.3)
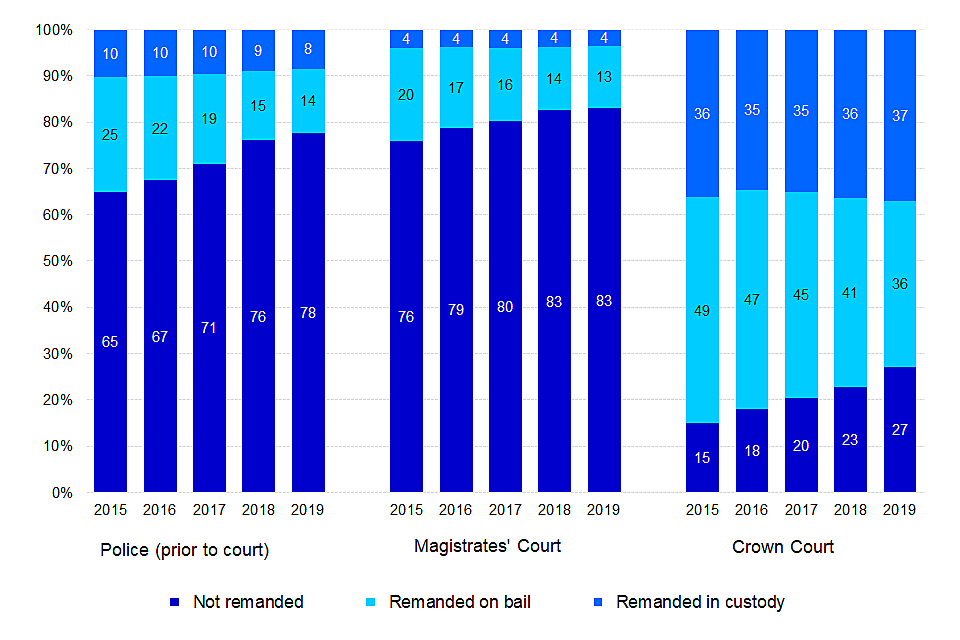
Figure 4.1: Defendants’ remand status with Police (prior to court), at Magistrates’ Court and at Crown Court, 2015 to 2019 (Source: Table Q4.1, Q4.2 and Q4.3)
Since 2015, at the Crown Court the proportion (and volume) of defendants not remanded has increased while bail has decreased.
Over the last 5 years, the proportion (and volume) of defendants not remanded has been increasing from 15% to 27% in 2019 (16,000 to 23,200), while the proportion (and volume) of those remanded on bail fell from 49% to 36% (52,700 to 30,500). The proportion of those remanded in custody was 37% in 2019 and has been increasing since 2016. However, the number of custodial remands increased 2% in the latest year, following a four year decrease in custodial remands.
In 2019, the proportion of defendants remanded in custody at Crown Court (37%) was higher than at magistrates’ courts (4%) as Crown Courts deal with the more serious offences.
Trends in remand outcomes can in part be explained by the offence mix. The proportion of summary offences dealt with at the magistrates’ court increased from 76% to 80% in the last 5 years, this has contributed to the increase in the proportion of defendants not remanded from 76% to 83% over the same time period.
In 2019 at the magistrates’ court, the majority (64%) of defendants that were remanded in custody were sent for trial or sentencing and 13% were sentenced to immediate custodial sentences. Of those were remanded in custody at the Crown Court the majority (75%) were later sentenced to immediate custodial sentences. Of all defendants who were not remanded at Crown Court, 51% received an immediate custody sentence. In 2019, A similar proportion of defendants remanded in custody at magistrates’ (9%) and Crown Courts (10%), went on to be found not guilty (acquitted, dismissed etc.)
Figure 4.2: Outcome of proceedings for defendants remanded in custody by magistrates’ courts and the Crown Court, 2019 (Source: Table Q4.4)
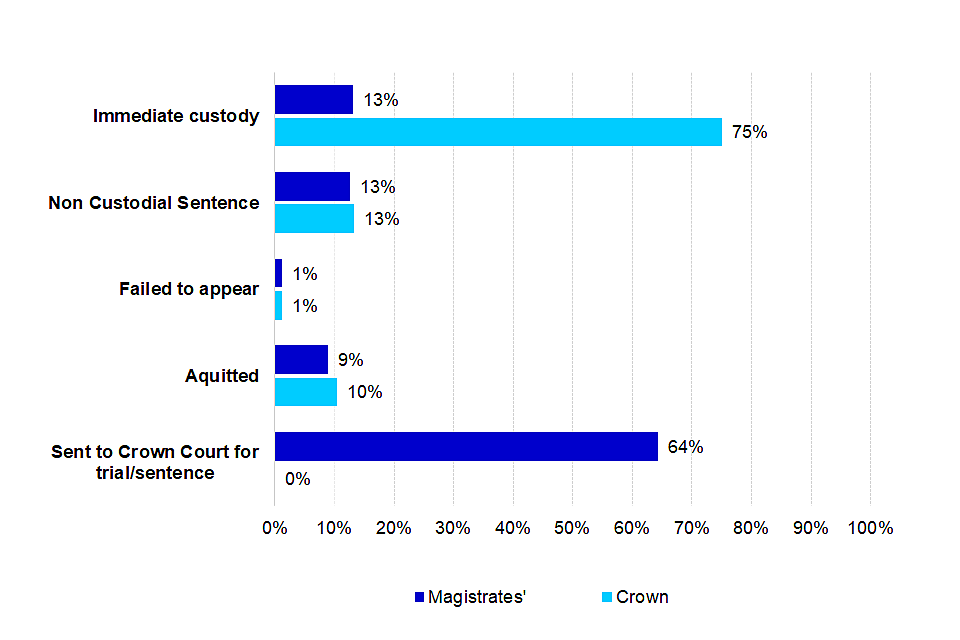
Figure 4.2: Outcome of proceedings for defendants remanded in custody by magistrates’ courts and the Crown Court, 2019 (Source: Table Q4.4)
5. Sentencing
The custody rate[footnote 21] for indictable offences fell to 32% from 33% in the latest year.
In 2019, the overall custody rate fell to 6% from 7% in 2018. The custody rate for indictable offences fell to 32% (up from 25% in 2009). Changes in custody rates for both of these groups are affected by the changing offence mix.
The average custodial sentence length (ACSL) increased to 21.4 months for indictable offences and was 18.9 months overall.
ACSL has steadily increased since 2009, when it was 16.5 months for indictable offences and 13.7 months overall.
Compared to 2018, the overall number of offenders sentenced at all courts has fallen by 1% to 1.18 million. The number of offenders sentenced for summary offences decreased by 2% while the number sentenced for indictable offences remained unchanged over the same period. This is in line with the changes in the number of convictions compared to 2018.
Fines remained the most common sentence, accounting for 78% of all sentences in 2019, an increase of 11 percentage points since 2009.
Summary offences accounted for 96% of fines in 2019. The number of fines increased for violence against the person (72%) and drug offences (12%) but have decreased for all other indictable offence groups.
In 2019, over half (53%) of offenders sentenced to immediate custody were sentenced to 6 months or less.
This was the lowest proportion over the last 10 years (which has otherwise ranged from 56% to 58%). The proportion of those who were sentenced to up to and including 1 month fell by 2 percentage points from 2018, to 13% in 2019.
In total there were 76,000 immediate custodial sentences in 2019, down 4% on 2018 and down 24% on 2009. The number of offenders sentenced to immediate custody for summary offences fell by 21% compared to 2018 and has fallen by 45% over the last decade.
Figure 5.1: Offenders sentenced and sentencing outcomes (percentage of all offenders sentenced) at all courts, 2009 to 2019 (Source: Table Q5.1)
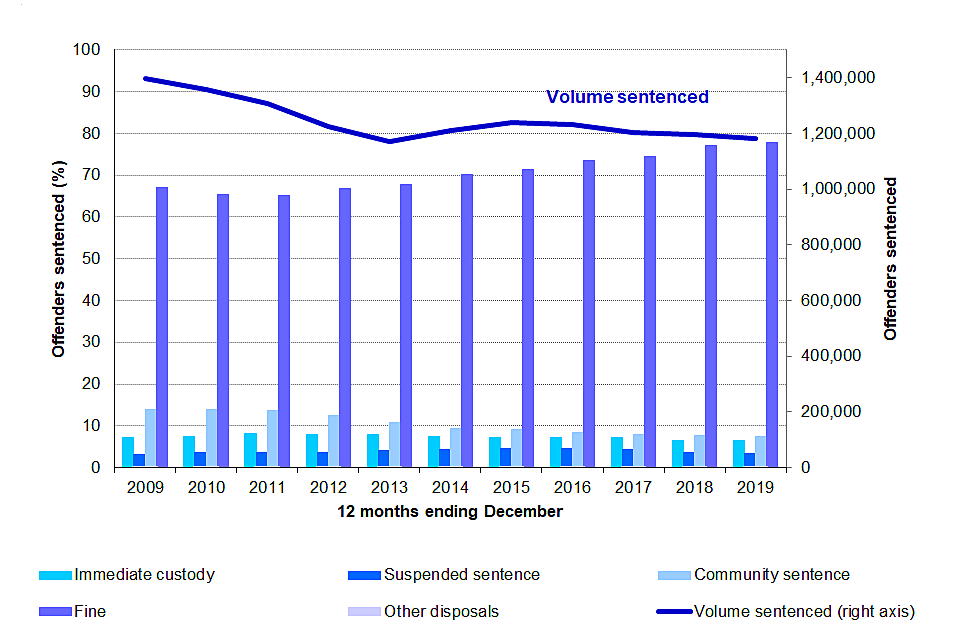
Figure 5.1: Offenders sentenced and sentencing outcomes (percentage of all offenders sentenced) at all courts, 2009 to 2019 (Source: Table Q5.1)
Identifying changes in indictable offences separately from summary offences makes it easier to see trends for a broader type of sentences than fines.
The custody rate for indictable offences fell slightly to 32% in 2019 (less than a 1 percentage point fall). This reduction is influenced by the growth in prosecutions of the new ‘assaults on emergency workers’ offence, which has a custody rate of 17%, relatively lower than the offence group as a whole and accounting for 5% of all indictable sentences) and excluding that would have led to a slight increase in the custody rate for indictable offences.
In 2019 a greater proportion of offenders (32%) received immediate custody for indictable offences than any other sentence outcome, up 7 percentage points over the last decade.
For robbery offences 65% received immediate custody in 2019, a larger proportion than any other offence group. It has remained the offence group with the largest proportion receiving immediate custody throughout the last decade.
Criminal damage and arson and possession of weapons offences have seen the largest increase in custody rate compared to 2009, increasing by 17 and 14 percentage points to 30% and 37%, respectively, in 2019.
The use of suspended sentences for indictable offences has been increasing over the last decade.
The proportion of offenders receiving a suspended sentence has been gradually increasing over the last decade from 10% to 15% in 2019. However, this is down from a peak of 17% in 2017.
Suspended sentences were considerably less common before the introduction of the suspended sentence order with community requirements by the Criminal Justice Act (CJA) in 2003. Under the LASPO Act 2012, these provisions were amended so that, since December 2012, custodial sentences of two years or less can be suspended and the imposition of community requirements is discretionary.
Community sentences for indictable offences increased slightly since 2018 (both in volume and as a proportion of all disposals) after a sustained fall over the previous decade.
In 2019, community sentences made up 22% of sentences for indictable offences. This is up 1 percentage point compared to 2018 but down 11 percentage points over the last decade.
Discharges accounted for 9% of indictable offence sentencing outcomes in 2019, having fallen by 4 percentage points since 2009.
Figure 5.2: Sentencing outcome trends for indictable offences at all courts, 12 months ending December 2009 to December 2019 (Source: Table Q5.3)

Figure 5.2: Sentencing outcome trends for indictable offences at all courts, 12 months ending December 2009 to December 2019 (Source: Table Q5.3)
The overall custody rate has fallen, alongside a decrease in offenders being sentenced to immediate custody.
The custody rate (i.e. the proportion of sentences which result in immediate custody) has fallen from 2018 by 0.2 percentage points, to 6.4% in 2019. It peaked in 2011 at 8.1%, but has been falling since then – although it is important to consider this change against the additional and contrasting context of:
-
an increase over that period for indictable offences (from 25.6% to 32.4%),
-
a decrease for summary offences (from 1.9% to 1.1%)
-
a great proportion of sentences being for indictable offences in 2019 than in 2011.
Compared to 2018, in addition to the reduction in the custody rate for violence against the person (discussed above), there was also a decrease for sexual offences, down by 4 percentage points. Over half of this reduction is due to an increase in sentences for sexual grooming, for which a larger proportion of offenders received community orders or suspended sentences than in 2018.
Average custodial sentence length is continuing to increase.
In 2019 the average custodial sentence length (ACSL) was 18.9 months, up from 17.3 months in 2018 and 13.7 months in 2009. This is despite a fall in the number of people sentenced to immediate custody, meaning that less people are being sentenced to custody but those that are generally receive longer sentences. This may be due to numerous changes in legislation over the decade, please see the technical guide for more details.
The largest increase in ACSL has been for fraud offences, increasing by 90% over the last decade to 23.1 months in 2019.
There was a decrease in ACSL of 3.4 months for sexual offences in the latest year to 58.1 months in 2019. This is the lowest ACSL for sexual offences since 2013 but is 8.8 months longer than a decade ago.
The ACSL for possession of weapon offences fell in the latest year by 0.6 to 12.1 months in 2019 (and ACSL for possession of a knife/bladed instrument was unchanged). This is the third year in a row that the ACSL for possession of weapons as a whole has fallen and it is now lower than in 2009 (12.7). This should be considered alongside the increase in number of defendants sentenced to immediate custody for the offence (to 5,368 in 2019, from just under 4,000 in 2016 and 3,462 in 2009) and the increase in custody rate (to 36.9% in 2019, from 33% in 2016 and 23% in 2009).
6. Motoring
Prosecutions for motoring offences increased by 1% over the last year while convictions and sentencing both remained stable.
The number of defendants prosecuted increased by 1% from 704,000 in 2018 to 711,000 in 2019, with convictions and sentences both remaining stable at 631,000. Just over half (51%) of defendants prosecuted for motoring offences were prosecuted for speed limit and vehicle insurance offences. The conviction ratio for all motoring offences was at 89% in 2019, a slight decrease from the 90% ratio in 2017 and 2018, which was the highest in a decade.
Figure 6.1: Defendants prosecuted for motoring offences, 2019[footnote 22] [footnote 23] (Source: Table A6.1)

Figure 6.1: Defendants prosecuted for motoring offences, 2019 (Source – Table A6.1)
There were a few notable annual decreases in prosecutions for specific offences including; ‘Neglecting road regulations (other than speeding)’ (a 21% decrease; from 21,600 in 2018 to 16,900 in 2019), ‘Using or causing others to use a handheld mobile phone whilst driving’ (a 16% decrease; from 13,500 in 2018 to 11,400 in 2019), and ‘Theft of a motor vehicle / aggravated vehicle taking’ (an 11% decrease; from 4,600 in 2018 to 4,100 in 2019).
An increase in the number of defendants prosecuted was seen in ‘Driving a motor vehicle with the proportion of specified controlled drug above specified limit’ (a 19% increase; from 10,200 in 2018 to 12,100 in 2019), ‘Other offences related to drink- or drug-driving’ (a 12% increase; from 10,200 in 2018 to 11,400 in 2019), and ‘Vehicle test offences’ (an 11% increase; from 4,000 in 2018 to 4,400 in 2019).
The number of the most serious offences, those causing injury or death, reduced from 820 in 2018 to 799 in 2019 for prosecution and from 744 in 2018 to 711 in 2019 for convictions.
Sentencing trends for motoring offences have remained broadly stable, with an overall custody rate of 1%.
The vast majority of offenders sentenced for ‘Causing death by dangerous driving’ and ‘Causing death by careless driving under influence of drink or drugs’ received immediate custody (a custody rate of 94% and 100% respectively in 2019). Where an offender was sentenced to immediate custody, the average custodial sentence length (ACSL) was 9 months, increasing from 8.1 in 2018 following an upwards trend across the decade. Offences which saw a notable increase in ACSL included; ‘Causing death by dangerous driving’ (76.2 months from 63.6 in 2018), and ‘Causing death by careless or inconsiderate driving’ (13.2 months from 12 months in 2019).
The use of fines as the main sentence for motoring offences remained stable at 94%, with little change since 2014. The average fine amount appears to have stabilised (£331 in 2019 from £332 in 2018) following year on year increases since 2011.
The total number of offenders directly disqualified from driving increased 12% in the latest year; 70,800 from 63,300 in 2018. This difference was mainly driven by an increase in disqualifications for ‘Driving a motor vehicle with the proportion of specified controlled drug above specified limit’ which have doubled from 5,600 in 2018 to 11,200 this year.
Further information
National Statistics status
National Statistics status means that official statistics meet the highest standards of trustworthiness, quality and public value.
This bulletin recently underwent a compliance check with the Office for Statistics Regulation and retained its National Statistics status in January 2019. All official statistics should comply with all aspects of the Code of Practice for Official Statistics. They are awarded National Statistics status following an assessment by the Authority’s regulatory arm. The Authority considers whether the statistics meet the highest standards of Code compliance, including the value they add to public decisions and debate.
It is the Ministry of Justice’s responsibility to maintain compliance with the standards expected for National Statistics. If we become concerned about whether these statistics are still meeting the appropriate standards, we will discuss any concerns with the Authority promptly. National Statistics status can be removed at any point when the highest standards are not maintained, and reinstated when standards are restored.
Contact
Press enquiries should be directed to the Ministry of Justice press office:
Tel: 020 3334 3536
Email: newsdesk@justice.gov.uk
Other enquiries about these statistics should be directed to the Justice Statistics Analytical Services division of the Ministry of Justice:
Damon Wingfield, Responsible Statistician and Head of Criminal Justice System Statistics
Ministry of Justice, 3rd Floor, 10 South Colonnade, London, E14 4PU
Email: CJS_Statistics@justice.gov.uk
Next update: 20 August 2020
URL: https://www.gov.uk/government/statistics/criminal-justice-system-statistics-quarterly-december-2019
© Crown copyright
Produced by the Ministry of Justice
Alternative formats are available on request from statistics.enquiries@justice.gov.uk
-
All offences committed by a child or young person (someone aged 10-17 years old) can be dealt with by a youth court, subject to the following exceptions which mean that the offence must be dealt with by the Crown Court: homicide; grave crimes where the youth court has determined that, if convicted, a sentence beyond its powers should be available; firearms possession by 16-17 year olds; offences that would attract at least four years custody under the dangerousness provisions; and where it is necessary in the interests of justice to try a youth and adult together. ↩
-
Cautions have been excluded due to the Ministry of Justice’s data extract of the Police National Computer being inaccessible in line with the COVID-19 guidelines and regulations around social distancing and travel. ↩
-
A single individual (includes people and companies) can be counted more than once in a year if they are dealt with by the CJS on more than one occasion. Includes individuals prosecuted, given a caution, Penalty Notice for Disorder (PND) or cannabis/khat warning and community resolutions. ↩
-
The number of individuals formally dealt with by the CJS is the sum of all defendants prosecuted at magistrates’ court plus all individuals issued an out of court disposal (including community resolutions). ↩
-
The term ‘notifiable’ covers offences that are notified to the Home Office, and they are collectively known as ‘recorded crime’. Notifiable offences include all indictable and triable-either-way offences (excluding section 6 of the Bail Act 1976), together with certain closely associated summary offences. ↩
-
This figure is based on notifiable offences and excludes fraud as Action Fraud have taken over the recording of fraud offences on behalf of individual police forces. Latest data for year ending December 2018 can be found here: https://assets.publishing.service.gov.uk/government/uploads/system/uploads/attachment_data/file/749310/prc-pfa-mar2013-onwards-tables.ods. ↩
-
Crime outcomes recorded by the police are published by the Home Office: https://www.gov.uk/government/statistics/crime-outcomes-in-england-and-wales-year-to-december-2018-data-tables. ↩
-
This figure is based on notifiable offences and excludes fraud as Action Fraud have taken over the recording of fraud offences on behalf of individual police forces. In addition, data for Greater Manchester Police have not been included in this figure due to issues with data supply following the implementation of new force IT systems. Latest data can be found in the Police recorded crime and outcomes open data tables. ↩
-
Excludes Greater Manchester Police. Following the implementation of a new IT system, Greater Manchester Police were unable to supply data for July to December 2019. ↩
-
Crime outcomes recorded by the police are published in Crime outcomes and England and Wales statistics. ↩
-
Comparison excludes Greater Manchester Police. ↩
-
It is useful to consider an example of a ‘new’ offence to illustrate the delay in court disposals – for example, the offence of stalking came into force in 2012 and in 2013, 53 individuals were convicted for the offence. This rose to 147 in 2014 as more cases flowed through the system and subsequently to 194 in 2015. ↩
-
Out of court disposals (OOCDs) are sanctions that are used by the police, with reference to the Crown Prosecution Service (CPS), to address offences without needing to be dealt with at court. The out of court disposals available to the police and the Crown Prosecution Service in 2018 included penalty notices for disorder (PNDs), simple and conditional cautions, cannabis and khat warnings and community resolutions. ↩
-
See the Technical Guide for more information. ↩
-
Community resolutions are a non-statutory disposal available to the police which were expected to be used in some cases where alternative forms of OOCD would have otherwise been given, as well as in some cases that would have been dealt with by other means. Further information about community resolutions can be obtained from the Home Office publication Crime outcomes in England and Wales. ↩
-
Conviction ratio is calculated as the number of offenders convicted as a proportion of the number of defendants prosecuted in a given year. ↩
-
There are rare exceptions, as mentioned in the accompanying technical guide. ↩
-
The introduction of the assaults on emergency workers act 2018 explains the large increase in violence against the person offences and slight increase in indictable offences. Previously, these offences would have been classified as ‘common assault’ or ‘assault on a constable’ offence which are summary offences. ↩
-
Conviction ratio is calculated as the number of offenders convicted as a proportion of the number prosecuted in a given year. ↩
-
CPS data summary Quarter 3 2019-2020, tables covering prosecution outcomes by crime types available here: https://www.cps.gov.uk/sites/default/files/documents/publications/Prosecution-Crime-Types-Data-Tables-Year-Ending-December-2019.xlsx ↩
-
Custody rates are calculated as the number of persons sentenced to immediate custody as a proportion of all sentenced. ↩
-
Other motoring offences includes: Causing danger by interfering with a vehicle, road or traffic equipment, Using or causing others to use a mobile phone whilst driving, Careless driving offences (excl. mobile phone offences), Failing to stop or provide information after accident, Theft of a motor vehicle / aggravated vehicle taking, Driving licence related offences, Work record and employment offences, Fraud, forgery etc. associated with vehicle or driver records, Defective vehicle parts, Vehicle test offences, Miscellaneous (other) motoring offences. ↩
-
The Home Office publishes data on police action in relation to motoring offences including fixed penalty notices (FPNs) for speeding in Police powers and procedures England and Wales statistics. Fixed penalty notices are available as out of court disposals where the speeding offence is not serious enough to warrant a criminal court proceeding and where the offender does not contest being issued with the FPN. ↩