Construction and hospitality shortage review (accessible)
Published 15 March 2023

© Crown copyright 2023
This publication is licensed under the terms of the Open Government Licence v3.0 except where otherwise stated. To view this licence, visit nationalarchives.gov.uk/doc/open-government-licence/version/3 or write to the Information Policy Team, The National Archives, Kew, London TW9 4DU, or email: psi@nationalarchives.gov.uk.
Where we have identified any third party copyright information you will need to obtain permission from the copyright holders concerned.
This publication is available at https://www.gov.uk/government/publications/construction-and-hospitality-shortage-review/construction-and-hospitality-shortage-review-accessible
Introduction
The Migration Advisory Committee (MAC) was commissioned by the Minister for Safe and Legal Migration to review the Shortage Occupation List (SOL) in August 2022. The launch of this review was subsequently paused due to inconsistencies with specific SOC2020 occupational coding data identified by the Office for National Statistics (ONS), which led to the MAC deciding to proceed using SOC2010. However, at the end of September 2022 the review was again paused at the request of the Home Office, whilst we awaited greater clarity regarding the Government’s stance on work migration. The Government subsequently asked us to proceed on 16 February 2023 and we launched our Call for Evidence (CfE) on 27 February 2023.
In advance of starting the full SOL review, we were asked by the Home Secretary on 7 February 2023 to deliver an expedited review of occupations in the construction and hospitality sectors, recommending the addition of eligible occupations to the SOL and RQF 1-2 occupations to the Skilled Worker (SW) route where appropriate. Whilst the MAC accepted the Government’s request for an expedited review, we did not play any part in determining the sectors for review or the associated timings as these details were outlined by the Government in their request to the MAC. We were asked to provide interim recommendations within 4 weeks and to publish our report to coincide with the Budget.
The recommendations in this report are interim, pending the completion of our full SOL review. We will consider these recommendations once more as part of the full review and finalise them as part of our list of SOL-related recommendations to Government. We strongly encourage stakeholders from the construction and hospitality sectors who have submitted evidence as part of this process, to engage fully with the full SOL review as a distinct commission.
Our approach to this review
In each SOL review, the MAC assesses which occupations are both in shortage, i.e., where employers find it difficult to secure adequate numbers of workers with the required skills to fill their vacancies, and where we judge that migration is a sensible response to that shortage. Once an occupation is added to the SOL, employers recruiting for this occupation are subject to more favourable migration arrangements – most notably a reduced salary threshold but also marginally lower visa fees – enabling employers to access a wider pool of suitable workers.
To be eligible for the SOL, an occupation must fulfil the eligibility requirements of the SW route. A job must be classified into a Regulated Qualifications Framework (RQF) level 3-5 skill group or above and meet a minimum annual salary threshold. The Government has uprated these thresholds as part of the routine Spring package of Immigration Rules that were laid on 9 March 2023, following which (subject to Parliamentary approval) this minimum threshold will be £26,200. For this review, the Government have asked that we also consider currently ineligible RQF 1-2 occupations for possible inclusion on the SOL. However, the Government have made clear that such inclusion should be rare, and so the bar is high for such occupations to be added.
The MAC is recommending to the Government that the SOL salary discount should no longer apply to occupations which have a ‘going rate’ salary threshold (defined as the 25th percentile of wages) above the general threshold of £26,200, and the Government has asked us to conduct this review based on that recommendation. We have, therefore, excluded occupations that will not materially benefit from being on the SOL if this salary discount is removed. This is not to say that these occupations may not be in shortage, rather that they can already effectively use the immigration system to help fill vacancies.
The MAC has an evolving approach to reviewing the SOL, which we have updated in our recently published documentation on Methodology for the SOL. This expedited review has required an augmented approach which we outline in Section 5 along with limitations. We have maintained our focus on incorporating the most reliable and comprehensive evidence available. We have prioritised speaking with key stakeholders in each sector through roundtable discussions alongside the review of all written evidence that stakeholders have submitted in the limited time available.
Structure
This report provides the following information and analysis:
-
An overview of the economic context
-
The labour markets of the construction and hospitality sectors
-
How each sector has made use of the immigration system to date
-
Analysis of eligible occupations from each sector and recommendations
Section 2: The economic context
Gross domestic product (GDP) is expected to decrease slightly across 2023 and most of 2024, according to the most recent Bank of England (BoE) forecasts illustrated in Figure 2.1. This qualifies as a technical recession – 2 consecutive quarterly decreases in GDP. This decline in output is however less substantial than previously forecast, reflecting recent strength in the labour market. Other forecasters expect a similar GDP decrease in early 2023 but expect slightly higher growth beyond this.
Prior to the COVID-19 pandemic, unemployment had been declining steadily since 2015. Following a rise during the lockdowns, the unemployment rate has returned to historic lows. The BoE has forecast that the unemployment rate will rise over the next 3 years, reaching 5% in the first quarter of 2025. This rise is, however, a full percentage point lower than the November 2022 forecast from the BoE. This highlights the very considerable uncertainty that currently exists as to how severe any downturn in the labour market will turn out to be. Figure 2.2 emphasises this uncertainty by showing that other economic forecasters have a more optimistic path for the unemployment rate than the BoE.
Figure 2.1: Four-quarter growth in real GDP, Q1 2015-Q1 2026
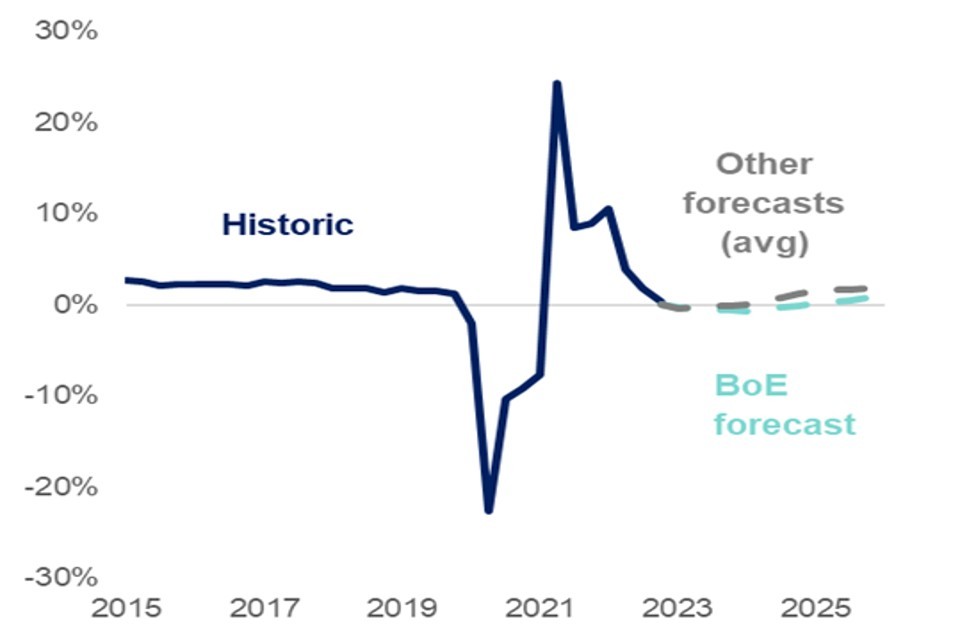
Figure 2.1
Source: Office for National Statistics (ONS) & Bank of England February 2023 Monetary Policy Report.
Note: Historic figures are reported quarterly. Forecasts are reported for Q1 annually. ‘Other forecasters’ refers to the BoE’s most recent survey of external forecasters.
Figure 2.2: LFS unemployment rate, Q1 2015-Q1 2026
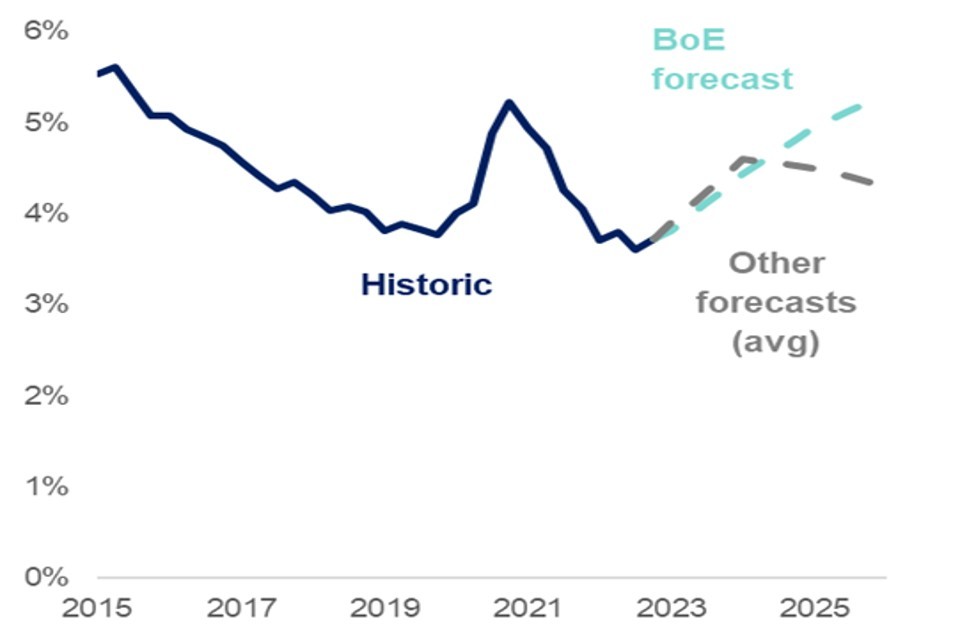
Figure 2.2
Source: ONS & Bank of England February 2023 Monetary Policy Report.
Note: Historic figures are reported quarterly. Forecasts are reported for Q1 annually. ‘Other forecasters’ refers to the BoE’s most recent survey of external forecasters.
Whilst unemployment has remained low, there has been a notable rise in economic inactivity since the start of the pandemic (Figure 2.3), which has not been reflected in most other OECD economies. This has largely been driven by an increase in young people entering or remaining in full-time education, particularly in 2021, and by an increase in inactivity due to long-term illness, particularly in 2022. Sustained high inactivity is predominantly being driven by the 50–64-year-old age group, and it is unclear whether individuals in this group are likely to re-enter the labour market. The BoE does not forecast any substantial change in labour market participation over the next couple of years.
Figure 2.4 shows trends in vacancies and real wage growth since 2015. Since reaching lows in Q2 2020 (due to the pandemic), vacancies reached record high levels in 2022, although there has been a slight decline in more recent quarters as the economy has stagnated. The combination of high vacancy levels at a time of low unemployment and declining labour force participation, highlights the very tight labour market that the UK has recently been experiencing, in common with many other OECD economies. Real wage growth has been decreasing since Q1 2021 due to rising inflation and has been negative since the middle of 2022.
Figure 2.3: Economic inactivity, age 16-64, 2015-2022
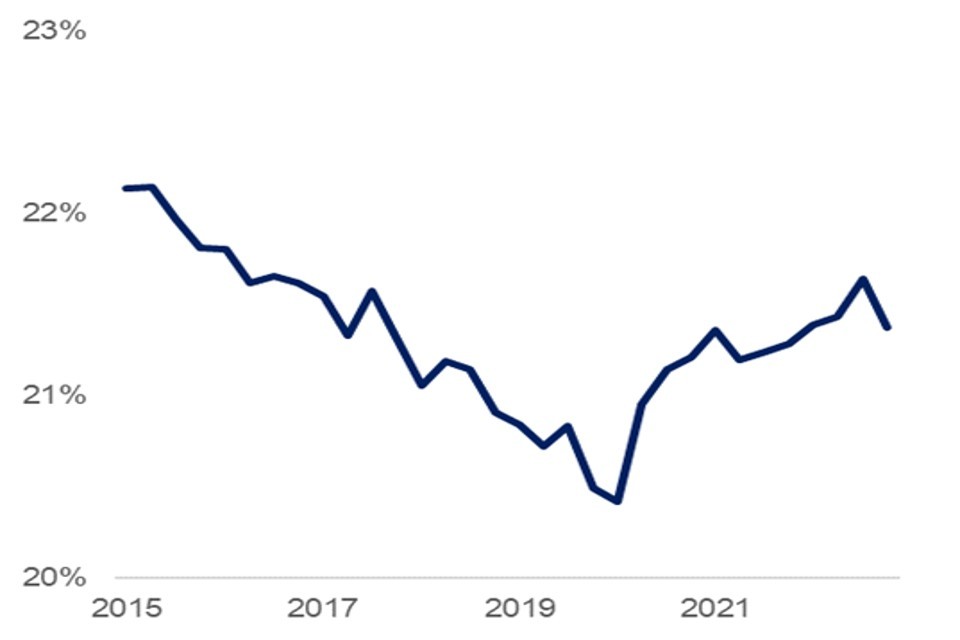
Figure 2.3
Source: ONS Labour Market Statistics, February 2023.
Note: Seasonally adjusted data, includes all aged 16-64. Quarterly estimates, year labels relate to first quarter.
Figure 2.4: Vacancies and real wage growth, 2015-2022
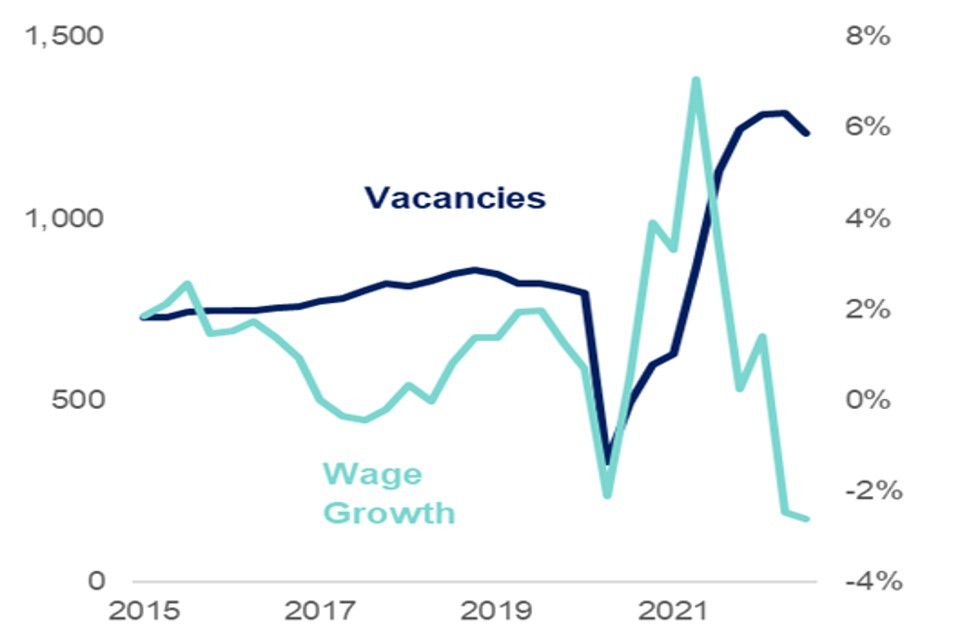
Figure 2.4
Source: ONS, February 2023.
Note: Wages refers to Total Pay. Quarterly estimates, year labels relate to first quarter. Vacancies are in thousands.
Section 3: The construction & hospitality labour markets
Employment
The construction and hospitality sectors account for 6% and 7% of all workforce jobs respectively. The extent of self-employment in the sectors is markedly different: 30% of jobs in construction are in self-employment and only 6% in hospitality, compared to an average of 11% in all other sectors. Self-employed workers are not eligible for the SW route. Figure 3.1 compares the change in employee jobs in construction and hospitality to all other sectors and Figure 3.2 compares self-employment jobs in construction to all other sectors.
Figure 3.1: Indexed employee jobs in construction and hospitality, 2004-2022 (Q1 2004=100)
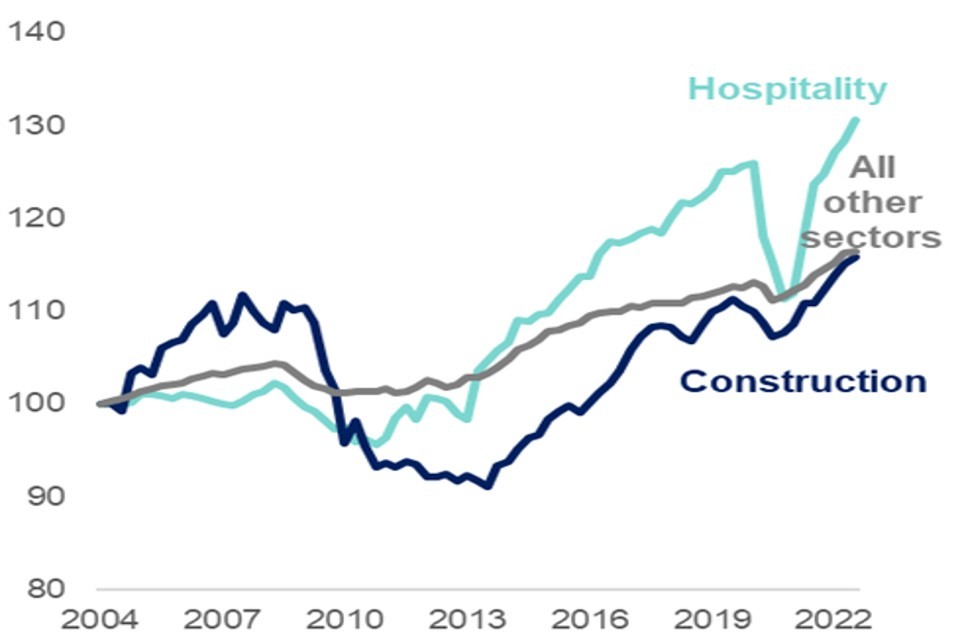
Figure 3.1
Source: ONS Workforce jobs by industry, quarterly data.
Figure 3.2: Indexed self-employment jobs in construction, 2004-2022 (Q1 2004=100)
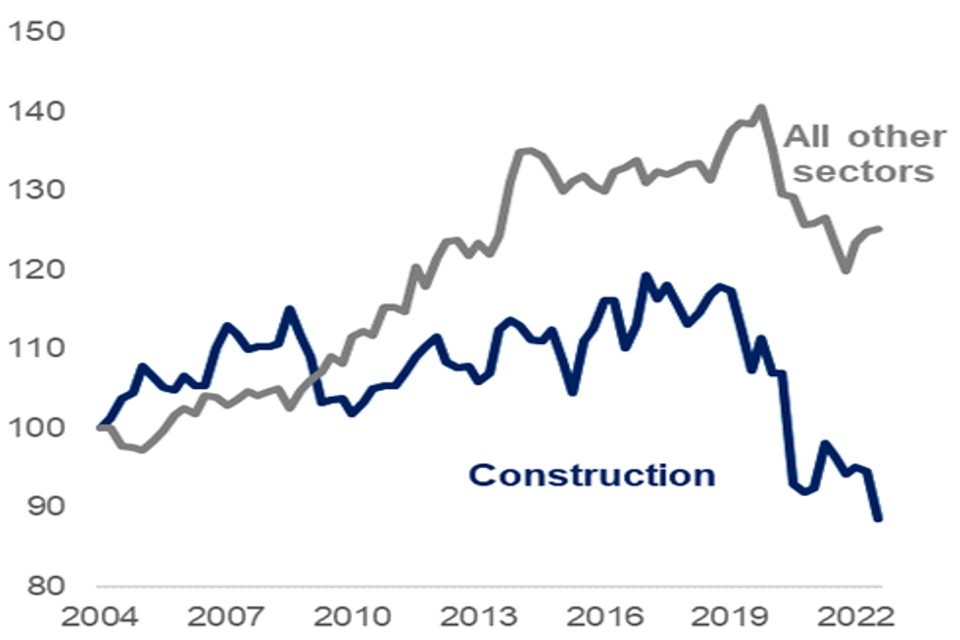
Figure 3.2
Source: ONS Workforce jobs by industry, quarterly data.
Note: Hospitality omitted as self-employment accounts for a small share of total employment.
Overall employment in hospitality has increased since 2004 with particularly strong growth since 2013. Employee jobs have recovered since a large fall during the pandemic and now comfortably exceed pre-pandemic levels. The picture in construction is more mixed – employee jobs decreased in the early 2010s, but have since grown consistently, while self-employment jobs fell significantly during the pandemic and have not recovered. As a result, the share of self-employed in construction has been falling in the last few years. However, these two factors broadly offset each other such that total employment in construction is similar to its 2004 level.
Both the decision to leave the European Union (EU) with the consequent ending of Freedom of Movement, and the COVID-19 pandemic, have had significant effects on the employment of non-UK workers in these sectors, particularly hospitality. The figures below show the number of payrolled employments from HMRC data by nationality since 2014. Unfortunately, the data for 2022 will not be published until after this report is completed.
Figure 3.3: Indexed employments by nationality for construction July 2014-June 2021 (July 2014=100)
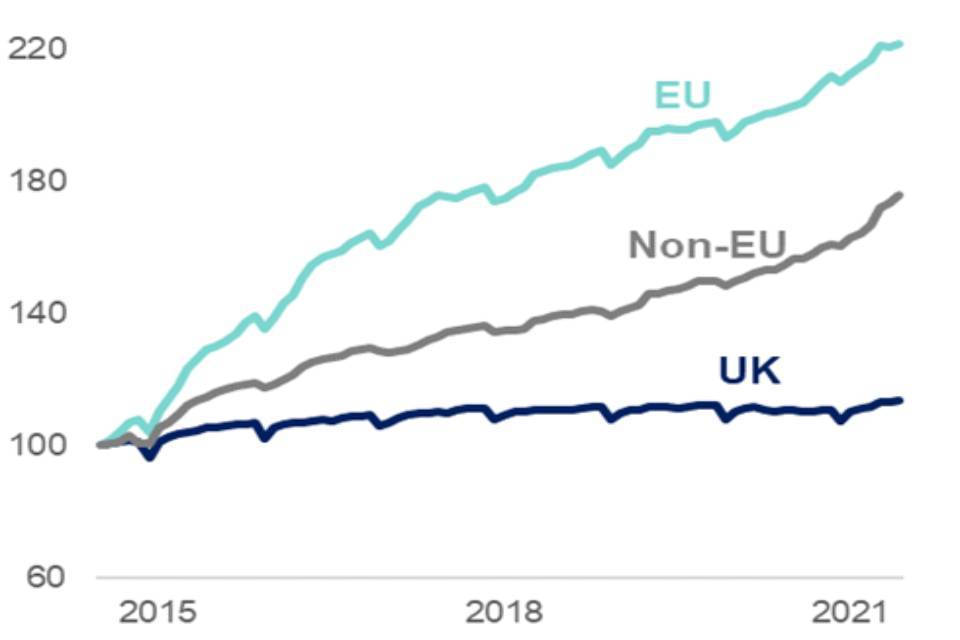
Figure 3.3
Source: HMRC Payrolled employments in the UK by industry and nationality, monthly data July 2014-June 2021.
Figure 3.4: Indexed employments by nationality for hospitality July 2014-June 2021 (July 2014=100)
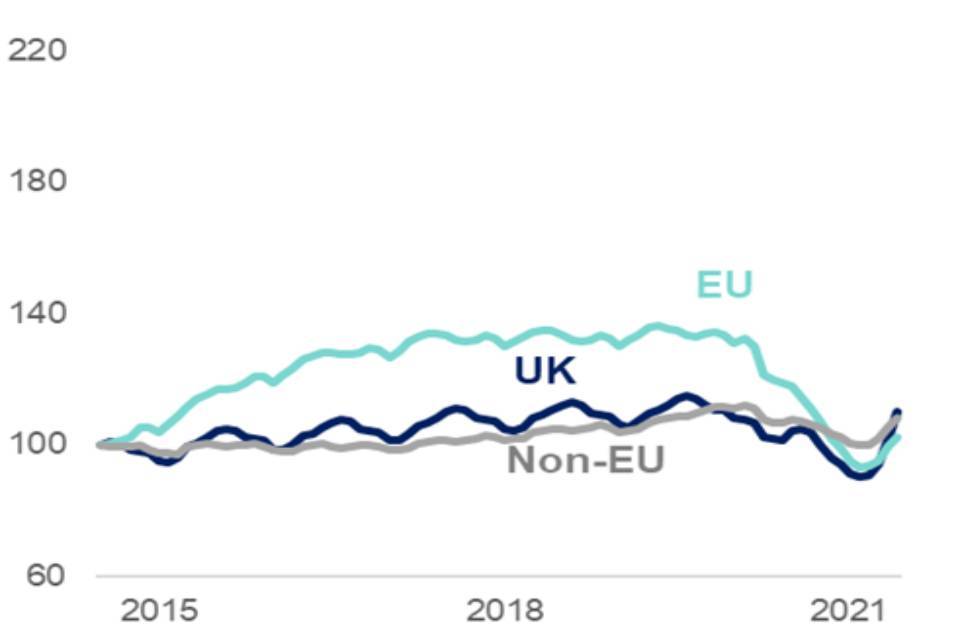
Figure 3.4
Source: HMRC Payrolled employments in the UK by industry and nationality, monthly data July 2014-June 2021.
The share of non-UK nationals in construction has grown since 2014 and continued to grow between 2019 and 2021. However, this was from a low base – only 6% of employees in July 2014 were non-UK nationals. The picture is much less clear for self-employed EU nationals in construction, who, without settled or pre-settled status, may not be eligible for a work visa. Our 2022 Annual Report noted that, before the end of Freedom of Movement, 27% of all the European Economic Area self-employed worked in construction, accounting for 5% of the total construction workforce.
The share of non-UK nationals in hospitality is much higher, accounting for 26% of employees in July 2014. The share of EU nationals in the hospitality sector was growing up to 2019 but fell significantly during the pandemic. As of June 2021, the number of EU national employees had not recovered (whereas ONS analysis shows that the level of UK and non-EU nationals had). Overall employment has grown rapidly in hospitality since 2021 and is now above pre-pandemic levels. It is not clear whether this is because of, or in spite of, flows of EU nationals – though a number of key occupations in the sector do not meet the skills requirement for a SW visa.
Vacancies
Vacancies have risen strongly in both hospitality and construction. Comparing the most recent three-month period (Nov-Jan 2023) with the immediate pre-pandemic period (Jan-Mar 2020), vacancies are 72% higher in hospitality and 65% higher in construction. This compares to an increase of 42% in the overall economy. Vacancies have, however, been declining since the middle of 2022, with vacancies overall now 13% lower than the peak. Once again, the uncertainty over the path of the economy and the labour market in the coming year makes it difficult to predict whether this decline will continue to more normal levels. Focusing directly on the RQF 3-5 occupations eligible for the SW route, vacancies in construction rose faster than elsewhere in 2021 but have since converged on the wider trend. Vacancies in hospitality converged on the wider trend from a lower starting point over the same period but dipped in late 2022.
Figure 3.5: Vacancy rates in construction and hospitality, 2016-2022
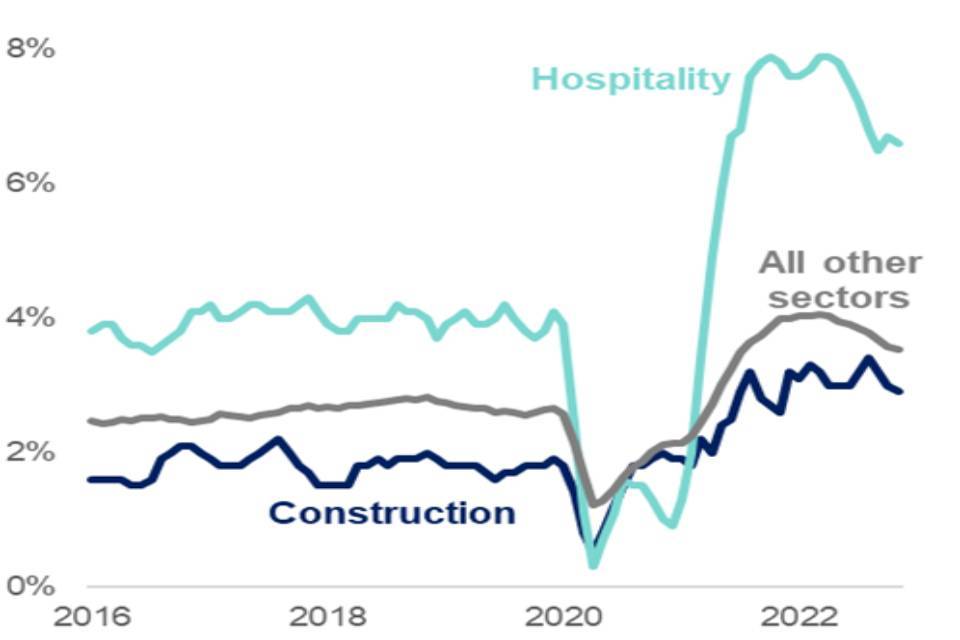
Figure 3.5
Source: ONS vacancy survey, monthly data.
Note: “All other sectors” excludes agriculture, forestry and fishing.
Figure 3.6: Indexed job postings in RQF 3-5 occupations in construction and hospitality, 2016-2022 (Jan 2016=100)
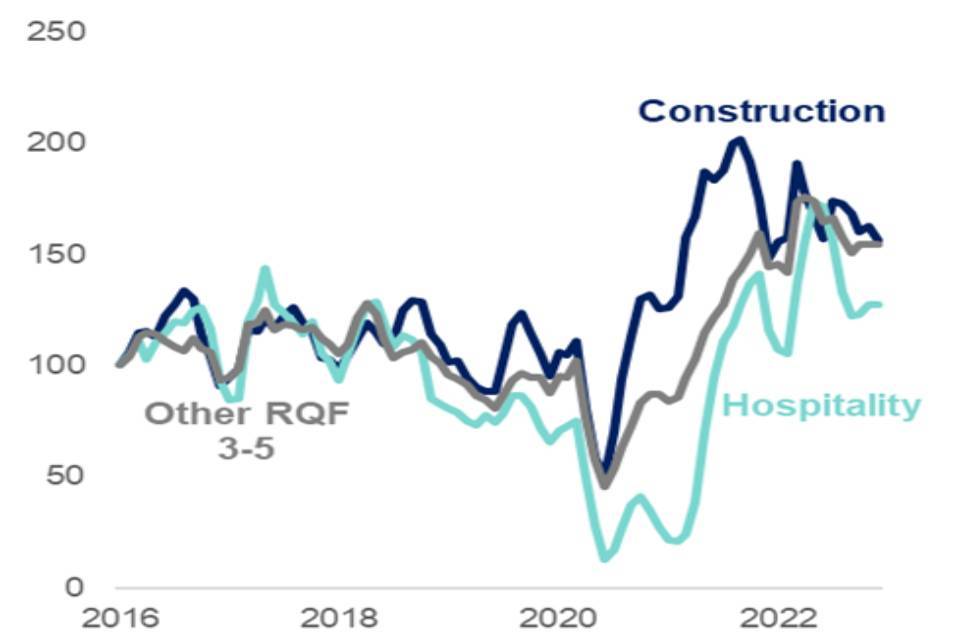
Figure 3.6
Source: Lightcast Analyst job postings data, three-month rolling average.
Note: Data for construction and hospitality comprises RQF 3-5 occupations in scope (see section 5), ‘other’ comprises all other RQF 3-5 occupations.
Productivity and wages
Figure 3.7 shows the evolution in median real wages in the construction and hospitality sectors since 2004, compared to all other sectors and the minimum wage/National Living Wage (NLW). The minimum wage has risen significantly, particularly since the introduction of the NLW in 2016. The effect of this is clear in hospitality, a relatively low-paying sector, in which wage growth accelerated in tandem with the NLW. This was not the case in construction, where pay is generally higher. Here, the real median wage has been broadly flat, as has been the case more widely in the labour market.
Figure 3.7: Real median hourly wages in construction and hospitality, 2004-2022 (2004=100)
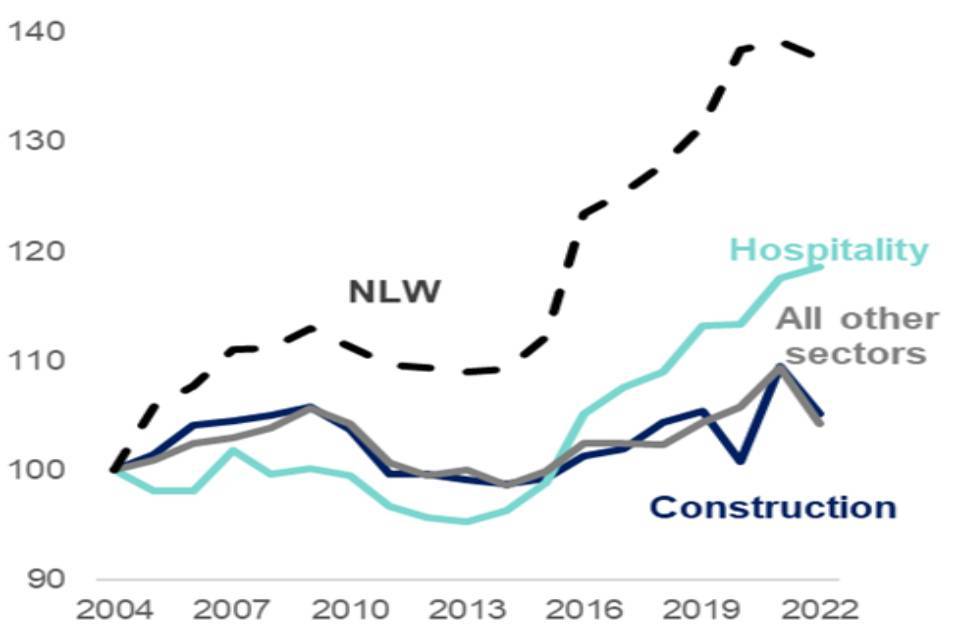
Figure 3.7
Source: ASHE, ONS CPIH index, LPC; data refers to April of given year.
Note: the National Living Wage (NLW) was introduced in 2016.
Figure 3.8: Real output per hour worked in construction and hospitality, 2004-2021 (2004=100)
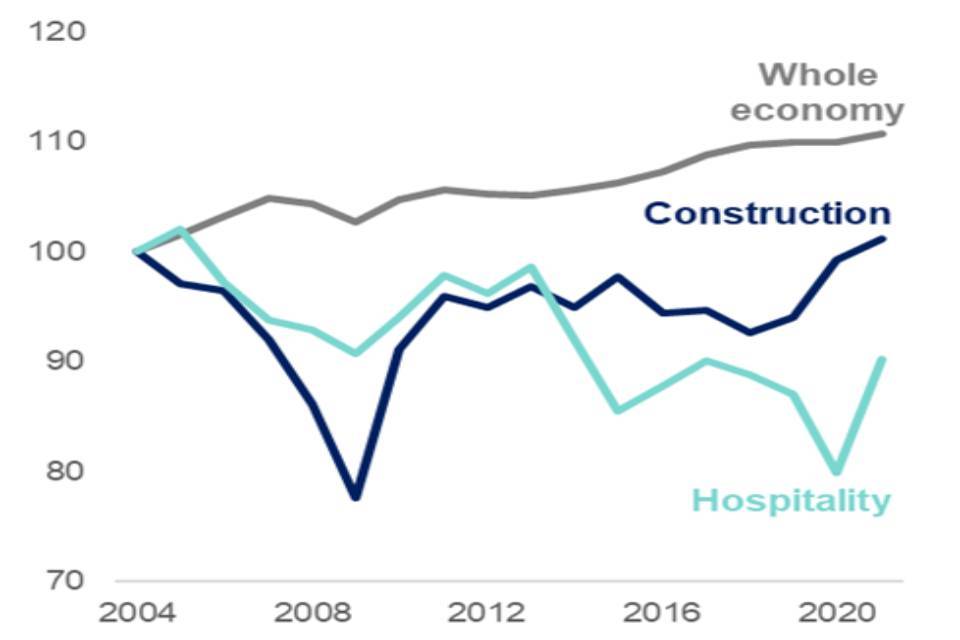
Figure 3.8
Source: ONS Output per hour worked.
Figure 3.8 compares the trend in real output per hour in construction and hospitality to the whole economy. Both sectors have lagged behind the gradual increase in productivity seen in the wider economy. Productivity in construction has been essentially flat, aside from a short-lived dip during the financial crisis, while productivity in hospitality has declined since 2013. As of 2021, output per hour worked was £32 in construction and £20 in hospitality, compared to £40 across the whole economy – almost the same proportional differences as in 2004.
Section 4: Use of the immigration system
The SW route is the main route for skilled work into the UK. Under this route, the range of jobs that can be filled by migrants includes those at RQF 3+ (at A-level or above, NVQ3 or equivalent), with the exception of Care Workers that are – as a result of a recommendation made by the MAC in its review of the impact of ending freedom of movement on adult social care – the only RQF 1-2 occupation eligible for the route through the SOL. As a result, we would expect that there has been limited use of the immigration system in the hospitality sector, given that 63% of total employment in hospitality is RQF 1-2 and therefore ineligible for the SW route. This is not the case for construction, where only 20% of employment is ineligible.
This section explores the existing data on usage of the immigration system.
Use of SW route
Construction and hospitality make up a small proportion of visa applications. The data below shows usage since the introduction of the SW route, demonstrating that hospitality and construction comprised a small proportion of visa applications in 2021 at 2% and 1% respectively. This highlights that the construction sector uses the SW route much less than we would expect given the overall share of eligible workers in the sector.
Table 4.1: Proportion of visa applications by sector, December 2020-August 2022
|
Sector |
2021 |
2022 |
|---|---|---|
|
Construction |
1% |
1% |
|
Hospitality |
2% |
3% |
|
Other |
97% |
96% |
Source: Home Office Management Information December 2020 to August 2022.
Notes: Used Certificates of Sponsorship (CoS). CoS is assigned to a migrant by their sponsoring employer and the migrant can then use the certificate number to make an application. EU workers included from January 2021.
Figure 4.2: Total number of visa applications by sector, December 2020-August 2022
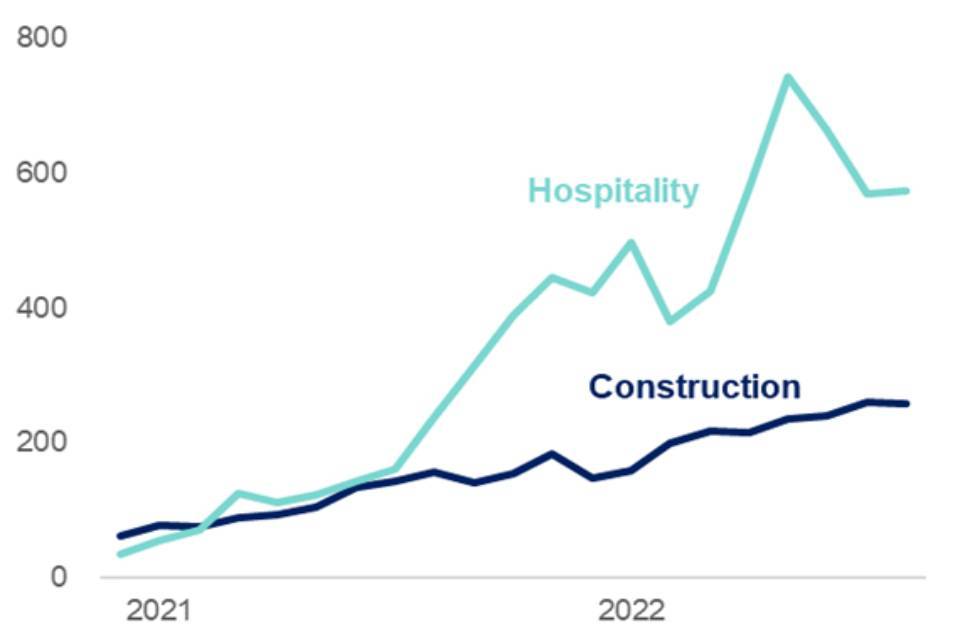
Figure 4.2
Source: Home Office Management Information December 2020 to August 2022.
Notes: Used CoS. CoS is assigned to a migrant by their sponsoring employer and the migrant can then use the certificate number to make an application. EU workers included from January 2021.
Figure 4.2 shows the total number of visa applications by sector, demonstrating an uptick in applications following the end of lockdown in 2021. Out of the 26 occupations in scope (set out in section 5), 17 are RQF 3+ and therefore currently eligible for the SW route. The following analysis focuses on these occupations specifically. The tables below show the proportion of visa applications by occupation, alongside the share of total employees these occupations make up according to Annual Population Survey data, across the listed occupations.
Table 4.3 shows that Chefs make up the largest proportion of applications (60%) for hospitality; this is 10 percentage points (pp) higher than the share that they make up of total employees across these 5 occupations.
Table 4.3: Number of visa applications and total employment by occupation (hospitality)
|
SOC Description |
Visa Applications |
Total Employees |
|---|---|---|
|
Publicans and managers of licensed premises |
Below 30 (<5%) |
30,900 (7%) |
|
Hotel and accommodation managers and proprietors |
204 (<5%) |
23,800 (6%) |
|
Catering and bar managers |
843 (14%) |
62,400 (14%) |
|
Restaurant and catering establishment managers and proprietors |
1349 (23%) |
96,100 (22%) |
|
Chefs |
3581 (60%) |
217,500 (50%) |
Source: Home Office Management Information December 2020 to August 2022. Annual Population Survey (APS) January to December 2020.
Notes: Used CoS. CoS is assigned to a migrant by their sponsoring employer and the migrant can then use the certificate number to make an application.
Table 4.4 shows that Carpenters and joiners, and Bricklayers and masons, make up the highest proportion of construction visa applications, comprising 34% and 19% respectively. Both are higher than their percentage of employment across these occupations.
Table 4.4: Number of visa applications and total employment by occupation (construction)
|
SOC Description |
Visa Applications |
Total Employees |
|---|---|---|
|
Steel erectors |
Below 30 (<5%) |
4,100 (1%) |
|
Painters and decorators |
Below 30 (<5%) |
21,700 (4%) |
|
Roofers, roof tilers and slaters |
Below 30 (<5%) |
19,400 (4%) |
|
Floorers and wall tilers |
Below 30 (<5%) |
10,400 (2%) |
|
Plumbers and heating and ventilating engineers |
Below 30 (<5%) |
76,600 (15%) |
|
Plasterers |
Below 30 (<5%) |
7,800 (2%) |
|
Building and civil engineering technicians |
46 (5%) |
16,200 (3%) |
|
Electricians and electrical fitters |
59 (7%) |
155,600 (31%) |
|
Construction and building trades n.e.c. |
100 (12%) |
72,900 (14%) |
|
Glaziers, window fabricators and fitters |
101 (12%) |
23,700 (5%) |
|
Bricklayers and masons |
164 (19%) |
18,200 (4%) |
|
Carpenters and joiners |
296 (34%) |
79,400 (16%) |
Source: Home Office Management Information December 2020 to August 2022. APS January to December 2020.
Notes: Used CoS. CoS is assigned to a migrant by their sponsoring employer and the migrant can then use the certificate number to make an application.
Salary analysis
Table 4.5 shows the median salary by occupation as reported for those on the SW route, for all workers in the occupation and the annual required going rate for the occupation as set out in the Immigration Rules.
Table 4.5: SW route, median UK, and binding salaries by occupation
|
SOC Description |
Skilled Worker (£) |
UK labour market (£) |
Binding threshold (£) |
|---|---|---|---|
|
Hotel and accommodation managers and proprietors |
27,000 |
27,900 |
25,600 |
|
Restaurant and catering establishment managers and proprietors |
26,000 |
23,000 |
25,600 |
|
Publicans and managers of licensed premises |
29,500 |
26,600 |
25,600 |
|
Building and civil engineering technicians |
27,000 |
28,900 |
25,600 |
|
Electricians and electrical fitters |
28,000 |
32,500 |
27,200 |
|
Steel erectors |
28,500 |
32,400 |
25,600 |
|
Bricklayers and masons |
25,600 |
28,000 |
25,600 |
|
Roofers, roof tilers and slaters |
25,600 |
24,300 |
25,600 |
|
Plumbers and heating and ventilating engineers |
27,000 |
31,700 |
25,800 |
|
Carpenters and joiners |
28,600 |
28,000 |
25,600 |
|
Glaziers, window fabricators and fitters |
25,600 |
23,100 |
25,600 |
|
Construction and building trades n.e.c. |
26,000 |
27,100 |
25,600 |
|
Plasterers |
27,000 |
26,800 |
25,600 |
|
Floorers and wall tilers |
26,000 |
25,500 |
25,600 |
|
Painters and decorators |
26,200 |
24,800 |
25,600 |
|
Chefs |
26,000 |
20,400 |
25,600 |
|
Catering and bar managers |
26,000 |
21,300 |
25,600 |
|
Cooks |
N/A |
18,100 |
N/A |
|
Scaffolders, stagers and riggers |
N/A |
33,200 |
N/A |
|
Road construction operatives |
N/A |
31,600 |
N/A |
|
Construction operatives n.e.c. |
N/A |
25,500 |
N/A |
|
Mobile machine drivers and operatives n.e.c. |
N/A |
30,200 |
N/A |
|
Elementary construction occupations |
N/A |
24,300 |
N/A |
|
Kitchen and catering assistants |
N/A |
16,200 |
N/A |
|
Waiters and waitresses |
N/A |
16,100 |
N/A |
|
Bar staff |
N/A |
15,900 |
N/A |
Source: Home Office Management Information December 2020 to August 2022. Annual Survey of Hours and Earnings (ASHE) 2021. UK Visas and Immigration Guidance, Skilled Worker visa: going rates for eligible occupation codes, updated 15 February 2022.
Note: The general threshold of £25,600 relates to the threshold prior to 2023 uprating to £26,200.
Note: Mean is reported for Steel erectors, as median is not available in published ASHE table 14.
Note: Used CoS. CoS is assigned to a migrant by their sponsoring employer and the migrant can then use the certificate number to make an application. Additional filters have been applied to remove erroneous cases including high salaries.
Across occupations, the median wage for SW visa holders and for all UK workers are broadly in line. The exceptions to this include Chefs, and Catering and Bar Managers, where the overall median is more than 20% below the median for those on the SW route. This is a result of the fact that sponsors could only employ these workers during this period subject to the general threshold minimum of £25,600 (at the time), so many employers are simply unable to use the SW route given prevailing wages in the occupation.
Section 5: Occupational analysis and recommendations
Methodology and limitations
The MAC SOL methodology, first described in 2008 and revised over subsequent methodology reviews, uses 2 broad criteria to decide which occupations should be added to the SOL. It asks whether:
-
The occupation is in shortage – this is based on indicators, from a range of datasets, which look at wages, vacancies, and employment, combined with evidence from stakeholders.
-
It is sensible to fill this shortage with migrant workers – this considers whether putting the job on the SOL is likely to be the most effective and appropriate response to shortage. Evidence from stakeholders contributes to this decision, alongside internal analysis.
Historically, the MAC has assessed shortage by examining various indicators taken from national datasets combined with stakeholder evidence. We have reviewed our previous shortage methodology and streamlined these indicators. Whilst a full CfE has not been possible for this interim report, the MAC has received evidence from stakeholder groups which is used alongside the indicators to determine whether an occupation meets the criteria.
The Government asked the MAC to review occupations in the construction and hospitality sectors. We have considered the occupations within these sectors and determined 26 occupations to be in scope for review. This decision was based on 2 criteria: that an occupation must make up more than 0.5% of the sector workforce, and that around half or more of workers in that occupation must work in the sector. The occupations must also have a going rate below the updated general threshold of £26,200. We also welcomed stakeholder requests for including additional occupations on a case-by-case basis.
Table 5.1: Occupations under consideration in construction
|
SOC |
Description |
RQF Level |
|---|---|---|
|
3114 |
Building and civil engineering technicians |
3-5 |
|
5311 |
Steel erectors |
3-5 |
|
5312 |
Bricklayers and masons |
3-5 |
|
5313 |
Roofers, roof tilers and slaters |
3-5 |
|
5315 |
Carpenters and joiners |
3-5 |
|
5316 |
Glaziers, window fabricators and fitters |
3-5 |
|
5319 |
Construction and building trades n.e.c. |
3-5 |
|
5321 |
Plasterers |
3-5 |
|
5322 |
Floorers and wall tilers |
3-5 |
|
5323 |
Painters and decorators |
3-5 |
|
8141 |
Scaffolders, stagers and riggers |
1-2 |
|
8142 |
Road construction operatives |
1-2 |
|
8149 |
Construction operatives n.e.c. |
1-2 |
|
8229 |
Mobile machine drivers and operatives n.e.c. |
1-2 |
|
9120 |
Elementary construction occupations |
1-2 |
Table 5.2: Occupations under consideration in hospitality
|
SOC |
Description |
RQF Level |
|---|---|---|
|
1221 |
Hotel and accommodation managers and proprietors |
3-5 |
|
1223 |
Restaurant and catering establishment managers and proprietors |
3-5 |
|
1224 |
Publicans and managers of licensed premises |
3-5 |
|
5434 |
Chefs |
3-5 |
|
5435 |
Cooks |
1-2 |
|
5436 |
Catering and bar managers |
3-5 |
|
9272 |
Kitchen and catering assistants |
1-2 |
|
9273 |
Waiters and waitresses |
1-2 |
|
9274 |
Bar staff |
1-2 |
Whilst the MAC will only recommend adding an occupation to the SOL if we are satisfied that immigration is a sensible solution to a shortage, the SW route/SOL is not the only immigration route which helps employers recruit foreign workers. For example, the Youth Mobility Scheme (YMS) generally allows young people from eligible countries to work in the UK for up to 2 years and these schemes require no formal sponsorship from employers nor have restrictions on the type of work that can be performed. The MAC has long argued that expanding the YMS to more countries would be beneficial, and this is likely to be particularly so for hospitality. In addition, most international students can work part-time during their studies and the newly established graduate route allows them to remain for a further 2 years in the UK after their studies end.
In this interim review, the MAC has decided not to recommend any RQF 1-2 occupations for addition to the SOL or SW route. The Government was clear that such a recommendation should be exceptional and based on particularly strong evidence. Perhaps inevitably, given the shortened time frame that stakeholders had to respond to us, we do not consider any of the evidence submitted sufficiently strong to justify a recommendation. This does not preclude us from making such a recommendation in our full SOL review, as stakeholders will have greater time to make a robust evidence-based case, which we will consider. We invite stakeholders to include in their submissions evidence which demonstrates a shortage that cannot be solved through domestic recruitment, and that shortage will materially affect the UK economy.
All recommendations made in this report are subject to further consideration in our full SOL review or at any point thereafter, in the context of the MAC receiving and considering any new evidence.
Construction
Vacancies in the sector have risen substantially relative to pre-pandemic levels. This was a common theme in the sectoral evidence that the MAC received, and whilst the wider UK labour market has followed a similar pattern, there are other factors which help suggest the SOL may be an appropriate short-term solution to the shortage of labour specific to the construction industry.
Stakeholder evidence suggests that there are sector-wide initiatives to improve recruitment and retention as well as already well-established training pathways. It also suggests that the industry is keen to increase direct employment, moving away from its traditionally high self-employment rate. Both actions show a desire in the industry to increase domestic recruitment and improve workers’ career development opportunities. Despite this, in some areas of the sector there are still shortages which do not show signs of abating. In others, predicted future demand for workers exceeds expected supply levels. The MAC received substantial evidence which demonstrated the sector’s understanding of its workforce and how its make-up is likely to change in the next decade, with demand likely to increase markedly.
In our deliberations on the occupations discussed in this section, the MAC has given substantial weight to the strategic importance of construction for the UK economy and the significant positive externalities that the sector generates. This is both in infrastructure and house building and fits the ‘sensible’ criterion of public value. It is worth noting that there was a variety of views within the Committee about the relative weight that should be placed on this broader public value of these occupations, and how strongly this justified recommending that these RQF 3-5 occupations be placed on the SOL. The arguments were finely balanced. Our conclusion was that it was difficult at this stage, given the speed of the review, to clearly identify the most impacted occupations. This approach will be revisited in the full SOL review, for which the sector will have a much longer period to gather and submit evidence to the MAC. We will expect more detailed occupation-specific evidence of how shortages are being addressed using domestic recruitment and setting out the importance of each occupation to the wider industry. This means that some construction occupations that we are recommending for inclusion on the SOL in this interim report may be removed in the full review.
The MAC recommends that the construction sector occupations corresponding to the following SOC codes be added to the SOL: 5312 (Bricklayers and masons), 5313 (Roofers, roof tilers and slaters), 5315 (Carpenters and joiners), 5319 (Construction and building trades n.e.c) and 5321 (Plasterers). We also recommend that ‘Dryliners’ are moved from SOC code 8149 (Construction operatives n.e.c) to 5321 (Plasterers) as they will in any case fall under 5321 (Plasterers) under the updated SOC2020 classification system. We do not recommend the addition of 5311 (Steel erectors) to the SOL, as based on projected pay growth it is likely that this occupation’s pay will be high enough for most jobs to meet the general threshold and therefore there is little justification for a SOL salary discount, which would risk undercutting domestic workers’ pay.
We noted earlier that the construction sector has not used the SW route extensively thus far. Stakeholders highlighted that this was partly a result of a large number of SME construction firms that were not registered as sponsors. This suggests that placing these occupations on the SOL is unlikely to lead to a very substantial rise in visa applications, at least in the short run. The MAC would not consider such low uptake as a failure of the policy, but more a reflection of the fact that recruiting foreign workers may not be an effective solution for many employers. However, that does not prevent it being an effective solution for other employers. We will review the visa application numbers for these occupations during the full SOL review.
Other requests
Not all job titles are explicitly allocated to an occupation code (SOC2010) by the ONS. For some of these, the construction sector asked us to confirm which occupation code they should belong to. In particular, this applies to “Building Safety Managers” and “Retrofit Coordinators”. However, it is not the role of the MAC to determine this. Paragraph SW 6.2 of the Immigration Rules states that:
The sponsor must choose an appropriate occupation code, and the decision maker must not have reasonable grounds to believe the sponsor has chosen a less appropriate occupation code for any of the following reasons:
(a) the most appropriate occupation code is not eligible under the Skilled Worker route; or
(b) the most appropriate occupation code has a higher going rate than the proposed salary; or
(c) the most appropriate occupation code is not a shortage occupation and the applicant is claiming points for a job in a shortage occupation; or
(d) the most appropriate occupation code is not listed as “eligible for PhD points” in Table 1 of Appendix Skilled Occupations and the applicant is claiming points for an educational qualification.
The MAC has no reason to believe that the SOC2010 occupation codes for Building Safety Managers (1251) and Retrofit Coordinators (5319) suggested by the sector are inappropriate. However, it is for sponsors to judge whether these occupation codes are appropriate to comply with Rule 6.2. If the sector has any uncertainty over this, they should formally ask the Home Office for confirmation, and we believe it is incumbent on the Home Office to provide legal certainty.
Table 5.3: Recommendations for occupations in construction
|
SOC |
Description |
Decision |
|---|---|---|
|
5311 |
Steel erectors |
Do not recommend for addition to the SOL |
|
5312 |
Bricklayers and masons |
Recommend for addition to the SOL |
|
5313 |
Roofers, roof tilers and slaters |
Recommend for addition to the SOL |
|
5315 |
Carpenters and joiners |
Recommend for addition to the SOL |
|
5319 |
Construction and building trades n.e.c. |
Recommend for addition to the SOL |
|
5321 |
Plasterers |
Recommend for addition to the SOL and recommend that ‘Dryliners’ but not ‘Ceiling fixers’ are moved to this SOC code |
|
8141 |
Scaffolders, stagers and riggers |
Do not recommend for addition to the SOL |
|
8142 |
Road construction operatives |
Do not recommend for addition to the SOL |
|
8149 |
Construction operatives n.e.c. |
Do not recommend for addition to the SOL Recommend that ‘Dryliners’ but not ‘Ceiling fixers’ are moved from this SOC code to SOC code 5321 (Plasterers) |
|
8229 |
Mobile machine drivers and operatives n.e.c. |
Do not recommend for addition to the SOL |
|
9120 |
Elementary construction occupations |
Do not recommend for addition to the SOL |
Hospitality
Like the construction sector, vacancies in the hospitality sector are high compared to pre-pandemic levels. This effect has no doubt been caused by the extreme fluctuations in demand for hospitality in recent years, as COVID-19 lockdowns resulted in the closure of non-essential businesses, but demand returned to normal levels soon after. However, the MAC has not received substantial evidence which proves that shortage cannot be filled with domestic recruitment. Indeed, many occupations in this sector are at skill level RQF 1-2, and therefore we require, as requested by the Government, an exceptional argument that immigration should be used to alleviate shortage.
The MAC previously considered RQF 3-5 roles in the hospitality sector in the 2020 SOL report in section 6H. In that report the MAC did not recommend any addition of occupations from the hospitality sector to the SOL and recommended the removal of Chefs.
For the few hospitality occupations at skill level RQF 3-5 in-scope, we do not feel that we have sufficiently clear evidence that these specific occupations are in shortage, or, that a lower salary threshold would be sensible. As a result, we do not recommend the addition of any occupations in the hospitality sector to the SOL.
We again paid particular attention to Chefs, as we did in the SOL 2020 report. Here there is clearer evidence of shortage, and the occupation is the major user within the hospitality sector of the immigration system. We reviewed the evidence that stakeholders provided regarding new training initiatives for chefs and welcome these developments. Less positively, there still appears to be little progress in improving terms and conditions, and in particular pay growth continues to be driven to a large extent by the statutory minimum wage. It is unclear how the sector foresees sustainable domestic recruitment and retention for this skilled occupation when wages remain so low. Overall, the MAC is not persuaded that our decision in 2020 to recommend the removal of Chefs from the SOL should be reversed.
We recognise that the sector was given a far from ideal timescale to provide evidence on this occasion and we encourage stakeholders to provide robust, evidence-based submissions to us for our full SOL review. This should clearly set out the importance of the occupation to the UK economy and provide evidence that domestic recruitment is insufficient for that occupation, and that a lower salary threshold is needed.
Other requests
The hospitality sector requested that Sommeliers (a job title within the RQF 1-2 waiters and waitresses occupation) be categorised as an RQF 3 level job and therefore made eligible for the SW route. The MAC has in the past considered such requests and recommended that individual job titles be made eligible even when the occupation as a whole is not. Given the compressed time schedule of this interim review, we could not realistically review sufficient evidence concerning the training requirements of Sommeliers. Therefore, we invite the hospitality sector to provide further evidence on this for the full SOL review. We note that historically Sommeliers have been graded in Immigration Rules at a higher skill level than the overall occupation and so are certainly receptive to this request.
We would also note that the Home Office may wish to consider, and provide guidance to us, on the overall desirability of regrading individual job titles to make them eligible for the SW route. This no doubt adds to the complexity of the system for what may often be a very small group of workers and in addition tends to be asymmetric, i.e., we do not receive requests from stakeholders to regrade job titles in RQF 3-5 occupations downwards even though such cases will exist.
Table 5.4: Recommendations for occupations in hospitality
|
SOC |
Description |
Decision |
|---|---|---|
|
1221 |
Hotel and accommodation managers and proprietors |
Do not recommend for addition to the SOL |
|
1223 |
Restaurant and catering establishment managers and proprietors |
Do not recommend for addition to the SOL |
|
5434 |
Chefs |
Do not recommend for addition to the SOL |
|
5436 |
Catering and bar managers |
Do not recommend for addition to the SOL |
|
9273 |
Waiters and waitresses |
Request more evidence from the sector that Sommeliers should be regraded to RQF 3 |