EMRG medium-term projections for COVID-19 hospitalisations and deaths: 27 April 2022
Updated 6 January 2023

© Crown copyright 2023
This publication is licensed under the terms of the Open Government Licence v3.0 except where otherwise stated. To view this licence, visit nationalarchives.gov.uk/doc/open-government-licence/version/3 or write to the Information Policy Team, The National Archives, Kew, London TW9 4DU, or email: psi@nationalarchives.gov.uk.
Where we have identified any third party copyright information you will need to obtain permission from the copyright holders concerned.
This publication is available at https://www.gov.uk/government/publications/consensus-statements-on-covid-19/emrg-medium-term-projections-for-covid-19-hospitalisations-and-deaths-27-april-2022
The UK Health Security Agency (UKHSA) Epidemiology Modelling Review Group (EMRG) shares these medium-term projections (MTPs) for coronavirus (COVID-19) hospitalisations and deaths with thanks to SPI-M-O, who contribute model outputs for the combined projections (not all modelling groups produce projections for both hospitalisations and deaths).
Medium-term projections
-
These medium-term projections (MTPs) for COVID-19 hospitalisations ± and deaths ¥ are not forecasts or predictions. They represent a scenario in which the trajectory of the epidemic continues to follow the trends that were seen in data available to 25 April 2022.
-
Several modelling groups produce their own set of projections. These individual projections are then combined to form consensus MTPs. MTPs are provided for England, Wales and Scotland, for hospital admissions and deaths, as well as English regional hospital admissions and deaths. Due to an insufficient number of models being available, it has not been possible to produce projections for deaths for Northern Ireland and Wales this week.
-
The delay between infection, developing symptoms, the need for hospital care, and death means the MTPs cannot fully reflect the impact of policy and behavioural changes made in the 2 to 3 weeks prior to 25 April 2022. An assumed effect of school holidays has been included.
-
Modelling groups have used their expert judgement and evidence from the UK Health Security Agency and other published studies when making assumptions about vaccine effectiveness.
-
Projections do not include the potential effects of any novel variants. The delay between infection, developing symptoms, the need for hospital care, and death means it is unlikely that a novel variant will significantly alter the trajectories of hospitalisations and deaths in the timescales covered by these projections.
± These are new hospitalisations per day which incorporates both the number of individuals admitted with COVID-19, as well as inpatients newly diagnosed with COVID-19. Data definitions differ slightly across all 4 nations.
¥ These are the number of new deaths per day (by date of death) that are within 28 days of being identified as a COVID-19 case. Data definitions differ slightly across all 4 nations.
Acknowledgements
UKHSA thanks SPI-M-O and academic partners for providing model outputs for these projections. UKHSA also acknowledges the work developing combination estimates from Defence and Science Technology Laboratory and the support and collaboration of the SPI-M-O Secretariat and co-Chairs, as well as colleagues across the 4 nations.
Key
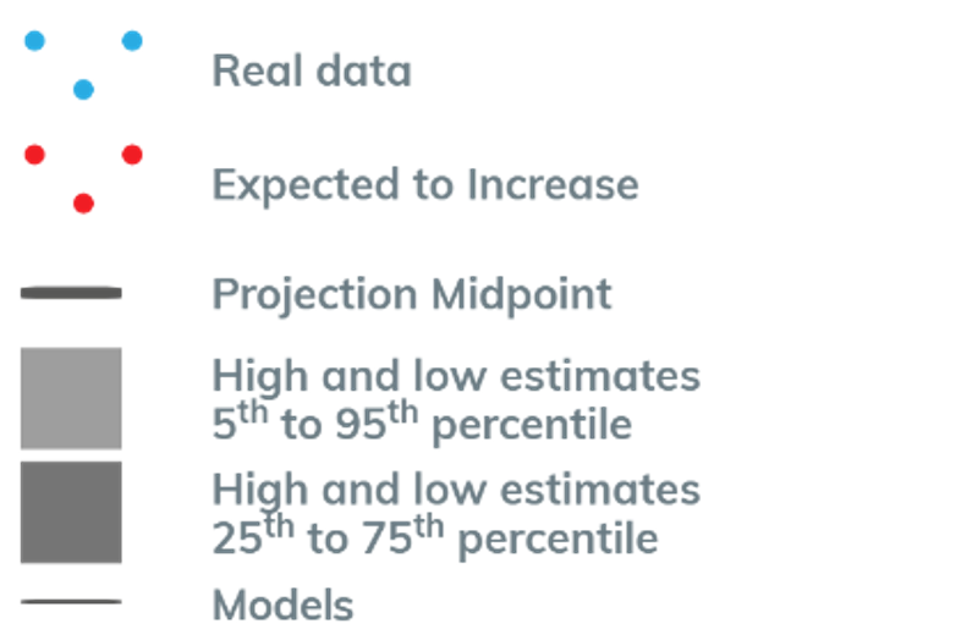
This key applies to all of the following fan charts.
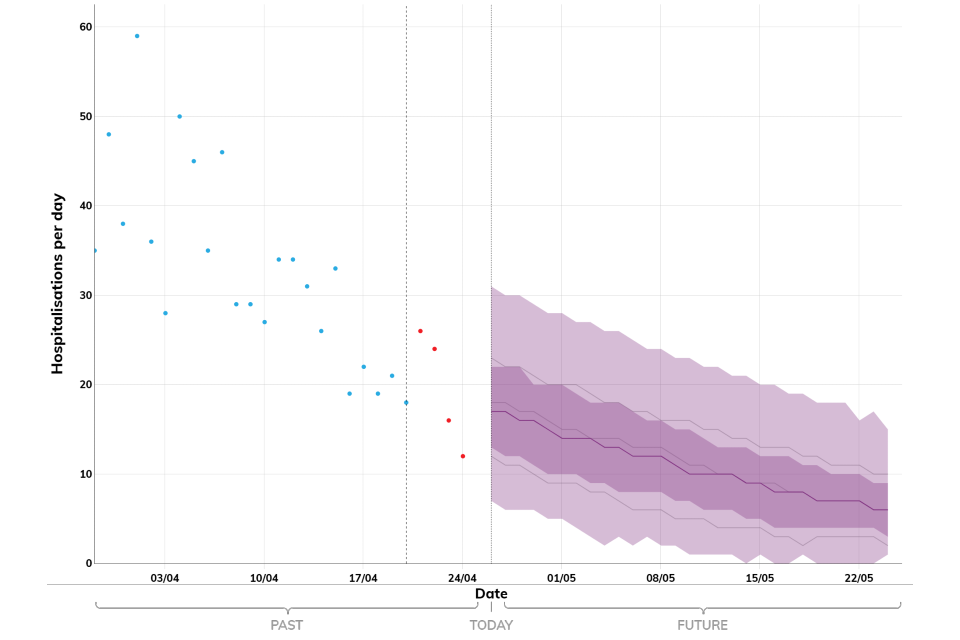
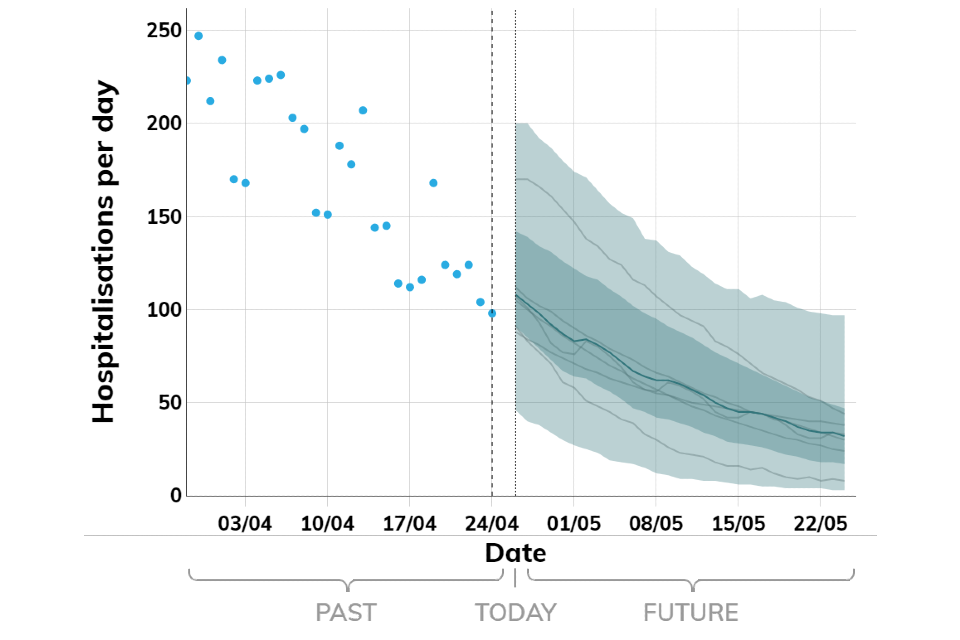
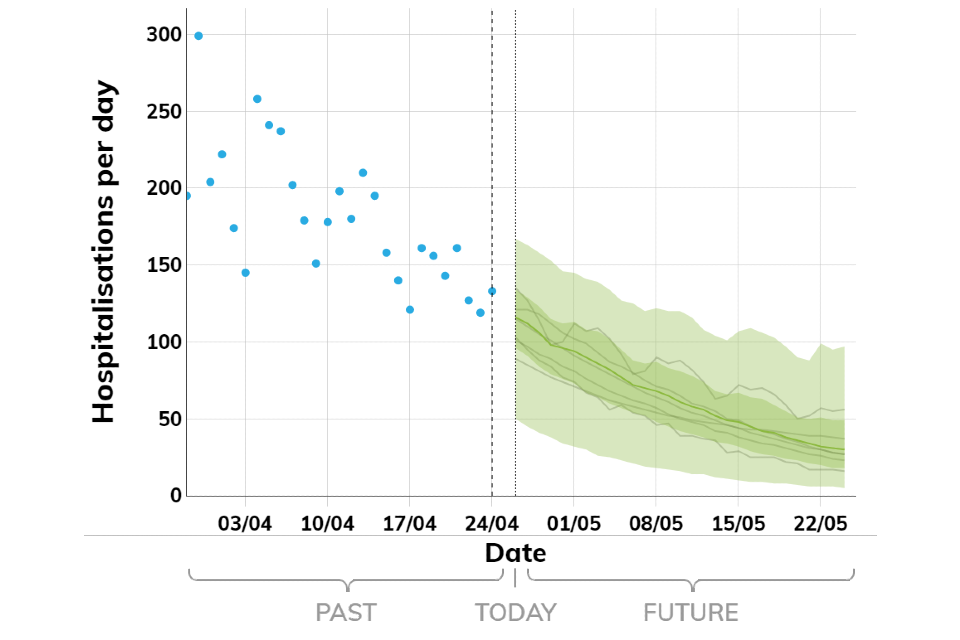
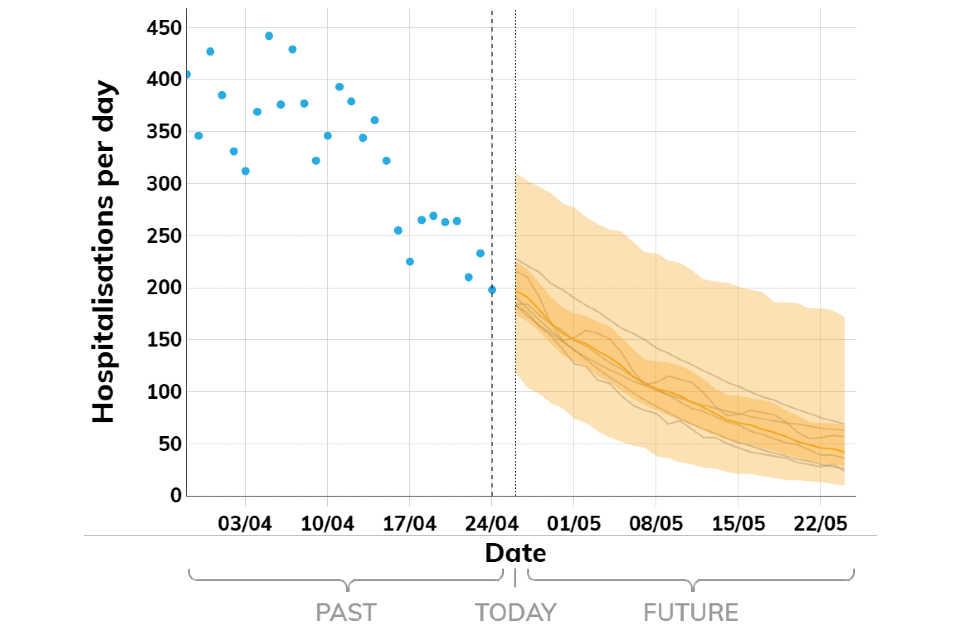
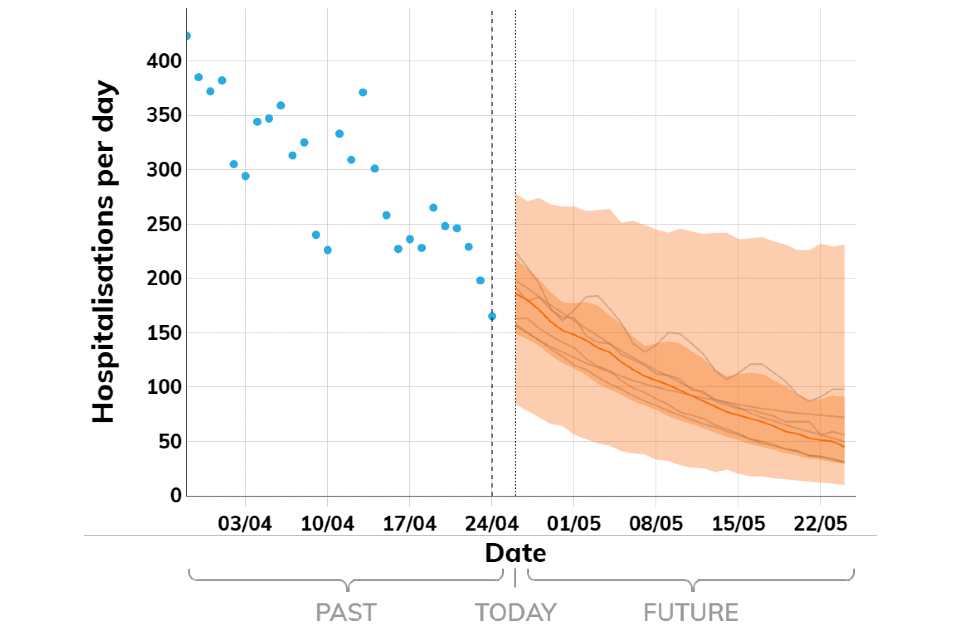
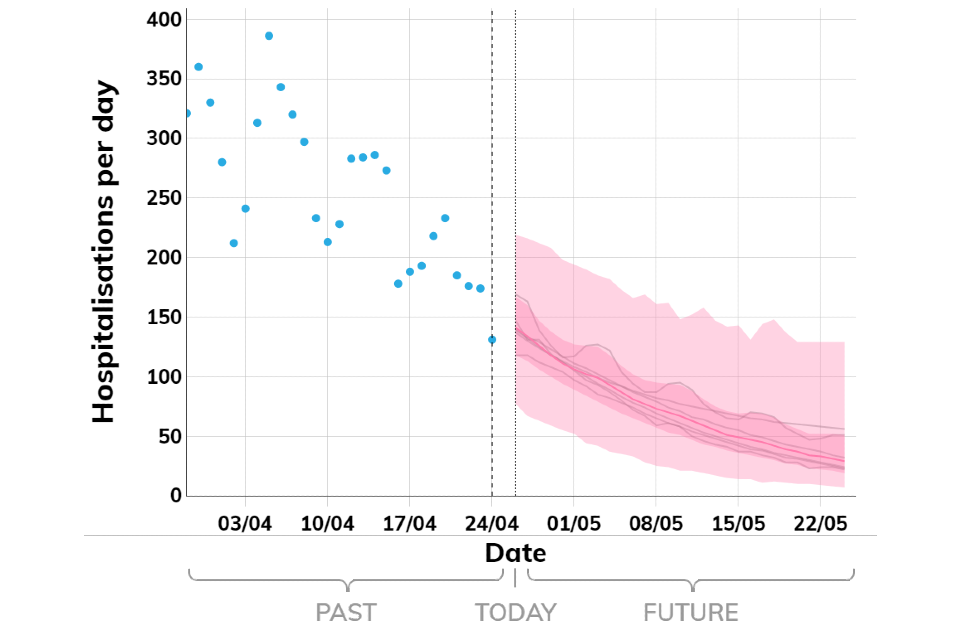
All fan charts show the 90% credible interval (lighter shading) and interquartile range (darker shading) of the combined projections based on current trends. Note axes scales differ for each of the figures.
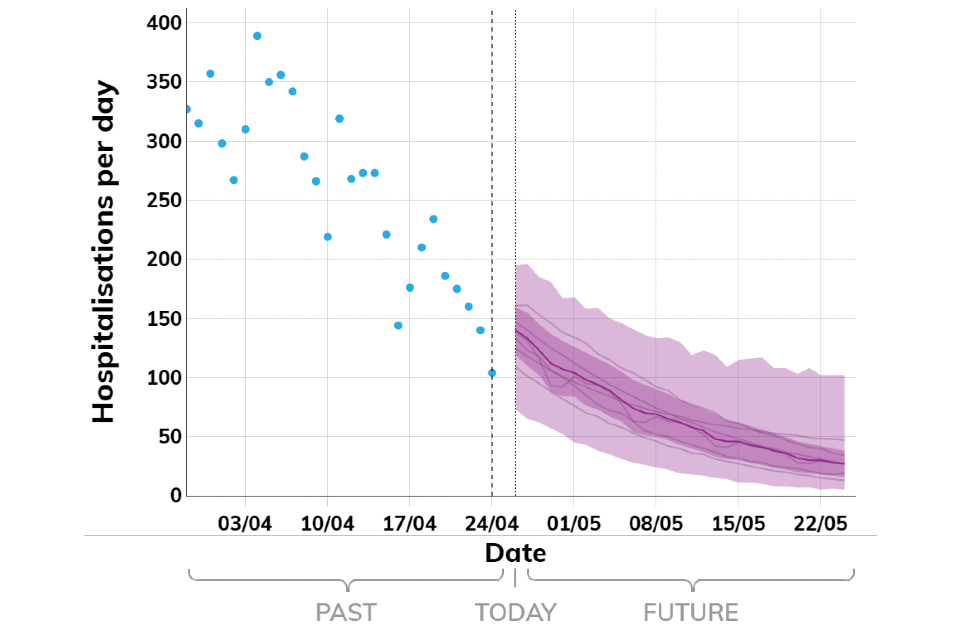
England
Figure 1a. Modelled projections of new hospital admissions per day in the UK nations based on data available on 25 April 2022
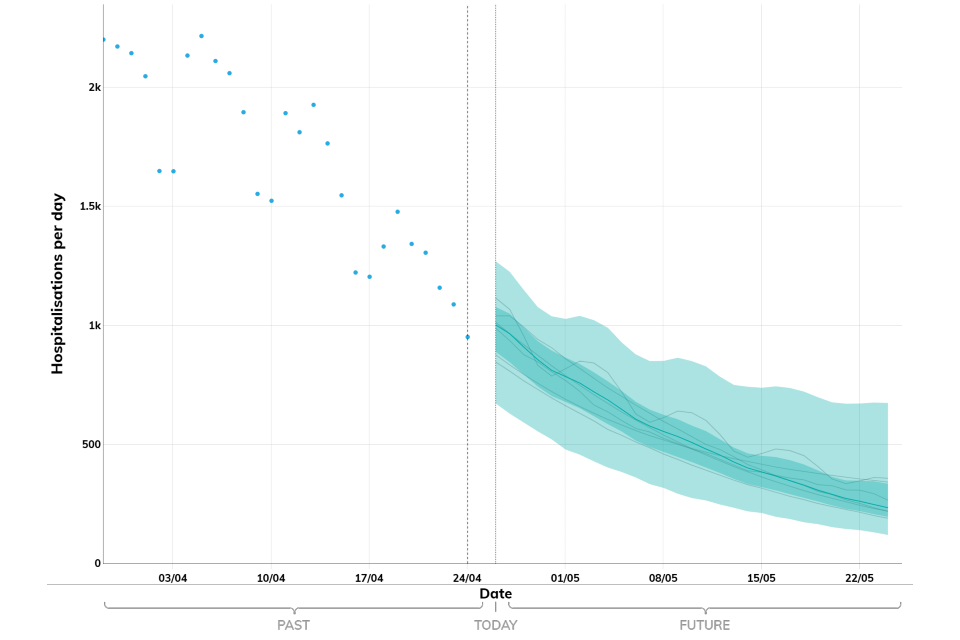
Number of patients admitted with confirmed COVID-19 and the number of inpatients diagnosed with COVID-19 in the past 24 hours. Taken from NHS England COVID-19 situation reports.
Wales
Figure 1b Modelled projections of new hospital admissions per day in the UK nations based on data available on 25 April 2022
Number of patients admitted with confirmed COVID-19 by admission date and inpatients diagnosed with COVID-19 by test authorisation date. Provided by Public Health Wales.
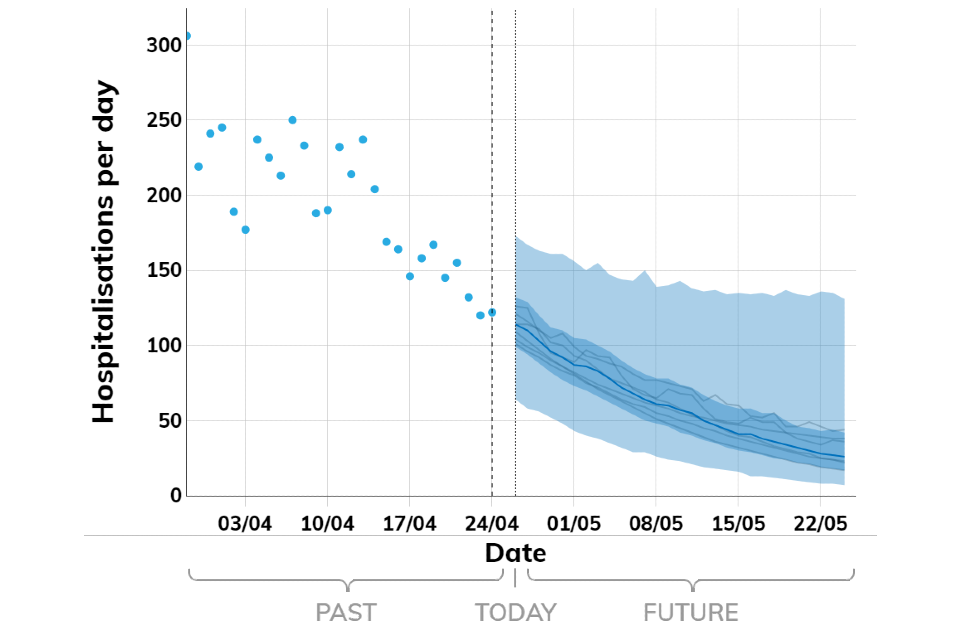
Scotland
Figure 1c. Modelled projections of new hospital admissions per day in the UK nations based on data available on 25 April 2022
Number of patients who tested positive for COVID-19 in the 14 days prior to admission, on the day of admission, or during their stay in hospital. Readmissions within 14 days of a positive test are excluded. Provided by Public Health Scotland.
Northern Ireland
Figure 1d. Modelled projections of new hospital admissions per day in the UK nations based on data available on 25 April 2022
Number of patients admitted with confirmed COVID-19 and inpatients diagnosed with COVID-19. Provided by Health and Social Care Northern Ireland.
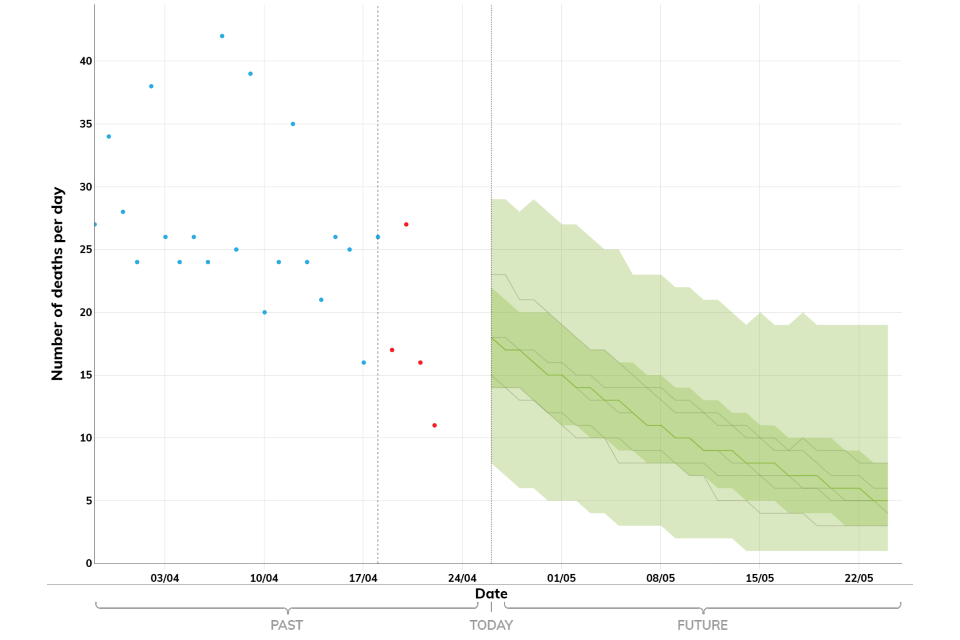
England
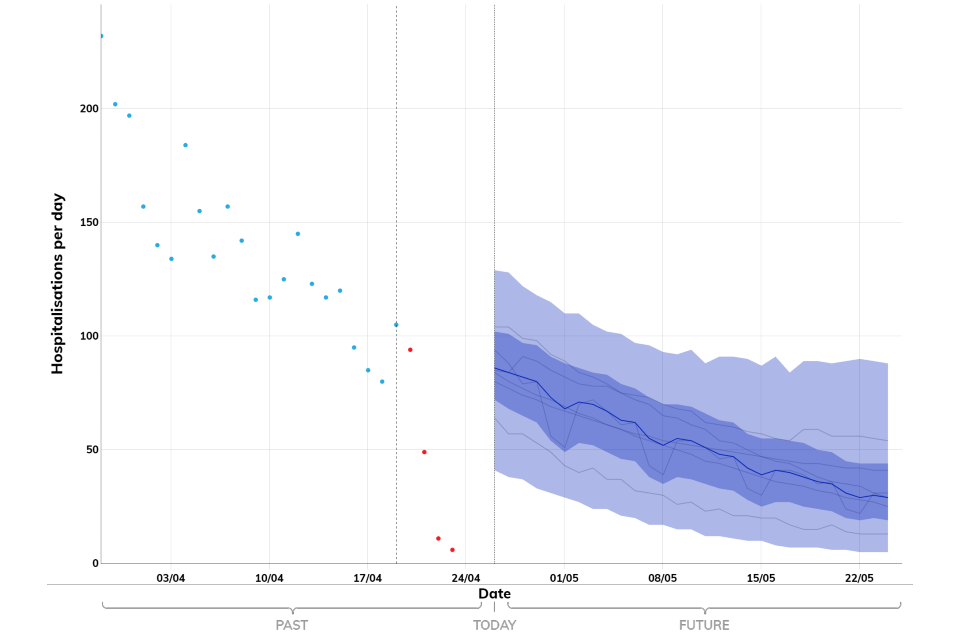
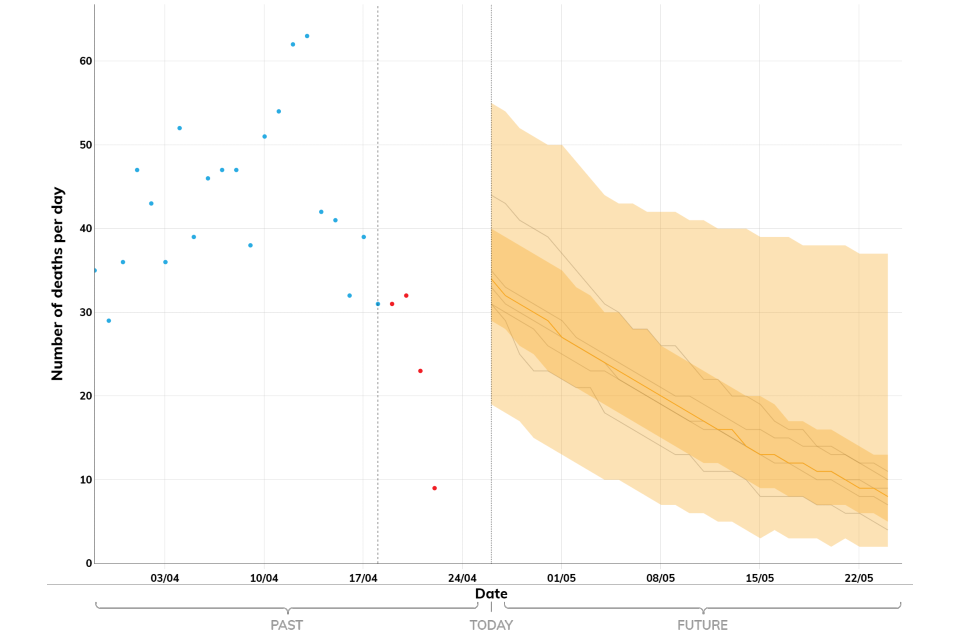
Figure 2a. Modelled projections of COVID-19 deaths per day (by date of death) in the UK nations based on data available on 25 April 2022
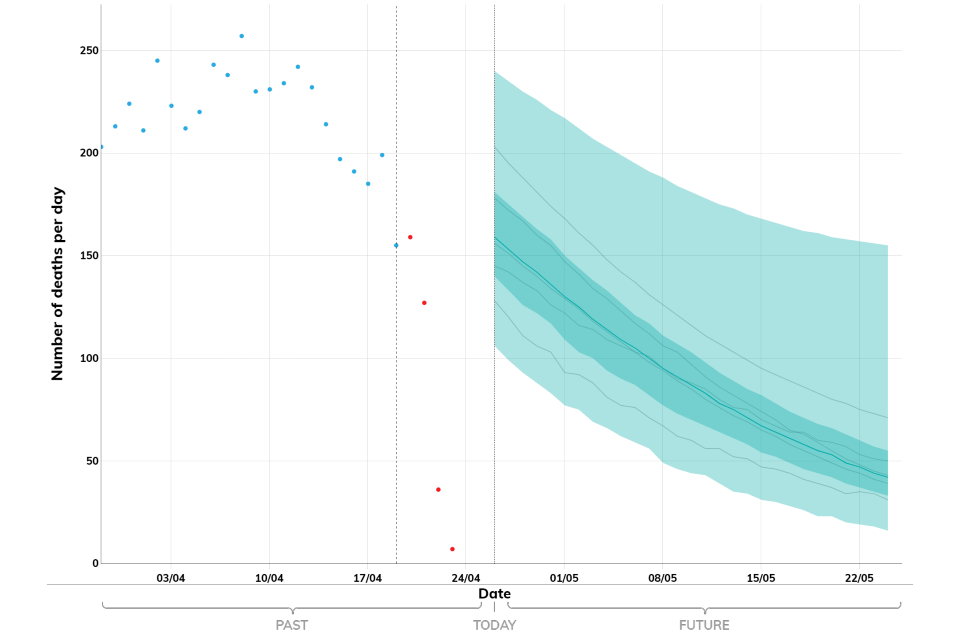
The number of COVID-19 deaths (by date of death) within 28 days of being identified as a COVID-19 case. Past data for England are taken from the UKHSA line list of deaths. This figure has minor adjustments for publication to prevent statistical disclosure.
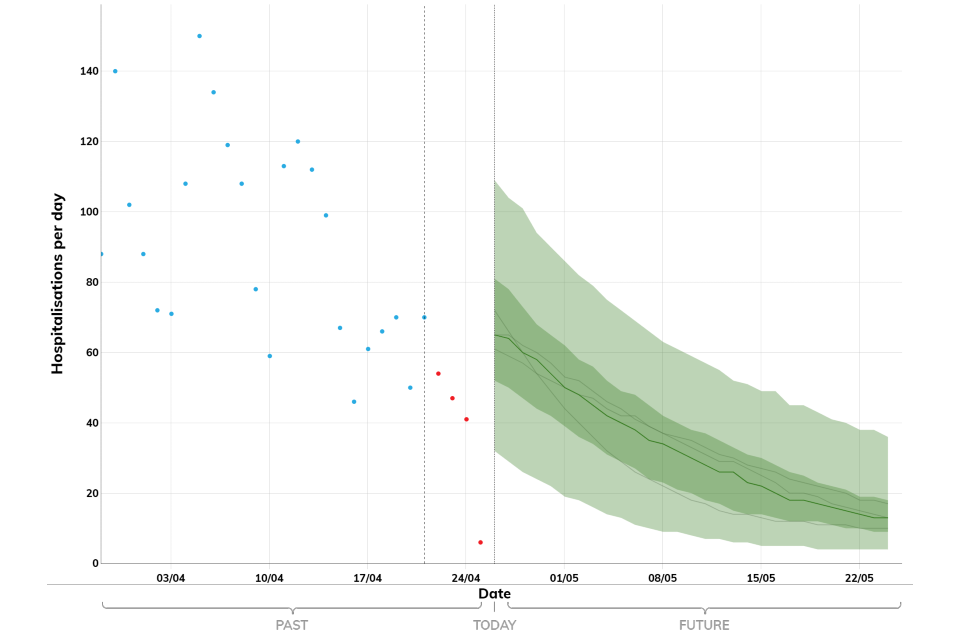
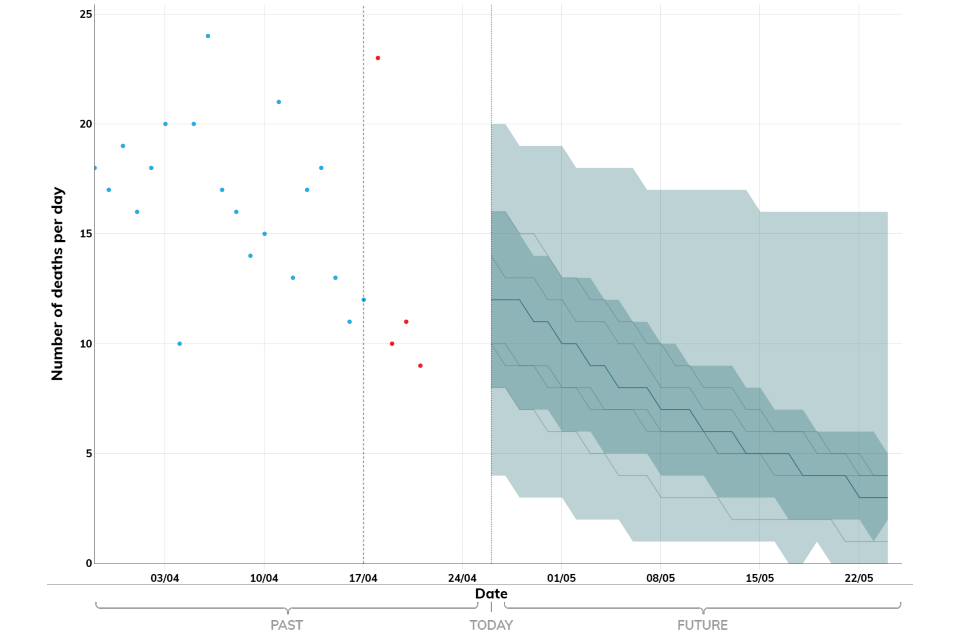
Scotland
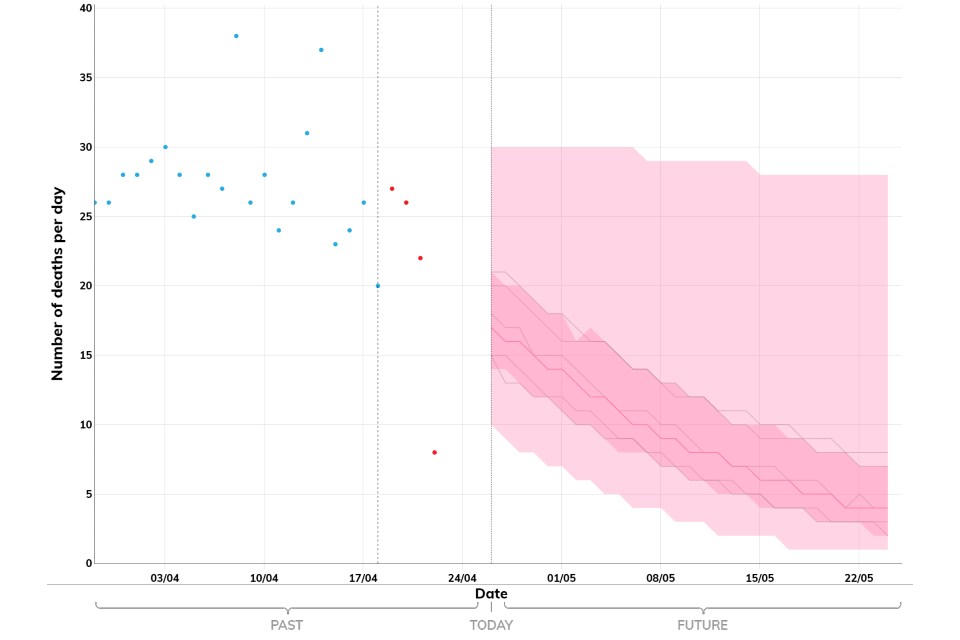
Figure 2b. Modelled projections of COVID-19 deaths per day (by date of death) in the UK nations based on data available on 25 April 2022
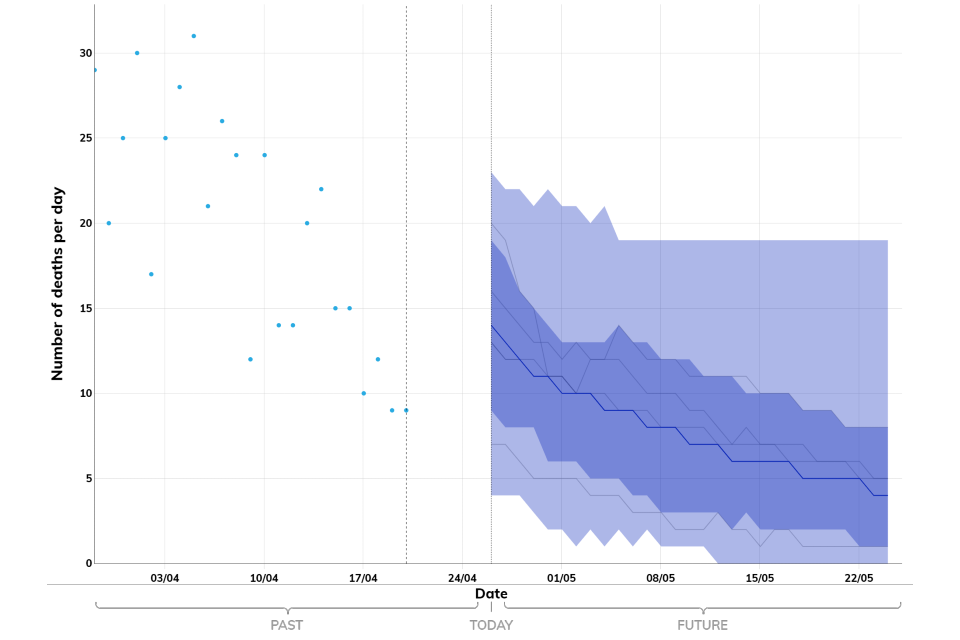
The number of COVID-19 deaths (by date of death) within 28 days of being identified as a COVID-19 case. Past data for Scotland, Wales, and Northern Ireland are taken from the COVID-19 in the UK dashboard on Gov.uk. This figure has minor adjustments for publication to prevent statistical disclosure.
London
Figure 3a. Modelled projections of new hospital admissions per day in the NHS England regions based on data available on 25 April 2022
Number of patients admitted with confirmed COVID-19 and the number of inpatients diagnosed with COVID-19 in the past 24 hours. Past data istaken from the NHS England COVID-19 situation reports.
East of England
Figure 3b. Modelled projections of new hospital admissions per day in the NHS England regions based on data available on 25 April 2022
Number of patients admitted with confirmed COVID-19 and the number of inpatients diagnosed with COVID-19 in the past 24 hours. Past data is taken from the NHS England COVID-19 situation reports.
Midlands
Figure 3c. Modelled projections of new hospital admissions per day in the NHS England regions based on data available on 25 April 2022
Number of patients admitted with confirmed COVID-19 and the number of inpatients diagnosed with COVID-19 in the past 24 hours. Past data is taken from the NHS England COVID-19 situation reports.
North East and Yorkshire
Figure 3d. Modelled projections of new hospital admissions per day in the NHS England regions based on data available on 25 April 2022
Number of patients admitted with confirmed COVID-19 and the number of inpatients diagnosed with COVID-19 in the past 24 hours. Past data is taken from the NHS England COVID-19 situation reports.
North West
Figure 3e. Modelled projections of new hospital admissions per day in the NHS England regions based on data available on 25 April 2022
Number of patients admitted with confirmed COVID-19 and the number of inpatients diagnosed with COVID-19 in the past 24 hours. Past data is taken from the NHS England COVID-19 situation reports.
South East
Figure 3f. Modelled projections of new hospital admissions per day in the NHS England regions based on data available on 25 April 2022
Number of patients admitted with confirmed COVID-19 and the number of inpatients diagnosed with COVID-19 in the past 24 hours. Past data is taken from the NHS England COVID-19 situation reports.
South West
Figure 3g. Modelled projections of new hospital admissions per day in the NHS England regions based on data available on 25 April 2022
Number of patients admitted with confirmed COVID-19 and the number of inpatients diagnosed with COVID-19 in the past 24 hours. Past data is taken from the NHS England COVID-19 situation reports.
London
Figure 4a. Modelled projections of COVID-19 deaths per day (by date of death) in the NHS England regions based on data available on 25 April 2022
The number of COVID-19 deaths (by date of death) within 28 days of being identified as a COVID-19 case. Past data is taken from the UKHSA line list of deaths.
East of England
Figure 4b. Modelled projections of COVID-19 deaths per day (by date of death) in the NHS England regions based on data available on 25 April 2022
The number of COVID-19 deaths (by date of death) within 28 days of being identified as a COVID-19 case. Past data is taken from the UKHSA line list of deaths. This figure has minor adjustments for publication to prevent statistical disclosure.
Midlands
Figure 4c. Modelled projections of COVID-19 deaths per day (by date of death) in the NHS England regions based on data available on 25 April 2022
The number of COVID-19 deaths (by date of death) within 28 days of being identified as a COVID-19 case. Past data is taken from the UKHSA line list of deaths.
North East and Yorkshire
Figure 4d. Modelled projections of COVID-19 deaths per day (by date of death) in the NHS England regions based on data available on 25 April 2022

The number of COVID-19 deaths (by date of death) within 28 days of being identified as a COVID-19 case. Past data is taken from the UKHSA line list of deaths. This figure has minor adjustments for publication to prevent statistical disclosure.
North West
Figure 4e. Modelled projections of COVID-19 deaths per day (by date of death) in the NHS England regions based on data available on 25 April 2022
The number of COVID-19 deaths (by date of death) within 28 days of being identified as a COVID-19 case. Past data is taken from the UKHSA line list of deaths. This figure has minor adjustments for publication to prevent statistical disclosure.
South East
Figure 4f. Modelled projections of COVID-19 deaths per day (by date of death) in the NHS England regions based on data available on 25 April 2022
The number of COVID-19 deaths (by date of death) within 28 days of being identified as a COVID-19 case. Past data is taken from the UKHSA line list of deaths.
South West
Figure 4g. Modelled projections of COVID-19 deaths per day (by date of death) in the NHS England regions based on data available on 25 April 2022
The number of COVID-19 deaths (by date of death) within 28 days of being identified as a COVID-19 case. Past data is taken from the UKHSA line list of deaths. This figure has minor adjustments for publication to prevent statistical disclosure.