Sharing of childcare and well-being outcomes: an empirical analysis
Published 15 January 2021

© Crown copyright 2021
This publication is licensed under the terms of the Open Government Licence v3.0 except where otherwise stated. To view this licence, visit nationalarchives.gov.uk/doc/open-government-licence/version/3 or write to the Information Policy Team, The National Archives, Kew, London TW9 4DU, or email: psi@nationalarchives.gov.uk.
Where we have identified any third party copyright information you will need to obtain permission from the copyright holders concerned.
This publication is available at https://www.gov.uk/government/publications/childcare-shared-care-and-well-being-outcomes-for-families/sharing-of-childcare-and-well-being-outcomes-an-empirical-analysis
Sharing of childcare and well-being outcomes: an empirical analysis
Second Report: Quantitative Analysis of the 2014/15 UK Time Use Study
Research report prepared by Pierre Walthery, Centre for Time Use Research, University College London and Heejung Chung, School of Social Policy, Sociology and Social Research, University of Kent
January 2021
1. Executive summary
This report summarises the main findings of the second part of our study, ‘How do within family caring arrangements impact parental and children’s outcomes’. This study consists of an empirical analysis of the relationship between the time spent on childcare by mothers and fathers in 2-parent households and a series of well-being outcomes, using the 2015 UK Time Use Survey. Here we distinguish between 3 dichotomies of the time spent caring for children based on the literature (see part 1 of this report, Chung, 2021) namely:
- care conducted as either a primary (main activity) or secondary activity (alongside another primary activity such as paid work)
- ‘solo’ care (conducted without the presence of the other parent) or ‘joint’ care (conducted with another parent present)
- routine care (such as feeding, cleaning, transporting) vs enriched care (such as playing, reading, studying with child)
The report first provides descriptive patterns of parental childcare. We then compared these according to maternal working-time (full vs part-time) as well as the age of the youngest child in the household. Key conclusions are as follows.
Women are more likely to provide care during any given day and spend more time providing care compared to men. A large proportion of fathers, on the other hand, did not report any care-giving. Even among those who do report care giving in their time-diary, men only spend about half as much time providing care compared to women. This gap is much larger when we take into account those who do not report providing any care.
This gender gap is especially noticeable during the weekday, for caring alone, and routine care. In other words, when men take part in care, it is mostly done jointly with their partners, during the weekend, or providing enrichment care.
This gender gap was especially prevalent among parents with pre-school aged children (under 5) where mothers were spending 2 to 3 times as much time providing care, especially on weekdays, and for routine and solo care. The gender gap is reduced significantly especially once children reach secondary school age. Fathers are less likely to be involved in routine childcare in households where mothers work part-time, but those who are involved in routine and solo childcare tend to do for longer periods of time than in households where both mothers work full-time.
Mothers’ employment patterns – full-time vs. part-time – did not matter much in the amount of care provided as a primary activity. However, part-time working mothers spent more time providing care as a secondary activity or being with children whilst doing other activities (co-presence).
Fathers’ employment patterns also did not change the amount of time they spent with children. However, full-time working fathers tend to spend more time providing enrichment care compared to their part-time counterparts, especially during the weekend, whilst part-time working fathers reported providing more routine care and spent more in the presence of children (co-presence).
We analyse the association between the absolute and relative share of care carried out by parents and 7 distinct well-being instruments, namely, anxiety, overall life satisfaction, work-life balance satisfaction, satisfaction with leisure, satisfaction with social life, relationship satisfaction, and finally overall daily enjoyment. The final instrument, enjoyment, represents an innovation over traditional well-being instruments as it is based on episode-level records reported in a 24h time diary instead of an overall evaluation by respondent of a given aspect of their life.
Whereas past studies have analysed typologies of childcare such as those described above in terms of the amount of time spent by parents, the contribution of the present work consists in examining how within-household sharing of care between mothers and fathers is associated with these well-being outcomes.
We found clear evidence that an increased share of childcare provided by fathers is significantly associated with a number of positive well-being outcomes, primarily for mothers, but also for fathers themselves. Some evidence was also found of a positive effect of the time spent with their parents on well-being of children aged 8 to 14.
Controlling for the socio-demographic characteristics of parents, the following was found.
Mothers in households where fathers take on a significant share of enriched care tend to report greater satisfaction with their work-life balance, and lower levels of anxiety than in those in which they are not involved. This is also true of households where a greater share of the childcare is jointly done by both parents. At the same time however, mothers tend to report feeling more anxious where fathers take on more than 40% of the routine childcare.
Fathers report greater satisfaction with their social life when they significantly engage in primary or routine care (more than 40% of the total amount of childcare carried out in the household); and a higher level of mean daily enjoyment when they significantly engage in enriched care. At the same time however, fathers who engage in significant amount of solo and secondary childcare relative to mothers, tend to be significantly less satisfied with their relationship.
For children aged 8-14: no significant association was found between their daily enjoyment and the time spent with either their mother, their father, or both parents jointly. There are indications that when mothers reported having a rushed day, the enjoyment levels of children were lower.
We also found that:
-
fathers working flexible hours or working at the weekend for any reason[footnote 1] are more likely to be involved in childcare than those who do not work in these ways
-
the association with fathers’ involvement in childcare and well-being outcomes are unlikely to have a linear relationship – rather, being involved in primary childcare (compared to not being involved) mattered in enhancing fathers’ overall enjoyment
-
both mothers and fathers equally enjoy higher levels of well-being when they care for children at the weekend rather than on a weekday
These results of the analysis reinforce the body of evidence showing that fathers’ involvement in childcare and a more equal division of care between mothers and fathers can potentially increase well-being outcomes for parents. The report also provides some reflections on the changes expected due to COVID-19 in terms of future parenting patterns.
2. Introduction
This report presents the main findings of the second part of the How do within-family caring arrangements impact parental and children’s outcomes study which consisted of an empirical analysis of the relationship between the time spent on childcare by mothers and fathers in 2-parent households and parental well-being outcomes, using the 2015 UK Time Use Survey.
2.1 Background
As the literature review on shared care and well-being has shown (Chung, 2021), there is an abundance of research on how fathers’ caring roles and mothers’ employment (and subsequent reduced involvement in childcare) influence outcomes for children as well as parents. One missing piece of the puzzle is how the two interact with each other. Relatively little is known about both the division of time spent caring for children within households and its relationship to child and parental well-being. The majority of studies examined, especially those focusing on child outcomes, examined maternal and paternal involvement separately.
A few studies have looked at how the involvement of fathers in certain activities influence child outcomes, taking into account the amount of childcare carried out by mothers (for example, Baxter and Smart, 2010). Others have focused on the absolute number of hours fathers spend with children but with little differentiation between the type of childcare – for example, distinguishing between enrichment and routine activities (for example, Kroll and others, 2016). Few have explored whether the proportion of time fathers spend relative to mothers is associated with variations in outcomes for children. Some have analysed the influence of the division of childcare and housework on parental relationship satisfaction and breakdown (for example, Schober, 2012). However, most of these rely on the self-assessment, mostly of mothers, in not only the amount of time they themselves engage in childcare but also their partners’ engagement – in many cases, with conflicting perceptions between the two (for example, Milkie and others, 2002).
This project aims at filling some of these gaps by conducting a multivariate analysis on the 2015 UK Time Use Survey (TUS). Looking at couples with at least one child under the age of 15, we aim to explore how the length and quality of time spent by parents with their children, and most importantly its division between mothers and fathers, is associated with well-being outcomes for children and parents themselves.
In order to examine how sharing childcare influences well-being outcomes of children and parents, we need to be able to precisely measure the share of care provided by each parent. Some surveys ask respondents about their perception of the share of care they take on – for example, Millennial Cohort Survey. However, previous studies have established that there is a mismatch within couples about what ’sharing childcare’ means, as fathers tend to think their share of childcare matches that of their partner, but mothers tend to disagree (for example, Milkie and others, 2002; Craig, 2006). Again the Time Use Survey may be one of the only existing quantitative data sources that allows us to get a more accurate picture of such complex realities.
We were able to operationalise different types of time spent caring for children – namely, routine vs non-routine/enrichment care, solo vs. care with the other parent/joint care, and care as main or primary activity vs. secondary care, ’contaminated’ by simultaneously conducting other activities such as paid-work or other housework. The majority of studies about the care shared between mothers and fathers have focused on factors that explain how childcare is shared between the 2 (Craig and Powell, 2012; Craig and Mullan, 2011; Raley and others, 2012; Wight and others, 2008).
Some studies have shown that an unequal division of labour among heterosexual couples may lead to the dissatisfaction and decline in well-being of individuals (Hochschild and Machung, 1989; Blair-Loy, 2009; Williams, 1999; Young, 2018), yet they are largely based on qualitative data. Few large scale quantitative studies have examined how the share of care is related to outcomes such as children’s and parents’ well-being. The few studies which do this, either focused on families in the United States (Milkie and others, 2002 ; Carlson and others, 2016), or on relationship satisfaction and breakdown (Schober, 2012; Norman and others, 2018). Thus, more large scale quantitative evidence is needed on how the share of care-giving among heterosexual couples relate to the well-being outcomes of children and parents, including outcomes such as stress, satisfaction towards life, work-life balance, social life, leisure in addition to relationship.
Based on this, our analysis examines the following questions:
-
How is childcare currently being shared among mothers and fathers, according to the type of care provided?
-
How does the total amount of time spent by fathers and mothers with their children, as well as its division between parents, impact children’s and parental well-being outcomes?
As part of an extension to the original research programme, we also examined some sub questions relating to our main question, namely:
- What is the impact of parental working patterns on fathers’ share of primary and routine childcare?
-
What are the differences in parental well-being outcomes for households where fathers take part in childcare as opposed to those who do not?
- Is the association between fathers’ involvement in care and parental and child well-being affected by paternal childcare occurring at the weekend or instead during weekdays?
One point to note here is that our data is from 2015, prior to the COVID-19 pandemic and the multiple lockdown measures that have occurred. Many studies have shown that the COVID-19 pandemic and the different measures that were in place to reduce the risk of transmissions of the disease – such as lockdown and mass scale home working – has had a positive impact on the division of housework and childcare done by parents, with fathers possibly contributing more than before (Chung, Birkett and others, 2020; Craig and Churchill, 2020; Carlson and others, 2020; Yerkes and others, 2020). We will explore the type of changes we expect to have occurred due to the COVID-19 pandemic in terms of parental involvement in childcare and in work patterns in greater detail in our final section.
3. Data and methods
3.1 Data
The data source used in the project is the 2015 Time Use Survey (TUS), which provides the most recent and up to date time diary data for the UK. The TUS is a 2 stage stratified random sample household survey representative of the UK population. Fieldwork was conducted between May 2014 and October 2015 using face-to-face interviews. The TUS provides a wealth of information about the daily activities of household members (parents and children aged 8 years and over) in relation to work and family life. Data is collected both via time diaries and an individual questionnaire. In time diaries, respondents keep a record of their activities over 24 hours at 10-minute intervals on one weekday (that is, one day between Monday to Friday) and one day at the weekend. Diary days were randomly allocated to each household and were identical for all household members. Separate diaries were provided to children and adults. All diaries were self-completed.
Time diaries are the most robust, and perhaps the only type of social survey which allow researchers to measure the actual amount of time parents spend with their children. Other stylised instruments such as through questionnaires, that is, when parents are asked to provide an overall time estimate over a period of time such as a week or month- tend to be characterised by definition issues and measurement error: respondents are notably imprecise at estimating ‘on average’ the amount of time they spend on different activities (Kan and Pudney, 2008).
For example, questions asked about ’on average, how many hours do you spend on childcare in the past 7 days’ may not invite accurate answers due to the different definitions individuals may have of childcare (in relation to other activities), in addition to the inherent difficulty of recalling the precise amount of time spent caring. Time use data also enabled us to directly investigate how the proportion of childcare carried out by fathers within households is associated with child and parental well-being outcomes, which represents another innovation implemented in this project.
Finally, the way in which care is recorded in the time use data allows us to distinguish between the different types of care provided by each parent, which is difficult to apply in other survey techniques.
In the time diaries, information is also collected about the location in which each activity took place, the presence of other people, enjoyment, and whether alongside the main, primary activity, other, secondary, activities also took place. A distinction needs to be made between activities, what respondents record they are doing at a given time of the day, from an episode, which is the continuous period of time during which an activity or its context does not change. Overall sample size is 11,421 individuals in 4,733 households. Of these, 8,210 individuals in 3,606 households provided complete time diary information.
We constructed a dataset where caring data as well as the individual characteristics of mothers, fathers and children within the same household were matched together. We cannot say our descriptive analyses are representative of the national general population due to the absence of household-level weights in the 2015 TUS, as well as the small sample size. However, this dataset enables precise analysis of the sharing of care between parents, as well as providing the point of view of children aged 8 and above who were also present in the household, which is very rare in quantitative data sets.
3.2 Sample
For the purpose of this study, the population of reference was defined as UK households made of 2 cohabitating heterosexual parents aged 16 and over with at least one child aged between 0 and 14. Complex households, including those made of several families, or multigenerational households were not taken into account. Respectively 1,178, 1,147 and 828 days of mothers, fathers and children aged under 15 were available in such households where complete records were available. Actual sample size differed from these numbers according to item-non response of the outcomes variables. For instance, 509, 545 and 403 records of mean daily enjoyment were available for mothers, fathers and children. This should be considered as the minimum sample size for descriptive analysis among parents, as more observations are available about alternative outcomes, such as evaluative well-being.
3.3 Weighting
The 2014/15 UK TUS survey is representative of the UK population aged 8 and above. However, due to non-response, estimates need to be weighted in order to properly reflect nationally representative trends. 2 sets are available: individual-level weights, and diary weights (day level ones). The main difference between the 2 is that the latter equalises the probability of selection of the days across the week. Results relying on the main UK TUS dataset use the individual-level weights. However, results based on the matched household dataset cannot be weighted due to the fact that the data does not include household weights. Therefore, descriptive results based on this dataset cannot be considered nationally representative. On the other hand, multivariate (regression) results are more likely to be close to national trends as some of the control variables used, such as qualifications, record factors traditionally associated with non-response.
3.4 Outcomes
The 2 main outcomes considered in this study were evaluative well-being, which was recorded through several overall and facet-specific instruments, and experienced well-being/enjoyment.
The former was only administered to adult respondents in the UK TUS 2015, whereas the latter was also recorded for children aged 8 and above.
Enjoyment (parents and children)
The 2015 UK TUS is one of very few surveys where household members, including children aged 8 and above, were systematically asked about their enjoyment derived from each activity reported in the time diary and is the closest measurement available to experienced/emotional well-being (Kahneman and others 2005). Enjoyment was measured on a scale ranging from 1 to 7. Completion rate was about 75%, due to the fact that the question was not asked during the first 2 months of the survey. Overall mean daily enjoyment was computed and weighted for activity duration. It was used to examine how different parenting activities, and with whom it is done (mother, father, or both), are associated with children’s daily enjoyment levels.
Evaluative well-being and life satisfaction (parents)
We used a number of evaluative well-being outcomes for parents, as they were only recorded among respondents aged 16 years and over.
Overall life satisfaction
A single standardised overall life satisfaction was constructed from the 2 instruments available in the data.[footnote 2]
The following facets well-being variables were also used. They were recorded on 7 item scales ranging from ’Completely dissatisfied’ to ’Completely satisfied’.
Work-life balance satisfaction
’How dissatisfied or satisfied are you with your work-life/work-family balance?’;
Satisfaction with social life
’How dissatisfied or satisfied are you with your social life;
Satisfaction with leisure
’How dissatisfied or satisfied are you with the amount of leisure time?’;
Relationship satisfaction
’How dissatisfied or satisfied are you with your marriage or partnership?’
Anxiety
’How anxious did you feel yesterday?’
3.5 Independent variables
Time spent caring for children
The main independent variable in this study is the time spent caring by parents. 2 different approaches were used.
Firstly, we examined the amount of time that mothers and fathers individually spent caring for children as a whole, as well as broken down by type. This is either computed as the daily number of minutes as well as the proportion of caring time relative to other non-resting activities (such as paid work or socialising). The figures obtained this way can be considered nationally representative of the population of cohabitating heterosexual parents in households with at least one dependent child under 15.
As discussed in depth the literature review (first part of this study - Chung, 2021) and in the previous section, in order to differentiate between the types of care, we adopted 3 distinctions: the distinction now commonly accepted between routine vs non-routine/enrichment care (Craig and Mullan 2011); as well as how it is provided – that is, solo vs with the other parents, and finally the primacy of the care – namely, whether it is recorded as the primary activity, or if it is done in addition to other activities, such as housework, paid work or leisure, and finally whether if children are simply present while the parent carries out another task, without specifying that care in being carried out. Table 1 provides a more detailed description of the different types of care used in this study.
Table 1 Categories of care
| Category | Description | |
|---|---|---|
| Type of care | Routine care | Feeding, bathing, dressing, putting children to sleep, carrying, holding, cuddling, hugging, soothing, transportation to school, visits, sports training, music and ballet lessons, time spent waiting and meeting trains or buses, and handing them over to substitute caregivers |
| Enrichment/ non routine | Talking, listening, teaching, helping children learn, reading, telling stories, and playing games etc. | |
| Involvement of the other parent | Solo care | When care is provided without the other parent involved – divided into father care and mother care |
| Joint care | When care is provided with the other parent also present | |
| Primacy of care | Primary | Care provided without other recorded activities, or care is the primary activity carried out by parent |
| Secondary | Care provided as secondary activity while doing other activities | |
| Co-presence | Child(ren) present while parent is engaging on an activity unrelated to childcare |
3.6 Multivariate analysis
We conducted several multivariate analyses of the relationship between the sharing of childcare done by mothers and fathers and their own well-being as well as their children’s well-being. In order to do so, we worked with a subset of the UK TUS in which individual characteristics of mothers, fathers and children were matched together. This allowed for within household analysis of childcare practices. Whilst non nationally representative when conducting descriptive analysis due to the absence of household-level weights in the 2015 UK TUS, this dataset enables precise analysis of the sharing of care between parents, as well as, the perspective of children aged 8 and above who were also present in the household. This provides a rich understanding of the quality and perception of care, yet the relatively small sample size of the analysis limits the precision of related findings.
Using these data and for each of the 7 types of childcare shown in Table 1, we constructed ratios of the time reported by fathers on childcare in the household on diary day divided by the total childcare time reported by both parents on the same day – either as a primary or secondary activity. This represents a precise operationalisation of childcare in households, and improves on those which only consider childcare as a primary activity. The ratios were subsequently re-coded into 3 category variables, as follows:
- fathers did not carry out any childcare on diary day
- fathers took on between 1% and 40% of the total caring time in the household on diary day
- fathers carried out between 41% and 100% of the total time caring on diary day
For each one of the 7 well-being outcomes described above, 6 models were fitted (retaining the most relevant share of paternal care: primary, secondary, solo, joint, routine and enriched), for fathers and mothers respectively. These amounted to a total of 84 OLS regression models. In the case of joint care, the substantive meaning of this variable is that it represents the amount of care done by both parents jointly as a proportion of the total care carried out in the household.
The mean daily enjoyment of children aged 8 to 14 was also modelled using a slightly different approach, in part due to the smaller number of observations available. For these models the main explanatory variables were the time children spent with each parent, separately with one or the other parent and jointly with both parents together. The effect of the time spent with each parent was tested one by one, then using an interaction term we test to see how the 2 moderated one another. We also used a dichotomic indicator of time pressure which was recorded in the time diary: Is this a rushed day?
Control variables
Additional variables were used in the multivariate analysis to control for respondents socio-demographic characteristics which have been shown to influence the time spent on care (Craig and Mullan, 2011), as well as well-being outcomes of individuals (Milkie and others, 2002; Schober, 2012; Kroll and others, 2016):
- age of each parent
- age of the youngest child in the household: 0-4 (reference category), 5-10, 11-14
- whether childcare for one or more child out was outsourced to non-household members
- whether mother were employed full-time, part-time or not in paid work
-
maternal highest qualification
- combined variable recording whether fathers worked under a flexible working-time schedule and the skills levels of their main occupation:[footnote 3] flexible hours with or without specified core hours, annualised hours, unsocial hours, shift work – the skills level of their current occupation (according to the definition of the Office for National Statistics), and fathers not currently in paid work are grouped in a distinct category
In order to avoid bias due to the correlation between this variable and paternal education, the latter was not included. For similar reasons, the same indicator could not be used for mothers as the household-level working-time arrangements described above already includes a category for those not in paid work. In light of the recent discussion in UK policy in reforming flexible working to enable better share of care tasks, and a better work-life balance, this analysis also examines how flexible working arrangements may encourage parents to equally share care between them (Chung and van der Lippe, 2018; Chung, 2020).
For the children models, control variables included:
- age of the child
- sex of the child
- mother’s education
- whether mother were employed full-time, part-time or not in paid work
- fathers’ occupational skills level in his main job together with whether he worked flexible hours
- an interaction term between gender of the child and the time spent with each parent
- an interaction term between the time spent with each parent and whether diary day was reported being a rushed day by either parent
3.7 Extension to the original analysis
An extension of the above analysis was decided, which involved examining the 3 following additional questions:
-
What is the impact of parental working patterns on fathers’ involvement in primary and routine childcare
-
To what extent is fathers’ involvement in childcare associated with parental and children well-being, when we only look at dual-earning couples?
-
To what extent are these well-being outcomes affected by childcare taking place at the weekend or instead during weekdays?
We used a subpopulation of the matched household dataset drawn from the 2015 UK Time Use Survey described above: as we wanted to examine the impact of the involvement in childcare by fathers in the context of dual earners families, the analyses were conducted in households in which both adults were in employment. As a result, the sample size was limited: 561 observations with a valid record of time spent by parents on childcare. The number of households with non-missing well-being records was unfortunately smaller and varies depending on the outcome variable examined (see below).
Question 1 was operationalised by analysing fathers’ share of total time spent on childcare in households by both parents, by type of care. For greater robustness, both the mean and the median were computed, as given the small sample size, large values can disproportionately affect the mean.
Question 2 was examined by producing 4 sets of 8 linear regression models for each mothers and fathers: one model was run for each one of the 8 well-being outcomes of interest already discussed above.
For each outcome, we first considered whether fathers engaging in any primary, or alternatively, routine childcare, impacted on the outcome (Stage 1). Stage 2 consisted in modelling the impact of the share of childcare taken on by fathers on the same outcomes, leaving out households in which fathers did not conduct any childcare.
For these analyses, we controlled for household-level working-time configurations instead of just mothers’ working time, namely:
- whether the household was of the dual-earner type (that is, both parents working full-time)
- secondary earner (father working-full-time, mother part-time)
- any other type (including female main earner)
4. Results
The data analysis is presented in 3 stages:
We first provide descriptive statistics about the time spent on childcare in UK households distinguishing between that of mothers and fathers.
We then present the outcomes examining how the sharing of childcare between parents – broken down by the types of care set out above – is associated with 7 well-being outcomes (for mothers, fathers and children aged 8 and over) through a regression analysis.
Finally, in households where both parents are employed and we further examine:
- how different working-time patterns are associated with the share of care fathers carry out
- how paid working time and caring time are related to well-being outcomes for parents
4.1 Probability and duration of childcare
Main findings
Women are more likely to provide childcare and spend more time than men on any given day. A large proportion of fathers, on the other hand, did not report any care-giving. Even among those who do report care giving, men only spend about half as much time providing care. This gap is much larger when we take into account those who do not provide any care.
This gender gap is especially noticeable during the weekday, and for caring alone and routine care. In other words, when men take part in care, it is usually done jointly with their partners, during the weekend, providing enrichment care.
This gender gap was especially evident among parents with pre-school children (under the age of 5) where mothers were spending 2 to 3 times as much time providing care, especially during the weekday, and for routine and solo care. The gender gap reduces as children grow older, especially once children reach secondary school age.
Mothers’ employment patterns – full time vs. part-time, was not associated with the amount of time mothers spent in providing care as a primary activity. However, part-time working mothers spent more time providing care as a secondary activity or being with children whilst doing other activities (co-presence).
Fathers’ employment patterns also did not change the amount of time they spent with children. However, full-time working fathers tend to spend more time providing enrichment care compared to their part-time counterparts, especially at the weekend, whilst part-time working fathers reporting providing more routine care and spent more in the presence of children (co-presence).
Table 2 provides an estimate of the percentage of parents who engaged in childcare on weekdays and at the weekend. Table 3 shows the average amount of time they did so.
Table 2: Proportion of mothers and fathers reporting childcare on diary day
| Weekdays: Mothers | Weekdays: Fathers | Weekend: Mothers | Weekend: Fathers | |
|---|---|---|---|---|
| Primary care | 70.8 | 52.4 | 65.9 | 56.2 |
| Secondary care | 42.5 | 19.6 | 38.8 | 28.2 |
| Copresence | 75.5 | 70.8 | 76.7 | 76.7 |
| Primary and secondary | 72.8 | 55.5 | 69.7 | 60.6 |
| Primary, secondary and copresence | 75.7 | 73.2 | 76.7 | 77.2 |
| Caring alone | 61.9 | 30.6 | 51.3 | 36.0 |
| Joint caring | 54.8 | 44.6 | 59.3 | 52.1 |
| Routine care | 70.8 | 48.0 | 68.1 | 51.7 |
| Enrichment care | 57.3 | 37.1 | 52.3 | 45.3 |
Note: Proportion of parents who reported at least ten minutes of childcare on diary day. Denominator: parents aged 16 and above in UK households with 2 cohabitating heterosexual adults and at least one child under 15. Data: UK TUS 2015, weighted for non-response.
We can see in Table 2 that mothers were more likely than fathers to be caring for children at any point during the day, especially on weekdays. The gap between mothers and fathers in the probability of engaging in primary childcare is 18.4 percentage points during weekdays (70.8% vs 52.4%), against 9.7 at the weekend. This remains true across all types of childcare. The largest gap is observed for caring alone (31.3 percentage points during the week, 15.3 at the weekend) followed by routine care (22.8 percentage points during the week, 16.4 at the weekend). Even if the gaps are smaller, mothers were also more likely than fathers to engage in enrichment care, even during the weekend (7.0 percentage point gap).
If we broaden the definition of caring to include not only primary and secondary caring, but also simple co-presence, the difference between mothers and fathers almost disappears, both during the week and at the weekend. This tells us that although both mothers and fathers may be equally likely to be spending time with children around, it is usually the mothers, especially on weekdays, that are engaging with and actively caring for children.
Throughout this section, results are presented as the amount of time mothers and fathers spent on childcare. These were computed both for the total population (including those who did not report any care giving on a diary day) and for the ‘carers’ population (only including those who reported providing at least 10 minutes of childcare during a diary day). Whereas the latter is closer to the typical amount of time parent spent on caring, the former also provides information about parents (mostly fathers) who did not engage in childcare. We focus mostly on reporting the latter in the main text, but when useful we also touch upon the former.
Table 3 Time spent caring by mothers and fathers (2014-15)
| Weekdays: Mothers – Carers[1] | Weekdays: Mothers – All[2] | Weekdays: Fathers – Carers | Weekdays: Fathers – All | Weekends: Mothers – Carers | Weekends: Mothers – All | Weekends: Fathers – Carers | Weekends: Fathers – All | |
|---|---|---|---|---|---|---|---|---|
| Primary care | 132 | 93 | 69 | 36 | 133 | 87 | 108 | 61 |
| Secondary care | 68 | 29 | 44 | 9 | 77 | 30 | 65 | 18 |
| Copresence | 493 | 372 | 355 | 251 | 582 | 446 | 509 | 390 |
| Primary and secondary | 168 | 122 | 81 | 45 | 168 | 117 | 130 | 79 |
| Primary, secondary and copresence | 652 | 494 | 404 | 296 | 734 | 563 | 608 | 469 |
| Caring alone | 146 | 90 | 67 | 21 | 109 | 56 | 92 | 33 |
| Joint caring | 77 | 42 | 62 | 27 | 118 | 70 | 97 | 51 |
| Routine care | 122 | 86 | 59 | 29 | 120 | 82 | 79 | 41 |
| Enrichment care | 90 | 51 | 57 | 21 | 92 | 48 | 99 | 45 |
Note: Mean daily minutes by type of caring. Denominator: [1] all respondents who reported caring on the day;[2] all respondents (including those who did not report caring). Population: Individuals in UK households with 2 cohabitating heterosexual parents and at least one child under 15. Data: UK TUS 2015, weighted for non-response
Figure 1: Total time spent caring by type of care, weekend and weekday
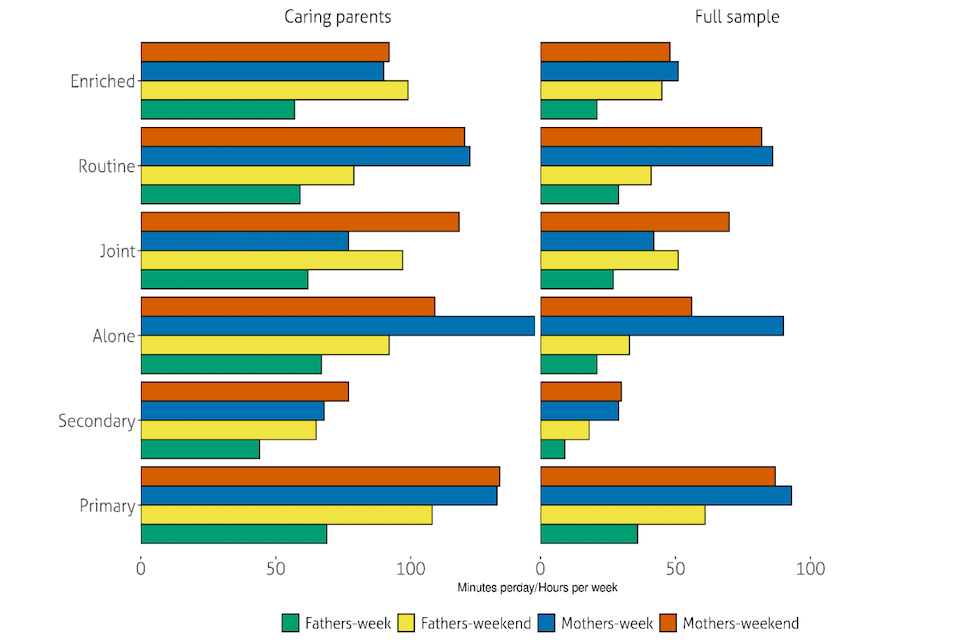
Table 3 and Figure 1 show the average number of minutes mothers and fathers spent per day on childcare. It is computed both for parents who reported at least one episode of childcare on the day (referred to as ‘carers’ in Table 3, and ‘caring parents’ in the Figure1) and for the full sample – including parents who did not report performing any childcare on the time-diary day. The latter gives an indication of the number of parents (mostly fathers) who did not engage in childcare on the day.[footnote 4]
On weekdays, even when we only consider parents who reported any care giving activities, women on average spent almost twice as much time as men caring for children as a main/primary activity (132 vs 69 minutes). This relative gap is even higher when we include in our analysis, parents who do not report any care giving activity. In this case mothers reported providing childcare for more than twice the time fathers did (93 vs 36 minutes). This reflects the fact that fathers are more likely than mothers to report that they did not engage in childcare. The gap is smaller when childcare as a secondary activity is considered (68 against 44 minutes) but only when we only consider parents who have reported doing any secondary care activity. This goes some way towards confirming that within households, frontline care is carried out by women, whereas care as an additional activity tends to be a more common behaviour among men.
When considering the full sample, it emerges that women spent 3 times as much time as men providing on routine childcare (86 vs 29 minutes). This is reduced somewhat if we only consider parents who have reported doing any routine care, yet, even then women on average provide double the amount men do (122 vs 59 minutes). As expected, the gender gap in enrichment care is smaller in comparison. Similarly, women on average spend more than twice the time (146 vs 67 minutes) caring for children without their partner than men. This contrasts with the closely aligned amount of time fathers spent caring as a primary activity (respectively 62 and 69 minutes per day).
All in all, on a typical weekday this results in more than two-thirds of women’s time (excluding sleeping, resting or naps) being spent either caring or with children present, by contrast with less than half of men’s time when comparing men and women who report doing any care.
The last 2 columns in Tables 2 and 3 show that the gap in caring time between partners at the weekend. Whether it is care as a primary or secondary activity, or mere co-presence, gender gaps tend to narrow. For instance in Table 3, when all respondents are taken into account, the gap between fathers and mothers drops from 57 to 26 minutes for primary care, 20 to 12 for secondary care, and 121 to 56 minutes for co-presence.
This means that when primary, secondary and co-presence are taken together men now spend up to 69% of their time with children at the weekend, although for women the figure is still larger at 83.5%. In other words, despite the fact that men’s increased care time gets them close to that of their female partners, women still take up the majority of the care time. There remains also close to half an hour gap between the time women and men spend caring alone for children.
The amount of time each partner spends on routine care does not differ very much at the weekend compared with the weekdays – meaning that at the weekend men do not drastically increase their time on the more daily physical type of care. It is, however, noticeable that men catch up on enriched care, as they spend on average half an hour more on this type of care on the weekend compared to the weekdays. It also notable that when we consider only the sample of those who do provide any care, that at the weekend men seem to spend a bit more time with children on enrichment care compared to mothers.
Overall, although a gender gap remained both in terms of the number of parents providing any care (Table 2) and the amount of care provided (Table 3) at the weekend as well as during the week, fathers were visibly more likely to be engaged in secondary and enriched childcare at the weekend.
Table 4: Time spent caring by parental working-time
| Weekdays: Mothers – Carers[1] | Weekdays: Mothers – All[2] | Weekdays: Fathers – Carers | Weekdays: Fathers – All | Weekends: Mothers – Carers | Weekends: Mothers – All | Weekends: Fathers – Carers | Weekends: Fathers – All | |
|---|---|---|---|---|---|---|---|---|
| Parents working full-time | ||||||||
| Primary care | 125 | 79 | 67 | 35 | 145 | 86 | 111 | 62 |
| Secondary care | 50 | 18 | 39 | 7 | 72 | 27 | 68 | 19 |
| Copresence | 396 | 279 | 340 | 239 | 536 | 385 | 514 | 392 |
| Primary + Secondary | 145 | 97 | 76 | 42 | 170 | 112 | 133 | 81 |
| Primary+Secondary+Co-presence | 530 | 376 | 384 | 281 | 693 | 497 | 615 | 473 |
| Caring alone | 122 | 67 | 57 | 17 | 109 | 54 | 92 | 33 |
| Joint caring | 75 | 38 | 61 | 27 | 120 | 67 | 98 | 52 |
| Routine care | 113 | 73 | 53 | 25 | 125 | 80 | 79 | 41 |
| Enriched care | 69 | 36 | 53 | 20 | 89 | 45 | 100 | 47 |
| Parents working part-time | ||||||||
| Primary care | 123 | 87 | 66 | 26 | 122 | 84 | 97 | 41 |
| Secondary care | 65 | 28 | 42 | 6 | 86 | 34 | 65 | 19 |
| Copresence | 469 | 352 | 448 | 275 | 556 | 427 | 480 | 348 |
| Primary + Secondary | 159 | 115 | 83 | 32 | 166 | 118 | 122 | 60 |
| Primary+Secondary+Co-presence | 622 | 467 | 500 | 307 | 710 | 546 | 563 | 408 |
| Caring alone | 137 | 87 | 98 | 19 | 110 | 58 | 77 | 22 |
| Joint caring | 70 | 39 | 53 | 18 | 111 | 70 | 110 | 41 |
| Routine care | 110 | 77 | 82 | 30 | 109 | 77 | 81 | 32 |
| Enriched care | 90 | 54 | 38 | 6 | 102 | 55 | 108 | 32 |
| Parents not in paid work | ||||||||
| Primary care | 148 | 117 | 90 | 62 | 135 | 93 | 91 | 64 |
| Secondary care | 84 | 43 | 67 | 27 | 70 | 28 | 44 | 16 |
| Copresence | 616 | 502 | 409 | 355 | 657 | 539 | 492 | 420 |
| Primary + Secondary | 200 | 160 | 118 | 89 | 169 | 121 | 112 | 80 |
| Primary+Secondary+Co-presence | 807 | 661 | 511 | 444 | 805 | 660 | 586 | 501 |
| Caring alone | 178 | 122 | 120 | 61 | 108 | 56 | 100 | 47 |
| Joint caring | 87 | 51 | 69 | 44 | 126 | 74 | 73 | 40 |
| Routine care | 143 | 112 | 95 | 62 | 130 | 91 | 79 | 48 |
| Enriched care | 109 | 66 | 95 | 50 | 83 | 42 | 86 | 41 |
Note: 1. Mean daily minutes by type of caring. a Denominator: respondents who reported caring on the day; b All respondents (including those who did not report caring) Population: Individuals in UK households with 2 cohabitating heterosexual adults and at least one child under 15. Data: UK TUS 2015, weighted for non-response
Figure 2: Time spent caring by parental working-time
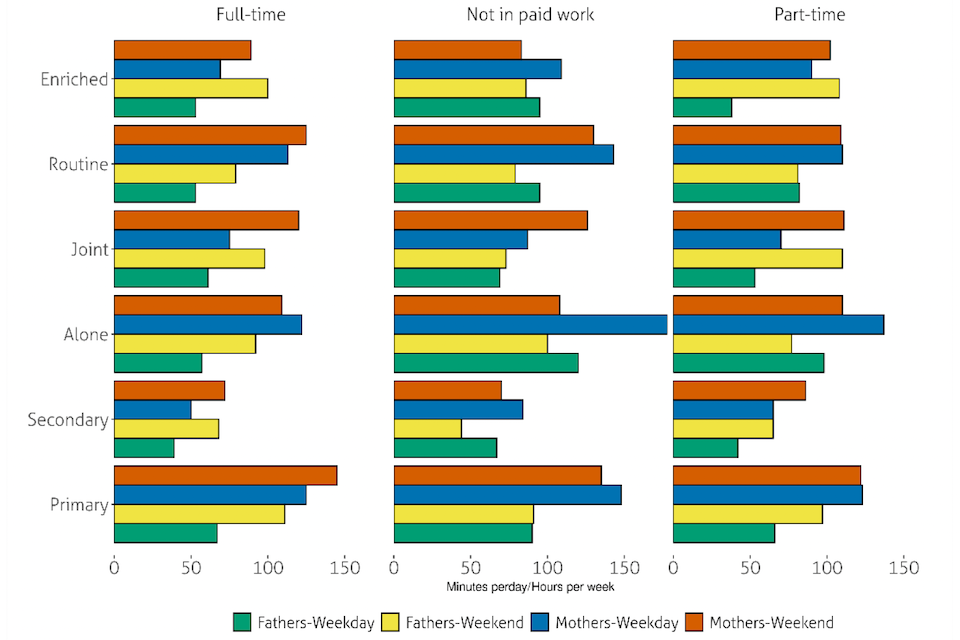
Table 4 and Figure 2 show the absolute amount of time mothers and fathers spent caring for children broken down by their working time status, that is not in paid work, working part time (here, defined as working less than 30 hours per week), and full-time. There are only a limited number of differences in terms of the average daily time part time and full time working mothers spend on caring as primary activity confirming previous studies (Craig 2006). Both full-time and part-time working mothers spent more than 2 hours on primary care, irrespective of the constraints arising from their work schedule (125 against 123 respectively for the sample of parents who provided any care). Similarly, hardly any difference was found in the time spent on routine childcare.
Full-time working mothers did spend slightly less time on enrichment care compared to their part-time counterparts, yet at only 21 minutes, the difference remains small.
On the other hand, co-presence time did change. Full time working mothers spent 396 minutes in children’s presence, while part-time working mothers spent an extra 73 minutes. Secondary care decreased a little bit more than primary care – with part-time working mothers spending 15 minutes extra on secondary care (65 minutes against 50). In sum, overall, women who worked full-time spent a little more than an hour and a half less (92 minutes) with their children compared to part-timers, yet the bulk of this difference occurred when mothers were not fully engaged with children (co-presence and secondary care). The total time full-time mothers spent in the presence of children represented 55.2% of their total non-resting time, against 65.2% for part-timers. As previously, irrespective of their working time, mothers spent a significantly larger amount of time caring than fathers on weekdays, especially caring alone as well as on routine childcare but differences are much less visible at the weekend.
For men, there is little overall difference between full-time and part-time workers. Full-time working fathers seem to carry out the same amount of primary and secondary care altogether compared to their part-time counterparts (76 vs 83 minutes). Studies have shown that highly educated fathers are more likely to carry out enrichment care of children (Dotti and Treas, 2016) and they are also more likely to be working full-time. Our results show that part-time working fathers seem to be spending more time in the presence of children (co-presence: 448 vs 340 minutes) and doing more routine care of children during the week than their full-time counterparts (82 vs 53 minutes), mirroring results from previous studies (see for example, Lyonette and Crompton, 2015). On the other hand, full-time employed fathers seem to be taking on more primary and solo caring than part-timers at the weekend (111 against 97 minutes and 92 against 77 minutes respectively).
Full-time employed fathers took on more enriched care than those employed part-time during the week (53 against 38 minutes), whereas little difference was visible between the 2 at the weekend.
Table 5: Time spent caring by age of the youngest child in the household
| Weekdays: Mothers – Carers[1] | Weekdays: Mothers – All[2] | Weekdays: Fathers – Carers | Weekdays: Fathers – All | Weekends: Mothers – Carers | Weekends: Mothers – All | Weekends: Fathers – Carers | Weekends: Fathers – All | |
|---|---|---|---|---|---|---|---|---|
| Youngest child is under 5 | ||||||||
| Primary care | 147 | 139 | 73 | 51 | 146 | 132 | 115 | 90 |
| Secondary care | 73 | 42 | 47 | 13 | 80 | 43 | 68 | 26 |
| Co-presence | 528 | 512 | 385 | 341 | 600 | 590 | 526 | 497 |
| Primary+Secondary+Co-presence | 714 | 694 | 443 | 404 | 777 | 764 | 643 | 613 |
| Caring alone | 162 | 134 | 74 | 30 | 120 | 83 | 100 | 49 |
| Joint caring | 84 | 63 | 63 | 39 | 131 | 105 | 103 | 74 |
| Routine care | 139 | 131 | 65 | 41 | 135 | 124 | 83 | 59 |
| Enriched care | 95 | 73 | 60 | 30 | 98 | 70 | 103 | 66 |
| Youngest child is 5 to 10 | ||||||||
| Primary care | 69 | 34 | 49 | 15 | 69 | 29 | 65 | 17 |
| Secondary care | 44 | 12 | 27 | 3 | 60 | 15 | 53 | 9 |
| Co-presence | 378 | 226 | 260 | 135 | 545 | 325 | 468 | 281 |
| Primary+Secondary+Co-presence | 453 | 273 | 281 | 153 | 619 | 369 | 512 | 307 |
| Caring alone | 80 | 36 | 39 | 8 | 63 | 22 | 51 | 10 |
| Joint caring | 43 | 14 | 49 | 11 | 61 | 24 | 64 | 18 |
| Routine care | 52 | 26 | 35 | 10 | 58 | 27 | 55 | 15 |
| Enriched care | 66 | 26 | 40 | 9 | 66 | 21 | 71 | 14 |
Note: 1 Mean daily minutes by type of caring. [1] Denominator: all respondents who reported caring on the day; .[2] All sample all respondents (incl. those who did not report caring) Population: Individuals in UK households with 2 cohabitating heterosexual adults and at least one child under 15. Figures for households with children aged 10-14 not available due to small sample size. Data: UK TUS 2015, weighted for non-response.
Table 5 presents caring time broken down by the age of the youngest child in the household. The largest differences between fathers and mothers occurred in households with children under 5, in particular on weekdays. Depending on whether fathers who did not engage in childcare are counted or not, mothers of children under 5 spent between 2 and close to 3 times as much time on primary care as fathers during the week (147 vs 73 minutes for carers only and 139 vs 51 minutes for the total sample). The relative gap is largest for routine (139 vs 65 minutes) and caring alone (162 vs 74 minutes). These gaps narrow down at the weekend but a clear imbalance between mothers and fathers remain visible. Although the absolute amount of time spent looking after children tends to drop as the youngest child in a household reaches 5 years of age, the gap remains between the relative share mothers and fathers carry out, particularly during the week, especially for caring alone and routine care. The gap further tends to be filled and to some extent reversed once children reach secondary school age, although figures are less reliable due to the small number of observations for this group (not shown).
4.2 Sharing of childcare and well-being outcomes
This section presents the results of the multivariate analysis of well-being outcomes for mothers, fathers of children under 15 and children aged 8 to 14 which was conducted on the matched household sample. Well-being outcomes for parents included: anxiety, life satisfaction, work-life balance satisfaction, satisfaction with leisure, satisfaction with social life, satisfaction with their relationship, and mean daily enjoyment. For children, only mean daily enjoyment was available. For each parental well-being outcome, 2 sets of models were fitted, with and without control variables.
Main findings
We found clear evidence that an increased share of childcare by fathers is significantly associated with a number of positive well-being outcomes, primarily for mothers, but also for fathers themselves.
Controlling for the socio-demographic characteristics of parents, the following was found.
For mothers: in households where fathers take on a significant share of enriched care, mothers tend to report greater satisfaction with their work-life balance, and lower levels of anxiety than in those in which they are not involved. This is also true of households where a greater share of the childcare is jointly done by both parents. At the same time however, mothers tend to report feeling more anxious where fathers take on more than 40% of the routine childcare.
For fathers: report a greater satisfaction with their social life when they significantly engage in primary or routine care (more than 40% of the total amount of childcare carried out in the household); a higher level of mean daily enjoyment when they significantly engage in enriched care, which is an original and important finding. At the same time however, fathers who engage in significant amounts of solo and secondary child care relative to mothers tend to be significantly less satisfied with their relationship.
For children aged 8-14: no significant association was found between their daily enjoyment and the time spent with either their mother, their father or both parents jointly. There are indications that when mothers reported having a rushed day, the enjoyment children was lower.
We will start by examining the overall division of childcare time in the data, as shown in Table 6. In order to make the results more intelligible, we have re-coded the caring ratio variables, obtained by dividing the amount of time spent by fathers doing a specific type of care by the total amount of time spent caring as a primary and secondary activity in the household on that day, into 4 categories.
Table 6: Sharing of childcare between parents (%)
| Fathers not caring | Fathers’ share under 40% | Fathers’ share between 40% and 100% | Mothers not caring | Total | |
|---|---|---|---|---|---|
| Primary care | 31.9 | 38.9 | 23.9 | 5.3 | 100 |
| Secondary care | 70.1 | 24.8 | 4.3 | 0.8 | 100 |
| Primary and Secondary | 26.2 | 34.4 | 31.9 | 7.5 | 100 |
| Caring alone | 57.4 | 28.0 | 11.1 | 3.5 | 100 |
| Routine care | 79.9 | 17.2 | 1.9 | 1.0 | 100 |
| Enriched care | 51.0 | 35.5 | 12.2 | 1.3 | 100 |
Note: Within-household proportion of time spent by fathers relative to mothers by type of caring, proportion of fathers and mothers with one parent reporting at least 10 minutes of caring. Matched data in UK households with 2 cohabitating heterosexual parents and at least one child under 15. Data: UK TUS 2015.
We can see that across the types of care, the proportion of households in which fathers did not report any childcare activities on a diary day ranged from 79.9% in the case of routine care to 26.2% in the case of primary and secondary care taken together. Enriched care stands in the middle between these two with as on average every other father reported spending time on reading, playing or teaching their children. As expected, the proportion of those in which mothers did not do any childcare remained very small, oscillating between 0.8 and 7.5%.
Less than 30% of households in the sample (23.9% + 5.3%) had fathers reporting a substantial amount of primary care (more than 40% of the total amount of time spent on childcare in the household), rising to 39.4% (31.9% + 7.5%) when secondary care was also taken into account. However, this proportion was much smaller for the other types of caring. For instance, less than 3% (1.9%+1%) of households reported fathers engaging in routine care for 40% of the time or more.
Being involved in childcare for less than 40% of the time therefore is the typical contribution by fathers across most households. The proportion of households where fathers provided care yet less than 40% of the total caring time in the household ranged from 38.9% in the case of primary care to 17.2% in the case of routine care.
Multivariate analysis
Table 7 summarises the main results of the regression models of the 7 parental well-being outcomes.[footnote 5] The coefficients of the models express change in units of the wellbeing scores. For models that examine mothers’ and fathers’ well-being outcomes, control variables included age of the youngest child in the household, maternal and paternal education, a combined variable measuring working-time and whether mother or fathers’ main job has a flexible work schedule,[footnote 6] in order to avoid collinearity for respondents who were not in paid work. The effect of childcare sharing was tested using a series of 3 category ordinal indicators comparable to those shown in Table 6: that is, father not caring (reference category), father caring between 1 and 40% of the total daily caring time,[footnote 7] father caring between 41% and 100% of the total caring time on diary day. Six caring types were retained: primary, secondary, solo, joint (mothers and fathers at the same time), routine childcare, enriched childcare. In the model for children well-being, the main independent variable was the time spent by children respectively with their mother, fathers, and both parents.
Controlling for socio-demographic and job-related characteristics, households in which fathers undertook a substantial amount of caring (more than 40%) were also those where a number of improved well-being outcomes were recorded but in a different fashion for each parent.
Table 7: OLS models of parental well-being outcomes by sharing of childcare.
| (ref: fathers not doing childcare) | Primary: Mother | Primary: Father | Secondary: Mother | Secondary: Father | Solo: Mother | Solo: Father | Joint: Mother | Joint: Father | Routine: Mother | Routine: Father | Enriched: Mother | Enriched: Father |
|---|---|---|---|---|---|---|---|---|---|---|---|---|
| Anxiety | ||||||||||||
| Fathers’ share under 40% | -.05 | .52 | .12 | .55 | -.02 | .37 | -.46 | .40 | -.00 | .28 | -1.12*** | .18 |
| (.31) | (.41) | (.29) | (.36) | (.29) | (.37) | (.29) | (.36) | (.28) | (.38) | (.28) | (.35) | |
| Fathers’ share 40% to 100% | -.49 | -.44 | 1.09 | .19 | .58 | -.34 | -.56 | -.46 | .97* | -.22 | -.98** | -.71 |
| (.35) | (.44) | (.66) | (.78) | (.41) | (.49) | (.34) | (.46) | (.38) | (.47) | (.38) | (.51) | |
| Work-life balance satisfaction | ||||||||||||
| Fathers’ share under 40% | -.04 | .07 | .04 | .01 | .05 | .11 | .27* | -.06 | .03 | .14 | -.00 | .05 |
| (.13) | (.15) | (.13) | (.14) | (.13) | (.14) | (.12) | (.14) | (.12) | (.14) | (.12) | (.13) | |
| Fathers’ share 40% to 100% | .08 | .15 | .15 | .39 | -.16 | .28 | .28 | .13 | -.06 | .17 | .35* | .23 |
| (.15) | (.16) | (.27) | (.28) | (.17) | (.18) | (.15) | (.17) | (.16) | (.18) | (.16) | (.19) | |
| Satisfaction with social life | ||||||||||||
| Fathers’ share under 40% | -.04 | .18 | -.04 | -.14 | -.05 | .21 | -.11 | .07 | .00 | .12 | -.18 | -.04 |
| (.13) | (.15) | (.12) | (.14) | (.12) | (.14) | (.12) | (.14) | (.12) | (.14) | (.12) | (.14) | |
| Fathers’ share 40% to 100% | .22 | .34* | -.24 | .02 | -.00 | .22 | .17 | .24 | .29 | .57** | -.06 | -.09 |
| (.14) | (.16) | (.25) | (.28) | (.16) | (.18) | (.14) | (.17) | (.15) | (.18) | (.16) | (.19) | |
| Satisfaction with partner | ||||||||||||
| Fathers’ share under 40% | -.03 | .06 | -.02 | .05 | -.04 | .04 | .08 | -.10 | -.03 | .12 | .03 | .02 |
| (.08) | (.09) | (.08) | (.08) | (.08) | (.09) | (.07) | (.08) | (.07) | (.09) | (.07) | (.08) | |
| Fathers’ share 40% to 100% | -.13 | -.03 | -.15 | -.36* | -.09 | -.22* | -.08 | .02 | -.09 | -.01 | -.12 | -.16 |
| (.09) | (.10) | (.16) | (.17) | (.10) | (.10) | (.09) | (.10) | (.10) | (.10) | (.10) | (.11) | |
| Mean daily enjoyment | ||||||||||||
| Fathers’ share under 40% | -.10 | .12 | -.04 | .13 | -.06 | -.03 | -.08 | .08 | -.13 | .05 | .04 | .13 |
| (.08) | (.09) | (.08) | (.09) | (.08) | (.08) | (.08) | (.08) | (.08) | (.08) | (.08) | (.08) | |
| Fathers’ share 40% to 100% | -.05 | .31*** | -.15 | .18 | -.15 | .04 | .06 | .30** | -.16 | .11 | .06 | .31** |
| (.09) | (.09) | (.16) | (.17) | (.11) | (.11) | (.09) | (.10) | (.10) | (.10) | (.10) | (.11) |
Outcome variables: each one of the above specified wellbeing outcomes, recorded on a score ranging from 1 to 7. Each coefficient denotes the increase/decrease in the wellbeing score for the share of childcare specified in the first column, by contrast with households in which fathers did not do any childcare. Note: ***p < 0:001, **p < 0:01, *p < 0:05. Matched household-level dataset of parents aged 16 and above in heterosexual couples with at least one child under 15. Data: UK TUS 2015.
Mothers
Mothers tended to be more anxious in households where fathers reported doing more than 40% of the routine childcare (a .97 unit increase in their anxiety score, p < .05) by comparison with those where they did not engage in caring. On the other hand, mothers reported being less anxious in households where fathers were moderately engaged in enriched care. Interestingly, the effect is stronger (a 1.12 unit decrease in the anxiety score, p<.001) in households where the father is engaged in some enriched care (1-40%) compared to those where fathers were engaged for more than 40% of the time (-.98, p<.01).
No household-level association was found between the sharing of care by fathers and maternal overall life satisfaction, once control variables were taken into account. Before control variables were introduced, a positive effect on maternal satisfaction with leisure was visible in households where father involvement in primary and routine care was larger than 40% (not shown).
In households where the father took on more than 40% of the enriched care on diary day, mothers tended to be more satisfied with their work-life balance (.35, p<05). The same is true of households where some joint care (1-40%) took place (a .27 increase, p<.05).
Although in the bivariate analysis we found a negative association between fathers’ involvement in more than 40% of primary care and mothers’ mean daily enjoyment (not shown), this association disappears once socio-demographic characteristics are controlled for.
By comparison to those who graduated from higher education, mothers with who only held an A-Level or GCSE seemed to experience markedly lower levels of anxiety. Fathers in households with low qualified mothers tended to experience worse satisfaction with their social life. Mothers also tend to be more anxious, and sometimes more satisfied with their leisure in traditional, male breadwinner households rather than in the dual earner ones. Finally, in some cases, maternal or paternal well-being outcomes improved in households where fathers worked in a medium qualified job, with or without flexible hours: this is true of anxiety and life satisfaction. In households in which there is some outsourcing of childcare to nurseries or family mothers have worse maternal anxiety and work-life balance satisfaction but better satisfaction with their partner.
Fathers
No association was found between the share of primary care undertaken by fathers and their level of anxiety, overall life satisfaction and satisfaction with their leisure after controlling for socio-demographic characteristics.
In households where fathers took up more than 40% of the primary or routine caring time, they also reported higher levels of satisfaction with their social life (respectively .34, p<.05 and .57, p<.01) than in those where they did not engage in caring, as visible in Table 7.
However, Table 7 also shows that in households where they took up more than 40% of secondary and solo care, fathers also reported lower satisfaction with their relationship (respectively -.36, p<.05 and -.22, p<.05 ). In households where fathers took up more than 40% of the primary or enriched caring time, fathers also reported higher levels of mean daily enjoyment than those in which they did not engage in caring (resp. .31, p<.001 and .31, p<.01). The same is true in households where more than 40% of the total caring time was carried out jointly by both parents (.30, p<.01).
In some cases, and by contrast with households in which fathers are employed in non-flexible low qualified jobs (skills level 4), fathers holding jobs with skills levels 2 or 3 reported lower levels of anxiety, better satisfaction with their life, as well as mean daily enjoyment.
Whether fathers worked under flexible working-time provisions did not seem to be associated with lower anxiety or increased well-being. Fathers who were not employed reported overall lower levels of work-life balance satisfaction and satisfaction with their social life. Fathers similarly employed in low qualified jobs but benefiting from flexible working-time schedule reported higher levels of mean daily enjoyment. Whether childcare was outsourced did not impact on fathers’ well-being outcomes.
Finally, traditional breadwinner arrangements (that is, where mothers did not engage in full-time work) resulted in mixed well-being outcomes for mothers, such as higher levels of anxiety but also higher levels of work-life balance satisfaction, whereas fathers tended to express more satisfaction with their partner.
Children
Three sets of daily enjoyment models were fit to the data (with the time spent with their mother, their father, and both parents as independent variables respectively). These models controlled for variables such as, gender and age of the child(ren), amount of time spent with the parent, maternal and paternal combined working time/flexible work schedule, maternal/paternal education, whether their mother or father reported that they felt that diary day was a rushed day. Casewise deletion was applied.
The models explain only a small portion of variance in overall daily enjoyment. The following 4 main results are reported in Table 8.
After controlling for parental characteristics and children age and gender, no significant association was found between the daily enjoyment of children aged 8-14 and the time spent with either their mother, their father or both parents jointly.
No significant interaction effect was found either between the time spent with each parent or both parents jointly and the gender of the child or whether each parent reported that this was a rushed day.
Having their mother reporting a rushed day rather than a normal one had a significantly negative impact on the enjoyment children reported on that day both in the models where maternal and joint time were tested (resp. -.20 p<.05 and -.24 p<.05).
At the same time, when the age of the child was not controlled for in the model, a positive effect of time spent with mothers on children enjoyment was visible, meaning that the time spent with their mother matters could matter more for the younger ones (not shown).
Table 8 OLS models of daily enjoyment among children aged 8-14 by time spent with each parent
| Model number | 1 (Time with mothers) | 2 (Time with mothers) | 3 (Time with mothers) | 4 (Time with fathers) | 5 (Time with fathers) | 6 (Time with fathers) | 7 (Time with both parents) | 8 (Time with both parents) | 9 (Time with both parents) | 10 (Time with both parents) |
|---|---|---|---|---|---|---|---|---|---|---|
| Age | -.05** | -.05** | -.05** | -.05** | -.05** | -.05** | -.05** | -.05** | -.05** | -.05** |
| (.02) | (.02) | (.02) | (.02) | (.02) | (.02) | (.02) | (.02) | (.02) | (.02) | |
| Girl (ref: Boy) | .00 | -.01 | .00 | .01 | .01 | .01 | .00 | -.01 | .00 | .01 |
| (.07) | (.09) | (.07) | (.07) | (.08) | (.07) | (.07) | (.09) | (.07) | (.07) | |
| Mothers’/fathers’/both parents’ time | .00 | .00 | .00 | .00 | .00 | -.00 | .00 | .00 | -.00 | .00 |
| (.00) | (.00) | (.00) | (.00) | (.00) | (.00) | (.00) | (.00) | (.00) | (.00) | |
| Interaction: Boy with mothers’, fathers’ or both parents’ time | .00 | -.00 | .00 | |||||||
| (.00) | (.00) | (.00) | ||||||||
| Rushed day (Mothers) | -.20* | -.24* | ||||||||
| (.10) | (.10) | |||||||||
| Interaction: Rushed day (mother) with mothers’, both parents’ time | .00 | .00 | ||||||||
| (.00) | (.00) | |||||||||
| Rushed day (Father) | -.07 | -.05 | ||||||||
| (.10) | (.10) | |||||||||
| Interaction: Rushed day (father) with fathers’, both parents’ time | .00 | .00 | ||||||||
| (.00) | (.00) | |||||||||
| Number of observations | 370 | 370 | 370 | 362 | 362 | 362 | 358 | 358 | 358 | 358 |
Outcome variables: mean daily enjoyment of each child aged 8-14 in the household, recorded on a score ranging from 1 to 7. Each coefficient denotes an increase/decrease in the mean daily enjoyment of respondents. Note: Regression of mean daily enjoyment by time spent with mother (models 1-3), father (models 4-6), both jointly (models 7-10). ***p < 0:001, **p < 0:01, *p < 0:05. Matched household-level dataset: children aged 8-14 in households with 2 heterosexual parents. Data: UK TUS 2015
4.3 Parental working-time, childcare and well-being
In this section we examined 3 additional questions:
-
What is the impact of parental working patterns on fathers’ involvement in primary and routine childcare? Our goal was to investigate how fathers’ working time and flexible working patterns influence how much childcare they provide.
-
To what extent is fathers’ involvement in childcare associated with parental and children well-being? Unlike the previous section we wanted to examine separately the impact of fathers engaging in childcare at all, and that of the amount of childcare for those who carried out childcare.
-
To what extent are these well-being outcomes affected by childcare taking place at the weekend or instead during weekdays? This question was investigated given that fathers are more likely to take part in childcare activities during the weekend, and that the nature of childcare activities may differ depending on whether it takes place during weekdays or at the weekend, influencing its potential impact on enjoyment and well-being outcomes.
We used the same matched household dataset drawn from the 2015 UK Time Use Survey as previously. As we wanted to examine the impact of the involvement in childcare by fathers in the context of dual earners families, all the analyses presented in this section were conducted in households in which both parents were in employment.
In order to simplify the analysis, only primary and routine childcare were taken into account since these types of childcare are significant in terms of maternal labour market participation and for gender equality (Bianchi and others, 2012; Craig and Mullan, 2011). As a reminder, primary childcare is defined as the total time spent looking after children, as a primary (main) activity in the time diary. Routine childcare can be defined as involving the physical care, such as feeding, cleaning/bathing, routine bedtime activities, or taking children to school.
Main findings
Fathers working flexible hours or working at the weekend for any reasons[footnote 8] are more likely to be involved in childcare than those who do not work in these ways.
Fathers are less likely to be involved in routine childcare in households in which mothers work part-time, but at the same time those who do tend to do for longer period of time than in households where both parents are employed full-time.
Being involved in primary childcare is positively associated with fathers’ overall enjoyment. What is more, the relationship between fathers’ involvement in childcare and well-being outcomes do not appear to be linear, meaning the smaller incremental changes in the increase in share of care provided by fathers do not matter much.
Examining only households in which fathers were involved in childcare, a share of childcare (relative) exceeding 40% of the total amount of childcare conducted in the household is associated with higher anxiety and lower daily enjoyment among mothers.
Both mothers and fathers equally enjoy higher levels of well-being as they care for children at the weekend rather than on a weekday.
How do working patterns shape the sharing of childcare?
Given the small sample size, and in order to maximise the robustness of the results, we only controlled for both fathers’ and mothers’ education level as well as the household working-time configuration (that is, father in full-time paid employment and mother part-time, other arrangements vs both parents in full-time employment) in the model.
We examined this question by focusing on primary and routine childcare. Four types of parental working patterns were covered:
-
whether fathers worked flexible hours, broadly defined[footnote 9]
-
whether fathers worked long hours (over 9 hours per day) during the week the time diary was recorded
-
whether fathers worked unsocial hours in the week the time diary was recorded – these were defined as working either before 8am, after 6pm or at the weekend
Descriptive results are shown in Table 9 and multivariate analysis in Table 10 below. We followed 2 perspectives. The left hand-side of the table shows results also including fathers who were not involved in childcare in the denominator whereas the right hand side only includes those who reported doing at least 10 minutes of childcare during the reported diaries. The former perspective adequately reflects the impact of the sizeable proportion of fathers who did not engage in childcare. However, these figures do not adequately reflect the typical size of the share of childcare taken on by fathers who did engage in childcare on the day the diary was recorded. The right hand side of the table better represents it, by only taking into account fathers who do take part in care.
Table 9 Median share of childcare taken by fathers in the household (%)
| All: Primary | All: Routine | Carers: Primary | Carers: Routine | |
|---|---|---|---|---|
| All households | 19 | 13 | 33 | 23 |
| Any flexible working-time provision | ||||
| No flexible working-time | 18 | 14 | 33 | 22 |
| Flexible working-time | 22 | 13 | 32 | 24 |
| Household-level working-time configurations | ||||
| Both full-time | 22 | 14 | 32 | 21 |
| Father full-time/Mother Part-time | 19 | 12 | 33 | 25 |
| Other arrangements | 13 | 15 | 31 | 33 |
| Whether worked long hours on diary day | ||||
| Worked less than 9 hours | 18 | 14 | 29 | 23 |
| Worked 9 hours or more | 18 | 11 | 35 | 22 |
| Whether worked unsocial hours that week | ||||
| No unsocial hours | 20 | 12 | 31 | 23 |
| Works unsocial hours | 18 | 13 | 32 | 23 |
Note: Within-household median proportion of time spent on childcare by fathers relative to mothers by type, and fathers’ / household’s working-time arrangements. Denominator: [1] All respondents, [2] Fathers and mothers with one parent reporting at least 10 minutes of caring. Matched data in UK households with 2 cohabitating heterosexual parents in employment and at least one child under 15. Data: UK TUS 2015.
As Table 9 shows, typically, fathers who engaged in primary childcare (carers column) tended to do so for less than one third of the total time spent on childcare in the household (33%). This proportion falls to even less than one quarter (23%) if we consider routine childcare only. When also taking into account households in which fathers did not report doing some childcare on diary day (all column), these numbers dropped respectively to 19% and 13%, reflecting the significant number of households in which fathers did not do any childcare.
Fathers with flexible working-time arrangements appeared to take on a slightly larger share of primary childcare, 22% vs. 18% than those without flexible working time, but only when we take into account those who did not report doing any childcare (all column). This also indicates that fathers who have flexible working arrangements are more likely to engage in primary childcare. Among fathers who did some childcare (caring column), there was no real difference between the two. On the other hand, for routine childcare we see that fathers with flexible working time arrangements do a slightly larger share of routine childcare 24 vs 22%, but only when we look at those who do provide care.
We can see that the differences in the median share of childcare taken by fathers working full-time tend to be small irrespective of their partner’s paid working time. However, when including in our data fathers who did not do childcare, fathers with part-time working partners took on a smaller share of primary and routine childcare than those with partners working full-time. At the same time, in households where fathers took on some of the childcare, the typical amount of time spent by fathers was slightly larger in cases when their partner was employed part-time rather than full time.
Interestingly, whereas not associated with a lower share of involvement in primary childcare (Table 9), fathers working long hours seem to be slightly less engaged in routine childcare.
There are also indications that working long days is actually associated with a larger share of primary childcare, but lower involvement in routine childcare (when we only examine fathers who did some childcare). This may be in part explained by the fact that fathers who worked long days during the week may compensate at the weekend by carrying other types of childcare than the more demanding routine one. Working unsocial hours (either before 8 in the morning, after 6 in the evening, or at the weekend) only seems to marginally affect the propensity to engage in childcare or the typical share taken up by fathers.
Multivariate analysis
Table 10 summarises the results of the multivariate analysis conducted by fitting, respectively, logistic regression models of the probability for fathers to be involved in primary and routine childcare, and linear models of the share of primary and routine childcare fathers did carry out, only including in the sample those who were involved in childcare on the given diary day.
The output from these models shows more instances of working-time patterns being significantly associated with fathers involvement in childcare (4 variables), and fewer with the amount of time childcare is carried out by fathers (only 2 variables).
We can see that, controlling for all other working-time characteristics, fathers were almost twice as likely to be involved in primary care and one and a half time as likely in routine childcare duties if they used flexible working-time arrangements (respectively: 1.91 p<.01 and 1.56 p<.05), or if they worked at the weekend (1.6 p<.05)
Compared to households where both mothers and fathers worked full time, those where mothers were employed part-time while fathers worked full time were those where fathers were almost half as likely to be doing any routine childcare (.59 p<.05) confirming previous studies based on other large scale data (Norman and others, 2014). Interestingly, and confirming previous studies (Lyonette and Crompton, 2015; van der Lippe and others, 2018), in households characterised by having other working-time arrangements – often involving father working part-time, fathers were also 3 times less likely to be doing any routine childcare (.34 p<.05).
On the other hand, in households where fathers did get involved in routine childcare, the share they took on was higher if mothers were employed part-time rather than full-time (a .06 percentage point increase, p<.05), or more understandably, when fathers themselves were employed part-time, reported as other arrangements (.15 percentage point increase, p<.05).
However, flexible working and other working time patterns did not seem to influence neither the share of primary nor routine care carried out by fathers.
Table 10: Probability of paternal involvement in childcare by working time characteristics
| Probability of fathers doing some childcare (rather than not): Primary | Probability of fathers doing some childcare (rather than not): Routine | Share of childcare time by fathers (percentage points): Primary | fathers (percentage points): Routine | |
|---|---|---|---|---|
| Father full time/ Mothers part-time (ref: both full-time) | .84 | .59* | .02 | .06* |
| (.23) | (.23) | (.03) | (.03) | |
| Other working-time configuration | .44 | .34* | -.08 | .15* |
| (.47) | (.46) | (.07) | (.07) | |
| Works long days | .7 | .66 | .04 | .00 |
| (.22) | (.21) | (.03) | (.03) | |
| Flexible working-time arrangement | 1.91** | 1.56* | .05 | .05 |
| (.24) | (.22) | (.03) | (.03) | |
| Works unsocial hours | .99* | 1.00 | .00 | .00 |
| (.00) | (.00) | (.00) | (.00) | |
| Weekend work | 1.53 | 1.6* | .03 | -.02 |
| (.22) | (.21) | (.03) | (.03) | |
| Num. obs. | 469 | 469 | 343 | 325 |
Left hand side of the table: logit model of the odds for fathers to report childcare on diary day. A value greater than 1 denotes positive odds, whereas values between 0 and 1 denote negative odds. For technical reasons, the standard errors are that of the logarithm of the coefficients shown in the table (non exponentiated coefficients). Right hand side: OLS model of the percentage of total time spent on childcare in the households by fathers. ***p < 0:001, **p < 0:01, *p < 0:05. Matched household dataset of dual earning parents aged 16 and above in heterosexual couples with at least one child under 15. data: UK TUS 2015
Do households in which fathers are involved in childcare enjoy higher well-being?
We revisited the earlier multivariate models of well-being, first by modelling the association between parental well-being and whether fathers did get involved at all in childcare using a dichotomic variable. This was done for all 8 well-being outcomes listed above, focusing on the respective impact of involvement in primary and routine care. Significant results are shown in Table 11. It should be noted however, that the proportion of variance explained by these models is small.
The headline result is that in most cases, we found no significant association between whether fathers were involved in childcare and parental well-being, for either mothers or fathers, with one sizable exception. As shown in Table 11, in households in which fathers took part to primary childcare, they reported a significantly higher level of daily enjoyment (.29, p <.01), by contrast with households in which they did not. These findings therefore confirm previous results showing that the immediate well-being of fathers is positively affected by involvement in childcare. An interesting additional finding was that as could be expected, in households in which fathers either worked part-time or were not employed (‘Other arrangements’) they reported higher levels of work-life balance satisfaction than those in which fathers worked full-time (1.01 p<.01).
Table 11: OLS model of paternal well-being by whether fathers are involved in primary childcare
| Work life balance satisfaction | Enjoyment | |
|---|---|---|
| Father involved (reference: not involved) | .11 | .29** |
| (.17) | (.10) | |
| Fathers full time/ Mothers part-time (reference: both full-time) | .01 | -.02 |
| (.16) | (.09) | |
| Other arrangements | 1.01** | .02 |
| (.35) | (.20) | |
| Num. obs. | 371 | 266 |
Outcome variables: work-life balance satisfaction and mean daily enjoyment, recorded on a score ranging from 1 to 7. Each coefficient denotes the increase/decrease in the wellbeing score for the category specified in the first column, by contrast with the reference category. ***p < 0:001, **p < 0:01, *p < 0:05. Matched household dataset of dual earning parents aged 16 and above in heterosexual couples with at least one child under 15. data: UK TUS 2015
Is the extent of fathers’ involvement in childcare associated with improved well-being?
We then modelled the impact of the share of total childcare carried out by fathers on the well-being outcomes of parents in dual earner families, measured on scales ranging from 1 to 7. We used the same well-being outcomes as we have in the earlier sections of this report, and focused only on households where fathers did get involved in childcare (at least 10 minutes of reported childcare). The share of childcare taken on by fathers was modelled using the same indicators as previously, recording whether father took on respectively less than 40% of the total amount of childcare time, or instead 40% or more. Results are shown in Table 12.
Here again, the number of significant associations is limited, but seems to confirm previous results:
We found that in households in which fathers were involved in routine childcare for 40% or more of the time, mothers also displayed higher levels of anxiety (1.10, p <.05), as well as, initially lower daily enjoyment (-.33, p <.05), in comparison with those in which fathers took on a smaller share of routine childcare. However, the latter effect disappeared once we controlled for whether childcare took place at the weekend rather than on a weekday.
Further analysis conducted with the share of childcare done by fathers as a continuous variable (ranging from 1 to 100) did not yield significant results, suggesting that the above effect is non-linear (not shown).
Table 12: OLS model of maternal well-being by extent of paternal involvement in routine childcare
| Anxiety | Happiness | Satisfaction with social life | Satisfaction with partner | Enjoyment | |
|---|---|---|---|---|---|
| More than 40% share of childcare | 1.10* | -.27 | .25 | -.01 | -.33* |
| (Ref: less than 40%) | (.48) | (.30) | (18) | (.11) | (.13) |
| Father full-time / Mother part-time (ref: both full-time) | .95* | -.66* | .02 | -.26** | .03 |
| (.41) | (.26) | (.16) | (.10) | (.11) | |
| Other working-time arrangements | 1.99* | -1.80** | -.94* | -.21 | -.31 |
| (.90) | (.57) | (.40) | (.27) | (.22) | |
| Num. obs. | 196 | 196 | 363 | 289 | 174 |
Outcome variables: each one of the above specified wellbeing outcomes, recorded on a score ranging from 1 to 7. Each coefficient denotes the increase/decrease in the wellbeing score for the share of childcare specified in the first column, by contrast with households in which fathers do did not do any childcare. ***p < 0:001, **p < 0:01, *p < 0:05. Matched household dataset of dual earning parents aged 16 and above in heterosexual couples with at least one child under 15. data: UK TUS 2015.
Impact of the day of the week
The above models of daily enjoyment of parents and children, were also run with the day of the week (weekend vs weekday) as a covariate, both as an additive and interaction term, although the reliability of the latter is limited, given the sample size. Results (not shown) suggest that there is a positive impact of being involved in childcare at the weekend on immediate well-being across the board, but that this impact is not specifically interacting with fathers’ involvement in childcare – with the exception previously described of the association routine childcare and maternal wellbeing. In other words, both mothers and fathers equally enjoy higher levels of well-being as they care for children at the weekend rather than on a weekday.
It should be reminded that the above findings rely on small sample size and therefore extrapolations should be made with caution.
4.4 COVID-19 and impact of sharing of care between parents
We should remind readers again that this report is based on data gathered in 2015, before the COVID-19 pandemic. Studies that examined the sharing of childcare and housework among parents during the pandemic, especially during the lockdown periods, have found a general trend towards an increase in fathers’ involvement in childcare. For example, an experimental survey carried out in May 2020 has shown that the Spring lockdown led to a 58% increase in the amount of childcare done by men compared to the data we are using here (ONS, 2020b). Regardless, women remained largely responsible for providing childcare, spending on average an additional 15 minutes per day on it. However, the childcare gap between men and women was reduced somewhat during the first stage of the UK lockdown – as the men’s share (amount of time) represented about two-thirds of women’s. This is a significant increase from 2015, where the corresponding figure was 39%. This result was confirmed by several other studies and surveys for the UK (Chung, Birkett and others, 2020; Chung, Seo and others, 2020) as well as other countries, such as Australia, the US and the Netherlands (Carlson and others, 2020; Craig and Churchill, 2020; Yerkes and others, 2020).
These shifts in men’s behaviours could be due to a number of factors. One reason could be that during the first UK lockdown between March and July 2020, a majority of schools and childcare facilities were closed except for children of key workers. Thus, in dual-earner households, fathers may have had no other option but to increase the amount of childcare they were providing, especially routine childcare, given the extensive amount of time that was required of parents to care for children. Another reason behind this change may be due to the fact that half of the workforce was working from home full time during the lockdown (ONS, 2020a). This would have reduced commuting time for workers, especially for men who are known to have longer commutes (ONS, 2020b), thus providing many fathers with the opportunity to spend more time with children (see also, Chung, Birkett and others, 2020). In a recent UK survey of working parents during the Spring lockdown in May-June, ¾ of all fathers agreed that they would like to work flexibly to spend more time with their family (Chung, Seo and others, 2020). What is more, in a recent survey of managers, a majority were reported to believe that organisations will support workers to work flexibly in the future – including working from home (Forbes and others, 2020). Based on these reports, we could expect that fathers will be likely to engage more in the care of children in the future, especially when meaningful support is provided by employers.
As we see from this report that spending more time caring for children can help improve well-being outcomes for parents. At the same time we have seen a significant degradation of mental health among the population over this pandemic, especially mothers (Chung, Seo and others, 2020; Xue and McMunn, 2020). In this sense, the sharing of childcare may be a crucial tool to address issues of mental health and well-being, in addition to ensuring that women’s labour market positions are maintained during this crisis (see also, Collins and others, 2020; Petts and others, 2020).
5. Conclusion
This study finds that despite a few advances, women still remain largely responsible for childcare across the UK. Although we do see men engaging in childcare, they are more likely to do so jointly with the mother, take on the more enjoyable enrichment childcare, mainly at the weekend. This leaves most of the routine care of children to mothers, especially on weekdays. Routine care (such as doing the school run or feeding children) is necessary but by nature more rigid, and more likely to hinder labour market participation of parents.
What is more, we saw a surprising number of fathers who did not take part in giving any childcare, in particular routine care and care as a secondary activity. Furthermore, more than half of dads in our survey reported not doing enrichment care on the day they recorded their daily activities.
Our analysis shows that in general, households where fathers were involved in childcare were the ones we found positive well-being outcomes for parents. For example, fathers’ involvement in care increased mothers’ sense of work life balance, and reduced mothers’ feelings of anxiety. For fathers themselves, being involved in childcare increased satisfaction with social life, and more importantly their sense of enjoyment. However, we also found that fathers who were significantly involved in childcare were less satisfied with their relationship, and their partners were more likely to experience anxiety. These results need further investigation to explore the mechanisms behind the result.
Our analysis also shows that fathers who were able to use flexible working time arrangements, or had partners who also worked full-time were much more likely to provide some primary or routine care. This provides us with some evidence that providing fathers better access to flexible working arrangements may be a good policy instrument in order to increase their participation in care giving (see also Chung, Birkett and others, 2020). We know from previous studies that there is great demands among fathers to be more involved in childcare (Working Families, 2017). Fathers have also displayed an increased preference for flexible working for care purposes due to their experience of it during the COVID-19 lockdown (Chung, Seo and others, 2020).
The present study further shows that the involvement of fathers in childcare could contribute to the well-being needs of working parents, in addition to helping to achieve gender equality at home and in the labour market (see also, Ruppanner and others, 2018; Chandola and others, 2019). Given the trends we see during the COVID-19 pandemic and the changes in preferences of parents, we expect to see a rising trend in fathers involvement in childcare in the future if relevant support is provided.
6. References
Baxter, J and Smart, D. (2010) Fathering in Australia among couple families with young children. Australian Department of Families, Housing, Community Services and Indigenous Affairs, Occasional Paper (37).
Bianchi SM, Sayer LC, Milkie MA, and others (2012) Housework: Who did, does or will do it, and how much does it matter? Social Forces 91: 55-63.
Blair-Loy, M. (2009) Competing devotions: Career and family among women executives,
Cambridge, MA: Harvard University Press.
Carlson, DL, Hanson, S and Fitzroy, A. (2016) The division of child care, sexual intimacy, and relationship quality in couples. Gender & Society 30(3): 442-466.
Carlson, D. L., Petts, R., & Pepin, J. (2020). US Couples’ Divisions of Housework and Childcare During COVID-19 Pandemic. SocArXiv https://doi.org/10.31235/osf.io/jy8fn.
Chandola T, Booker C, Kumari M, and others (2019) Are Flexible Work Arrangements Associated with Lower Levels of Chronic Stress-Related Biomarkers? A Study of 6025 Employees in the UK Household Longitudinal Study. Sociology 53: 779-799.
Chung, H. (2018). Dualization and the access to occupational family-friendly working-time arrangements across Europe. Social Policy and Administration, 52(2), 491-507. doi:DOI: 10.1111/spol.12379
Chung, H. (2019). National-level family policies and the access to schedule control in a European comparative perspective: crowding out or in, and for whom? Journal of Comparative Policy Analysis, 21(1), 23-40. doi: http://dx.doi.org/10.1080/13876988.2017.1353745
Chung H. (2020) Gender, flexibility stigma, and the perceived negative consequences of flexible working in the UK. Social Indicators Research 151: 521-545.
Chung, H. (2021) Shared care, father’s involvement in care and family well-being outcomes: A Literature Review. Report for the Government Equalities Office. London; UK Cabinet Office.
Chung, H., Birkett, H., Forbes, S., & Seo, H. (2020). Working from home and the division of housework and childcare among dual earner couples during the pandemic in the UK. SocArXiv. https://osf.io/preprints/socarxiv/4esf7/
Chung H, Seo H, Forbes S, Birkett, H. (2020) Working from home during the COVID-19 lockdown: Changing preferences and the future of work. Canterbury, UK: University of Kent. (available at http://wafproject.org/covidwfh/)
Chung H and Van der Lippe T. (2020) Flexible working work life balance and gender equality: Introduction. Social Indicators Research 151: 365-381.
Collins, C., Landivar, L. C., Ruppanner, L., & Scarborough, W. J. (2020). COVID-19 and the gender gap in work hours. Gender, Work & Organization, Online first.
Craig, L. (2006) Does father care mean fathers share? A comparison of how mothers and fathers in intact families spend time with children. Gender & Society 20(2): 259-281.
Craig L and Churchill B. (2020) Dual-earner parent couples’ work and care during COVID-19. Gender, Work & Organization. Online first.
Craig, L and Mullan, K. (2011) How Mothers and Fathers Share Childcare A Cross-National Time-Use Comparison. American Sociological Review 76(6): 834-861.
Craig, L and Powell, A. (2012) Dual-earner parents’ work-family time: the effects of atypical work patterns and non-parental childcare. Journal of Population Research 29(3): 229-247.
Curtice J, Clery E, Perry J, and others (2019) British Social Attitudes : The 36th Report. London: The National Centre for Social Research.
Dotti Sani GM and Treas J. (2016) Educational Gradients in Parents’ Child-Care Time Across Countries, 1965–2012. Journal of Marriage and Family 78: 1083-1096.
Forbes, S., Birkett, H., Evans, L., Chung, H., & Whiteman, J. (2020). Managing employees during the COVID-19 pandemic: Flexible working and the future of work. Retrieved from Birmingham: https://www.birmingham.ac.uk/research/responsible-business/events/managing-employees-throug hout-the-covid-19-pandemic-flexible-working-and-the-future-of-work.aspx
Hochschild, A and Machung, A. (1989) The second shift: Working parents and the revolution at home, New York: Viking.
Kahneman, D. & Riis, J. (2005). Living, and Thinking about It: Two Perspectives on Life. In Huppert, F.A., Baylis, N., & Keverne, B. (Eds.), The Science of Well-Being, 285-304. Oxford University Press.
Kan, MY and Pudney, S. (2008) 2. Measurement Error in Stylized and Diary Data on Time Use. Sociological Methodology 38(1): 101-132.
Kroll, ME, Carson, C, Redshaw, M and Quigley, MA. (2016) Early father involvement and subsequent child behaviour at ages 3, 5 and 7 years: prospective analysis of the UK millennium cohort study. PloS one 11(9): e0162339.
Lyonette C and Crompton R. (2015) Sharing the load? Partners’ relative earnings and the division of domestic labour. Work, employment and society 29: 23-40.
Milkie, MA, Bianchi, SM, Mattingly, MJ and Robinson, JP. (2002) Gendered division of childrearing: Ideals, realities, and the relationship to parental well-being. Sex Roles 47(1-2): 21-38.
Norman, H., Elliot, M., & Fagan, C. (2014). Which fathers are the most involved in taking care of their toddlers in the UK? An investigation of the predictors of paternal involvement. Community, Work & Family, 17(2), 163-180.
Norman, H, Elliot, M and Fagan, C. (2018) Does Fathers’ Involvement in Childcare and Housework Affect Couples’ Relationship Stability? Social Science Quarterly Online first.
ONS. (2020a) Coronavirus and homeworking in the UK: April 2020. Statistical Bulletin. London: Office for National Statistics.
ONS. (2020b) Coronavirus and how people spent their time under lockdown: 28 March to 26 April 2020. London: Office for National Statistics.
Petts, R. J., Carlson, D. L., & Pepin, J. R. (2020). A Gendered Pandemic: Childcare, Homeschooling, and Parents’ Employment During COVID-19. Gender, Work & Organization. Online first.
Raley, S, Bianchi, SM and Wang, W. (2012) When Do Fathers Care? Mothers’ Economic Contribution and Fathers’ Involvement in Child Care American Journal of Sociology 117(5): 1422-1459.
Ruppanner L, Perales F and Baxter J. (2018) Harried and Unhealthy? Parenthood, Time Pressure, and Mental Health. Journal of Marriage and Family 81: 308-326.
Schober, PS. (2012) Paternal child care and relationship quality: A longitudinal analysis of reciprocal associations. Journal of Marriage and Family 74(2): 281-296.
Van der Lippe T, Treas J and Norbutas L. (2018) Unemployment and the division of housework in Europe. Work, employment and society 32: 650-669.
Wight, VR, Raley, SB and Bianchi, SM. (2008) Time for children, one’s spouse and oneself among parents who work nonstandard hours. Social Forces 87(1): 243-271.
Williams, J. (1999) Unbending gender: Why family and work conflict and what to do about it, New York: Oxford University Press.
Working Families. (2017) Modern Family Index 2017. London: Working Families. (available: https://www.workingfamilies.org.uk/wp-content/uploads/2017/01/Modern-Families-Index_Full-Rep ort.pdf)
Xue, B., & McMunn, A. (2020). Gender differences in the impact of the COVID-19 lockdown on unpaid care work and psychological distress in the UK. SocArXiv: https://doi.org/10.31235/osf.io/wzu4t
Yerkes, M. A., André, S., Beckers, D. G., Besamusca, J., Kruyen, P. M., Remery, C., van der Zwan, R., Geurts, S. (2020). Intelligent lockdown, intelligent effects? The impact of the Dutch COVID-19 ‘intelligent lockdown’on gendered work and family dynamics among parents. PloS one, 15(11), e0242249. https://journals.plos.org/plosone/article?id=10.1371/journal.pone.0242249
Young, Z. (2018) Women’s Work: How mothers manage flexible working in careers and family life, Bristol: Bristol University Press.
7. About this research
This research was commissioned under the previous government and before the COVID-19 pandemic. As a result the content may not reflect current government policy, and the reports do not relate to forthcoming policy announcements. The views expressed in this report are the authors’ and do not necessarily reflect those of the government.
7.1 Research team
Dr. Pierre Walthery is Senior Research Fellow at the Centre for Time Use Research. He is specialised in the quantitative analysis of work and employment, especially from a gender equality and well-being perspective. The ESRC Centre for Time Use Research is a multidisciplinary research group based at the Social Research Institute, University College London (UCL). Its team of researchers – which includes sociologists, economists, and demographers – work with Time Use diaries to investigate work-life balance, well-being, gender, and economics.
Dr. Heejung Chung is Reader in Sociology and Social Policy at the University of Kent. She is a labour market expert, specialises in areas of flexible working, family-friendly policies, and gender equality both at home and in the labour market. She has completed projects with a number of national and international organisations, including the Korean Federation of Trade unions, the Estonian Parliament, the International Labor Organisation, and the European Commission.
-
Fathers working at the weekend may be working at home or outside home as part of their contracted hours, working overtime, or carrying out additional paid work in another job. ↩
-
Two overall life satisfaction variables (SATIS and SATISOV) were recorded in the UK TUS 2015. SATISOV was initially recorded between April and September 2014 after which a decision was taken to alter the instrument in order to improve comparability with the ONS life satisfaction instrument. SATIS was subsequently recorded between October 2014 and 2015. SATISOV is measured through the following question: ’How dissatisfied or satisfied would you say you are with your life overall?’ Answers were recorded on a 7 item labelled scale ranging from ’Completely dissatisfied’ to ’Completely satisfied’. SATIS is measured through the following question: ’Overall, how satisfied are you with your life nowadays? Answers were on an 11 item unlabelled scale ranging from ‘Not at all satisfied’ to ‘completely satisfied’. ↩
-
Flexible/atypical working-time arrangements can potentially enable fathers to carry out more childcare at home (Presser, 1988), but flexible working is impacted by the education and occupational levels of parents (Chung, 2018; 2019). In addition, the division of childcare is likely to be affected by fathers’ occupational level (Lyonette and Crompton 2015). ↩
-
The difference between the 2 is that the former is more a typical measure of time typically spent caring by parents who actually did some childcare on diary day, but does not reflect the fact that a significant number of them, especially fathers, did not report any caring activities. By contrast, the mean time computed with the full sample better reflects the weight of parents who did not engage in caring on the days they have reported but not give a realistic sense of the time spent doing childcare when it occurs. ↩
-
In order to accurately interpret these results, models should be compared across types of care for a given outcome, as the samples size remain identical. ↩
-
Seven types of flexible work schedule were recorded in the 2015 TUS: flexible hours, with specified core hours, flexible hours, with no specified core hours, annualised hours contract, term time working, job sharing, a 9-day fortnight, a 4.5 day week. Respondents who recorded at least one of these were classified as working flexible hours. ↩
-
The denominator used in the calculations is thus the total caring time reported by fathers and mothers as primary and secondary activity. ↩
-
Fathers working at the weekend may be working at home or outside home as part of their contracted hours, working overtime, or carrying out additional paid work in another job. ↩
-
Any one of: flexible hours, with specified core hours; flexible hours, with no specified core hours; annualised hours contract; term time working; job sharing; 9-day fortnight; 4.5 day week; zero hours contract. ↩