Childcare providers and inspections as at 31 August 2017: main findings
Updated 26 August 2021

© Crown copyright 2021
This publication is licensed under the terms of the Open Government Licence v3.0 except where otherwise stated. To view this licence, visit nationalarchives.gov.uk/doc/open-government-licence/version/3 or write to the Information Policy Team, The National Archives, Kew, London TW9 4DU, or email: psi@nationalarchives.gov.uk.
Where we have identified any third party copyright information you will need to obtain permission from the copyright holders concerned.
This publication is available at https://www.gov.uk/government/statistics/childcare-providers-and-inspections-as-at-31-august-2017/childcare-providers-and-inspections-as-at-31-august-2017-main-findings
This release contains:
-
the number of Ofsted registered childcare providers and places, and their most recent inspection outcomes as at 31 August 2017
-
the number of providers that have registered with Ofsted (joiners) and the number of providers that have left (leavers) between 31 March 2017 and 31 August 2017
The number of childminders registered with Ofsted has continued to decrease.
There were 42,743 childminders registered with Ofsted as at 31 August 2017. This was down 752 (2%) since 31 March 2017 and 14,669 (26%) since 31 August 2012.
The number of non-domestic providers has remained broadly the same overall.
There were 27,023 childcare providers on non-domestic premises as at 31 August 2017. Similar numbers of providers joined and left the childcare sector between 31 March and 31 August 2017.
The number of childcare places offered by providers on the Early Years Register has remained fairly stable.
While the number of places offered by childminders has decreased and the number of places offered by non-domestic providers has increased slightly, the overall number of places offered by early years registered providers has remained fairly stable since August 2012.
There are currently an estimated 1.3 million places on offer.
More than 9 in 10 providers on the Early Years Register were judged to be good or outstanding.
As at 31 August 2017, the proportion of childcare providers on the Early Years Register judged to be good or outstanding was 94%. This has remained broadly the same as at 31 March 2017 and was an increase of 20 percentage points since 31 August 2012.
Figure 1: Overall effectiveness of active early years registered providers at their most recent inspection over time
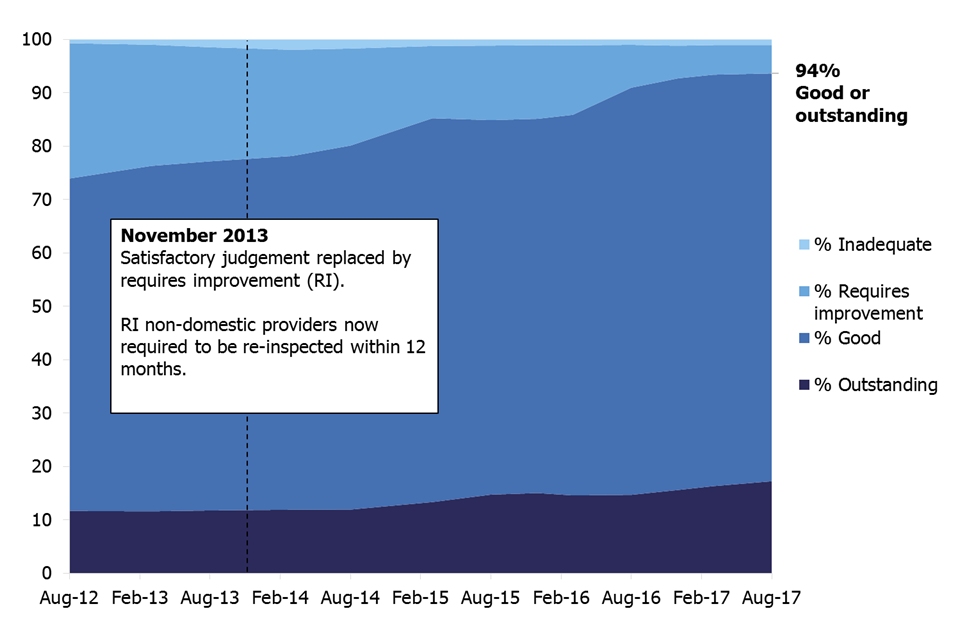
This chart shows changes in the proportion of the four inspection judgements for active early years registered providers between August 2012 to August 2017.
1. Introduction
The early years and childcare sector is primarily made up of private nurseries, pre-schools and childminders.
1.1 Early years and childcare provider types
Childcare on non-domestic premises
Nurseries, pre-schools, holiday clubs and other private provision on business premises, usually registered on the Early Years Register (EYR) because they look after children aged 0 to 5.
Childminders
People who are paid to look after one or more children they are not related to in someone’s home. The majority are registered on the EYR because they look after children aged 0 to 5, but those who look after 5 to 7 year olds need to register on the Childcare Register (CR).
Childcare on domestic premises
Where 4 or more people look after children together in someone’s home. The majority are registered on the EYR and some are registered on the CR, depending on the age of the children they look after.
Home childcarers
Nannies who care for children aged 0 to 18 wholly or mainly in the child’s own home. They are not required to register with Ofsted but may choose to do so on the Voluntary Childcare Register (VCR).
1.2 Further information
Childcare on non-domestic premises and childminders make up the majority of early years provision registered with Ofsted. Further information about provider types is available in the glossary.
Childcare in early years also occurs in the schools sector. This is discussed in the Early years provision in the schools sector section of this document.
2. Number of providers
There were 80,659 childcare providers registered with Ofsted as at 31 August 2017. This is a decrease of 1% since 31 March 2017, and down 16% since 31 August 2012 when there were 96,163 providers.
2.1 Changes in provider numbers, by provider type
Childminders
42,743 providers as at 31 August 2017, down 752 since 31 March 2017. This continues a downward trend, with 26% fewer providers than at 31 August 2012.
Childcare on non-domestic premises
27,023 providers as at 31 August 2017, up 28 since 31 March 2017. Numbers are fairly stable over time, having decreased by just 3% since 31 August 2012.
Home childcarers
10,674 providers as at 31 August 2017, down by 27 since 31 March 2017. Numbers are fairly stable over time and at a similar level to those seen as at 31 August 2012.
Childcare on domestic premises
These are not included in Figure 2 as there is only a very small number registered with Ofsted (219 as at 31 August 2017).
2.2 Factors influencing changes in provider numbers
Overall, childcare provider numbers have decreased steadily since August 2012. This has been driven by a large decrease in childminders, a small decrease in non-domestic providers, and no notable change in the number of home childcarers (Figure 2).
Figure 2: Total number of childcare providers registered with Ofsted on any register over time, by provider type
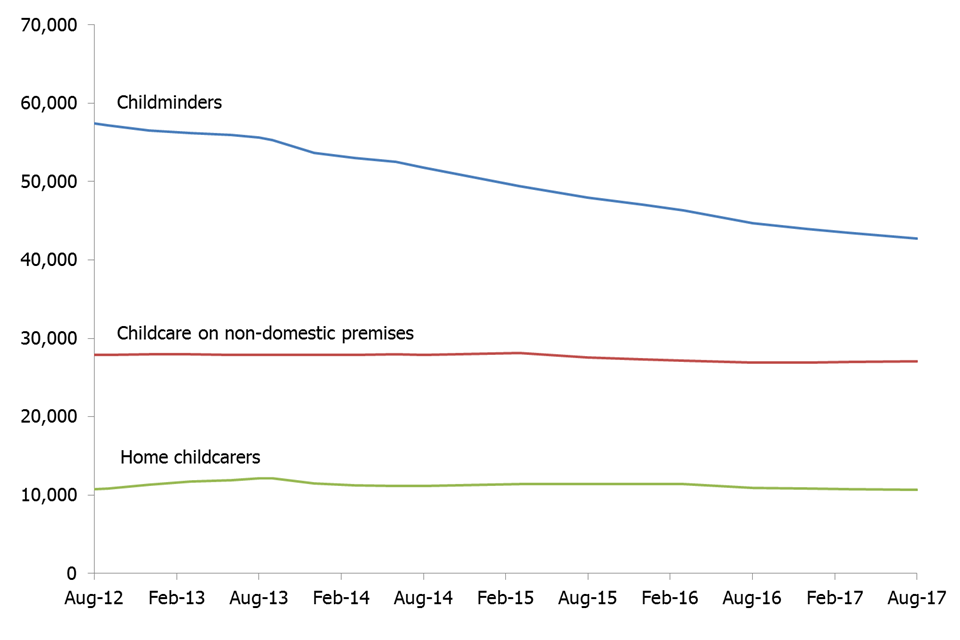
This chart shows changes in the numbers of the three main provider types over time.
The decline in the number of childminders is driven by more providers leaving than joining the childcare sector. For example, 2,320 childminders left the sector in April to August 2017 and 1,568 joined – a net decrease of 752. However, provider numbers have decreased at a slightly slower rate since December 2016.
The number of providers on non-domestic premises has remained relatively stable since 31 March 2017, with similar numbers of providers joining and leaving the sector in April to August 2017. However, since May 2015, schools have been exempt from registering their early years provision for 2 year olds with Ofsted. This means that many schools providing childcare for 2 year olds are not on Ofsted’s Early Years Register. This may have contributed to the 4% decrease in the number of childcare providers on non-domestic premises since March 2015.
2.3 Regional analysis of providers
The South East and London have the highest number of childcare providers (Table 1). These are also the regions with the highest proportion of providers relative to the child population (18.1 and 17.1 providers per 1,000 children respectively). The North East has the lowest number of childcare providers and second lowest proportion of providers relative to the child population (11.5 per 1,000 children), after the West Midlands.
For childcare on non-domestic premises, the highest ratio of providers to children is in the South East (5.8 per 1,000), while the North East also has the lowest ratio, at 3.5 per 1,000 children.
For childminders, the ratio of providers to children is also highest in the South East (9.3 per 1,000), and lowest in the West Midlands (5.6 per 1,000).
London has the second highest proportion of childcare providers per 1,000 children. This is driven by their much higher proportion of home childcarers to children than other regions (4.5 per 1,000). The proportion of childminders and non-domestic providers per 1,000 children in London is similar to the national level.
Table 1: Proportion of early years providers per 1,000 children, by region [footnote 1] [footnote 2] [footnote 3]
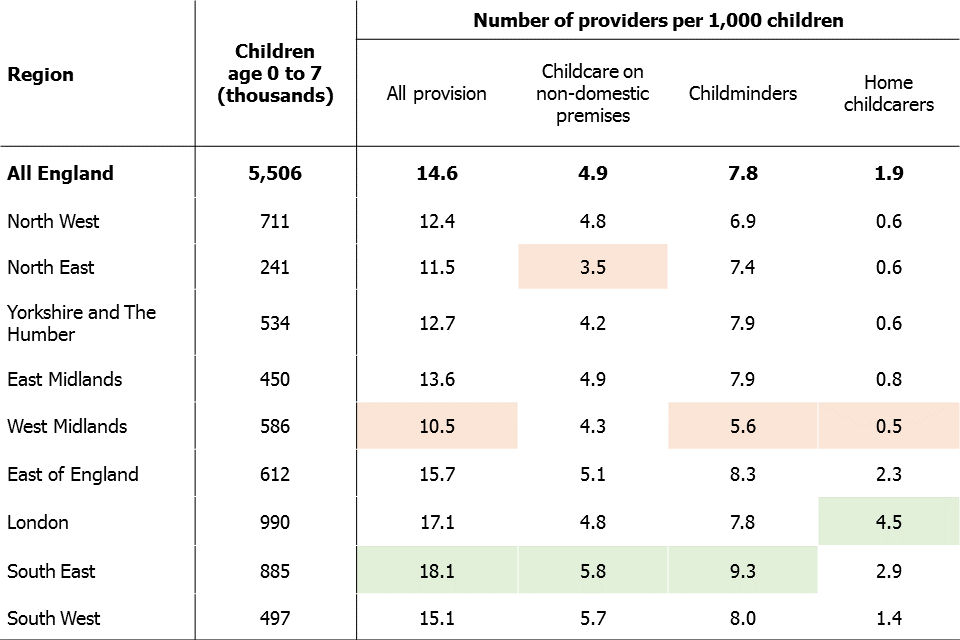
This table shows the number of children and number of providers per 1,000 children for all regions.
The South West and East Midlands experienced the largest decreases in provider numbers since 31 March 2017 (both by 2%). These were mainly driven by decreasing numbers of childminders in these areas.
London was the only region in which the overall number of childcare providers remained broadly the same. Although childminder numbers in London decreased by 1%, the number of childcare providers on non-domestic premises increased by over 2%, or 94 providers.
3. Number of places
3.1 Registers and places
As at 31 August 2017, 81% of Ofsted registered childcare providers were on the Early Years Register (EYR). The remaining 19% were not on the EYR, and so only appeared on the voluntary (VCR) or compulsory (CCR) parts of the Childcare Register.
Childcare places data refers to all places offered by providers on the EYR for children aged under 8 years old. Most providers on the EYR are also registered on the Childcare Register (CR) because they look after children up to the age of 8 years old. Therefore, the number of places in the early years age range (0 to 5 year olds) is likely to be lower.
While the majority of providers on the EYR have places information recorded, for some providers we have calculated estimates. For more information on the estimation process, see Number of places in the glossary.
For non-domestic providers, their number of places reflects the number of children they intend to provide childcare for at any one time. Providers have no maximum limit on the number of places they can offer, as long as they have a suitable ratio of staff to children.
For childminders, the maximum number of places that they can offer if they do not have any assistants is 6. As at 31 August 2017, around 70% of childminders were registered as offering 6 places. The actual number of childminder places available may be lower.
In summary, it is likely that Ofsted data for non-domestic providers is more representative of the number of places they provide in practice than it is for childminders.
3.2 Providers and places
Looking at the number of childcare places by provider type, as at 31 August 2017:
Childcare on non-domestic premises
Offered 80% (1.0 million) of all childcare places, which is an increase of 2 percentage points since August 2012.
Childminders
Offered 20% of all places (amounting to 253,900 places), a decrease of 2 percentage points since August 2012.
Childcare on domestic premises
Offered less than 1% of places, or approximately 4,500 places.
3.3 Overall number of places
Despite decreasing numbers of childminders, the number of childcare places has remained broadly stable since August 2012 (Figure 3). While childminder places decreased between April and August 2017, there was a larger increase in the number of places offered by childcare on non-domestic premises, which resulted in an overall increase of around 1,200 places. As at 31 August 2017, there are currently an estimated 1.3 million childcare places offered by providers on the EYR.
Figure 3: Childcare places on the Early Years Register over time, by provider type
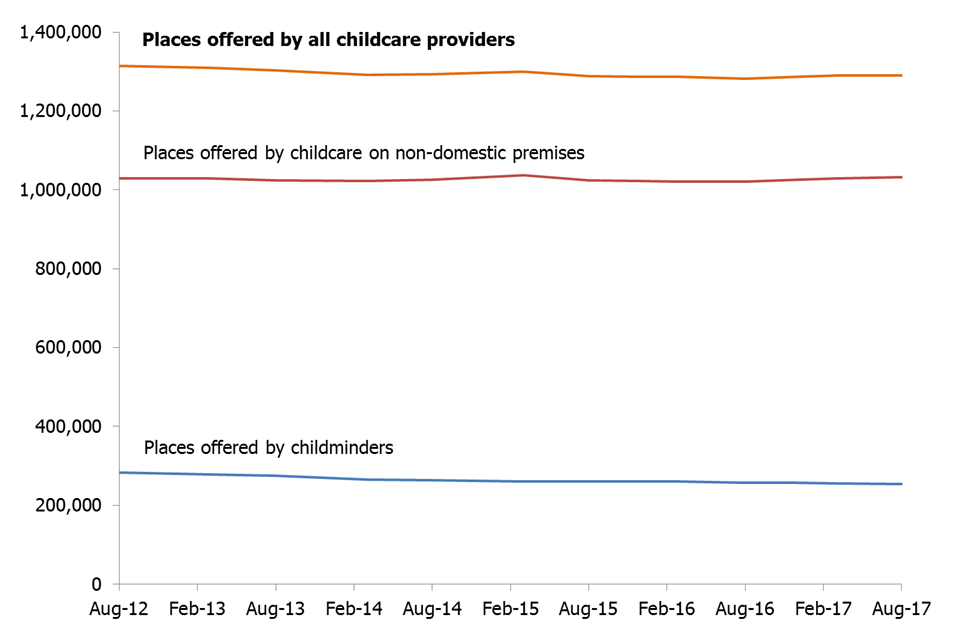
This chart shows that the number of childcare places available on the Early Years Register have remained broadly stable over time, despite an overall decrease in the number of providers.
Childminder provider numbers have decreased by 26% since 31 August 2012, but the number of places offered by childminders has only decreased by 10%. This means that each individual childminder is, on average, offering a higher number of places – even though there are fewer childminders and fewer places on offer overall. As at 31 August 2012, the average number of places offered by childminders on the Early Years Register was 5.1, whereas as at 31 August 2017, the average was 6.2. This average takes into account childminders with assistants, who are permitted to offer more than 6 places.
3.4 Introduction of 30 hours free childcare
Since 1 September 2017, working families in England have been eligible for 30 hours of free childcare each week for 3 to 4 year olds during term-time. As at 31 August 2017, over 200,000 codes had been issued for eligible children whose parents applied to the scheme.
It is too soon for Ofsted to analyse places data in light of the 30 hours scheme, but in future releases we hope to provide some insight into the scheme’s impact on the childcare sector.
4. Inspection outcomes
New providers joining the Early Years Register (EYR) are normally inspected within 30 months of registration. ‘Being inspected as a childminder or childcare provider’ provides more information about inspection. As at 31 August 2017, 80% of the 65,422 providers on the EYR had been inspected, with the remaining 20% yet to be inspected.
4.1 Proportion of providers on the EYR judged good or outstanding
As at 31 August 2017, 94% of childcare providers on the Early Years Register were judged to be good or outstanding. This was broadly the same as at 31 March 2017, when the proportion judged good or outstanding was 93%, and a substantial increase from 31 August 2012 when the proportion was 74%. This increase can be attributed to the steady rise in the proportion of providers judged good, with only a small increase in the proportion of providers judged outstanding (Figure 1).
4.2 Inspection outcomes, by provider type
Looking at the 2 main provider types as at 31 August 2017 (Figure 4):
Childcare on non-domestic premises
95% were judged to be good or outstanding at their most recent inspection, the same proportion as the end of March 2017. This was made up of 75% of childcare on non-domestic premises judged good and 21% judged outstanding.
Childminders
93% were judged good or outstanding, which was up one percentage point since the end of March 2017. This was made up of 78% of childminders judged good and 15% judged outstanding.
Please note that percentages do not appear to add. This is due to rounding.
Figure 4: Percentage of childminders and non-domestic providers judged good or outstanding at their most recent full inspection over time
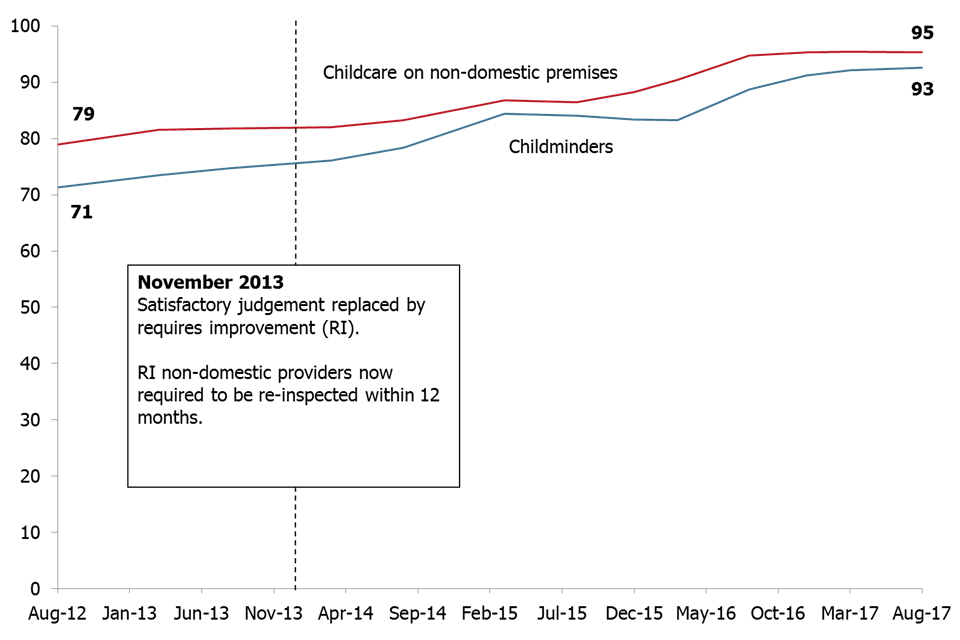
This chart shows that overall the percentage of childminders and non-domestic providers judged good or outstanding has increased substantially between August 2012 and August 2017.
4.3 Changes in the proportion of childminders judged good or outstanding
Since the beginning of August 2016, Ofsted has prioritised inspections for childminders who had been previously judged requires improvement (RI) or inadequate.
As at 31 August 2017, 88% of childminders who had previously received a judgement of RI or inadequate improved to good or outstanding. This improvement has a double effect: as the number of good or outstanding childminders increases, the number of RI or inadequate childminders decreases.
Other factors that have influenced this upward trend in the longer term are:
-
providers are more likely to be judged good or outstanding at their first inspection than they were in August 2012
-
providers leaving the sector are more likely to have had inspection judgements of RI or inadequate than those that remain
4.4 Changes in the proportion of childcare on non-domestic premises judged good or outstanding
Over time, the proportion of childcare on non-domestic premises judged good or outstanding has seen a steady increase. Part of this increase can be attributed to a change in the childcare inspection policy. Since November 2013, all childcare on non-domestic premises judged requires improvement must be re-inspected within 12 months. This means that non-domestic providers have had more opportunity to demonstrate improvement than they did previously.
4.5 Regional inspection outcomes
All 9 regions in England have experienced a rise in the proportion of providers judged good or outstanding over time (Figure 5).
Figure 5: Percentage of providers judged good or outstanding from 31 August 2012 to 31 August 2017, by region
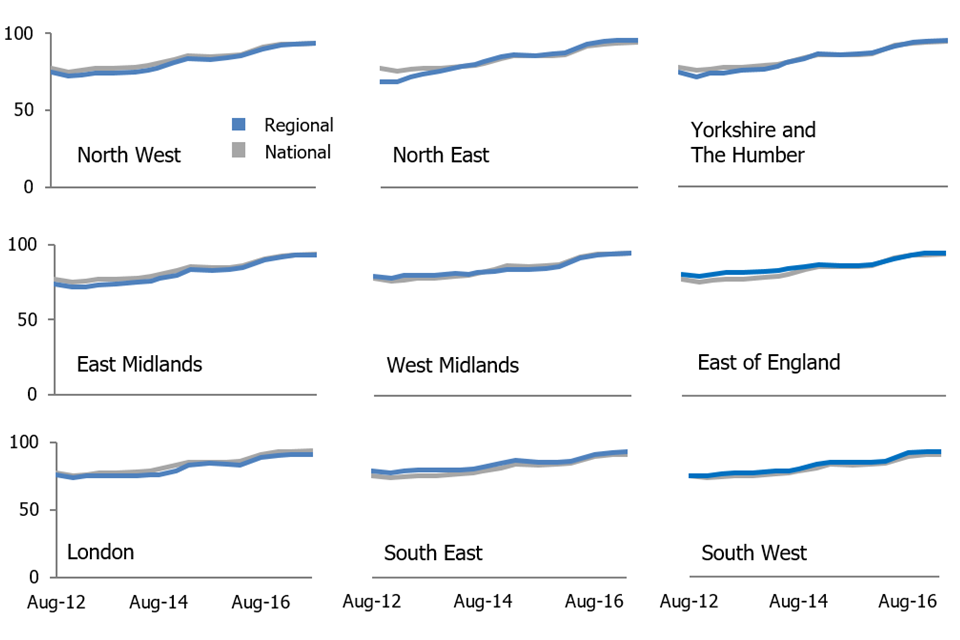
This is a combination of nine charts, one for each region, showing an increase in the percentage of providers judged good or outstanding between August 2012 and August 2017.
As at 31 August 2017, regions had fairly similar proportions of providers judged good or outstanding. The South West continued to have the highest proportion (95%) and London the lowest (91%).
On a national level, 95% of non-domestic providers were judged good or outstanding compared with 93% of childminders – a gap of 3 percentage points. This is similar to the gap seen as at 31 March 2017.
Please note that differences between percentages do not appear to add. This is due to rounding.
Across the regions, this gap ranged from 2 percentage points in the East of England to 5 percentage points in London (Figure 6).
Figure 6: Percentage point gap between proportion of non-domestic providers judged good or outstanding and the proportion of childminders judged good or outstanding, as at 31 August 2017 [footnote 4] [footnote 5]
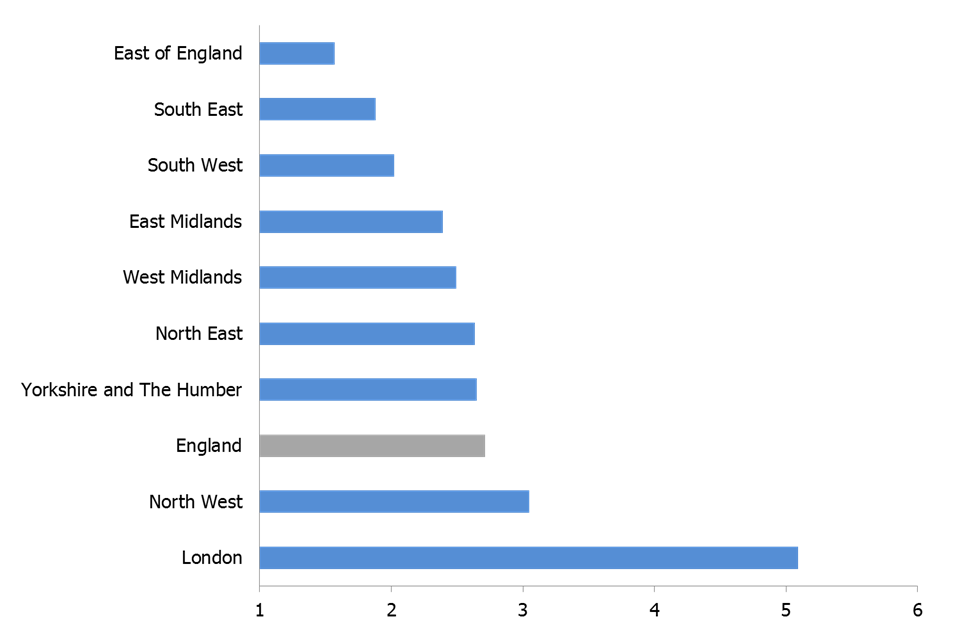
This chart shows the gap between the percentage of non-domestic providers judged good or outstanding and the percentage of childminders judged good or outstanding, for each region.
The proportion of childminders judged good or outstanding drives regional differences in the gap between the proportion of childminders and non-domestic premises judged good or outstanding.
In the East of England, the gap between childminders and childcare on non-domestic premises was only 2 percentage points, and 94% of childminders were judged good or outstanding. Conversely, in London the larger gap of 5 percentage points was due to a lower than average proportion of childminders judged good or outstanding, at 89%.
5. Childminder agencies
Childminder agencies were introduced in September 2014, enabling new childminders to choose to register with Ofsted directly or register with an agency. Existing childminders could also choose to deregister with Ofsted and register instead with a childminder agency. Childminder agencies have the responsibility of inspecting the childminders who are registered with them, with Ofsted inspecting the childminder agencies.
Childminder agencies are only eligible for inspection when they have childminders on roll and there are only 2 overall effectiveness inspection outcomes: ‘Effective’ and ‘Ineffective’. As at 31 August 2017, 11 childminder agencies were registered with Ofsted. Of these, 6 had childminders on roll and were therefore eligible for inspection. Two childminder agencies have been inspected to date and both have been judged ‘Effective’.
Data for childminder agencies is available from the provider level data file at Official Statistics release as at 31 August 2017.
6. Early years provision in the schools sector
Childcare in early years also occurs in the schools sector. This takes place in maintained nursery schools (state-run nurseries), and early years provision within maintained schools and academies.
As at 31 August 2017, there were 400 maintained nursery schools in England. Of these, 398 had been inspected and 99% received a grade of good or outstanding at their most recent inspection.
In maintained schools and academies, early years provision is given its own judgement as part of the overall inspection of the school. Of all early years provision inspected in maintained schools and academies, 90% were judged good or outstanding as at 31 August 2017 – an improvement of one percentage point since 31 March 2017.
Please note that the 90% is based on those schools that had an early years judgement at their most recent inspection. Ofsted did not provide separate graded judgements on the overall effectiveness of early years between January 2012 and August 2014. If the most recent inspection of the school was a short inspection that confirmed the school was still good or outstanding overall, a separate judgement for early years was not provided.
For more information on school inspections and outcomes, please refer to Ofsted’s official statistics on maintained schools and academies inspections and outcomes.
Many independent schools also provide nursery provision. The most recent published data on non-association independent schools relates to the sector as at 31 March 2017, because official statistics on these schools are published twice a year.
For more information, please see Ofsted’s official statistics on non-association independent schools.
Please note that Ofsted only inspects non-association independent schools. Association independent schools are inspected by the Independent Schools Inspectorate (ISI) or the School Inspection Service (SIS).
7. Notes
An explanation about main uses of this data, further contextual information and the arrangements for quality assurance is provided in the methodology and quality report which accompanies this release.
The methodology and quality report also provides information on the strengths and limitations of the statistics.
7.1 Revisions to previous release
The provisional data in the previous release related to inspections which took place between 1 January 2017 and 31 March 2017 and were published by 30 April 2017. A revised list of inspections in this period is provided in Tables 14 to 19 of the Childcare providers and inspections charts and tables document for this release. This revised data includes 16 inspections that were published by 30 September 2017 (that were not published by 30 April 2017).
These revisions did not result in any changes to the key findings identified in the previous publication.
Revisions to data in this publication are published in line with Ofsted’s revisions policy for official statistics.
7.2 Common Inspection Framework (CIF)
Inspections from 1 September 2015 were carried out under the Common Inspection Framework (CIF), meaning that the inspection judgements are common across the Early Years, Schools and Further Education and Skills remits. Ofsted evaluates the overall quality and standards of the early years provision in line with the principles and requirements of the early years foundation stage. Inspectors judge the overall effectiveness of the early years provision, taking into account 4 judgements:
- quality of teaching, learning and assessment
- personal development, behaviour and welfare
- effectiveness of leadership and management
- outcomes for children
Ofsted is required to inspect all providers who were on the Early Years Register (EYR) on 1 August 2016 at least once by 31 July 2020. Providers who have registered after this date will normally be inspected within 30 months of registration.
8. Glossary
Under the Childcare Act 2006 childcare providers register on either or both of 2 registers:
8.1 Early Years Register (EYR)
The EYR is for providers who care for children in the early years age group, from birth to 31 August following their fifth birthday. Registration is compulsory for such providers and they must meet the requirements of the early years foundation stage (EYFS).
All providers on the EYR are inspected on a 4 year cycle. The last inspection cycle ran from 1 September 2012 through to 31 July 2016. The current inspection cycle runs from 1 August 2016 through to 31 July 2020.
8.2 Childcare Register (CR)
The CR is for providers who care for children from birth to 18 years. It has 2 parts:
-
Compulsory Childcare Register (CCR) – for providers caring for children from 1 September after the child’s fifth birthday up until their eighth birthday
-
Voluntary Childcare Register (VCR) – for providers for whom registration is not compulsory, for example nannies, or providers who care for children aged 8 and over
Providers who are registered on either part of the Childcare Register do not need to submit their places information to Ofsted.
For providers registered on the Childcare Register, Ofsted inspects a sample of 10% of active providers per year.
Figure 7: Venn diagram showing the Ofsted registers for childcare providers
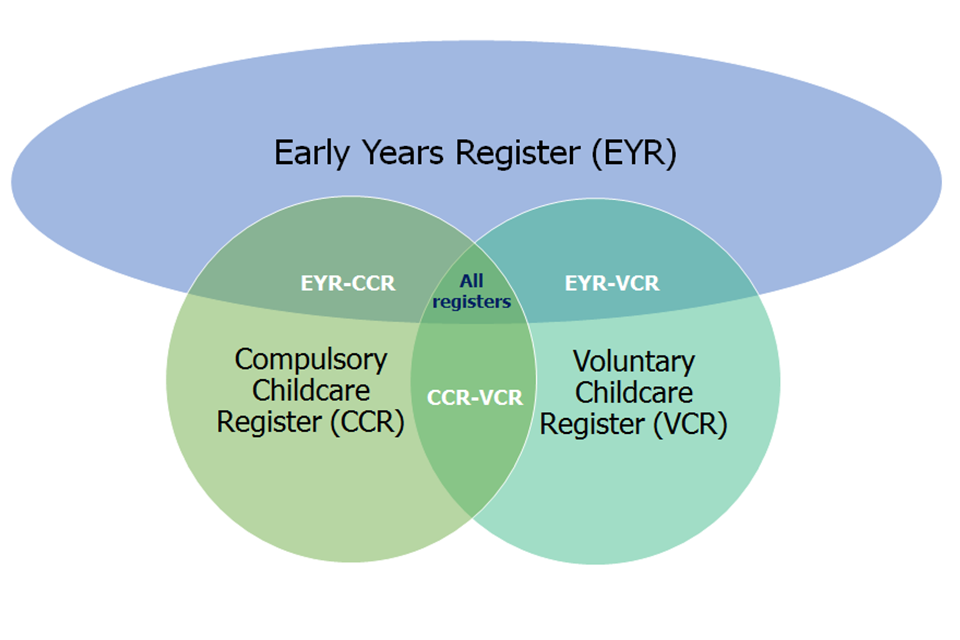
This Venn diagram shows that providers can be on the Early Years Register (EYR), Compulsory Childcare Register (CCR), Voluntary Childcare Register (VCR) or a combination of two or three of the registers.
8.3 Early years foundation stage (EYFS)
The EYFS is the statutory framework for the early education and care of children from birth to 31 August following their fifth birthday.
8.4 Childcare providers
Childcare providers care for at least one individual child for a total of more than 2 hours in any one day. This is not necessarily a continuous period of time. They must register on the CCR to care for children under the age of 8, although there may be some exceptions to this. They can register on the VCR to care for older children.
8.5 Domestic premises
These are any premises which are wholly or mainly used as a private dwelling, i.e. someone’s home.
8.6 Childcare providers on domestic and non-domestic premises
If 4 or more people look after children at any one time in someone’s home, they are providing childcare on domestic premises, not childminding. Childcare providers on non-domestic premises are people or organisations providing care for individual children in premises that are not someone’s home. These premises can range from converted houses to purpose-built nurseries.
8.7 Childminder
This is a person who is registered to look after one or more children, to whom they are not related, for reward. Childminders work on domestic premises alongside no more than 2 other childminders or assistants. They must register if they care for children under the age of 8, and can choose to register if they care for older children. They care for:
-
children on domestic premises that are not usually the home of one of the children unless they care for children from more than 2 families, wholly or mainly in the homes of the families
-
at least one individual child for a total of more than 2 hours in any day (not necessarily a continuous period of time)
8.8 Childminder agencies
Childminder agencies were introduced in September 2014 as an option for childminders to register with. Childminders who register with an agency no longer need to register or be inspected by Ofsted, although the agency itself will receive an inspection.
Childminder agencies are only eligible for inspection by Ofsted when they have childminders on roll. Childminder agencies have the responsibility of inspecting the childminders who are registered with them.
8.9 Home childcarers
Home childcarers are usually nannies who care for children of any age up to their 18th birthday wholly or mainly in the child’s own home, and care for children from no more than 2 families. They are not required to register with Ofsted but may choose to do so on the voluntary part of the Childcare Register.
8.10 Inspection cycles
All providers on the Early Years Register which were registered before the start of Ofsted’s 4 year inspection cycle are inspected within the cycle. The previous inspection cycle ran from 1 September 2012 to 31 July 2016. The current inspection cycle runs from 1 August 2016 to 31 July 2020. New providers joining the EYR are normally inspected within 30 months of registration. For providers on the CCR, a sample of 10% of active providers are inspected per year.
8.11 No Children on Roll (NCOR)
If there are no children present on the day of the provider’s inspection, they receive an NCOR inspection. The inspector will make a judgement on the ‘Overall quality and standards of the early years provision’, with 3 possible outcomes:
- met
- not met – actions
- not met – enforcement action
8.12 Number of places
Registered places are the number of children that may attend the provision at any one time. Registered places are not the number of places occupied, nor the number of children who may benefit from receiving places through providers offering sessions at different times of the day. Place numbers are only collected for providers on the EYR. Provider type averages are used to estimate the number of places for a very small number of providers whose place numbers are not available at the time of the analysis. There may also be small discrepancies in totals due to rounding.
8.13 Joiners and leavers
Joiners are childcare providers that have registered with Ofsted during this reporting period. Most of these are new registrations, but Tables 3–4 and Chart 1 within the Childcare providers and inspections charts and tables document also include providers with re-activated registrations and those that have changed provider type or register. At local authority or regional level, this may also include providers that have relocated into a new geographical area.
Leavers are mostly childcare providers that have left Ofsted during the reporting period. Most of these are resignations, but some are also providers that have had their registration cancelled or have changed provider type or register. At local authority or regional level, this may also include providers that have relocated out of a geographical area.
9. Further information
Ofsted publishes the following information on the inspection of early years providers:
Findings from our forthcoming Annual Report will be published on 13 December 2017.
9.1 Contact for comments or feedback
If you have any comments or feedback on this publication, please contact Anita Patel on 03000 130 914 or Anita.Patel@ofsted.gov.uk.
9.2 Acknowledgements
Thanks to the following for their contribution to this statistical release: Katherine Potts, Louis Noble, Tristan Browne, Helen Woodley.
-
Population data is based on Office for National Statistics population figures for mid-2016. ↩
-
‘All England’ total number of providers includes 47 providers whose region was not recorded. ↩
-
Regions with the highest and lowest proportions of providers to 1,000 children are highlighted in green and orange respectively. ↩
-
Regions are presented in order of smallest to largest gap. ↩
-
In every region, the proportion of non-domestic providers judged good or outstanding is higher than the proportion of childminders judged good or outstanding. ↩