Charitable Giving Indicators 2015/16
Published 23 February 2017

© Crown copyright 2017
This publication is licensed under the terms of the Open Government Licence v3.0 except where otherwise stated. To view this licence, visit nationalarchives.gov.uk/doc/open-government-licence/version/3 or write to the Information Policy Team, The National Archives, Kew, London TW9 4DU, or email: psi@nationalarchives.gov.uk.
Where we have identified any third party copyright information you will need to obtain permission from the copyright holders concerned.
This publication is available at https://www.gov.uk/government/statistics/charitable-giving-indicators-201516/charitable-giving-indicators-201516
0.1 To note:
-
As a result of FRS102 - a new accounting standard which came into effect from 1st of January 2015 - some DCMS-funded cultural institutions included in this report have provided re-stated fundraising/contributed income figures for 2014/15. In addition, £80 million grant-in-aid from DCMS to Historic England in 2014/15[footnote 1] has now been included in the 2014/15 figures to ensure alignment with DCMS accounts. As a result, the overall ratio of charitable giving to grant in aid for 2014/15 has now changed from 54.5 per cent to 49.8 per cent. The overall total fundraising/contributed income and total income figures for 2014/15 have also been updated to reflect these changes. The revised figures have been included in the accompanying table to this publication.[footnote 2] This report compares the 2015/16 charitable giving data against the revised figures for 2014/15, as opposed to the ones used in the previous publication.
-
Both the 2013/14 and 2014/15 total income figures for the Royal Armouries were incorrectly reported in the previous Charitable Giving Indicator publication. The correct figures for the Royal Armouries have now been included in the accompanying table and reflected in the overall total in 2013/14 and 2014/15.
1. Indicators
This release presents the total amount of charitable giving[footnote 3] to DCMS funded cultural institutions (previously a DCMS impact indicator) and the ratio of charitable giving to Grant- in-Aid received by DCMS funded institutions (previously a DCMS input indicator). The cultural institutions included in this year’s measure are, Arts Council England and their National Portfolio Organisations and Major Partner Museums (formerly known as regularly funded organisations), British Film Institute; British Library and the National Museums and Galleries[footnote 4][footnote 5].
1.1 Key Findings
-
Total fundraising income for these DCMS funded cultural institutions in 2015/16 (including donated objects) was £439 million, a 15.6 per cent decrease from £520 million in 2014/15.
-
When donated objects are excluded, their total fundraising was £418 million in 2015/16, a 0.9 per cent decrease from £422 million in 2014/15.
-
The ratio of fundraising to Grant-in-Aid in 2015/16 was 49.7 per cent, a similar level to 2014/15 (49.8%). This means that for every £1 of Grant-in-Aid cultural institutions funded by DCMS received in 2015/16, they generated 49.7 pence in fundraising and/or contributed income.
-
When donated objects were excluded, the ratio of fundraising to Grant-in-Aid increased to 47.3 per cent in 2015/16, compared with 40.5 per cent in 2014/15.
The total income of donated objects is usually dependent on a small number of high value objects and can therefore vary substantially between years. Figures excluding donated objects therefore show the more stable underlying trend in overall fundraising income.
1.2 Charitable Giving 2015/16
In 2015/16, the cultural institutions funded by DCMS collectively raised £439 million in fundraising/contributed income (as defined in Annex A). Approximately £20 million of this was from donated objects (4.7 per cent of all contributed income). A breakdown of this in the context of the total income of these cultural institutions is shown in Figure 1. The total overall income of these bodies in 2015/16 was £2.9 billion.
Figure 1: Total income breakdown for DCMS-funded cultural institutions, 2015/16
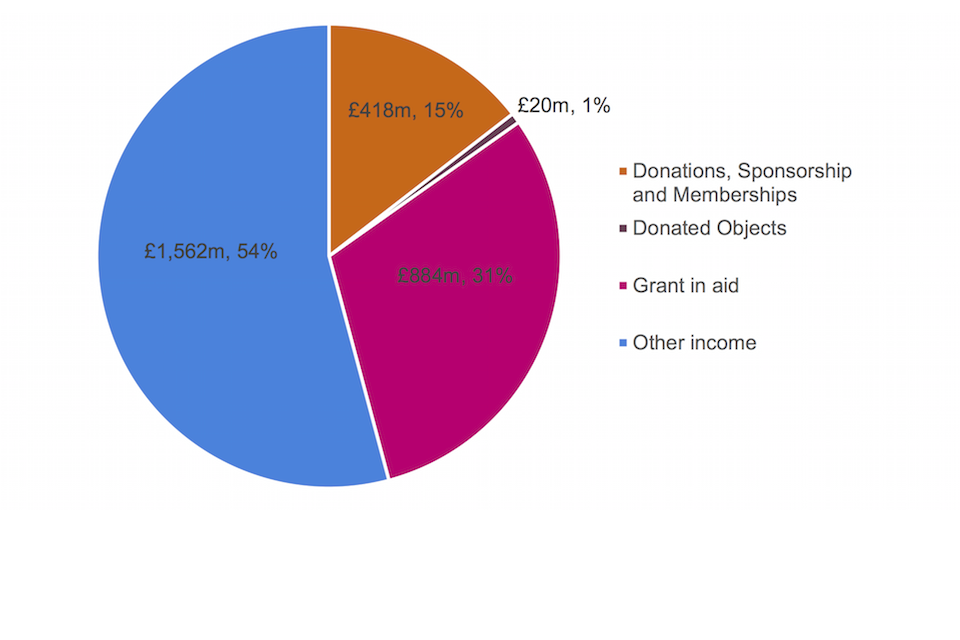
Chart 1
1.3 Ratio of charitable giving to Grant-in-Aid 2015/16
The percentage of charitable giving to Grant-in-Aid was 49.7 per cent. This means that for every £1 of Grant-in-Aid cultural institutions funded by DCMS received in 2015/16, they generated 49.7 pence in fundraising/ contributed income. This is a similar level to 2014/15 (49.8%), but a large increase from 2010/11 when the ratio was 23.9 per cent.
| 2010/11 | 2011/12 | 2012/13 | 2013/14 | 2014/15 | 2015/16 | |
|---|---|---|---|---|---|---|
| Total Fundraising | £250m | £357m | £348m | £476m | £520m | £439m |
| Total Fundraising (Excluding donated objects) | £234m | £274m | £293m | £455m | £422m | £418m |
| Total DCMS Grant-In-Aid | £1,047m | £994m | £1,032m | £974m | £1,043m | £884m |
| Ratio of Fundraising to Grant-In-Aid | 23.9% | 35.9% | 33.7% | 48.8% | 49.8% | 49.7% |
| Ratio of Fundraising to Grant-In-Aid (Excluding donated objects) | 22.3% | 27.6% | 28.4% | 46.7% | 40.5% | 47.3% |
The value of donated objects has varied a lot over time. Donated objects contributed 4.7 per cent to total fundraising in 2015/16 compared to 18.7 per cent in 2014/15 (Figure 2 and Figure 3).
The percentage of Fundraising to Grant-in-Aid excluding donated objects increased steadily over time between 2008/09 and 2012/13, but saw a sharp increase in 2013/14 to 46.7 per cent. It fell to 40.5 per cent in 2014/15, partly due to the £80 million grant-in-aid to Historic England, but increased to 47.3 per cent in 2015/16.
The longer term increase from 2012/13 coincides with a number of cultural institutions running major fundraising campaigns, such as the redevelopment of Tate Modern’s Bankside Power Station, and the Imperial War Museum’s Lambeth redevelopment.
Figure 2: Total income breakdown for DCMS-funded cultural institutions over time, 2008/09 - 2015/16
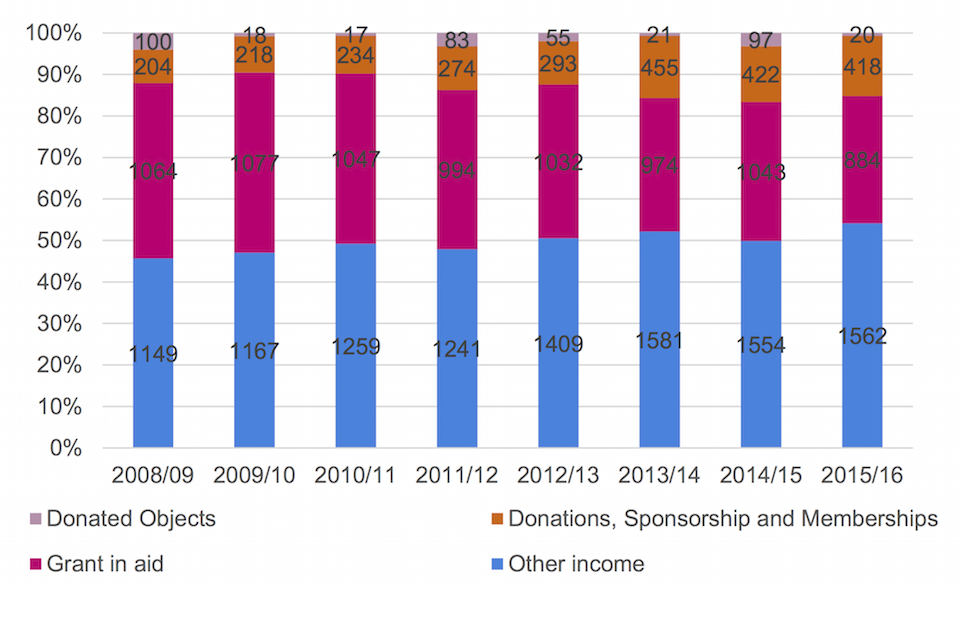
Chart 2
Between 2008/09 to 2015/16, DCMS-funded cultural institutions collectively raised £2.9 billion (when donated objects are included) in fundraising/contributed income.
1.4 Donated objects
Collectively, DCMS-funded cultural institutions received substantially less income from donated objects in 2015/16 than in the previous financial year - £20 million in 2015/16 compared with £97 million in 2014/15. However, income from donated objects tends to be dependent on a small number of high value objects and can therefore vary substantially between years. In 2014/15, for example, the Tate received a number of high value donated art works worth over £70 million in total compared to less than £5 million in 2015/16. Caution should therefore be taken when comparing year on year figures.
Figure 3: Total charitable giving for DCMS-funded cultural institutions (current prices), 2008/09 - 2015/16
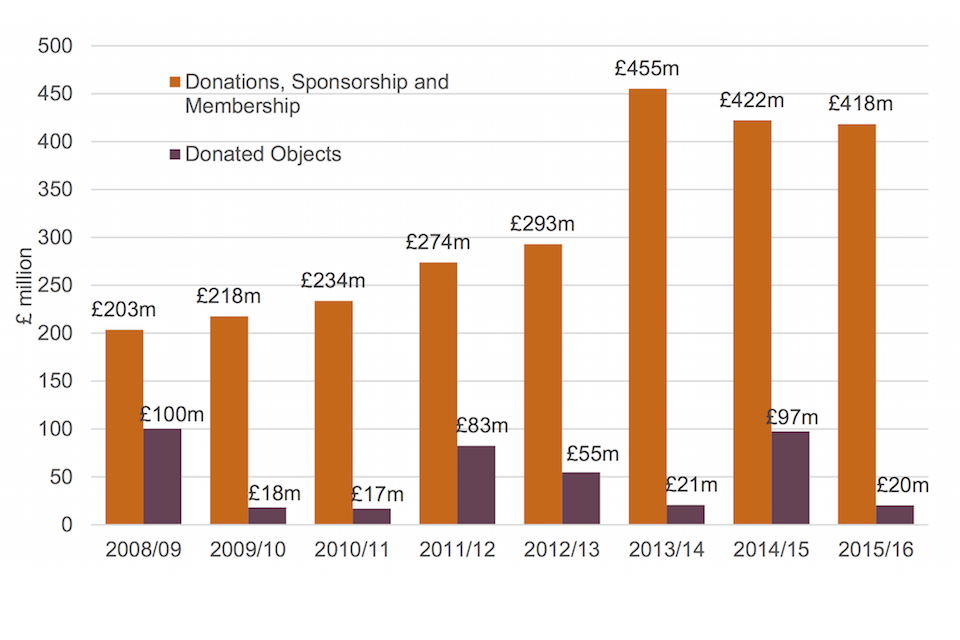
Chart 3
1.5 Use of Independent Trusts
For some institutions included, a percentage of donations will be gifted by donors directly into Independent Trusts. Some Trusts then donate to institutions upon receiving a successful grant application. In these cases the indicator captures the donation when a Trust donates to an institution.
A published table with individual breakdowns by cultural institutions accompanies this report. Individual breakdowns have been included for transparency purposes, to show how the totals were calculated. They are not reported for comparisons between cultural institutions.
2. Annex A: Technical Notes
-
Charitable Giving Indicators is an Official Statistic and has been produced to the high professional standards set out in the Code of Practice for Official Statistics. For more information, see the Code of Practice.
-
Charitable Giving Indicators were part of a series of DCMS Performance Indicators.
-
Definition
Fundraising/contributed income is defined as any money or gift received from an individual, charity or private company in one of the following forms: bequests, legacies, donations and capital grants from individuals, charities, foundations, trusts and private companies; income raised through sponsorship and income from membership schemes. This does not include any money received from a publicly funded organisation, central government grants, investment income or lottery grant funding.
This is summarised below:
| Donations, legacies, bequests and similar income | Included |
|---|---|
| Donated objects | Included, but identified separately |
| Trading income | Not Included* |
| Sponsorship | Included |
| Investment income | Not Included* |
| Admissions & exhibition fees | Not Included* |
| Other income | Not Included* |
| Development funds | Not Included* |
| Donations from connected charities + Other donations | Included |
| Capital grants and donations (not from public bodies) | Included |
| Membership schemes | Included |
| Activities for generating funds | Not Included* |
*All “not included” would be categorised as other income in Figure 1.
Cultural Institutions included in this year’s Indicator:
| Arts Council England | National Museums Liverpool |
| Arts Council National Portfolio Organisations and Major Partner Museums | National Portrait Gallery |
| British Film Institute | Natural History Museum |
| British Library | Royal Armouries |
| British Museum | Science Museum Group |
| Geffrye Museum | Sir John Soane’s Museum |
| Horniman Museum | Tate Gallery |
| Imperial War Museum | Victoria and Albert Museum |
| National Gallery | The Wallace Collection |
| National Maritime Museum |
- Sources
The data used to calculate these indicators are from submissions made by relevant cultural institutions and individual statutory accounts. DCMS Annual Report and Accounts are used for figures relating to Grant-in-Aid funding. This excludes other public funding such as Strategic Commissioning and the Wolfson Foundation fund.
The data source used for the Arts Council England’s National Portfolio Organisations (NPO) (formerly known as Regularly Funded Organisations, RFOs) is based on the NPO annual submission. The figures reported are from the full sample in 2008/09 (850 RFOs), 2009/10 (836 RFOs) 2010/11 (829 RFOs), 2011/12 (832 RFOs), 2012/13 (696 NPOs) and 2013/14 (701 NPOs). Data sources used by the Arts Council can be found here. The RFO Annual Submission figures for 2014/15 and 2015/16 are from the full samples of National Portfolio Organisation and Major Partner Museum respondents.
- In the charts, the sum of the individual elements may not match the total due to rounding.
- For a full list of caveats please see the notes under the published data table that accompanies this release.
- The responsible policy officer for this release is Jade Belletty (jade.belletty@culture.gov.uk) and the responsible statistician is Penny Allen (penny.allen@culture.gov.uk).
- The next release is scheduled for Autumn 2017 and will present the annual estimates for 2016/17.
-
This £80million was given to the Historic Buildings and Monuments Commission for England (‘Historic England’) from DCMS in 2014/15 solely for the purpose of distributing this to the English Heritage Trust. Historic England were therefore not required to report on the amount of charitable income they raised against this amount. ↩
-
For the purposes of this paper the term “charitable giving” is synonymous with fundraising and/or contributed income. This includes donations, sponsorships, memberships and donated objects, as defined in Annex A. ↩
-
For a complete list of cultural institutions included in the 2015-16 indicator see Annex A. ↩
-
Historic England have not been included in this report. Following the split of English Heritage in 2015, the fundraising department was incorporated into the English Heritage Trust. As a result, Historic England’s fundraising is still in its infancy and they have not been asked to provide their charitable/fundraising income data to DCMS. However, they will be expected to provide this data for inclusion in future reports once their level of contributed/fundraising income reaches a level comparable to those of other DCMS-funded cultural institutions. ↩