Centre Judgements: Teaching Staff Survey, Summer 2020
Published 17 May 2021
Applies to England

© Crown copyright 2021
This publication is licensed under the terms of the Open Government Licence v3.0 except where otherwise stated. To view this licence, visit nationalarchives.gov.uk/doc/open-government-licence/version/3 or write to the Information Policy Team, The National Archives, Kew, London TW9 4DU, or email: psi@nationalarchives.gov.uk.
Where we have identified any third party copyright information you will need to obtain permission from the copyright holders concerned.
This publication is available at https://www.gov.uk/government/publications/centre-judgement-research-survey-and-interviews-summer-2020/centre-judgements-teaching-staff-survey-summer-2020
Authors
Steve Holmes, Darren Churchward, Emma Howard, Ellie Keys, Fiona Leahy, Diana Tonin and Beth Black of the Strategy, Risk and Research Directorate.
With thanks to
The authors would like to thank the teaching staff who gave their time to speak to us in depth and share their experiences and views.
Executive summary
The exams and assessments that were due to take place in summer 2020 were cancelled in response to the coronavirus (COVID-19) pandemic. Instead, teaching staff in schools, colleges and training providers in England used their judgement to produce grades (known as ‘centre assessment grades’ or CAGs) and usually also rank orders of students for general and vocational and technical qualifications (and sub-components/units) from Entry Level to Level 3 which students needed to complete to allow them to progress in their education or to employment.
For most qualifications, institutions needed to provide a centre assessment grade for each student and a rank order of students within the qualification entry at that centre. The CAGs were to represent the professional view of the grade students would have received had assessments been able to take place. Some qualifications only required a grade, while others only required a rank order.
Because of the importance of the centre judgements for student progression, and the extraordinary circumstance that Ofqual (the qualifications regulator in England), the awarding organisations and all the relevant teaching staff faced, we wanted to explore the experience and views of teaching staff that were involved. It is important to us and the wider system that we understand as much as we can about this unusual experience and learn from it. The findings from this study have also been important in helping to shape guidance to teaching staff that will apply for teacher assessed grades in summer 2021.
We designed a survey to understand the whole process of making centre judgements, with a series of questions related to different aspects of the process. We ran the survey online for teaching staff in July and early August. The survey closed a week before the A level results day and the subsequent announcement that students would not receive calculated grades – statistically standardised CAGs – but would instead receive the higher of the CAG or the calculated grade.
In total we received 1,234 responses, of which 866 were fully complete. The respondents were from a range of teaching roles, centre types and subjects. We received responses from a fairly high proportion of more senior members of staff such as senior centre management and heads of department, although there were also many teachers and tutors. Partly due to the seniority of some respondents, our sample was very experienced with a median of 17 years’ experience in the teaching profession. Predominantly respondents had worked on making judgements in GCSE, AS and A levels, but almost a fifth of the sample had been involved in vocational and technical qualification judgements.
The headline findings for each section follow.
Broader considerations or contextual factors informing centre judgements
Most of our respondents (81%) were involved in meetings, discussion or information sharing about how the process should work. This included discussion of how to minimise bias in making judgements. In nine out of ten of these meetings or discussions a variety of evidence was looked at, principally work or results from previous years’ students, or consideration of the standard required to achieve particular grades. Respondents indicated that effective or partially effective steps were taken to protect against unconscious bias in 82% of respondents’ centres, with a lot of use of data (in 94% of centres) to analyse any bias in previous years’ grade predictions. Written guidance provided by Ofqual and the awarding organisations on making objective and bias-free judgements was often used and was generally considered to be useful by those who used it (84% for Ofqual’s guidance and 85% for the awarding organisations’ guidance).
Various specialists and additional sources of information were part of the discussions or training on making objective judgements. Whilst the majority (59%) did not think any additional information or resources were needed, some respondents did, with a few indicating more training would have been useful.
Specifics of making judgements for individuals
When it came to deciding how to make judgements for individual students, class teacher/tutors working on qualifications that required both CAGs and rank orders started on grades first (58%) or worked on both CAGs and rank orders together (30%) with only a few determining a rank order first. Determining rank orders was considered to be harder than determining grades by most respondents (58% agreeing against 19% disagreeing).
Largely the same sources of evidence were used and contributed equivalent importance in making judgements for both grades and rank orders. Within general qualifications, mock and practice exams carried by far the greatest weight. Naturally, this varied across subjects, with judgements for those mostly assessed by exam weighing mocks the greatest, and judgements for those subjects assessed more through non-examined assessment or coursework weighing this to a greater degree. When making judgements for vocational and technical qualifications, assignments were considered to be most influential, but a broader range of evidence was considered, reflecting the diversity of assessment in these qualifications.
When asked about other considerations in making their judgements, respondents described a variety of more qualitative considerations outside of marked work evidence that had been considered. Special considerations, personal circumstances, attendance including illness and the student’s trajectory were all frequently mentioned. When presented with a variety of scenarios, most respondents were confident in their judgements, with the lowest confidence in how to compare students with sustained effort and those who were likely to work harder towards the end, supporting the previous observation. They were more confident of other contrasts such as students with variable effort in mocks or differences in behaviour.
Nearly all respondents (91%) had spoken to other members of staff when making judgements about students, almost always remotely (88%) and few reported any major logistical difficulties with the process. Where the teaching of classes was shared, most respondents thought that it was not difficult to agree grades between them and their colleagues (74% easy or very easy) although agreeing the rank orders was a little harder (60% easy or very easy).
Some respondents reported feeling pressurised in relation to their judgements (31%) although they largely reported that their centres had done a good job protecting their staff from external pressures. The pressure felt was largely around the need to make sure their CAGs were not more generous than results at the centre in previous years. The threat of senior management lowering a member of staff’s own CAGs was strongly felt and not popular. Finally, rated confidence in their judgements for those they taught and had produced CAGs and rank orders for was high, with a median (average) rating of 90 out of 100.
Submission checking/agreement at qualification level
Agreeing the full set of judgements across classes for individual qualifications was carried out by a mixture of individuals. Not all class teacher/tutors were involved (only 42% said they were), suggesting that the merging of classes and deciding of overall rank order was often done only by more senior staff such as heads of department and senior centre management – more than 80% of these types of respondents said they were involved. Given that 82% of heads of department said yes this also suggests sometimes it was entirely handled by senior management. Nearly all (94%) of those involved thought that everyone that needed to be involved was involved.
Previous centre results were often used to consider the CAGs, and there was an awareness of the planned statistical standardisation process. Most of the respondents (82%) thought that they had all the information they needed, with a few thinking that more clarity on the standardisation process might have helped. Around half of respondents felt that rank ordering within the whole qualification was difficult, as was combining students across centres, in the small sample where this was required.
Overall satisfaction with this qualification-level agreement process was quite high, with a median rating of 84 out of 100. Of all those individuals who had been involved in making judgements, both for individual students in classes or during the qualification-level agreement process, confidence in the judgements was high, with a median confidence rating of 88 out of 100. The more senior the role, the greater the confidence we saw. Almost half of respondents (47%) thought that their judgements were as fair as grades awarded the previous year through assessments, although more thought the judgements were less fair (31%) than more fair (14%) than the assessments.
Qualification-level lead
Almost half (44%) of our sample took responsibility for the overall centre judgements within one or more qualifications, showing how our sample tended to include individuals who took significant responsibility during the process. They stated a high certainty that the judgements were free from any bias, with a median rating of 95 out of 100.
Head of centre declaration responsibility
Not all head of centre declarations were made by heads of centres in the sample, with 66% of respondents who had made the declaration being in roles other than the formal Head of Centre. These were largely heads of department (40%). Nearly all respondents (97%) in this category indicated they had seen guidance from awarding organisations on how to make the judgements, and most had shared this with their staff, either directly or cascaded through the staff hierarchy. These individuals also reported being sure that the centre judgements were free of bias (median confidence rating of 91 on a scale of 1 to 100) and their overall confidence in the judgements was very high (median confidence rating of 92).
Respondent views of the process
Teaching staff had spent much time working on making judgements, with class teacher/tutors spending a median of 5 days, while more senior staff such as heads of centre had spent 10 days on average. Some individuals spent significantly longer than this.
In order to capture a sense of the whole process, we asked respondents to give us 3 words that captured the whole experience. Across all the responses we received an almost equal mixture of positive and negative words. These indicated that teaching staff were confident of their judgements as fair and professional, but that the experience had been stressful and pressurised because of the responsibility they felt. This was reinforced in open responses which expressed confidence but also uncertainty due to an acknowledgment of the normal unpredictability of student performance in examinations, particularly those students who increased effort just before exams.
Overall summary
Because of the relative seniority of our sample, the data may not be entirely representative of the whole population of teaching staff. However, the findings do give a very good insight into the overall endeavour of making centre judgements, and the professionalism brought to the task by those involved.
1 Introduction
In response to the spread of the Covid-19 virus in 2020 two directions were given by the Secretary of State for Education cancelling exams in general qualifications (GCSE, AS and A level) and exams and other assessments in vocational and technical qualifications. Therefore, in late spring/early summer 2020 staff in schools, colleges and training providers in England were involved in producing centre assessment grades (CAGs) and rank orders for submission to awarding organisations (AOs). These CAGs and rank orders were intended to be the starting point for awarding qualifications to students intending to complete whole or parts of qualifications from Entry Level to Level 3 that summer whose assessments had been cancelled. CAGs were the grades which teaching staff thought students would have been most likely to achieve had exams and assessments gone ahead and the rank orders were the best judgement by the centre of the relative ranking of students within each grade.
Given this unusual situation, and the unprecedented need for staff to make these judgements, we wanted to explore how staff had developed processes to support the production of these grades and rank orders and understand more about the evidence basis used to inform these judgements. We also wanted to understand how staff had responded to and coped in the context of these novel arrangements. These insights will be important for us and the wider system to learn from. Following the cancellation of examinations in 2021 the findings contained in this report have also been useful in highlighting factors for inclusion in guidance for teaching staff working on teacher assessed grades.
We therefore carried out two pieces of work with teaching staff in July and August 2020: an online survey and a series of in-depth interviews. This report describes the online survey.
The requirements for the centre judgements differed across different qualification types and different awarding organisations, depending on the qualification assessment structure. While for general qualifications (GQ: GCSE, AS A level, Pre-U, EPQ) centres had to provide centre assessed grades for each student, together with a rank order within each grade. In vocational and technical qualifications (VTQ), assessment designs are diverse, and different approaches were required. Some qualifications required grades and rank orders, others grades only (including in some cases only Pass/Fail), while others required only rank orders. In VTQ these judgements were often made for individual units or modules, rather than for the whole qualification.
Finally, it is important to remember that these survey responses were received before the decision was taken to award each student the higher of the calculated, statistically-standardised grade or the original submitted CAGs, in place of their calculated grade. This decision was announced on the 17th August 2020. All of the responses (from respondents describing general qualifications and vocational and technical qualifications being statistically standardised) were given in the context that a statistical standardisation process would be applied to the submitted CAGs.
2 Method
We ran an online survey to capture information on as many potential approaches to making centre judgements as we could, with a variety of optional questions that respondents saw depending on previous answers and their role in the larger process. A set of mandatory ‘routing’ questions in the survey automatically determined which questions each respondent saw.
2.1 Survey design
To help design the survey we sent a short set of questions regarding the process used to make judgements to 17 members of the teaching profession that were known through personal or professional contacts. These individuals gave some basic details, from various centre-type and role seniority perspectives to give us some intelligence to help us design the survey structure and questions appropriately.
The final survey questions were also shared with a small number of senior teaching staff to ask for their view on the relevance and appropriateness of the questions. Some questions were adjusted based on this feedback.
The survey was divided into several major sections, which were automatically presented or skipped for individual respondents based upon their answers to routing questions regarding which parts of the centre judgement process they were involved in. We divided the process, and therefore the survey, up into the following main sections:
• Demographic details. Job role, centre type, years in the teaching profession and years at the current centre.
• Class-level judgements. Details for respondents to complete on the subjects for which they were involved in making judgements for individual students, including the number of classes and students.
• Broader consideration or contextual factors to inform the judgements. This section included questions for those involved on planning, training and discussions around how the process would work, either before or during the judgement process, with a focus on making objective and bias-free judgements.
• Specifics of making judgements for individuals. This section focussed on how judgements were made, what evidence was used and levels of confidence, so were intended for class teacher/tutors, although those involved with the judgement process centrally using data may also have answered these questions.
• Submission checking/agreement at qualification-level. This section focussed on the agreement process between members of staff involved in a qualification to produce the whole set of CAGs and rank orders for that qualification. These judgements would sometimes have been passed to senior management who may have made adjustments, or these might include the final judgements that would have been submitted, but prior to the signing of the centre declaration form by the responsible manager.
• Qualification-level lead. The questions in this section were answered by the person who had taken overall responsibility for whole-qualification judgements, leading the discussions/decision in the previous section and having final decision making, prior to sign-off and submission.
• Centre declaration responsibility. This section was for those people who had signed Head of Centre declaration forms for one or more qualification centre judgement submissions. The Head of Centre could delegate the signing of this declaration to other predominantly senior members of staff.
• Final summing up questions for all respondents
There were also some sub-sections with optional questions within these main sections, depending on particular aspects faced by individual respondents.
The survey was implemented and distributed online using SmartSurvey software. It was launched on 10 July 2020 and was live until 6 August 2020. The survey comprised 84 questions in total. An individual who was involved in every stage of the process from planning meetings, making judgements for individual students all the way through to signing the centre declaration form, could have answered the entire survey.
The questions primarily required closed responses, but there were opportunities for open responses to allow respondents to explain or clarify an earlier response. The survey was designed to take respondents between 10 and 30 minutes to complete, depending on how many aspects of the centre assessment process they were involved in, and how full they wanted to make their open responses. The survey had to be completed in one sitting.
2.1 Respondents and geographical coverage
Teaching professionals who had been involved in any part of the centre judgement process were invited to respond to the survey through a series of announcements that the survey was running made through a range of communication channels. Announcements continued for 2 weeks while we monitored the response rate.
Ofqual regulates qualifications in England. The aim of the survey was therefore to gain a picture of the experiences of teaching staff in England, and this was made clear to respondents. However, we did not collect geographical information on the survey and so it is possible that there may have been some responses from other parts of the United Kingdom.
2.2 Information provided to respondents
Having followed the links in the announcements, potential respondents saw an information screen (in Annex A) detailing the purpose of the survey, who it was intended for and specifics of data handling, to help them decide whether they wanted to complete the survey and were qualified to do so. If they confirmed that they had completed their submission of CAGs and rank orders and wanted to continue to the full survey respondents entered the full survey. If they did not confirm both statements, the survey ended.
Following completion of the survey, respondents indicated if they would like to be considered for a follow-up interview to explore their experience in more depth. This strand of the research is detailed in a separate report.
3 Centre Judgement Survey Results
In total, 1234 teaching staff completed or partially completed the survey. Specifically, 866 respondents fully completed the survey and 368 responded partially. We only counted partial responses where they had answered at least one substantive question within a section other than the respondent characteristics section. There was therefore a 70% full completion rate (those who reached the final survey page). Drop-out increased as respondents progressed through the survey so there are fewer responses to the later questions.
Nearly all the questions were optional, except the key routing questions that were used to determine which sections each respondent saw based upon their involvement in different parts of the centre judgement process. Because we did not force an answer to be entered for the non-routing questions, respondents were free to choose not to answer and the number of responses varies across questions. We state the number of responses for each question as (N = xxx).
We present the results in sections relating to different aspects of the process with individuals answering sections depending on their involvement.
3.1 Demographic Details
All respondents to the survey answered the demographic questions in this section.

Bar chart showing responses to the question described in the caption for Figure 1 and the text that follows it.
Figure 1: Which of the options below best describes your role? (N = 1234)
The question shown in Figure 1 was a forced choice between the following options:
- Deputy/ Assistant Head of Department
- Deputy/Assistant Head of Centre
- Head of Centre
- Head of Department
- Other Senior Leadership Team role
- Teacher or tutor
- Other (please specify)
Before analysing the responses, we recoded the written descriptions in the ‘Other’ category, which were usually precise job titles, into several new categories or existing categories where they fitted, or left them as ‘unknown’.
The two most common job roles for which we received responses were head of department (471 responses) and teacher/tutor (422 responses). A large number of senior leadership staff also replied, with over 250 individuals categorised as senior management (head or deputy/assistant head of centre, other senior leadership team role). This cross-section is not representative of the overall population of teaching professionals in England. Instead the bias towards more senior individuals probably indicates those people with the highest stakes in the centre judgement process who were most keen to have their voice heard, or those that were most aware the survey was taking place or were perhaps acting as representatives for their centre.

Bar chart showing responses to the question described in the caption for Figure 2 and the text that follows it.
Figure 2: Which of the options below best describes your centre? (N = 1234)
The question shown in Figure 2 was a forced choice between the following options:
- Academy
- Free school
- Further education establishment
- Independent school (inc CTCs)
- Secondary comprehensive
- Secondary modern
- Secondary selective. e.g. grammar or technical
- Sixth form college
- Tertiary college
- Training provider
- Other (please specify)
Again, before analysis we recoded the written descriptions in the ‘Other’ category into several new categories or existing categories where they fitted, or left them as ‘unknown’.
The most frequent categories of centre type were secondary comprehensive (426 responses) and academy (306 responses). There were 138 responses from independent schools and 103 from sixth form colleges. This distribution of centre types is again probably a reflection of how much individuals at different centre types were motivated to give their views.

Bar chart showing responses to the question described in the caption for Figure 3 and the text that follows it.
Figure 3: How many years have you held a position in your current centre? (N = 1222)
The median length of time the respondents had held a position in their current centre was 6 years (see Figure 3), suggesting that we have a sample of individuals who mostly are not new to their centre. One individual had held posts in their centre for 38 years.

Bar chart showing responses to the question described in the caption for Figure 3 and the text that follows it.
Figure 4: How many years have you been in the teaching profession? (N = 1218)
Similar to the previous question, we had a sample of respondents with a great deal of experience in the profession, reflecting the significant number of senior staff members in our sample. The median duration in the teaching profession was 17 years, with 110 (9%) having 30 or more years’ experience (see Figure 4).
3.2 Class-level centre judgements
All respondents to the survey were asked the first routing question below, and then those who answered yes completed the rest of this section which requested details about the subjects and classes for which respondents made judgements for individual students.
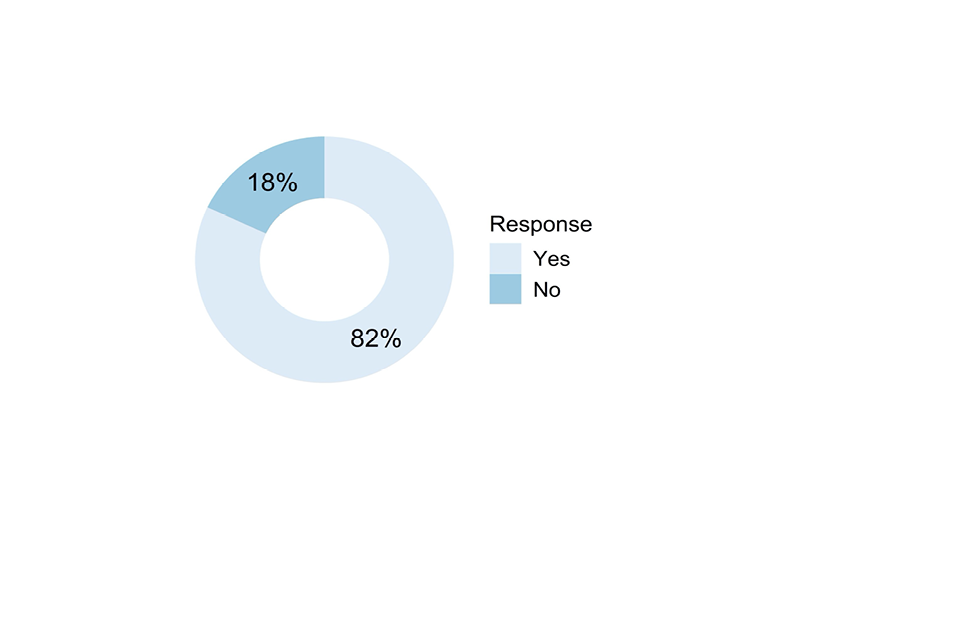
Doughnut chart showing responses to the question described in the caption for Figure 5 and the text that follows it.
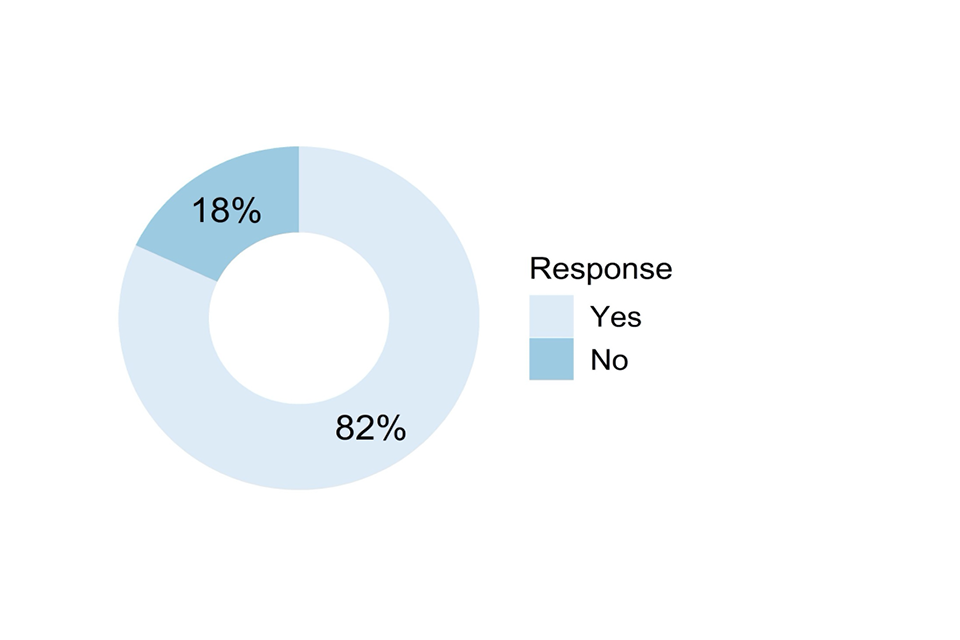
Figure 5: Did you generate Centre Assessment Grades for individual students you taught directly? (N = 1234)
Eighty-two per cent (1015) of survey responses came from individuals who had determined grades for students they taught directly (see Figure 5). These respondents all had the opportunity to respond to the following questions in this section regarding the subjects they taught, and also the questions that are described in Section 3.4.

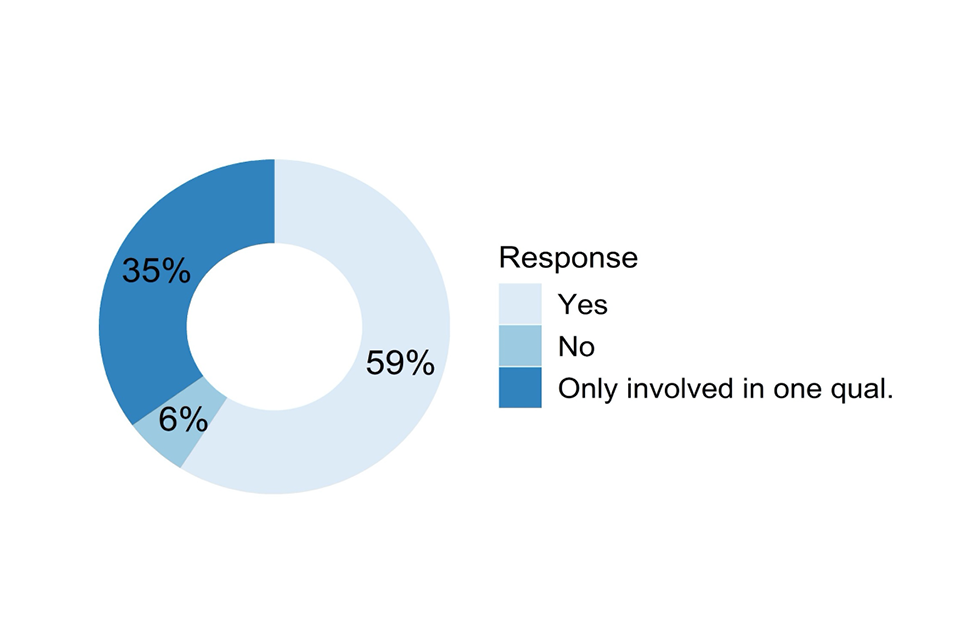
Doughnut chart showing responses to the question described in the caption for Figure 6 and the text that follows it.
Figure 6: Which qualification types were you involved in generating Centre Assessment Grades for? (N = 1015)
The question shown in Figure 6 was a forced choice between the following three options:
- General Qualification (i.e. GCSE, AS, A level, EPQ, Advanced Extension Award, Pre-U)
- Vocational, Technical or Other Qualification (such as BTEC, Applied General, other Vocational/Technical * Qualification)
- Both of the above categories
The majority of our respondents made judgements for GQ subjects (GCSE, AS, A level, Advanced Extension Award Pre-U or EPQ), with 81% involved in GQ only plus 13% involved in both types. However, although few were involved in VTQ alone (6%), together with the 13% involved in both GQ and VTQ we had 193 responses from those involved in VTQ teaching.
a) GCSE

Bar chart showing responses to the question described in the caption for Figure 7 and the text that follows it. These are specifically GCSE responses.
b) AS level

Bar chart showing responses to the question described in the caption for Figure 7 and the text that follows it. These are specifically AS responses.
c) A level
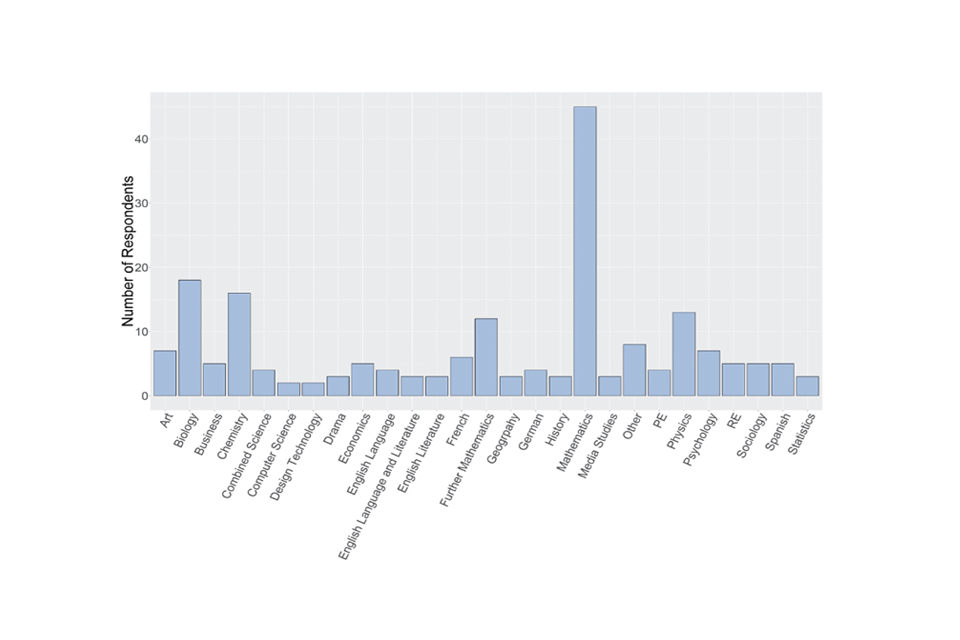
Bar chart showing responses to the question described in the caption for Figure 7 and the text that follows it. These are specifically A level responses.
Figure 7: Which a) GCSE, b) AS level, or c) A level subjects were you involved in generating Centre Assessment Grades for? (N = 957)
Those respondents who were involved in making class-level judgements for GQ or both qualification types were asked to indicate in which subjects and levels they made judgements (Figure 7). A grid of subjects by level were presented with check boxes, with an ‘Other’ option into which they could indicate enter free text. Some of the ‘Other’ responses typed in were recoded as new subject categories where they occurred several times.
We have split the data into GCSE, AS and A level to make the graphs easier to interpret – please note that the vertical scale is different for each graph, for example there are far fewer responses for AS than for GCSE, reflecting the entries for these different levels. The extended project qualification (EPQ) is included on the A level graph.
We had a substantial number of responses from those who taught mathematics, at all qualification levels. Following mathematics, the science subjects and English subjects were next most common in our sample. This does not represent the national picture of class teacher/tutors, with a bias towards numerical subjects. One notable finding was that within AS subjects there was a very large number of those involved in mathematics judgements. This may reflect different AS entry patterns across subjects.
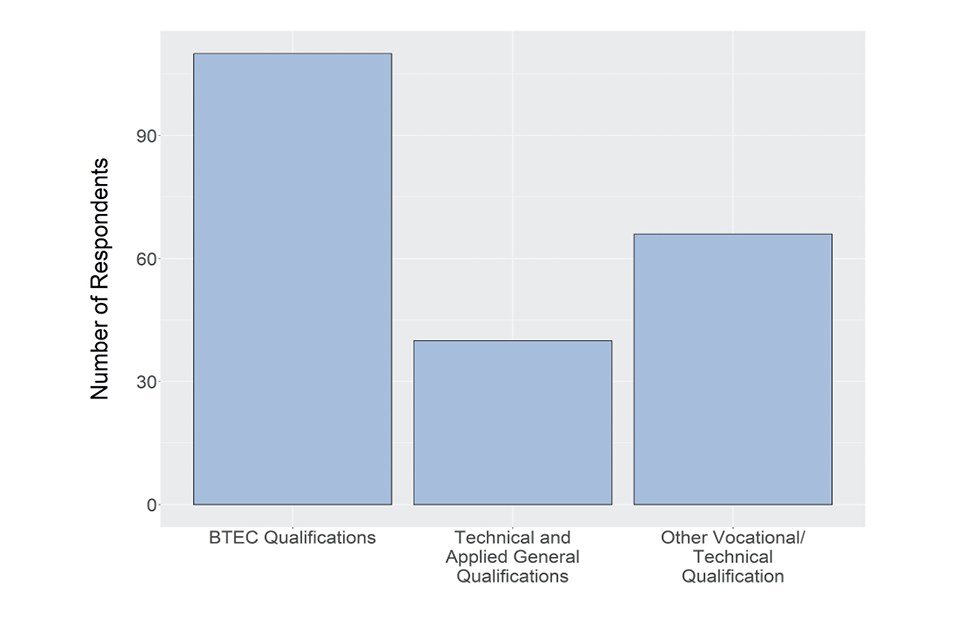
Bar chart showing responses to the question described in the caption for Figure 8 and the text that follows it.
Figure 8: Which Vocational or Technical qualification subjects were you involved in generating Centre Assessment Grades for? (N = 193)
The question shown in Figure 8 was a forced choice between the following three options:
- BTEC Qualifications
- Technical and Applied General Qualifications (not BTEC)
- Other Vocational/Technical Qualification
The most frequent VTQs for which respondents were involved in making judgements were BTEC qualifications, with 57% (110) of the respondents. Twenty-one per cent of respondents taught technical and applied general qualification, and 34% other vocational or technical qualifications.
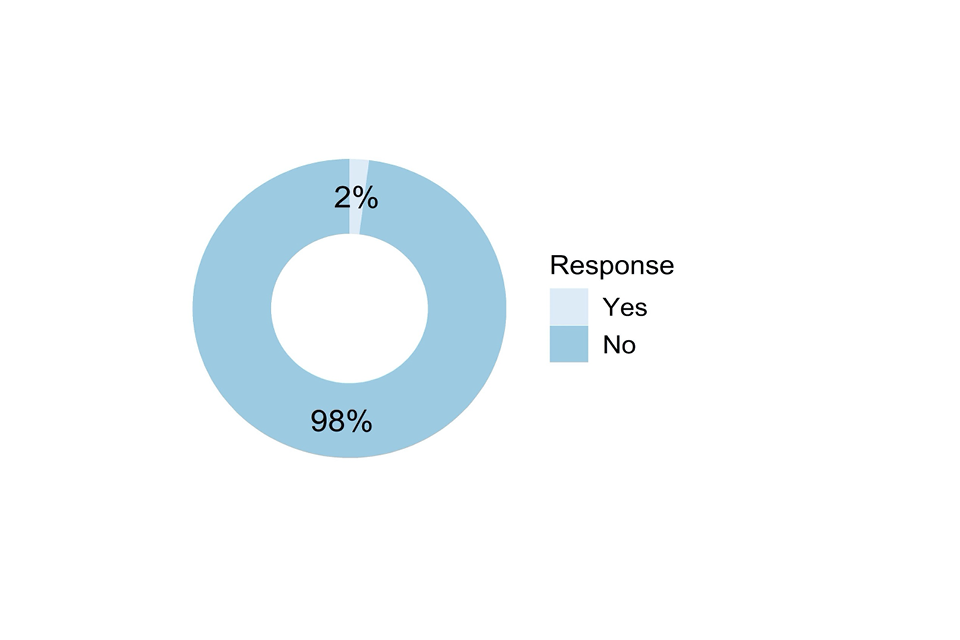
Doughnut chart showing responses to the question described in the caption for Figure 9 and the text that follows it.
Figure 9: Were there any classes you teach which are receiving grades this year for which you were not involved in generating Centre Assessment Grades? (N=1007)
Only 2% (24) respondents indicated that they taught classes which they were not involved in making judgements for (see Figure 9). We asked respondents to give additional detail and there 23 out of 24 respondents provided more detail. The reasons given mostly related to the process used by the centre, that another member of staff had made the judgements for the students. Otherwise, the main reasons related to limited teaching of that class, for example where teaching was shared.
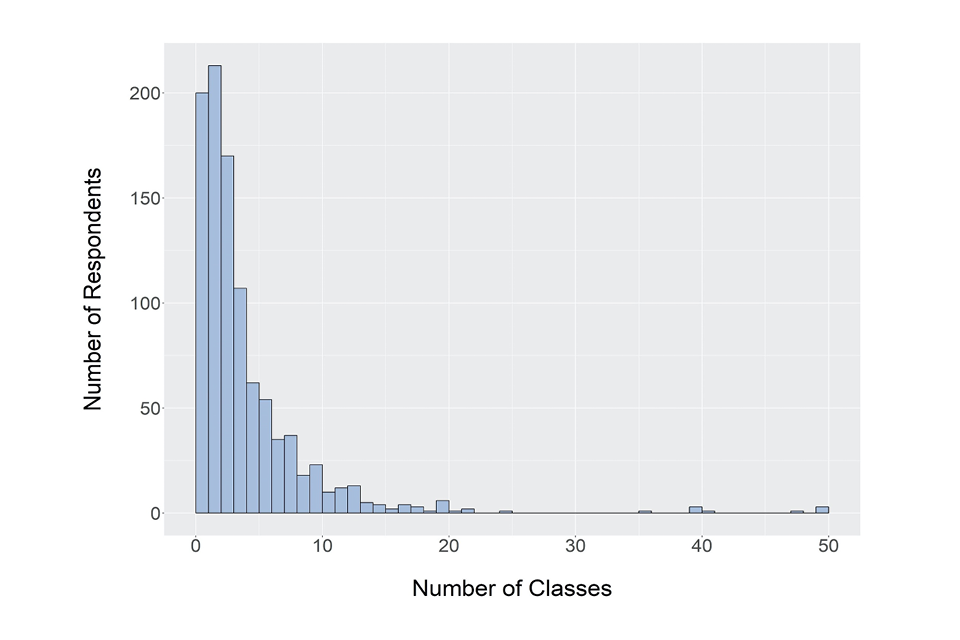
Bar chart showing responses to the question described in the caption for Figure 10 and the text that follows it.
Figure 10: How many classes did you generate Centre Assessment Grades for? (N=992)
Most respondents taught more than one class, with a median of 3 classes (see Figure 10). There were a few very high counts. These represent senior staff who may have also included classes where they did not make individual student judgements, but were closely involved in the agreement process for those classes.
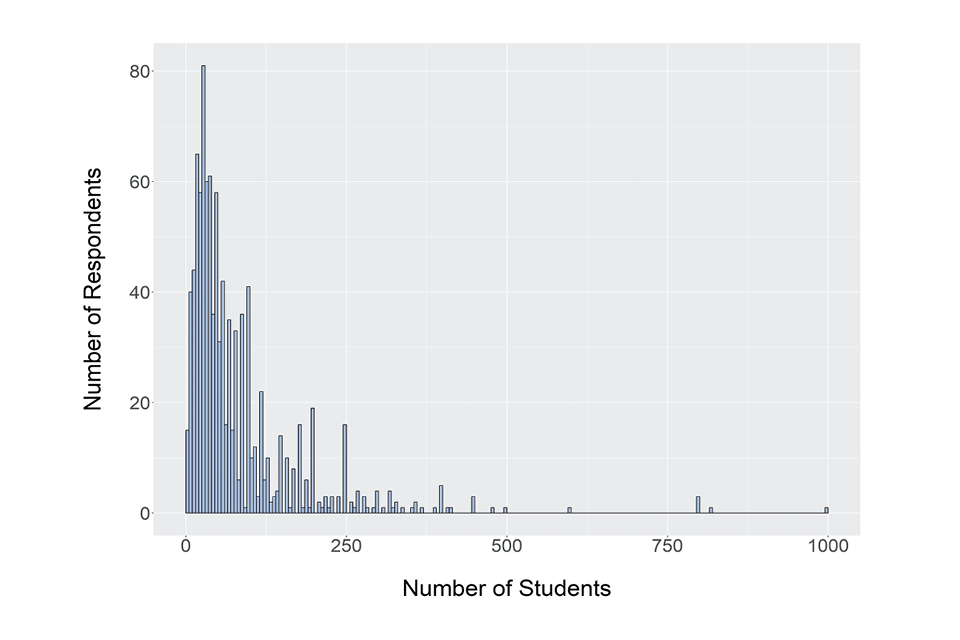
Bar chart showing responses to the question described in the caption for Figure 11 and the text that follows it.
Figure 11: How many students in total did you generate Centre Assessment Grades for? (if you are unsure of the exact number please give an estimate). (N = 999))
The median number of students for whom respondents made judgements was 50 students (see Figure 11), broadly equivalent to 2 classes in many settings. The mean was 82.3, which is much higher because of the small number of very high numbers given by a few respondents. Some of these high counts will probably not involve judgements for individual students, but an involvement of more senior staff in some part of the process for many students, much like the previous question.
3.3 Broader considerations or contextual factors informing centre judgements
This section related to training and discussions around how the centre judgements would be made. There were questions about some of the broader considerations or contextual factors that may have been considered before and during the time centre assessment grades were being worked on by class teachers. All respondents to the survey were asked the first mandatory routing question below, and then those who answered yes completed the rest of the questions in this section.
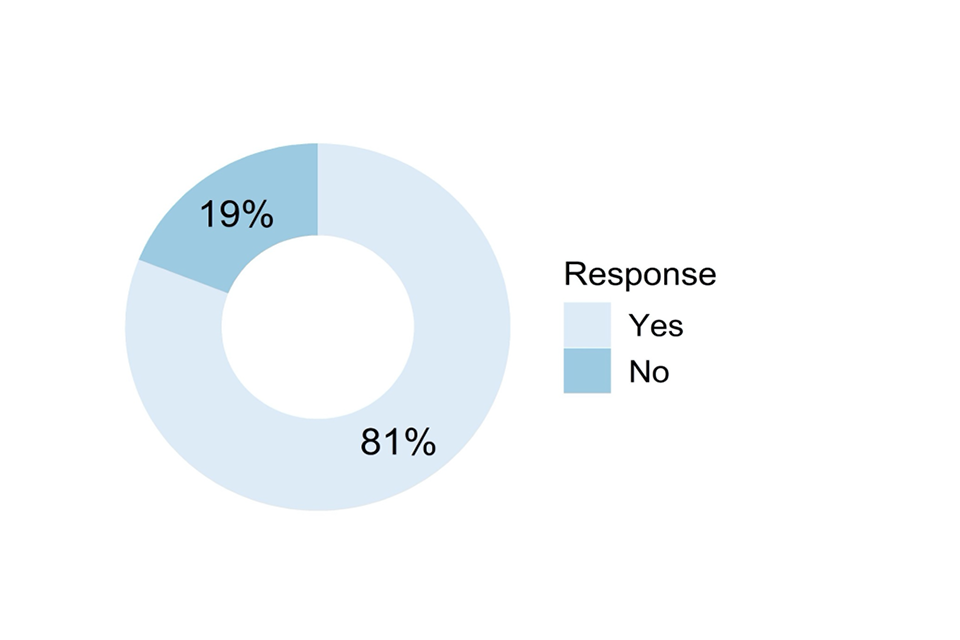
Doughnut chart showing responses to the question described in the caption for Figure 12 and the text that follows it.
Figure 12: Were you involved in any meetings, discussions, or the sharing of information on broader considerations or contextual factors around generating Centre Assessment Grades, before or during the period when teachers/tutors were generating class-level grades? For example, training on how to make the grade judgements or the avoidance of bias. These may have been at a centre, department or qualification level. (N = 1234)
Of those staff who were involved in making class-level judgements, 81% had been involved in meetings and discussions around how to make judgements (see Figure 12). These respondents were presented with the questions in this section.
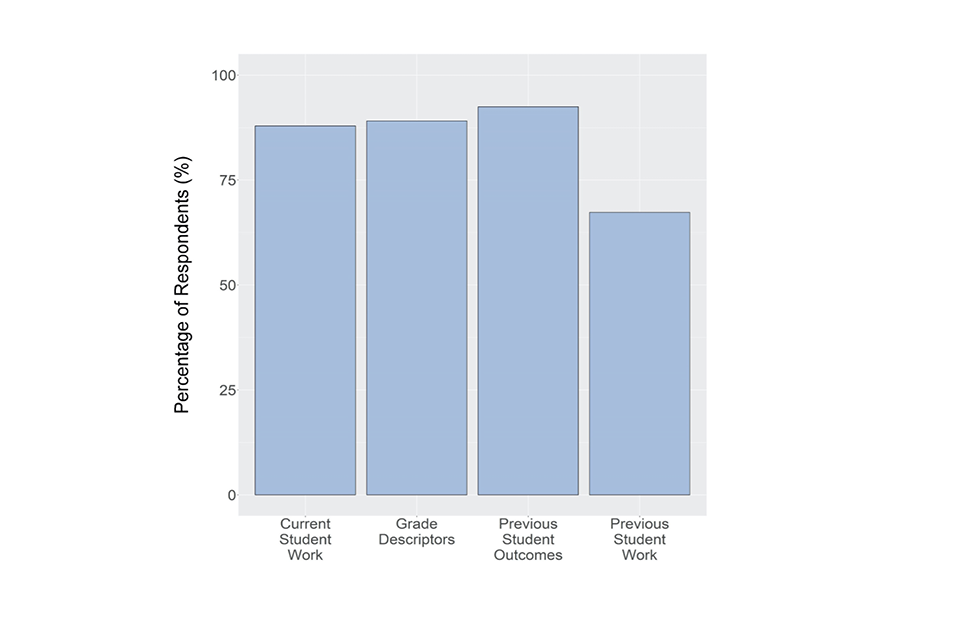
Bar chart showing responses to the question described in the caption for Figure 13 and the text that follows it.
Figure 13: Did you consider/look at the following in any meetings/discussions before or during the generation of Centre Assessment Grades? (N = 951)
The question shown in Figure 13 had the following response options, with a Yes/No response for each:
- Any of this year’s actual candidate work to consider overall standards (rather than individual student achievement)
- Grade worthiness/descriptors/standards
- Previous years’ student outcomes
- Previous years’ candidate work (e.g. examination scripts, NEA, coursework)
Current student work, grade descriptors and previous student outcomes were all used in some form in discussions or training by around 90% of respondents, and only previous student work was used less frequently (67%). A number of strong sources of information were therefore considered by most respondents.
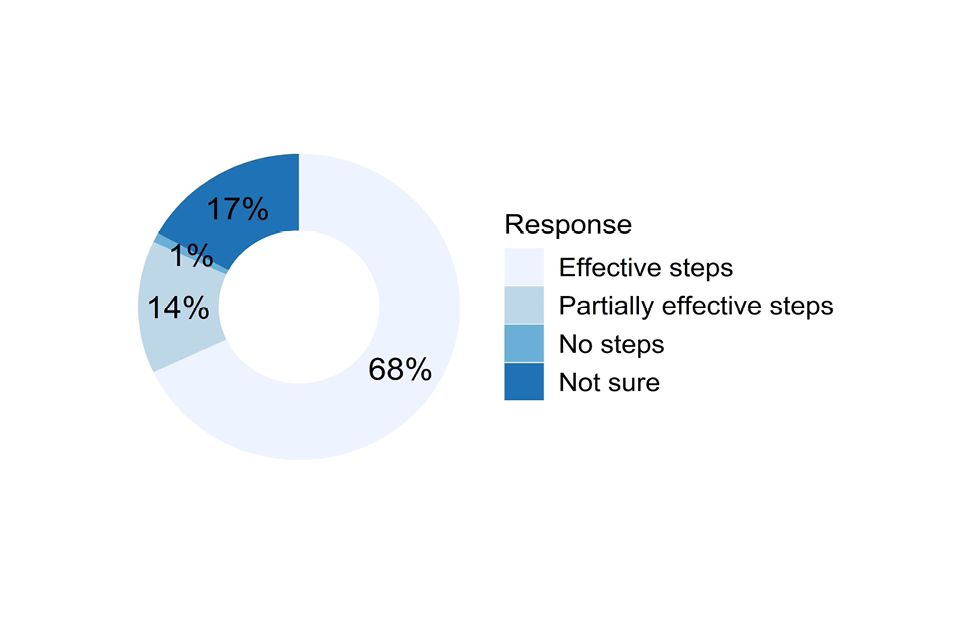
Doughnut chart showing responses to the question described in the caption for Figure 14 and the text that follows it.
Figure 14: Were you aware of any steps taken by your centre to protect against unconscious biases in the whole process? (N = 953)
The question shown in Figure 14 was a forced choice between the following four options:
- Yes – there were effective steps taken
- Yes – there were some partially effective steps taken
- Not sure – there may have been some steps taken but I was not aware
- No – no steps taken
Steps were taken in most centres to protect against bias, and most (82%) of these steps were considered by our respondents to be effective (68% effective and 14% partially effective). Only in 14 cases (1%) were no steps taken. The respondents who indicated they were not sure (17%) suggests that they did not directly experience any steps or instructions themselves, but were unsure of whether further checks or steps took place beyond their immediate contribution to the centre judgements. The 82% who said that effective or partially effective steps were taken were asked a follow-up question.
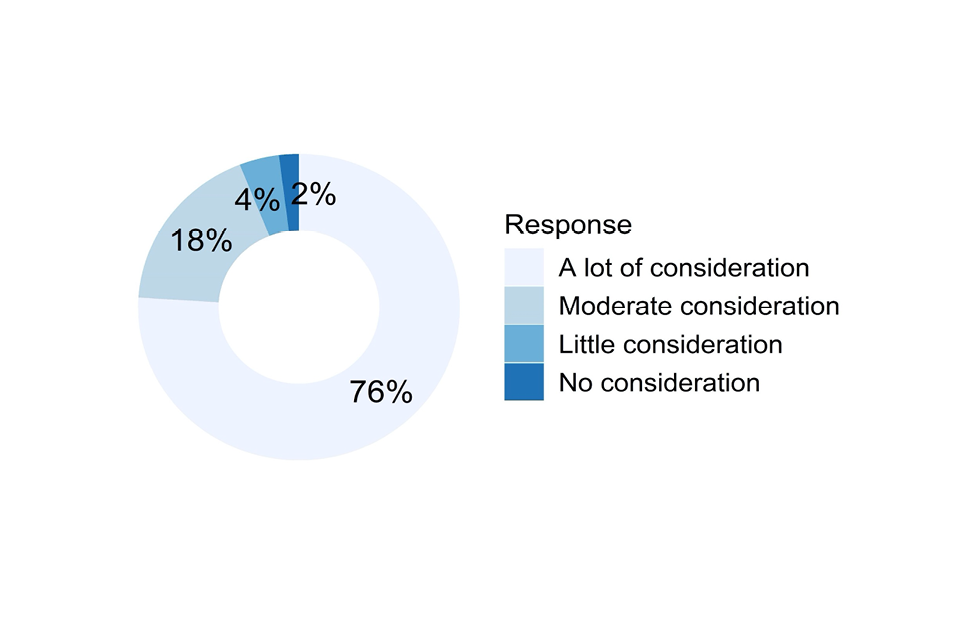
Doughnut chart showing responses to the question described in the caption for Figure 15 and the text that follows it.
Figure 15: Did your centre look at previous years’ data to reflect on potential systematic under- or over-prediction (e.g. for different groups of students such as those with protected characteristics)? (N = 766)
The question shown in Figure 15 was a forced choice between the following four options:
- Yes – there was a lot of consideration
- Yes – there was a moderate amount of consideration
- Yes – there was a little consideration
- No – there was no consideration
Of those respondents who answered this question, 76% said that there was a lot of consideration of data when thinking about over-and under-prediction, with 18% giving a moderate amount of consideration to data. Since less than 3% of respondents (19 in total) said no consideration had been given, previous data was a broadly used way of investigating the issue of bias in judgements.
Ofqual and most awarding organisations produced written guidance around making objective judgements without bias and shared these with centres either through email or publications on websites. We asked about awareness of this information, and for those who said they were aware, whether the information had been useful.

Doughnut chart showing responses to the question described in the caption for Figure 16 and the text that follows it.
Figure 16: Were you aware of the Ofqual guidance about making objective judgements and the avoidance of bias? (N = 937)
Ninety per cent of the respondents involved in discussions around the centre judgement process stated that they were aware of the guidance on making objective judgements and avoiding bias published by Ofqual (see Figure 16). Respondents who answered ‘Yes’ to this question then saw the following question.
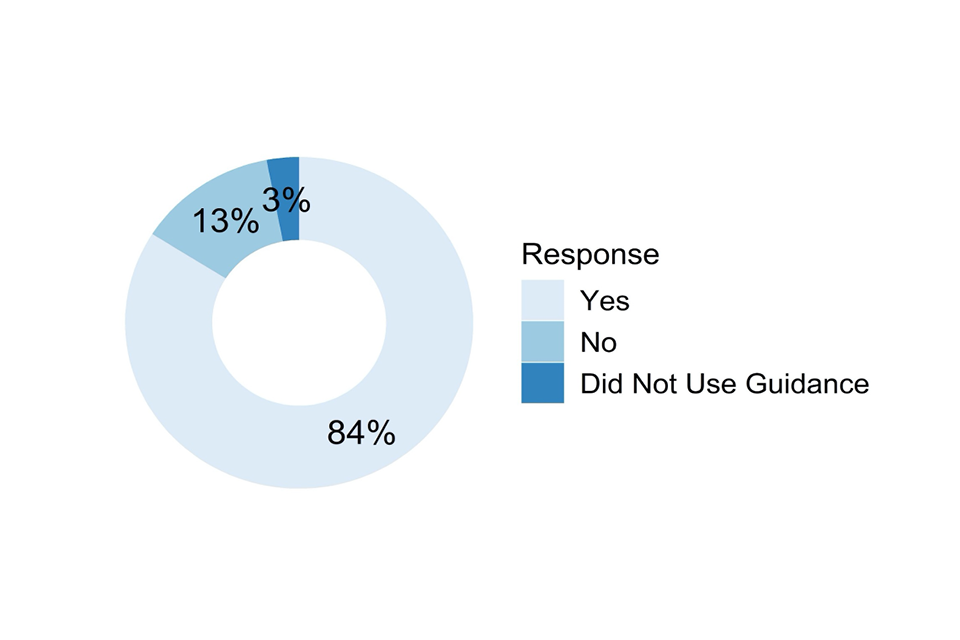
Doughnut chart showing responses to the question described in the caption for Figure 17 and the text that follows it.
Figure 17: Was the Ofqual guidance about making objective judgements and the avoidance of bias useful? (N = 837)
Eighty-four per cent of those respondents who had been aware of the guidance agreed that it was useful (see Figure 17). Thirteen per cent thought it was not and 3% did not use the guidance.

Doughnut chart showing responses to the question described in the caption for Figure 18 and the text that follows it.
Figure 18: Were you aware of any guidance about making objective judgements and the avoidance of bias provided by the Awarding Organisation/Exam Board? (N = 912)
Sixty-six per cent of the respondents stated that they were aware of the guidance on making objective judgements and avoiding bias produced by awarding organisations (see Figure 18). The awarding organisation guidance was typically released a little after the Ofqual guidance, and so may not have been shared quite as widely. However, it still reached the majority of our respondents. Respondents who answered ‘Yes’ to this question then saw the following question.
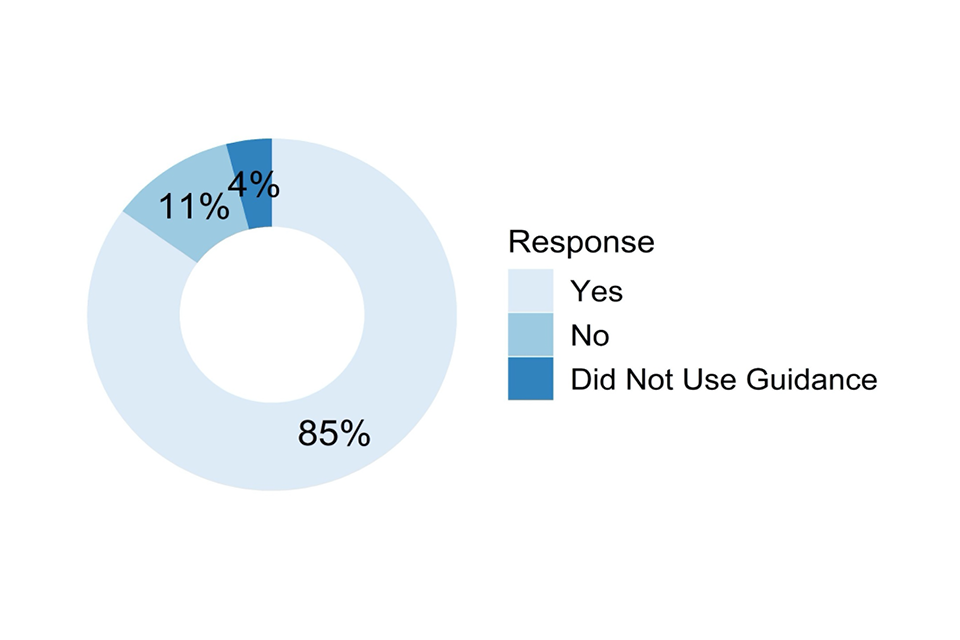
Doughnut chart showing responses to the question described in the caption for Figure 19 and the text that follows it.
Figure 19: Was this guidance from the AO/exam board about making objective judgements and the avoidance of bias useful? (N = 594)
Eighty-five per cent of respondents who were aware of the awarding organisation guidance agreed that it was useful (see Figure 19). Eleven per cent thought it was not and 4% did not use this guidance. These are very similar proportions to those expressed for the Ofqual guidance.

Bar chart showing responses to the question described in the caption for Figure 20 and the text that follows it.
Figure 20: Were any of the following included as part of discussions/training around making objective judgements and the avoidance of bias? (N = 852)
The question shown in Figure 20 had the following response options, with a Yes/No choice for each:
- Academic research
- Special Educational Needs and Disability (SEND) experts
- Special Educational Needs Co-ordinator (SENCo
- Other specialists on diversity/reasonable adjustments
- Staff training on bias
- Other resources (e.g. online) not provided by Ofqual or the Exam Board/Awarding Organisation
The most frequently reported inclusion were Special Educational Needs Co-ordinators (SENCos) who were involved in the experience of 48% of respondents. The least frequently reported inclusion was academic research, used in 23% of cases. This finding is not surprising given the tight timeframes in which much of this work was done, meaning that the time required to read and absorb academic research was probably not always available.
Doughnut chart showing responses to the question described in the caption for Figure 21 and the text that follows it.
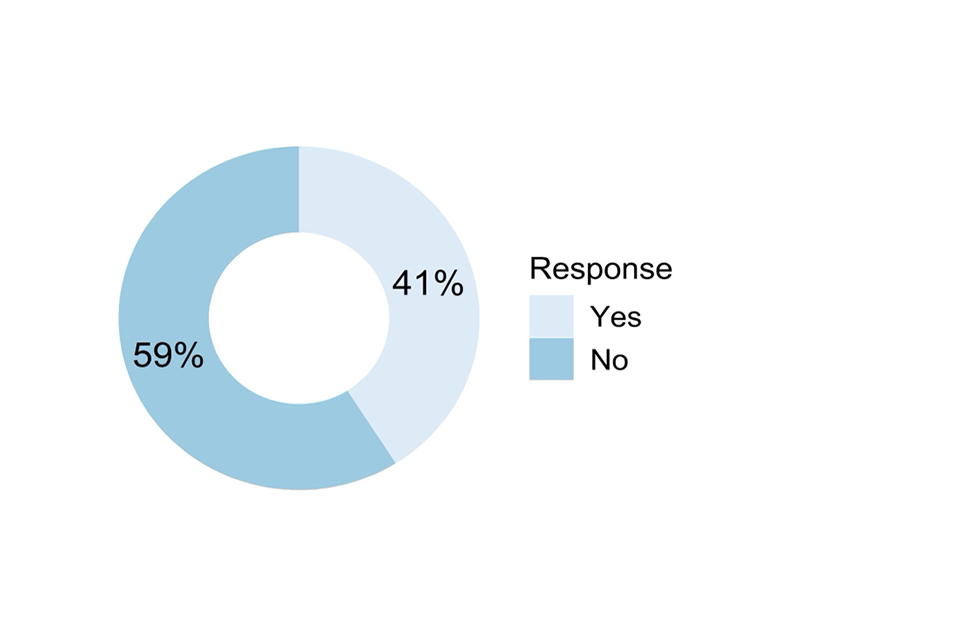
Figure 21: Would more information/resources have been useful when considering the issue of making objective judgements and the avoidance of bias? (N = 842)
Fifty-nine per cent of respondents did not think that any more information or resources would have helped with making objective and bias free judgements, suggesting that most thought the information and resources they had were sufficient (see Figure 21). We asked for any additional comments from respondents. There were 129 free text responses to this question giving more detail. Around 55 expressed overall confidence in their judgements, referring to teacher expertise, centre-devised training or guidance, the use of a data driven process and the QA process devised within the centre to ensure the judgements were fair. These reasons explained why they thought no additional information was required.
A few also disputed the idea that any bias would occur. About a dozen also said that the guidance made available was sufficient, or that within their subject bias was rarely a problem, often because judgements were based on actual completed coursework. Four respondents expressed that there had been information overload around avoidance of bias, and 14 responses referred to the bias guidance being too late for them. An additional 7 people said a lack of time has been a limiting factor. Lack of consistency on the AO guidance (both across AOs and changing guidance over time from individual AOs) was also noted by 7 people. More training, including mandatory training on bias, plus the use of additional research and case studies were mentioned 11 times. Finally, 5 people noted that it was impossible to rule out all bias, whatever processes had been put in place.
3.4 Specifics of making judgements for individuals
The questions in this section were asked of the respondents who earlier had responded yes to “Did you generate Centre Assessment Grades for individual students you taught directly?” on page 22. The questions in this section were focussed on how judgements had been made for individual students. If respondents had been involved in making judgements for more than one qualification, we asked the respondents to select one to think about specifically when they answered all the questions. We suggested that this be the qualification for which they taught the most students, or that they felt was most representative of their experience.
We asked them to type the qualification they were choosing into a free text field. Due to the variety of detail in the answers typed in, we do not present the qualification data here. Where we were able to unambiguously identify the specific qualification (subject and level) we have used that to produce more detailed analysis of some questions in this section.
3.4.1 Rank ordering as part of the judgement process
First, we asked a series of questions regarding rank ordering within the qualification, if this was relevant to the chosen qualification. All GQ submissions required rank orders, however for VTQs only some did. We therefore asked those answering about VTQs the following question.
Doughnut chart showing responses to the question described in the caption for Figure 22 and the text that follows it.
Figure 22: For the qualification you are answering for, did you have to submit a rank order as well as Centre Assessment Grades? (N = 67)
Of those answering this section referring to a VTQ, 82% said that a rank order was required as part of their submission (see Figure 22). Therefore, the questions regarding rank ordering in this section were answered by all GQ and most of the VTQ respondents. Routing through several of the questions in this section was determined by whether the centre judgements made by the respondents included CAGs and rank orders, or CAGs alone.
Doughnut chart showing responses to the question described in the caption for Figure 23 and the text that follows it.
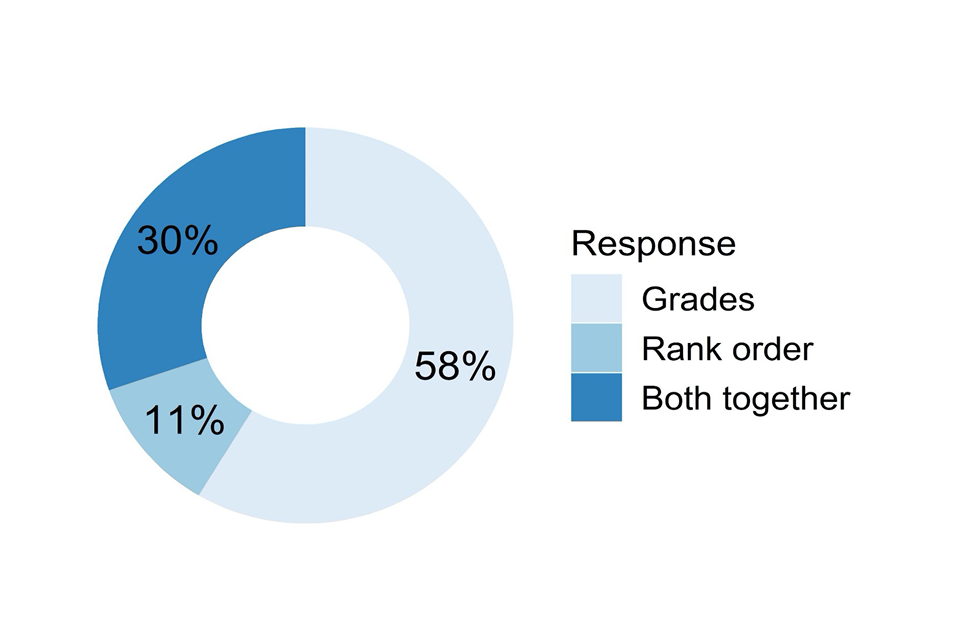
Figure 23: What did you focus on first – grades or rank order, or both together? (N = 837)
The question shown in Figure 23 was a forced choice between the following three options:
- Grades
- Rank order
- Both together
Whilst 30% of respondents worked simultaneously on grades and rank orders, the majority determined grades first (58%) compared to only 11% who determined the rank order first.
Doughnut chart showing responses to the question described in the caption for Figure 24 and the text that follows it.
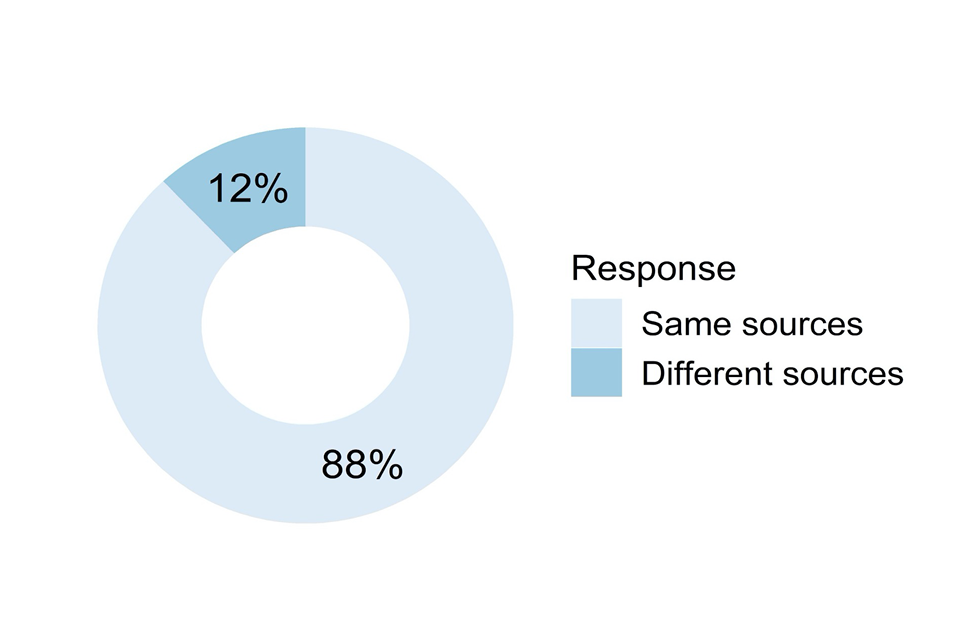
Figure 24: Did you use the same sources of evidence and the same weighting of evidence for both grade judgements and rank order judgements? (N = 837)
The question shown in Figure 24 was a forced choice between the following two options:
- Yes, the same sources of evidence were used and weighting of evidence was the same
- No, the sources of evidence were different or the weighting of evidence was different
In most cases (88%) the same sources of evidence were used to determine grades and rank orders. However, that still left 12% of respondents who looked at different sources of evidence for the two different kinds of judgement. We shall further consider that difference in section 3.4.2.
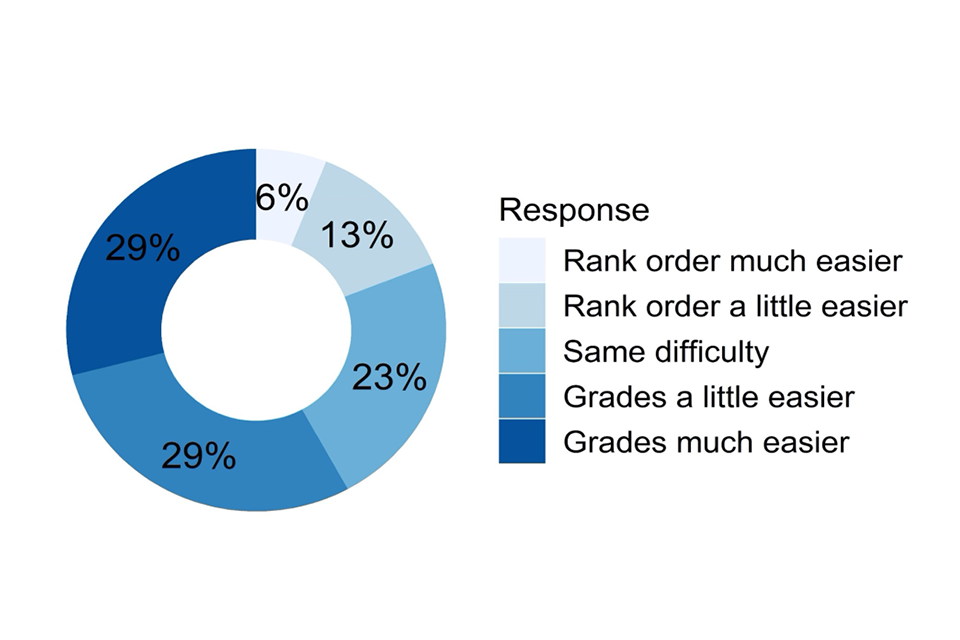
Doughnut chart showing responses to the question described in the caption for Figure 25 and the text that follows it.
Figure 25: Was it easier or harder to generate grades or a rank order? (N = 790)
Our respondents felt that grades were easier to determine than rank orders (see Figure 25). Fifty-eight per cent thought that grades were a little easier or much easier, compared to 19% who thought that the rank order was a little easier or much easier. Rank ordering was a much more fine-grained task, requiring decisions to be made between very similar ability students that would have been placed within the same grade.
Interestingly, if we consider the order in which the tasks were carried out, those respondents who determined grades first thought that grades were easier to decide (69%) than rank orders (11%), while the reverse was true of those who rank ordered first, with rank orders (44%) considered a little easier than grades (26%). There may be a relationship between the amount of time spent on the tasks, with perhaps more time spent on the first stage, regardless of which task it was.
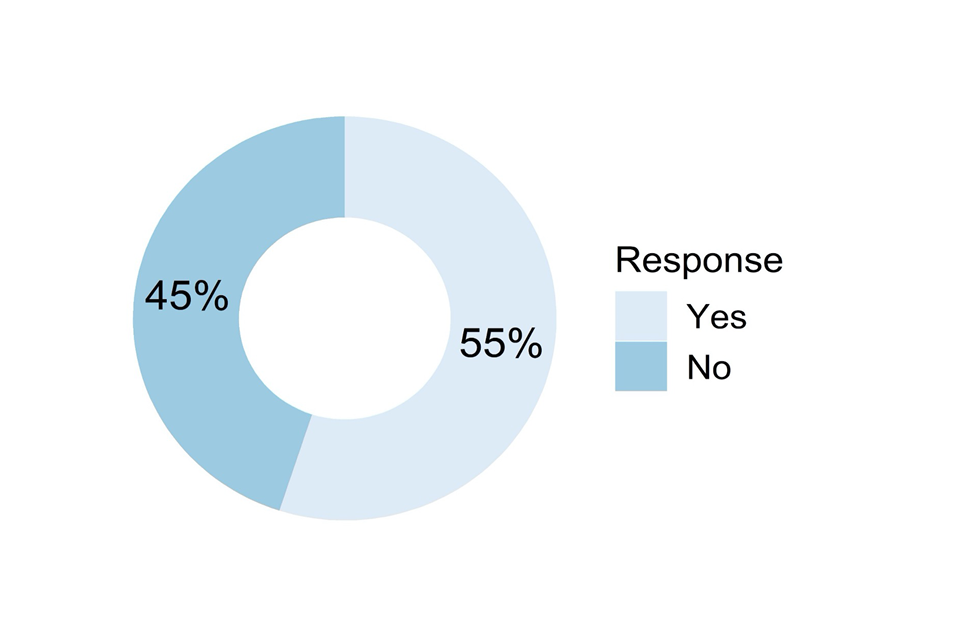
Doughnut chart showing responses to the question described in the caption for Figure 26 and the text that follows it.
Figure 26: In assigning a rank order to students, did you then change any grades? (N = 789)
More than half of respondents (55%) agreed that in deciding rank orders they changed some grades (see Figure 26). The more fine-grained decisions involved in rank ordering students may have highlighted inconsistencies within grade judgements.
3.4.2 Sources of evidence used
Respondents inputted the weights they applied to different sources of evidence by dragging sliders that could accept values from 0 to 100, with default starting values of 0. We stated on-screen that 0 represented “was not available / given no weight / had no influence on your judgements” and 100 represented “was given high weighting / was very influential on your judgements”.
Respondents either completed a single input of evidence types if they stated they used the same sources of evidence to decide grades and rank orders or two different inputs of evidence (one thinking about grades, the second thinking about rank orders) if they used different evidence for the two judgements. If only one set of common evidence weights was entered, this data is repeated in both the grades and rank order graphs below. Any difference between the two graphs arises from those respondents who offered different weightings for grades and rank orders.
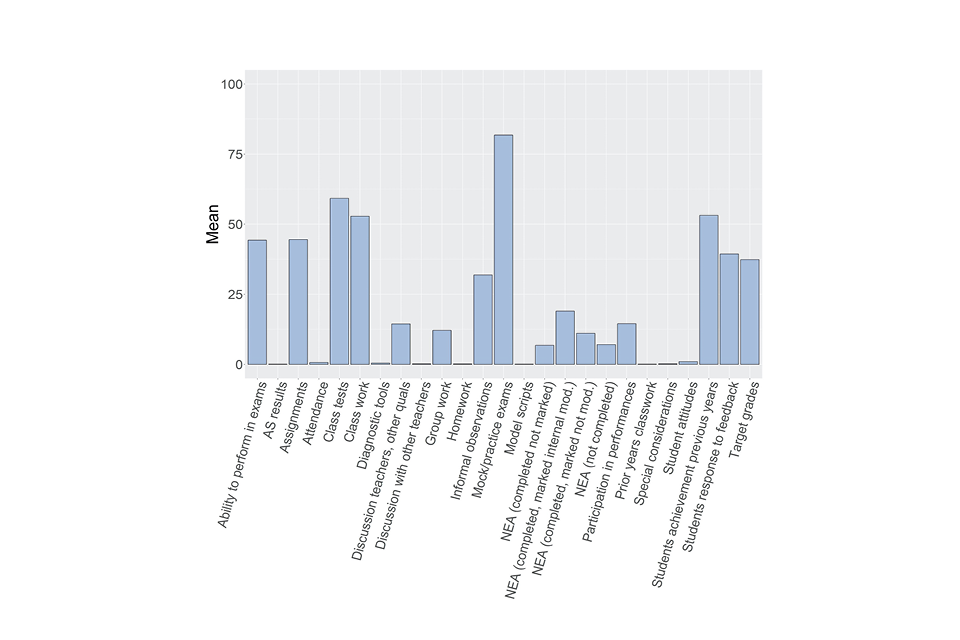
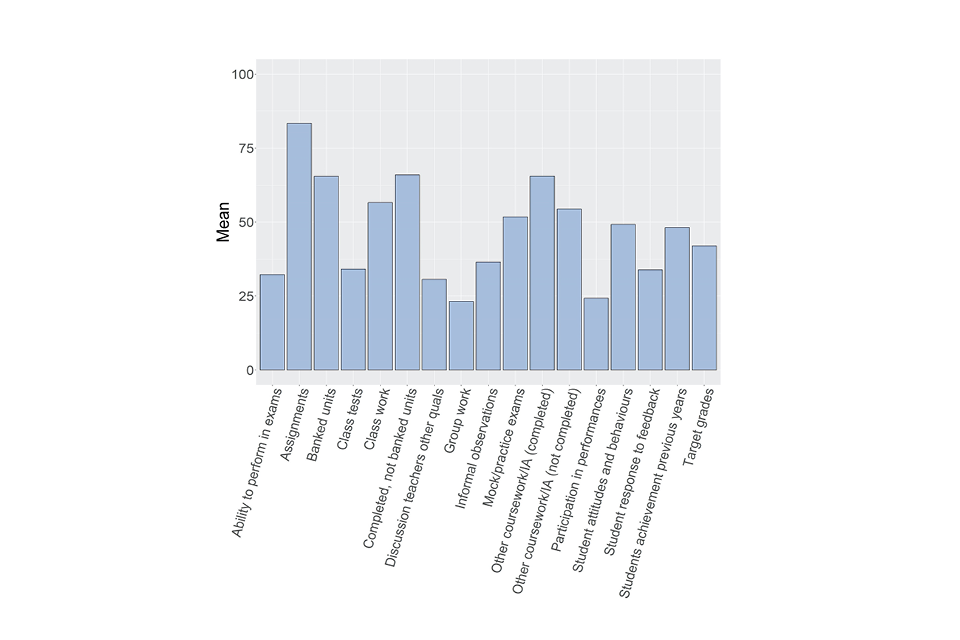
Bar chart showing responses to the question described in the caption for Figure 27 and the text that follows it.
Figure 27: Which sources of evidence did you use to inform your judgements about individual students, and how influential were they? GQ grades. (N = 744)
For GQ grades and rank order evidence types (shown in Figure 27) the following response options were presented:
- Ability to perform in exams
- Assignments
- Class tests
- Class work
- Discussion with teachers regarding students’ performance in other qualifications
- Group work
- Informal observations from classroom discussions/questioning
- Mock/practice exams
- NEA (completed not marked)
- NEA (completed, marked internally moderated)
- NEA (completed, marked not moderated)
- NEA (not completed)
- Participation in performances
- How students achieved in previous years
- How well students responded to feedback following previous tests/mocks
- Target grades
- Other source of evidence (please describe and give weight from 0-100)
Before analysing the responses, we recoded the responses in the ‘Other’ category for which ratings/weights were entered into several new categories or existing categories where they fitted.
The most important source of evidence across all qualifications falling under GQ were mock/practice exams, with a mean rating of 81.8. In descending order of importance following mocks were class tests (59.2), how students achieved in previous years (53.1), class work (52.8), assignments (44.5) and ability to perform in exams (44.3). We further analysed this data by subject, considering the different forms of evidence and how they varied across subjects. In sum, this analysis indicated the favoured sources of evidence were consistent with the assessment structures of the various subjects. For example, whilst mock exams were rated very high (75 or higher) for most subjects, a small number of subjects with a significant proportion of non-examined assessment had lower ratings, with Art and Design at GCSE and AS/A level rated around 50. Similarly, for class tests a rating of 50-70 was given in most subjects, but in Art and Design, Design and Technology and a few smaller entry subjects such as A level Philosophy and GCSE Food and Nutrition the rating was below 40. Class work was quite equally rated across all subjects.
Non-examined assessment (NEA) was almost a mirror image of the mock ratings, with subjects that had NEA, like Art and Design, Design and Technology, drama and physical education, having the highest ratings around 40-50. Subjects with no NEA had ratings of 0 for NEA.
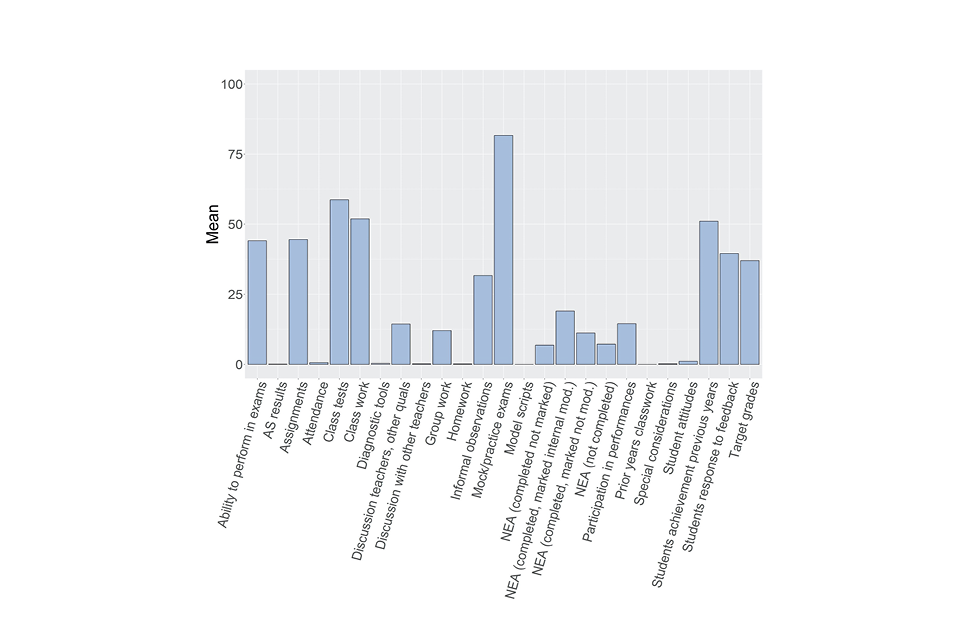
Bar chart showing responses to the question described in the caption for Figure 28 and the text that follows it.
Figure 28: Which sources of evidence did you use to inform your judgements about individual students, and how influential were they? GQ rank orders. (N = 744)
The response options for GQ rank orders were the same as the previous question, and the same re-coding of ‘other’ responses took place. When considering the evidence used for rank orders (see Figure 28), this data largely reproduces the pattern for grades in the previous question. This is because the majority of respondents weighted the evidence the same or similarly.
A moderate number of respondents reported earlier that they used different sources of evidence for grades and rank ordering (see Figure 24). To try to understand whether there were significant differences in the evidence for these respondents, we analysed their data separately. We took the difference in the mean weightings of each source of evidence for grades and rank orders. There were only a few substantial differences. Most sources of evidence were within a difference of 2 between grades and rank orders. The two large differences were for how the student achieved in previous years, which carried much more weight for grades than for rank ordering (50 versus 32). Class work was also weighted more for grades than rank orders (43 versus 35). It is unclear what the functional significance of these differences are.

Bar chart showing responses to the question described in the caption for Figure 29 and the text that follows it.
Figure 29: Which sources of evidence did you use to inform your judgements about individual students, and how influential were they? VTQ grades. (N = 66)
For VTQ grades and rank order evidence types (shown in Figure 29) the following response options were presented:
- Ability to perform in exams
- Assignments
- Banked components/units
- Class tests
- Class work
- Completed but not banked components/units
- Discussion with teachers regarding students’ performance in other qualifications
- Group work
- Informal observations from classroom discussions/questioning
- Mock/practice exams
- Other coursework/internal assessment (completed)
- Other coursework/internal assessment (not completed)
- Participation in performances
- Student attitudes and behaviours that may have affected their continued achievement (e.g. commitment, work ethic, interest in subject, motivation)
- How well students responded to feedback following previous tests/mocks
- How students achieved in previous years
- Target grades
- Other source of evidence (please describe and give weight from 0-100)
Before analysing the responses, we recoded the responses in the ‘Other’ category, for which weights were entered, into several new categories or existing categories where they fitted.
A wider variety of sources of evidence received similar moderately high ratings for VTQ than for GQ. This is probably because of the diversity of qualification assessments, with a variety of methods used for assessment, and different types or amounts of already available evidence for different qualifications. Assignments were the most highly weighted evidence (83.1), probably reflecting their use in most VTQs. Following assignments were several very similarly-weighted sources of evidence, such as completed but not banked units (65.7), completed coursework/internal assessment (65.6), banked units (65.4), class work (58.5) and incomplete coursework/internal assessment (53.9). But a number of other evidence types had only marginally lower weighting and all had ratings of 24 or more so contributed to the judgements to a degree. We did not attempt to analyse the different evidence weightings across qualification types, or for those stating that they used different evidence for grades and rank orders, due to the low number of responses involved.
Bar chart showing responses to the question described in the caption for Figure 30 and the text that follows it.
Figure 30: Which sources of evidence did you use to inform your judgements about individual students, and how influential were they? VTQ rank orders. (N = 66)
Similar to the case for GQ, the evidence used for VTQ rank orders (see Figure 30) largely reproduced the pattern for grades in the previous question. This is because the majority of respondents weighted the evidence the same or similarly.
3.4.3 Engagement with others
This sub-section of questions related to the process of how judgements for individual students were made, whether this was done entirely alone, or with some consultation with colleagues.

Doughnut chart showing responses to the question described in the caption for Figure 31 and the text that follows it.
Figure 31: Did you engage with other colleagues (e.g. within your department) in forming judgements for your students’ Centre Assessment Grades? (N = 800)
Ninety-one per cent of our respondents said that they had engaged with colleagues to make judgements (see Figure 31). This does suggest that 9% worked entirely alone on their class judgements and then sent them to more senior colleagues for further parts of the process. The respondents who said yes were then asked the following questions in this sub-section.
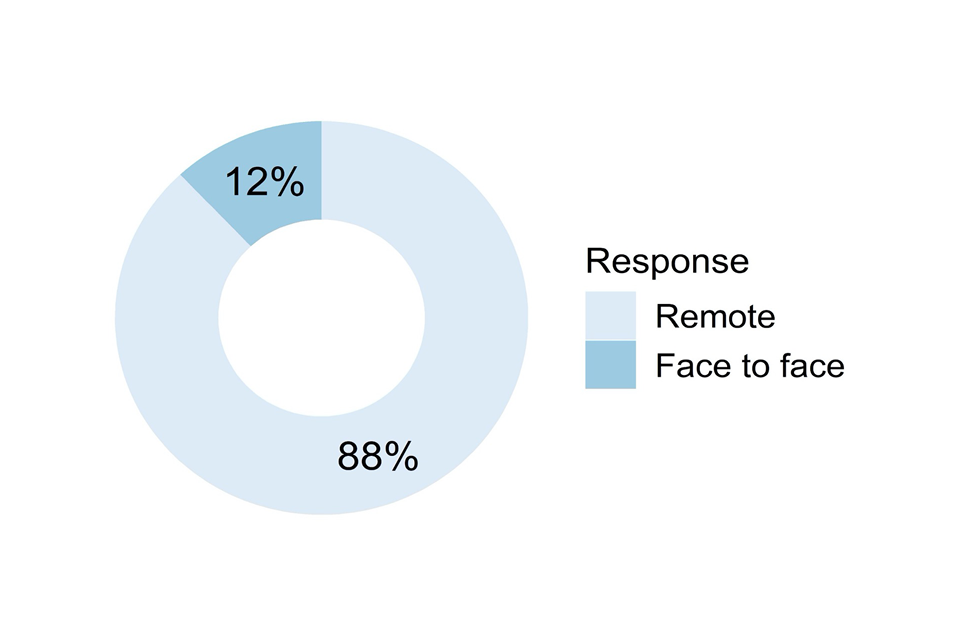
Doughnut chart showing responses to the question described in the caption for Figure 32 and the text that follows it.
Figure 32: Was this engagement predominantly remote or face to face? (N = 725)
The question shown in Figure 32 was a forced choice between the following two options:
- Remote
- Face to face (but socially distanced)
For the vast majority of respondents (88%) the engagement they had with colleagues was carried out remotely. This is not surprising given the fact that centres were closed during this period, other than for essential childcare provision. However, some teams did get together in person, presumably in cases where there were unused spaces in centre which allowed meetings with sufficient distancing.

Bar chart showing responses to the question described in the caption for Figure 33 and the text that follows it.
Figure 33: Did you experience any of the following difficulties in having effective discussions with colleagues? (N = 727)
The question shown in Figure 33 had the following response options, of which multiple options could be selected:
- Arranging times to speak to or meet with relevant colleagues
- Arranging times to speak to or meet with relevant senior colleagues
- The dynamics of using ‘Meetings’ software (e.g. sharing documents, turn-taking in conversation)
- Difficulty of holding face to face meetings while social distancing
- No - I experienced no difficulties
- Technical limitations of remote meetings (e.g. poor broadband connections, delays)
- Other (please specify):
The most frequent response was that there had been no difficulties discussing things with colleagues, at 66%. Therefore 34% had experienced some difficulties, of which the most common were the dynamics of holding meetings online (13%) and arranging times to speak to or meet with relevant colleagues (13%). The least frequent difficulties were arranging times to speak to or meet with relevant senior colleagues and the difficulty of speaking face to face whilst social distancing (both 8%).
We asked respondents to detail any other difficulties they may have faced in having discussions with colleagues. There were 41 free text responses (6%) to this question giving more detail. A number of comments were more general ones about difficulties inherent in the larger judgemental process, not specifically about speaking to colleagues. The most common comments were actually positive, that training and familiarity with the meeting software meant that there were no problems. However, some comments did expand on difficulties such as dynamics, or the difficulty of getting everyone together at the same time, while one person was concerned over the security of their online meetings.
Other concerns related to illness or maternity leave, staff having left, or meetings which were pointless as decisions had already been taken. Equipment concerns cropped up, not just for meetings but also for data access. Finally, several comments related to evidence being locked up in closed centres, meaning evidence to scrutinise in meetings was lacking, or only available electronically for some of the students.
3.4.4 Shared teaching of classes
We wanted to know about how judgements had been made when there had been more than one person teaching the class. Those answering questions within the section on making judgements for individual students were asked the following question.
Doughnut chart showing responses to the question described in the caption for Figure 34 and the text that follows it.
Figure 34: Did you share the teaching of the class(es) for which you generated Centre Assessment Grades for this qualification? (N = 858)
The question shown in Figure 34 was a forced choice between the following four options:
- Yes. I shared the teaching of one or more classes from the start of the course
- Yes. I took over one or more classes from a colleague less than half-waythrough
- Yes. I took over one or more classes from a colleague more than half-waythrough
- No
Of those who answered this question, 45% had shared the teaching of at least one class in some way, generally just shared teaching throughout the course rather than swapping with another teacher/tutor. Those respondents who shared teaching in some way were then asked the following question to determine whether they had also shared decision making with colleagues. Centre Judgements: Teaching Staff Survey, Summer 2020 54

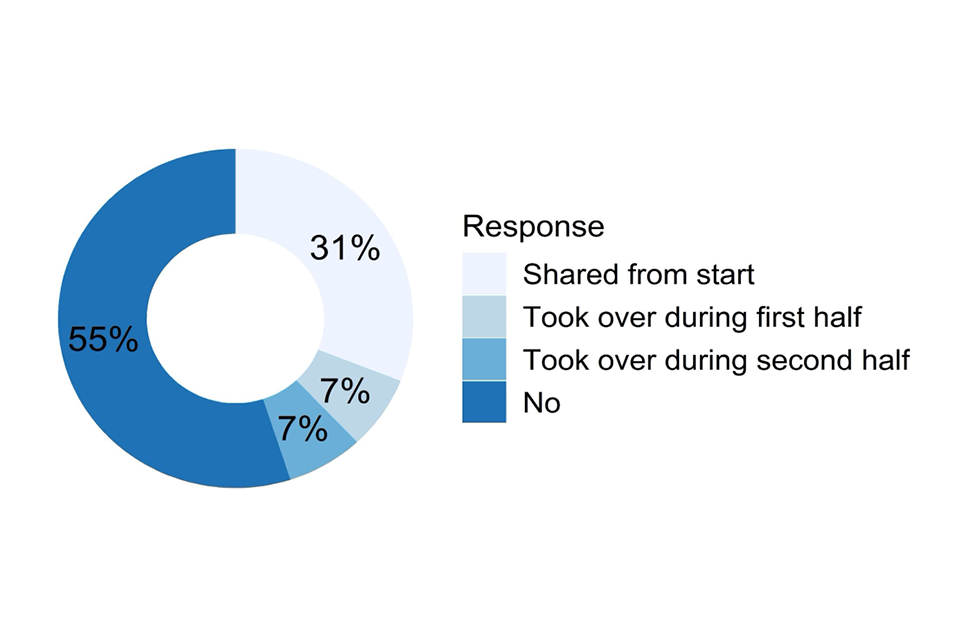
Doughnut chart showing responses to the question described in the caption for Figure 35 and the text that follows it.
Figure 35: You indicated that you shared the teaching of one or more class with another teacher/tutor. In this case, did one person take ownership over the centre assessment grades or was this shared? (N = 342) The question shown in Figure 35 was a forced choice between the following three options:
- Shared
- One person - me
- One person - other teacher/tutor
Where shared teaching had taken place, 66% had made judgements by working together with their colleague(s). Given that respondents answering this question had previously stated that they had made class-level judgements for individual students, it is perhaps not surprising that in cases where only one single teacher made the judgements, they had done this (30%) rather than having no involvement and leaving it to their colleague(s) (4%). The respondents who stated that they had shared decision-making were then presented with the next 3 questions in this sub-section.

Doughnut chart showing responses to the question described in the caption for Figure 36 and the text that follows it.
Figure 36: How easy or difficult was it to agree grades with the other teacher/tutor? (N = 223)

Doughnut chart showing responses to the question described in the caption for Figure 37 and the text that follows it.
Figure 37: How easy or difficult was it to agree rank orders with the other teacher/tutor (if this was part of your submission)? (N = 222)
Those teaching staff who had been involved in shared teaching and who said that they had shared making the judgements were asked how difficult or easy it was to agree with their colleague(s). In general, the responses indicated that agreement was relatively straightforward and easy to achieve, with grades (74% agreement was easy or very easy to achieve, see Figure 36) and easier than rank orders (60% agreement easy or very easy to achieve, see Figure 37). While 6% felt that grades were difficult to agree, 14% thought rank orders were difficult or very difficult to agree. This is entirely understandable given the finer-grained nature of the rank order decisions. When asked about agreeing rank orders, 5% of respondents (who would have been submitting VTQs) stated that this was not part of their submission.

Bar chart showing responses to the question described in the caption for Figure 38 and the text that follows it.
Figure 38: Did you experience any of these difficulties when agreeing the final class Centre Assessment Grades with the other teacher(s)? (N = 225)
The question shown in Figure 38 had the following response options, of which multiple ones could be selected:
- Different emphasis on different sources of evidence
- Different levels of student effort/achievement/engagement in different parts of the curriculum
- Different view of how candidates would perform/achieve in live assessments
- Logistical difficulties in holding discussions
- No difficulties
- Other difficulty not listed (please specify)
Just over half of the respondents to this question (51%) did not experience any difficulties agreeing judgements with other teachers. Of those who did experience difficulties, the most commonly selected were differing views on student performance between teachers (28%) and varied student effort across the different parts of the course taught by the different teachers (27%). Thirteen per cent also noted differences in emphasis on sources of evidence, and a few (9%) noted logistical difficulties in having the necessary discussions. We asked respondents to detail any other difficulties they may have faced in agreeing final judgements with colleagues. There were 18 (8% of respondents) free text responses to this question giving more detail. Often this detail related to one or other of the categories above, or to the difficulty of merging rank orders. There were several comments around the general difficulty of coming to an agreement and the discussions they had. The most potentially challenging problem was only mentioned three times, that is, the lack of professionalism or objectivity of the colleague they worked with. ### 3.4.5 Summary questions asked of all respondents who made judgements for individual students
The following questions were presented to all the respondents who stated that they had been involved in making judgements for individuals, as detailed in Figure 5.
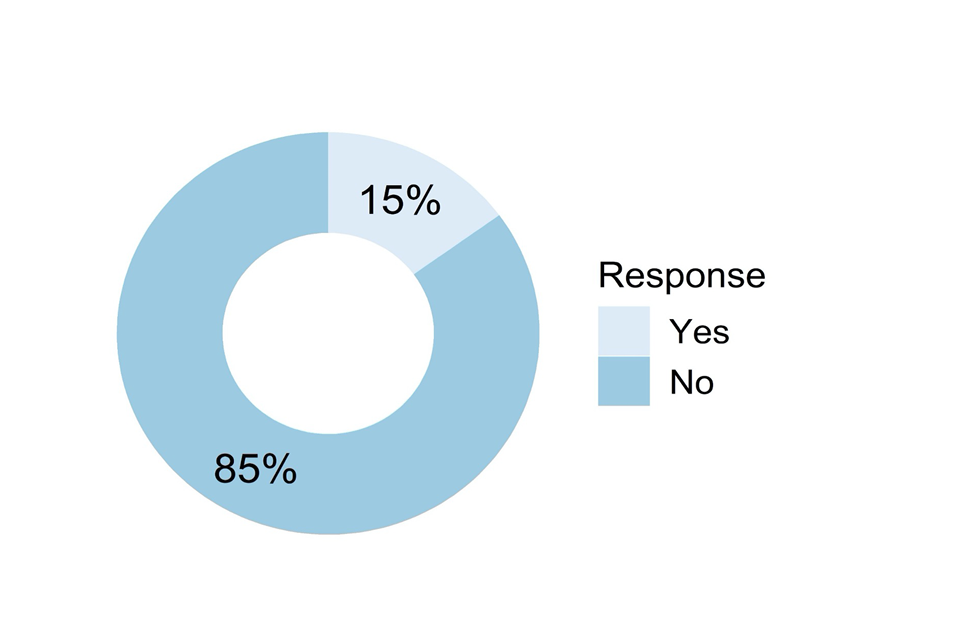
Doughnut chart showing responses to the question described in the caption for Figure 39 and the text that follows it.
Figure 39: Did you experience any difficulties accessing information/evidence about students you wanted to use to support your Centre Assessment Grade judgements? (N = 798)
Fifteen per cent of respondents had experienced some difficulty accessing all of the materials they needed for making judgements (see Figure 39). Although we did not follow this question up for more detail, this was probably related to centres being closed, and would have been a combination of physical materials either locked up in the centre or with the students, and difficulty accessing electronic resources remotely, either work or mark data. We then asked the following open-response question, ‘Were there other considerations which you thought about when generating Centre Assessment Grades for individual students? Please give details’.
There were 285 free text responses to this question, 25 of these were comments unrelated to the question and 28 simply indicated that there were no other considerations when making judgements than those already mentioned in previous questions. Of the responses detailing additional considerations, most were about the more qualitative, contextual factors that were considered in addition to marks on tests and work. Special considerations and consideration of students’ personal circumstances were referred to 66 times. A further 27 referred to considerations of attendance, or lack of it, and illness. There were 32 references to the student’s development and progress over the course and anticipated trajectory of improvement.
A common consideration was of the personality characteristics and the respondents’ knowledge of a student’s behaviours, such as attitude to learning, motivation and work ethic, which were mentioned by 39 of the responses, with an additional 12 specifically referring to attendance at revision classes. There were also 17 responses that mentioned consideration of the student’s performance in other subjects or at other levels, for example, performance at GCSE when considering an A level grade. Whilst the guidance Ofqual published suggested that behaviour and characteristics should not be considered directly, they can feed into consideration about how students may have performed in exams through effort made in their revision.
In addition to the characteristics of individual students, some mention of specific groups of students were made. A consideration mentioned in 30 of the comments was SEND, access arrangements and extra time, with an additional 3 responses referring to protected characteristics and a further 2 referring to pupil premium students.
Some other sources of work or performance evidence were mentioned that we had not listed. There were 13 responses that referred to practical work, performance on practice questions and work experience placements. Use of data was also widely mentioned. A common consideration, referred to in 28 of the responses, was the grade profile and characteristics of previous cohorts and a further 4 responses that referred to KS2 data. There were 5 references to other data and statistical information, such as national performance or whole school data analysis. Consideration to tiers of entry was also referred to in 6 of the responses. There were 3 mentions of consideration around private tutoring and 2 responses referred to consideration of the opinions of other teachers. There were 2 responses that mentioned consideration of the respondent’s ability to predict grades in the past, and 3 that considered marks and grade boundaries to determine grades. There were also one or two mentions of exam board information and assessment objectives. Finally, 4 responses referred to the use of their professional experience and judgement.
Overall, a very wide variety of extra considerations were listed. It is likely that if many of these had been presented as choices to select from on-screen (rather than having to type in and describe them) they would have been selected much more frequently than the counts listed here.

Grid of doughnut charts showing responses to the questions described in the caption for Figure 40 and the text that follows it.
Figure 40: How confident are you that your judgements accurately reflected likely student achievement when considering the following contrasts? (N =761)
The following contrasts were presented (see Figure 40) and we asked for responses on a 5-point confidence scale ranging from ‘Not at all confident about likely relative achievement’ to ‘Very confident about likely relative achievement’:
- Distinctions between students at the lower end of grade distribution vs distinctions between students at the higher end of grade distribution
- Students who ‘coasted’ (possibly intending to revise hard before any final exams) vs those making a sustained continuous effort
- Students with a low socio-economic background vs students with a high socio-economic background
- Students who were the youngest in the class vs students who were the oldest in the class
- Students that were well behaved vs students that were less well behaved
- Students who made an effort in their mocks/practice tests vs those who did not try hard
- Students with low engagement in class vs enthusiastic engagement in class
Whilst not intended to be comprehensive, these 7 contrasts were devised to represent the main kinds of difficult decisions that staff would have had to make in their judgements. If we combine ‘very confident’ and ‘confident’ judgements, then respondents were most confident in their judgements for students with contrasting levels of effort for mocks (82% confident/very confident).
The second highest confidence was for well-behaved compared to less well-behaved students (79%). These two contrasts are probably high confidence as they relate to comparisons that could be supported by looking at other work or tests – the teacher/tutor would be able to see an aberrant mock result by comparison to other work and their own ongoing knowledge of the student, while perhaps behaviour tends to manifest itself in marks for work and tests.
Lowest confidence on this measure was expressed for the uneven student effort contrast (61%) and the student age contrast (62%). The progress of those students who leave it until just before the exams to work hard would naturally be hard to estimate since there would be little evidence to base this on. We suspect that age was a low confidence contrast simply as this may not have been considered specifically when making judgements since it is a normal background factor in educational attainment. The age contrast also had the highest percentage of ‘Not at all confident’ responses (12%). Other comparisons with higher ‘Not at all confident’ responses were the uneven student effort contrast (5%) and the contrast between low and high SES students (5%). All other contrasts were rated very low confidence 2% of the time or less.
Bar chart showing responses to the question described in the caption for Figure 41 and the text that follows it.
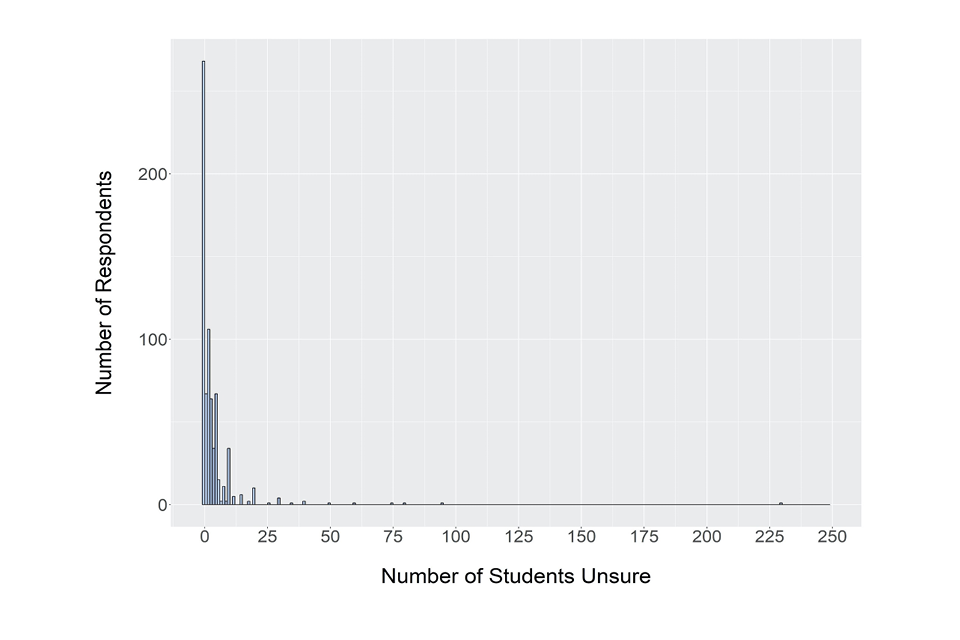
Figure 41: For how many students did you feel relatively unsure of the grade they would have been most likely to achieve (for example they joined the class fairly recently/had been excluded/were a private candidate)? (N =707)
We asked respondents to type in the number of students for which they were unsure of the grade they would have been most likely to achieve. In total 62% of respondents indicated that they were unsure of the grade that one or more student would have achieved (see Figure 41). The largest bar in the plot above indicates a ‘zero’ was entered 38% of the time. This indicates these respondents were confident of all of their grades. The median number of uncertain student grades was 2.
Although we gave the 3 examples in parentheses for this question, respondents may also have been thinking about those students in their class who were just hard to predict. We also did not ask the level of their uncertainty, and these numbers do not necessarily indicate incorrect judgements, just ones that were harder to make to some degree. Some respondents gave very large numbers, up to 230. This may perhaps indicate that a handful of respondents did not feel certain about many or all of their students.

Doughnut chart showing responses to the question described in the caption for Figure 42 and the text that follows it.
Figure 42: Did you feel any undue pressure on your professional judgement? (N =762)
Sixty-nine per cent of the respondents felt no pressure on their professional judgement when making their judgements (see Figure 42). We asked the 31% who answered yes to give more detail about this pressure. There were 220 free text responses (29%) to this question. Almost half referred to the pressure they felt to meet the grade distributions determined by analysis of the centre’s previous years’ performance. Many reflected on the conflict this introduced with their professional judgement, and their dissatisfaction with the downwards moderation by management of their original CAGs. Around a quarter of comments reflected the personal pressure they felt, the weight of responsibility they carried for students’ futures. A few also reflected on the pressure on their professional standing, in terms of media reporting of bias or optimism in the judgements.
Around 20 respondents mentioned the pressure they felt from contact from parents and/or students, both during the process and the expectation that they would be held to account for their judgements when the results came out. A similar number also mentioned direct pressure from SLT to sometimes be optimistic, and sometimes mentioning individual cases where pressure had been applied to increase grades for specific students. Other pressures mentioned occasionally related to the difficulty of the task, how difficult it was to decide or agree grades and rank orders, a few mentions of difficulty making judgements for private candidates, how there was uncertainty about what evidence was allowed or a lack of actual evidence, and also time pressures.

Doughnut chart showing responses to the question described in the caption for Figure 43 and the text that follows it.
Figure 43: Were you aware of any steps taken by your centre to protect you against external influences (such as parents and students) on your Centre Assessment Grade judgements? (N =765)
The question shown in Figure 43 was a forced choice between the following four options:
- Yes – there were effective steps taken
- Yes – there were some partially effective steps taken
- No – no steps taken
- Not sure – there may have been some steps taken but I was not aware
Most centres appeared to have implemented effective steps to make sure that teacher/tutors would not be influenced in making their judgements, with 75% replying that the centre had implemented either effective or partially effective steps, the vast majority the former. The twenty-one per cent who were not sure may include staff at centres that did nothing, but also centres who blocked external contacts reaching class teacher/tutors but did not tell them they were doing so. Only 4% were sure that their centre had done nothing to rule out external influences.
Bar chart showing responses to the question described in the caption for Figure 44 and the text that follows it.
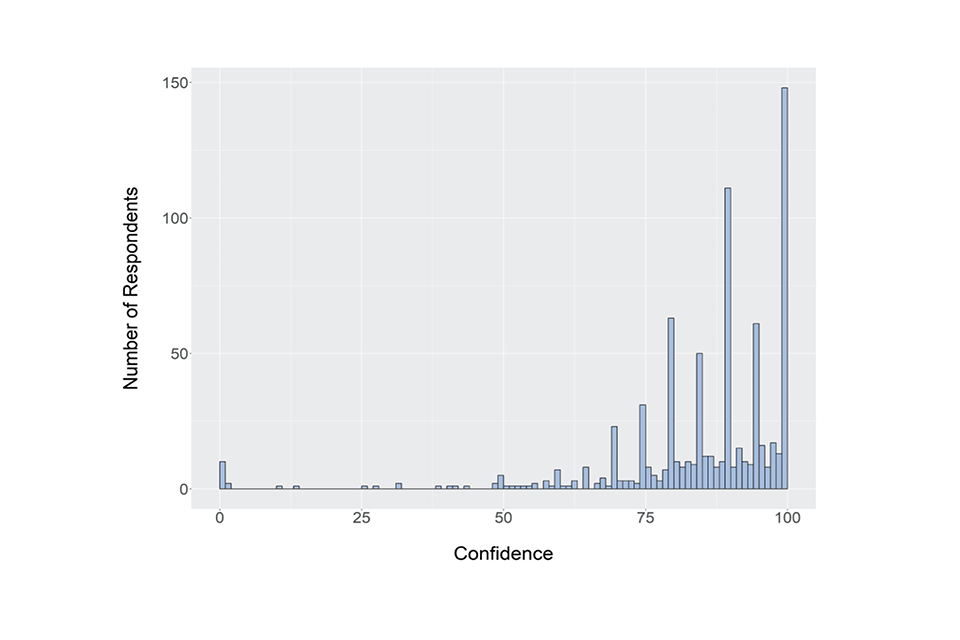
Figure 44: What was your overall confidence in your own judgements for your class before any combination of class Centre Assessed Grades took place? (N =763)
We presented a slider running from 0 to 100 with the marker starting position on 0. Respondents were asked to drag the slider to indicate their confidence, with 0 indicating no confidence and 100 indicating absolute confidence. The overall mean confidence in the original class-level judgements was 85.5, with a median value of 90 (see Figure 44). The spiked distribution has occurred in this figure (and nearly all of the following ones showing ratings from 0 to 100) since many of our respondents were quite sensibly selecting multiples of 5 or 10 to describe their confidence. Some respondents gave very low ratings of confidence, with 10 entering a value of 0, and a few others values below 20. Because of their presence, and the very asymmetric distribution of ratings, the median value of 90 is more representative of the group consensus than the mean value.
Doughnut chart showing responses to the question described in the caption for Figure 45 and the text that follows it.
Figure 45: If you were involved in deciding Centre Assessment Grades for more than one qualification was the same general process used throughout? (N =754)
Sixty-five per cent of staff involved in making judgements for individual students were involved in judgements for more than one qualification (see Figure 45). Fifty-nine per cent said that the same general process was used for all the qualifications they were involved in, with only 6% saying they had experienced different processes within the qualifications they were involved in. These numbers may reflect the preponderance of GQ teaching staff, since the centre judgement submission requirements were the same for all GCSE, AS and A levels, and so a common approach could be adopted. However, when we analysed the limited number of responses related to VTQs where submissions had been made to more than one awarding organisation, the percentage involving the same process was very high. These staff may of course have been submitting qualifications in a narrow specialism, where the same approach applied to a suite of similar qualifications.
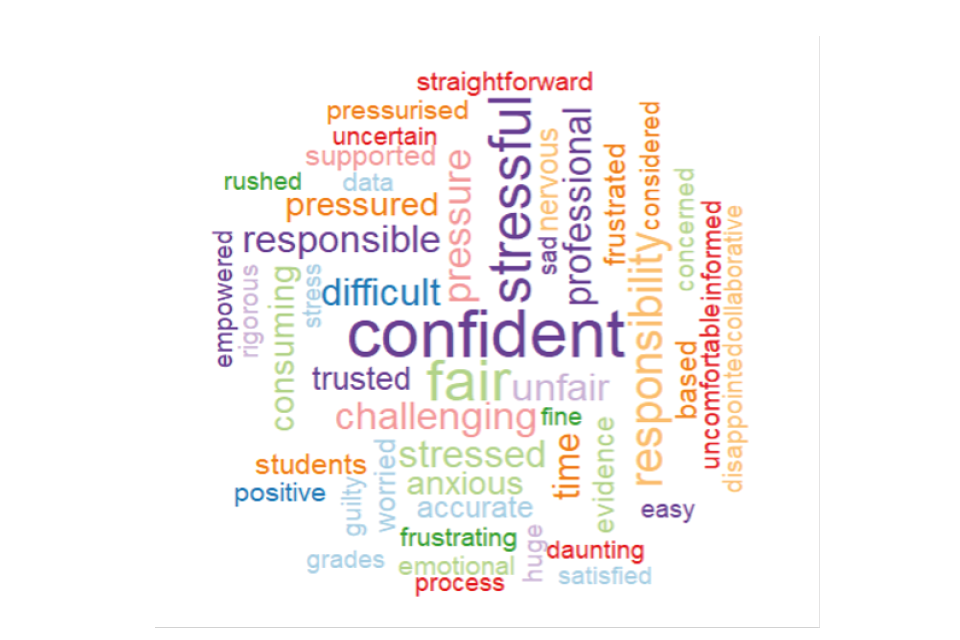
Word cloud showing responses to the question described in the caption for Figure 46 and the text that follows it.
Figure 46: Please write down up to three words that summarise how you felt about the experience of generating Centre Assessment Grades. The word cloud generated from the typed words displays word frequency by the size of the word. (N = 626)
We analysed the words given by their frequency and plotted them as a word cloud (see Figure 46). The most frequent ‘positive’ words were:
- confident
- fair
- professional
- trusted
- supported
- accurate
The most frequent ‘negative’ words were:
- stressful
- responsibility
- pressure
- challenging
- stressed
- unfair
These words provide a powerful summary of the experience for teaching staff. Whilst our respondents emphasised the robustness of the judgements that had been made, with confident and fair the two most frequently used words overall, there was an approximately equal split between positive and negative sense words, with most of the negative words capturing the difficulty of the process, and the sense of responsibility felt and stress this produced.
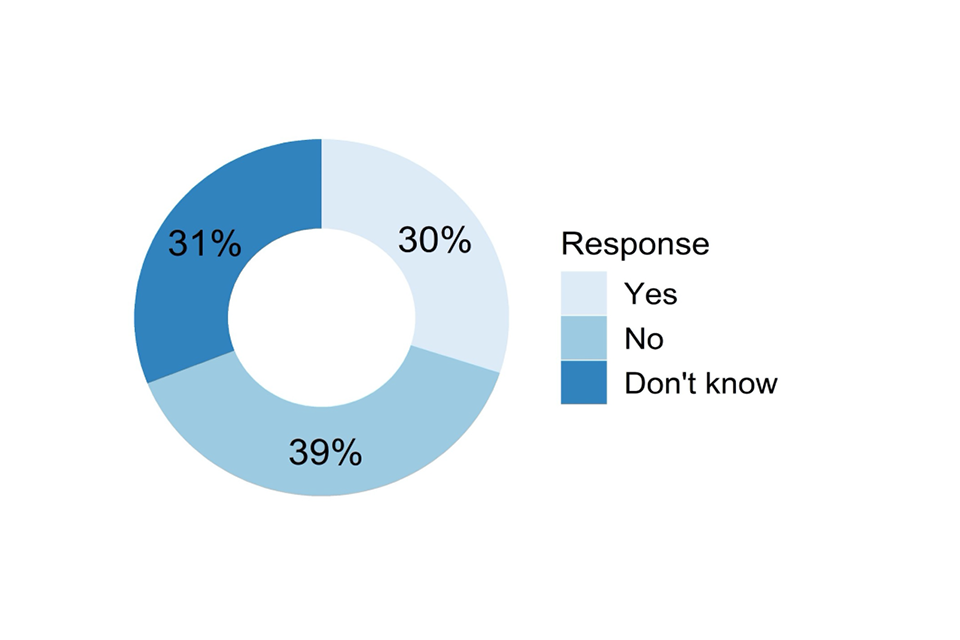
Doughnut chart showing responses to the question described in the caption for Figure 47 and the text that follows it.
Figure 47: Were your original class-level Centre Assessment Grades moderated up or down prior to submission to the Awarding Organisation/Exam Board? (N =729)
There was a relatively equal split across responses when it came to internal moderation of original class-level CAGs before submission (see Figure 47). Slightly more respondents said ‘no’ (39%) than said ‘yes’ (30%), however almost a third (31%) were not sure, indicating that this part of the process may have been out of their hands and any adjustments may not have been communicated to them.
We asked those who answered yes to tell us why they had been moderated. There were 211 free text responses (29%) to this question giving more detail. The majority (115) of the comments related to a comparison to centre performance in past years, and (usually) senior management adjusting the CAGs into line with this performance. Use of external sources of data analysis were also mentioned in this context. Predominantly these adjustments were downwards to match more closely historical results, and the survey respondents were often unhappy with this moderation, stating a variety of reasons why the cohort performance this year should have been better than previous years. A few upwards adjustments were mentioned.
There were around 50 comments relating to the detailed process of moderation used within the centre, and the resulting adjustments made. Eleven comments detailed the discussions and deliberations that had occurred around particular individuals or types of students. Finally, there were 14 comments describing how moderation was necessary to bring different classes or subjects to parity, and that this was perceived as a relatively good thing.
3.5 Submission checking/agreement at qualification level
The questions within this section were intended for those respondents who had been involved in the final checking and agreement process for all of the judgements within one or more qualifications. This stage of the process may have included the combination of grade and rank order judgements from different classes into one set of judgements, usually carried out within departments. There may also have been discussion with more senior staff. It came before the head of centre declaration form was signed by the head of centre or delegated senior staff member. All respondents to the survey were asked the first question below, and then those who answered yes completed the rest of this section.

Doughnut chart showing responses to the question described in the caption for Figure 48 and the text that follows it.
Figure 48: Were you involved in the final agreement of Centre Assessment Grades within individual qualifications for submission (but prior to centre declaration sign-off)? (N = 935)
Seventy per cent of survey responses came from individuals who had been involved in the final agreement of the judgements at a qualification level prior to sign-off by senior management (see Figure 48). When we looked at the pattern of ‘yes’ responses across the main job roles, we found that 99% of deputy heads of centre said they were involved, as well as 85% of heads of centre and 81% of other SLT roles. Senior leadership were therefore heavily involved in qualification-level agreement. Heads of department were involved in 82% of cases and 67% of deputy heads of department were, which suggests that in some centres the task of agreeing the grades was carried out centrally, not within departments. Furthermore, only 42% of class teacher/tutors who answered this question said they were involved, suggesting that in more cases class teacher/tutors were not involved, and that decisions may have been made by others including heads of department and more senior staff.
Respondents who answered yes to this question were presented with the questions that follow in this section.

Bar chart showing responses to the question described in the caption for Figure 49 and the text that follows it.
Figure 49: Who else was involved in this agreement of Centre Assessment Grades within individual qualifications for submission? (N = 655)
The question shown in Figure 49 had the following response options, with multiple selections allowed:
- Deputy Head of Centre
- Deputy Head of Department
- Diversity expert
- Examinations Officer
- Head of Centre
- Head of Department
- Just me
- Other relevant class teacher/tutor
- SENCo or SEN teachers/tutors
- Other member(s) of the leadership team (please specify)
Most frequently, respondents indicated that heads of departments (57%) and other teachers (53%) were involved. Senior staff such as heads of centre (41%) or their deputies (41%) were also frequently involved. Only in a small number of cases was just the one survey respondent involved (3%). Given that other teachers were not always involved, this further supports the findings from the previous question that teachers were not involved in these kind of discussions in every centre - final qualification centre judgement agreement did not necessarily involve the whole departmental teaching staff, only usually more senior staff.
SENCos were only involved 14% of the time, and diversity experts were rarely involved (1%). This question asked about direct involvement in deciding the final judgements, usually in meetings or discussions. It is worth reflecting the input from SEN teams also came in the form of centre-wide training, guidance or data compilation to inform judgements.
The responses are also a little hard to interpret since we asked ‘who else’ was involved, so by definition they will not include their own role. Noting a large number of heads of department completed the survey, the percentage for responses including this role would have been suppressed. If we only analyse responses from respondents other than heads of department (representing 54% of those answering this question), then heads of department were present in 81% of the cases. This matches closely the 82% of the head of department respondents in our survey who answered the previous question ‘yes’. Therefore, it seems reasonable to believe that in just under one fifth of centres heads of department were not involved, which would indicate senior management carried out this task alone.
Thirty-two per cent of respondents also indicated that some other members of the leadership team were involved. The free text responses to this question largely gave specific job titles within the leadership team. Given the diversity of job titles used across centres we have not chosen to try to summarise this data, but simply reflect on the wide diversity of experience and expertise included at these final agreement discussions, going right up to school governors.
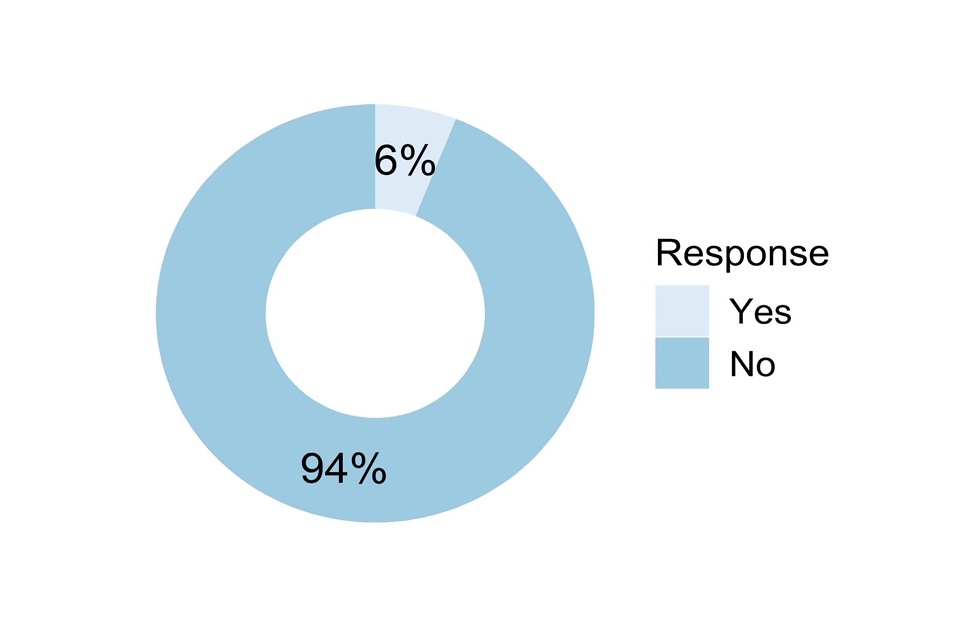
Doughnut chart showing responses to the question described in the caption for Figure 50 and the text that follows it.
Figure 50: In your view, could any other people have been involved whose expertise and knowledge would have been useful? (N = 632)
Ninety-four per cent of responses to this question indicated that no other people needed to be involved in agreeing the centre judgements for qualifications (see Figure 50). Most respondents were therefore content that all of the correct people were involved. Six per cent of respondents thought others could usefully have been involved. Many of these, plus a handful who had said ‘No’, left 36 free text responses giving more detail. The most frequently listed type of person were SENCos (12 times). Input from more senior colleagues (7) and also more involvement of department team members (5) were also mentioned, suggesting that some people had largely worked alone. Quality managers (2), pastoral team (2), diversity experts (1) and previous teachers (1) were also mentioned. Some form of external moderation by the AOs was mentioned twice, and cross centre (1) and cross-department (4) co-ordination were also mentioned to improve internal standardisation.
a)

Doughnut chart showing responses to part a) of the question described in the caption for Figure 51 and the text that follows it.
b)
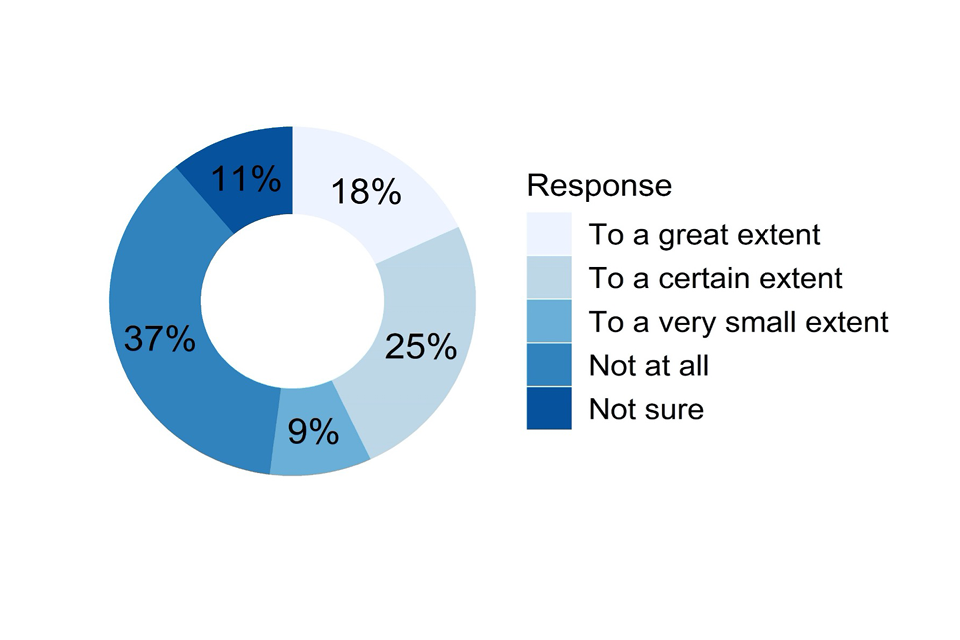
Doughnut chart showing responses to part b) of the question described in the caption for Figure 51 and the text that follows it.
c)

Doughnut chart showing responses to part c) of the question described in the caption for Figure 51 and the text that follows it.
Figure 51: To what extent were following factors part of the final agreement of qualification-level Centre Assessment Grades for submission? a) Awareness of how it was thought the statistical moderation process might work, b) Data or information or a check supplied by an external agency on likely outcomes this year, c) Use of previous years’ attainment to evaluate the profile of Centre Assessment Grades (N = 636)
The question shown in Figure 51 had the following factors, with each rated on a 4-point scale plus ‘Not sure’:
- Awareness of how it was thought the statistical moderation process might work
- Data or information or a check supplied by an external agency on likely outcomes this year
- Use of previous years’ attainment to evaluate the profile of Centre Assessment Grades
Of the 3 listed factors, the most frequently used as part of the final agreement process at qualification level was previous years’ attainment, with 85% stating it was used to a certain extent or a great extent. Awareness of the statistical moderation process was also considered to a certain extent or more in 64% of cases, which given its close relationship to previous years’ attainment is perhaps to be expected. The use of external agency data was less frequent, although still 43% of respondents stated it was used to a certain extent or more.
Interestingly, awareness of statistical moderation was not a factor in 15% of cases, indicating that these centres were probably satisfied submitting centre judgements based on their expertise, or that they considered previous years’ attainment, as only 5% of respondents said this was not considered at all. In some of these centres where statistical moderation or previous years’ results were not considered in these qualification-level decisions, we cannot say that they would not have been considered at some later stage, perhaps at the final sign-off stage.

Doughnut chart showing responses to the question described in the caption for Figure 52 and the text that follows it.
Figure 52: Were there other sources of information which may have been useful to this agreement process? (N = 600)
Only 18% of responses to this question indicated that staff felt some other sources of information would have been useful to this qualification-level agreement process (see Figure 52). Clearly most respondents were satisfied with the information they had available on which to make decisions.
We asked those who answered yes to tell us which other sources of information they thought would have been useful. There were 102 free text responses (17% of respondents) giving more detail. The most frequent suggestion was that greater clarity was required on the external moderation process, including earlier release of information so that centres could plan their centre judgement process. There were also a variety of comments around better communication and greater clarity on requirements from the AOs themselves.
Several different sources of candidate attainment other than their work in the centre were mentioned, including access to their prior attainment (including an analysis relative to the national cohort) and also several different external sources of data analysis. There were a few comments relating to additional guidance and training by the AOs on how the process should operate, and how to make judgements, and a few suggesting that more support for teachers’ professional judgement would have been appreciated. Some respondents also detailed some of the sources of evidence they had used in making judgements, including a few mentioning consideration of factors other than marked work such as attendance and socioeconomic status.
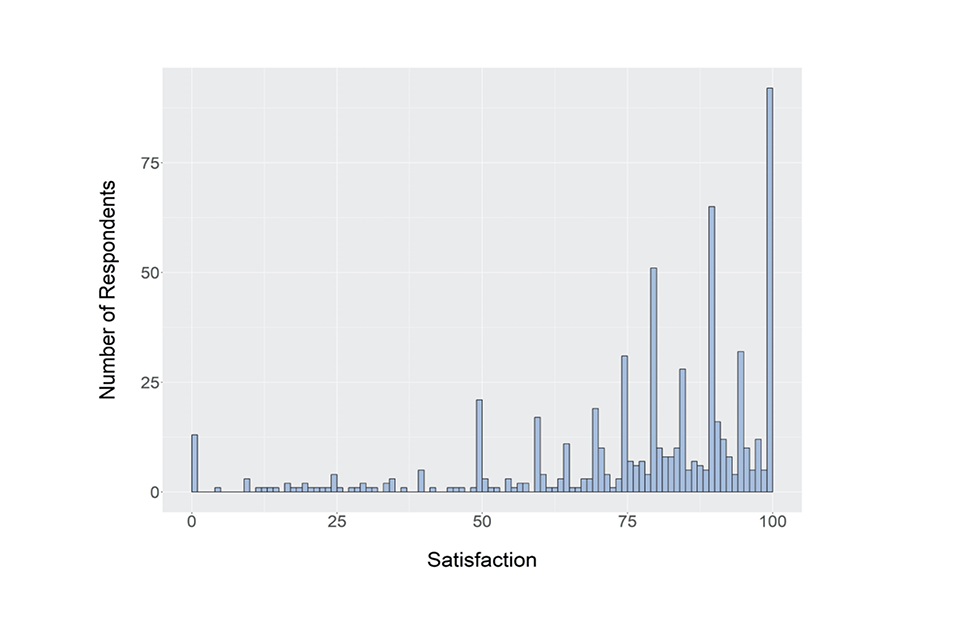
Bar chart showing responses to the question described in the caption for Figure 53 and the text that follows it.
Figure 53: Overall, how satisfied were you with the final outcome of this qualification-level agreement process for your students’ CAGs/rank orders? (N = 628)
We presented a slider running from 0 to 100 with the marker starting position on 0. Respondents were asked to drag the slider to indicate their satisfaction, with 0 indicating not at all satisfied and 100 indicating totally satisfied. The overall mean satisfaction score (out of 100) for this agreement of the centre judgements for a whole qualification was 78.0, with a median value of 84 (see Figure 53). The majority expressed fairly high satisfaction levels, although this was not universal, with 13% giving scores of 50 or below.
3.5.1 Rank ordering as part of the centre judgement agreement process
This sub-section refers to producing a rank order of all candidates for a qualification. Those respondents who answered yes to the first question were presented with the rest of the questions in this sub-section.
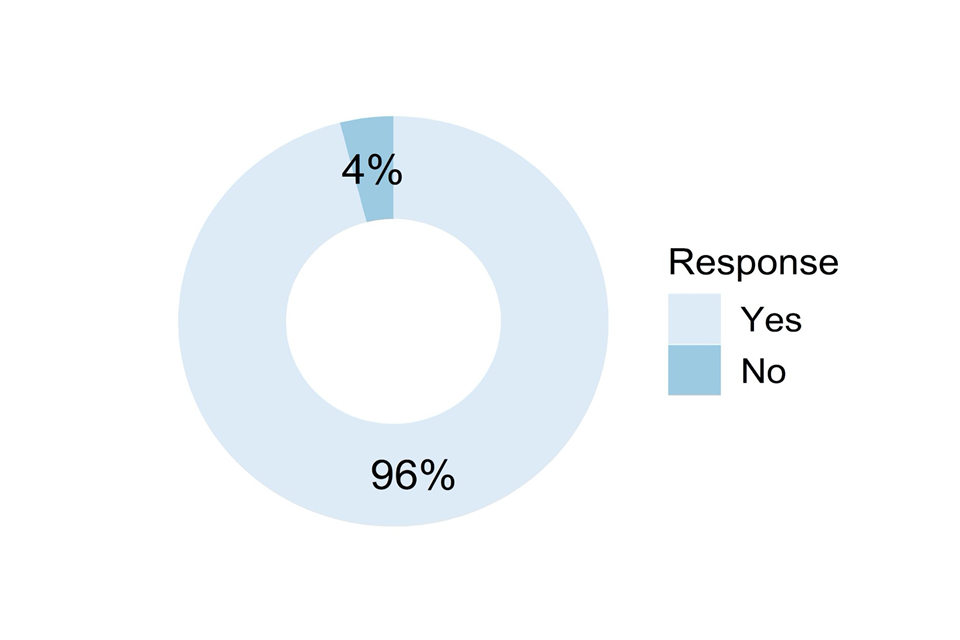
Doughnut chart showing responses to the question described in the caption for Figure 54 and the text that follows it.
Figure 54: Did you have to generate candidate rank orders as part of your submission? (N = 601)
In response to this question (see Figure 54), 96% stated that rank orders had been part of their submission. The 4% who said no were involved in VTQ submissions where no rank order was required. Respondents who said yes were presented with the following pair of questions regarding rank orders.
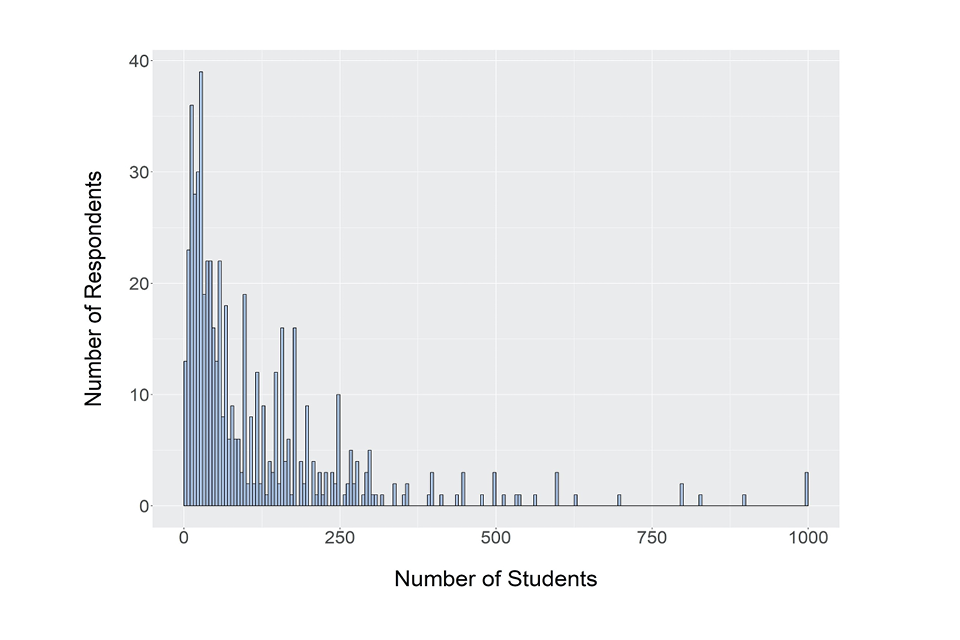
Bar chart showing responses to the question described in the caption for Figure 55 and the text that follows it.
Figure 55: As best you can remember, how many students did you have to rank order within the qualification (if you were involved in more than one submission, then give your largest submission)? (N = 566)
The overall mean number of students rank ordered within a qualification for our sample of respondents was 129.2 (see Figure 55). The median number of students was 61. In the majority of cases more than one class would have needed to be combined to create the rank order. If we assume an average class size of 30, 70% of rank orders worked on were larger than 30 and so are likely to indicate multiple classes to be combined. Some entry numbers were very large. The above graph has been truncated at 1000 students for clarity. There were an additional 6 responses from 1000 to 2000 students. These are larger than typical secondary school or college entry numbers and probably represent mathematics and English GCSE re-sit groups at larger post-16 colleges.
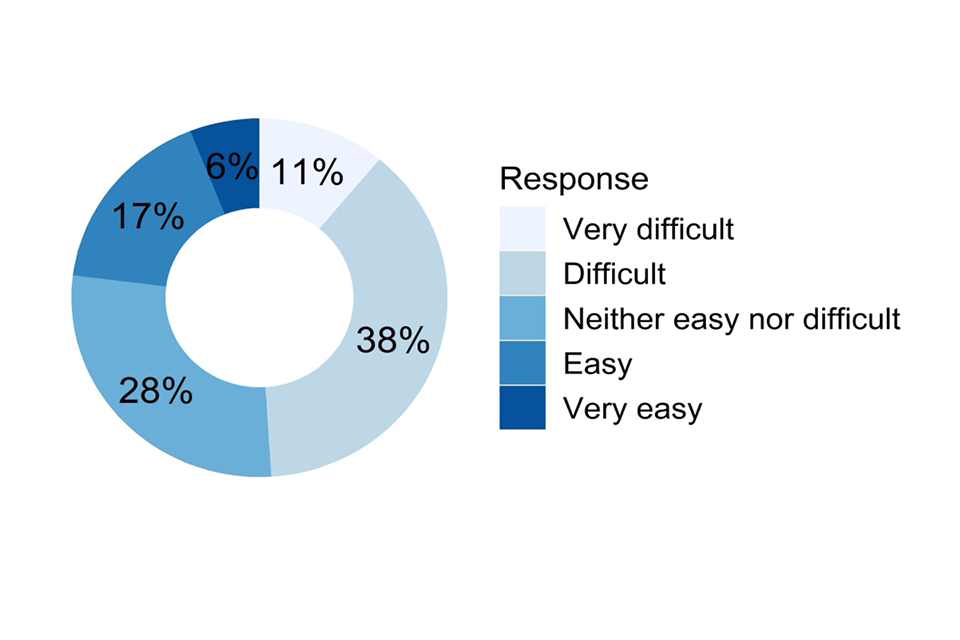
Doughnut chart showing responses to the question described in the caption for Figure 56 and the text that follows it.
Figure 56: How easy or difficult was it to agree rank orders for the final submission? (N = 590)
The agreement of final rank orders was not generally considered to be an easy task (see Figure 56). More respondents thought that if was difficult or very difficult (49%) than easy or very easy (23%). Twenty-eight per cent thought that it was neither easy or difficult. There was therefore a great deal of variation in rank ordering difficulty, which may relate to different processes, different number of staff involved, or simply the student cohort size. ### 3.5.2 Combination of students across centres
This sub-section refers to combining judgements for students across more than one centre, for example large colleges with multiple sites or multi-academy trusts where awarding organisations required a single submission across sites for some qualifications. Those respondents who answered yes to the first question were presented with the rest of the questions in this section.
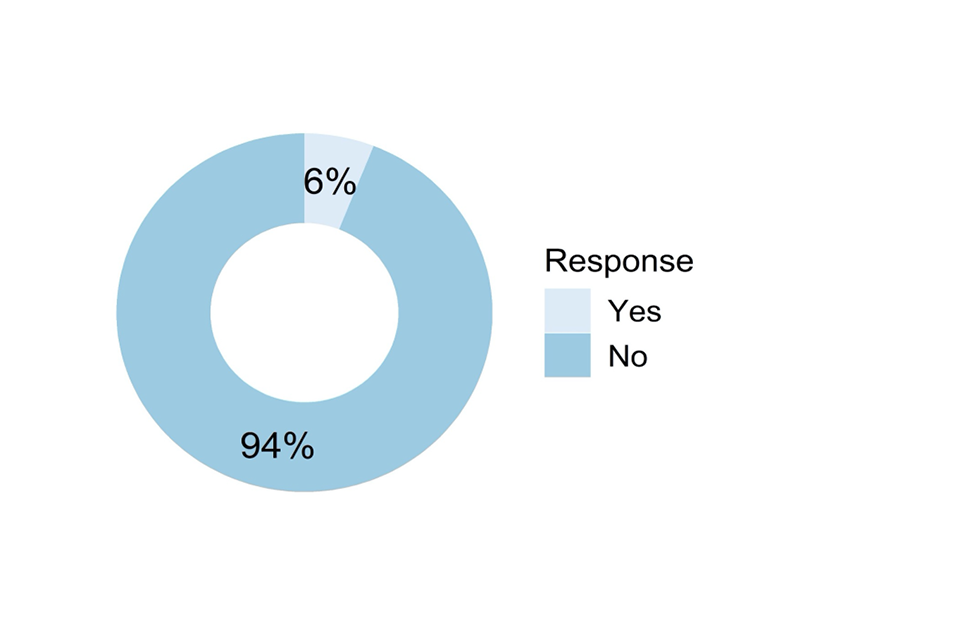
Doughnut chart showing responses to the question described in the caption for Figure 57 and the text that follows it.
Figure 57: Did you have to combine Candidate Assessment Grades across more than one centre? (N = 632)
Only 6% of respondents were involved in combining judgements across more than one centre (see Figure 57). These respondents were asked the following question.
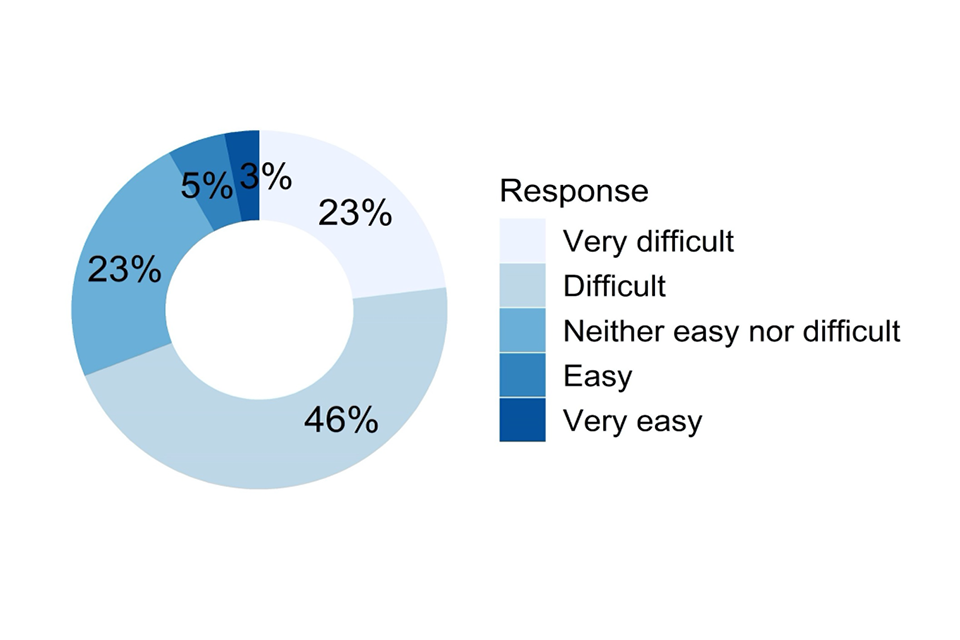
Doughnut chart showing responses to the question described in the caption for Figure 58 and the text that follows it.
Figure 58: How easy or difficult was it to agree a final combined set (across centres) of Centre Assessment Grades and a rank order where required? (N = 39)
Of the small number of respondents who were involved in cross-centre combination of judgements within qualifications, 69% reported that this was difficult or very difficult, with only 8% saying this was easy or very easy (see Figure 58). This is a higher level of difficulty than was reported across all qualification-level rank order agreement detailed above, indicating this was a difficult task. The lack of familiarity with students in all the centres for any staff is likely to have been a factor in this difficulty. ## 3.6 Qualification-level lead
This section was made up of questions for the person who took overall responsibility for centre judgements for at least one qualification. They would have led the discussions we asked questions about in the previous section (3.5). They would often be head of departments or subject leads who took charge of the production of the final submissions to the exam board/awarding organisation for individual qualifications. This was prior to the head of centre declaration form being signed, which we did not necessarily expect individuals completing this section to have signed. All respondents to the survey were asked the first question below, and then those who answered yes had the opportunity to answer the questions in the rest of this section.

Doughnut chart showing responses to the question described in the caption for Figure 59 and the text that follows it.
Figure 59: Did you take ultimate responsibility for the generation of Centre Assessed Grades for one (or more) qualification(s), excluding the signing of the centre declaration? (N = 902)
Of the respondents asked this mandatory question, 44% stated that they were responsible for the final qualification-level judgements, prior to the signing of the centre declaration form (see Figure 59).

Bar chart showing responses to the question described in the caption for Figure 60 and the text that follows it.
Figure 60: Stated role of those who said that they took ultimate responsibility for the generation of Centre Assessed Grades for one (or more) qualification(s), excluding the signing of the centre declaration? (N = 397)
Individuals taking primary responsibility qualification-level judgements were predominantly head of departments (59% of the total), although a substantial number were also senior staff such as head of centre (9%) or their deputies (13%) (see Figure 60). These respondents were then asked the questions that follow in this section.

Bar chart showing responses to the question described in the caption for Figure 61 and the text that follows it.
Figure 61: How sure are you that the final submitted outcomes for the qualification(s) you are responsible for were free from any bias? (N = 396)
We presented a slider running from 0 to 100 with the marker starting position on 0. Respondents were asked to drag the slider to indicate their confidence, with 0 indicating unsure and 100 indicating definitely sure. Stated mean confidence that the final submitted outcomes at qualification-level were free from any bias (out of 100) across the responses we received was 89.4, with a median value of 95 (see Figure 61).
Although there were a few responses at 50 and a handful much lower indicating uncertainty that bias was eliminated, these responses overall represent a high level of certainty in the fairness of the grades produced for the qualification they were responsible for. It must be remembered that these are confidence ratings, and low confidence does not indicate the definite presence of bias, just less confidence that they were free of any bias. Conversely, high confidence does not guarantee that there was no bias, but respondents must have felt that they had taken sufficient steps to minimise bias.
We then asked those who were responsible for the final qualification-level judgements, and also those who had signed the centre declaration form (see section 3.8) “Was there anything else in hindsight you think could have been helpful in ensuring that all of the grades were objective and bias free?”. There were 88 free text responses from those qualification-level leads and 19 responses from those who signed the centre declaration forms. Several respondents took the opportunity to make it clear that they felt confident they had done everything possible as a centre or teaching professional to eliminate bias. A similar number of comments referred to either improved or clearer guidance, largely from awarding bodies, or more or improved training, as awareness of bias was seen as a good way to reduce bias. Related to this was the suggestion of a greater involvement of SENCos in the process. A number of responses did recognise that some bias would always exist whatever the processes. Clearly, in some centres there had been limited discussion of individual students, since this was mentioned a few times.
There were some individual suggestions. A more centrally controlled process was suggested, allowing less interpretation by centres which would have ensured greater consistency and limited scope for centres to let bias slip in while another mentioned greater consistency across subjects would have been helpful. Some validation across centres was also suggested, as well as some kind of external moderation process that looked at actual student work.
3.6.1 Differences across awarding organisations
We asked qualification-level leads about their experience of making judgements for more than one awarding organisation, if that was their experience.

Doughnut chart showing responses to the question described in the caption for Figure 62 and the text that follows it.
Figure 62: Were you responsible for Centre Assessment Grade submissions for qualifications offered by more than one awarding organisation/exam board? (N = 397)
Of those individuals who took ultimate responsibility for one or more set of qualification-level judgements, 49% stated that they had been responsible for submissions to more than one awarding organisation (see Figure 62). Those individuals were asked the following question.
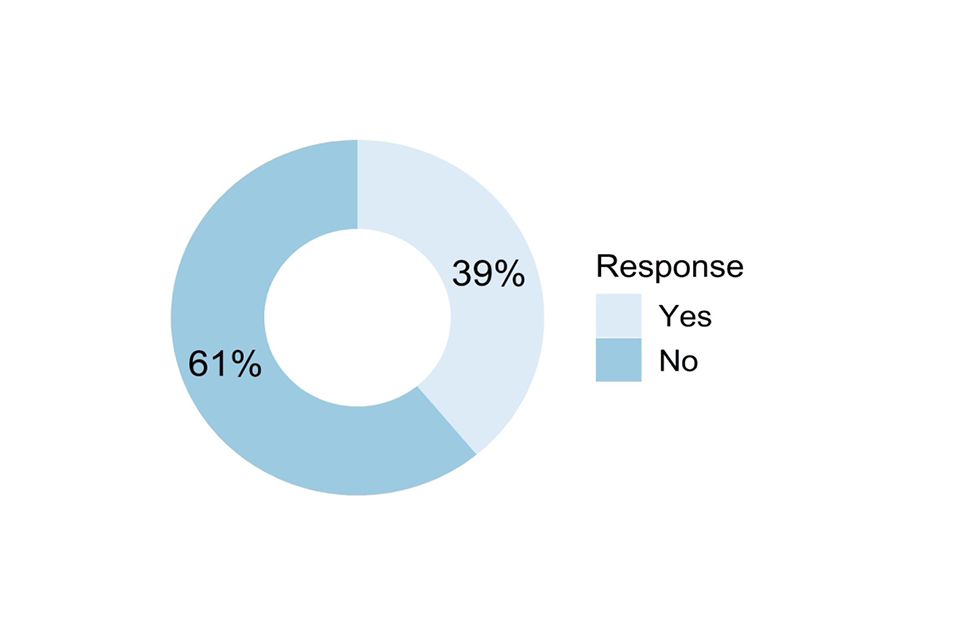
Doughnut chart showing responses to the question described in the caption for Figure 63 and the text that follows it.
Figure 63: Were there important differences in your experience of generating and/or submitting Centre Assessment Grades to different awarding organisations/exam boards? (N = 195)
Of the individuals who had experience of managing submissions to more than one awarding organisation, 39% said that there were important differences in their experiences of the process for different awarding organisations (Figure 63). Because of the common process used in GQ, these were predominantly individuals with involvement in VTQs.
We asked those who answered yes to tell us more about the differences in making judgements for different awarding organisations. There were free text responses from 37% of the respondents to this question (72 in total) giving more detail. Around half of the comments referred to differences in the systems used by AOs, and the vast differences in ease of use of these. Some systems were very simple, requiring just the upload of a completed spreadsheet, whereas others involved laborious data entry on the AO system. The built-in error checking and ability to easily make minor corrections also varied, indicating that some systems facilitated accuracy more than others.
The other slightly less frequent response referred to general differences across all AOs and the major difference between GQ and VTQ (where centres had experience of both). All of these differences caused some confusion and extra work for centre staff and sometimes the respondents questioned why there were these differences. There was also some criticism of the timing and clarity of guidance from some AOs, which again caused confusion for the centre, or delayed them being able to start, creating very tight timescales. There were a few individual criticisms of specific AO processes and the requirements they laid down, including one case of incorrect data issued by AOs. Finally, some respondents noted the different evidence requirements across AOs or the advantage they had with some qualifications due to availability of strong coursework evidence. ## 3.7 All staff who had made class-level judgements, or been involved in final agreement of qualification judgements
We asked a pair of questions regarding confidence in judgements and fairness compared to last year’s results to all respondents involved in agreeing centre judgements within a qualification (section 3.5) and those taking responsibility for the final qualification-level judgements (section 3.6), but prior to centre declaration sign off.
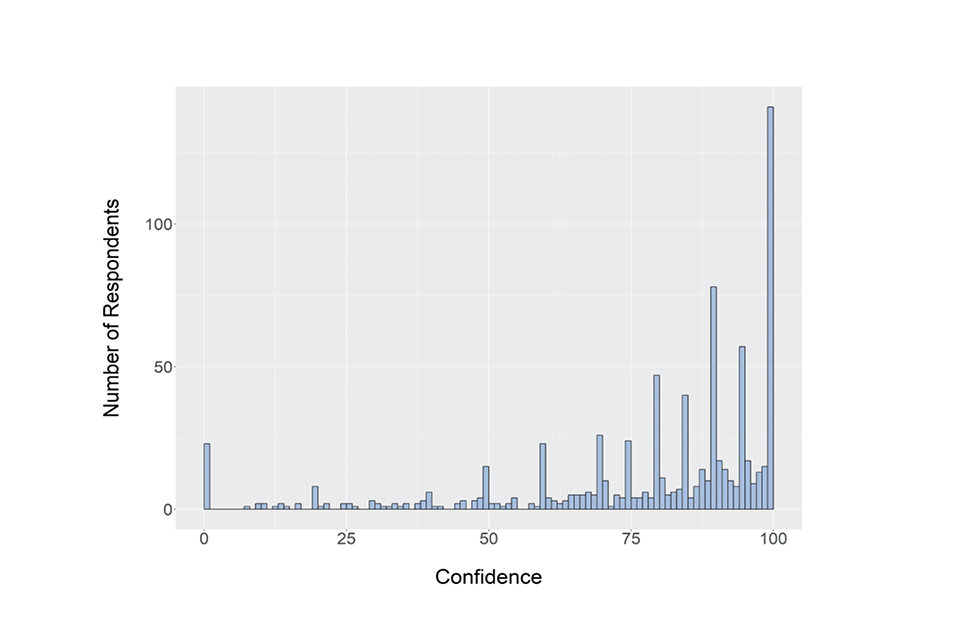
Bar chart showing responses to the question described in the caption for Figure 64 and the text that follows it.
Figure 64: Thinking about the final outcomes submitted to Awarding Organisation/Exam Board, what is your overall confidence in these Centre Assessment Grades? (N = 796)
We presented a slider running from 0 to 100 with the marker starting position on 0. Respondents were asked to drag the slider to indicate their confidence, with 0 indicating low confidence and 100 indicating high confidence. The overall mean confidence in the final centre judgements submitted to awarding organisations across the 796 responses was 78.9, with a median value of 88 (see Figure 64). The spiked distribution has again occurred through respondents selecting multiples of 5 or 10. There were 22 responses of 0, indicating a low degree of confidence from a small number of respondents. It is possible some of these individuals saw their CAGs modified by senior management. It is noteworthy that the values reported here are slightly lower and more spread out compared to the similar question regarding the original class-level judgements in Figure 44. Again, this slight shift down may reflect dissatisfaction on the part of some teaching staff with any adjustments to their original grades to bring them more into line with previous years’ results.
To investigate this further, we analysed responses to this question by some of the role types. We found that the more senior the respondent, the greater confidence they had in the final centre judgement submissions, with heads of centre having a mean confidence rating of 84.5, heads of department a mean of 81.1 and teacher/tutors a mean rating of 74.0.

Doughnut chart showing responses to the question described in the caption for Figure 65 and the text that follows it.
Figure 65: Overall, how fair are these Centre Assessment Grades compared to the grades awarded to your students last year? (N = 790)
The general consensus was that the submitted centre judgements represented grades that were of equivalent fairness to the grades awarded from normal assessment the previous year (47%, see Figure 65). Those who did think there was a difference in fairness tended to think that the grades from normal assessments the previous year were fairer (31%) with fewer believing the CAGs were fairer (14%). In a similar fashion to the previous question, senior staff had slightly more positive views of the fairness of CAGs. Whilst there were not massive differences in the view that they were equally fair, where a difference was expressed all groups thought that CAGs were less fair than the assessments the previous year. Teacher/tutors had the lowest confidence in the relative fairness of CAGs (CAGs more fair 11%, CAGs less fair 36%), while heads of centre were a little more equally split (CAGs more fair 20%, CAGs less fair 24%). ## 3.8 Head of centre declaration responsibility
In making submissions to awarding organisations, together with the final agreed centre judgements for each qualification, centres also had to provide a head of centre’s declaration supporting the accuracy and integrity of the information they were submitting. A declaration form was required for each awarding organisation a centre was making a submission to, but could cover multiple qualifications. Although these were called head of centre declarations, this sign-off could be delegated by the head of centre to other senior staff members in their place. The questions in this section related to those who had signed this declaration. We designed the questions below with the expectation that the majority of declarations would be signed by members of the senior leadership team. All respondents to the survey were asked the first question below, and then those who answered yes completed the rest of this section.
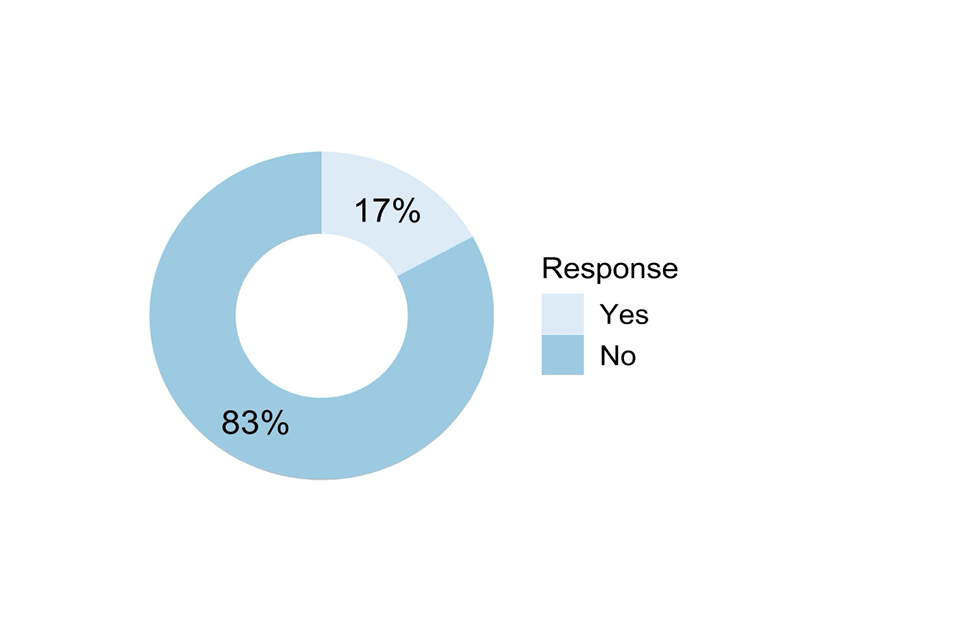
Doughnut chart showing responses to the question described in the caption for Figure 66 and the text that follows it.
Figure 66: Did you sign the centre declaration form(s) for submission to Awarding Organisations/Exam Boards? (N = 899)
Of the respondents asked this mandatory routing question, 17% stated that they were responsible for signing the centre declaration form for a submission to one or more awarding organisations (see Figure 66).
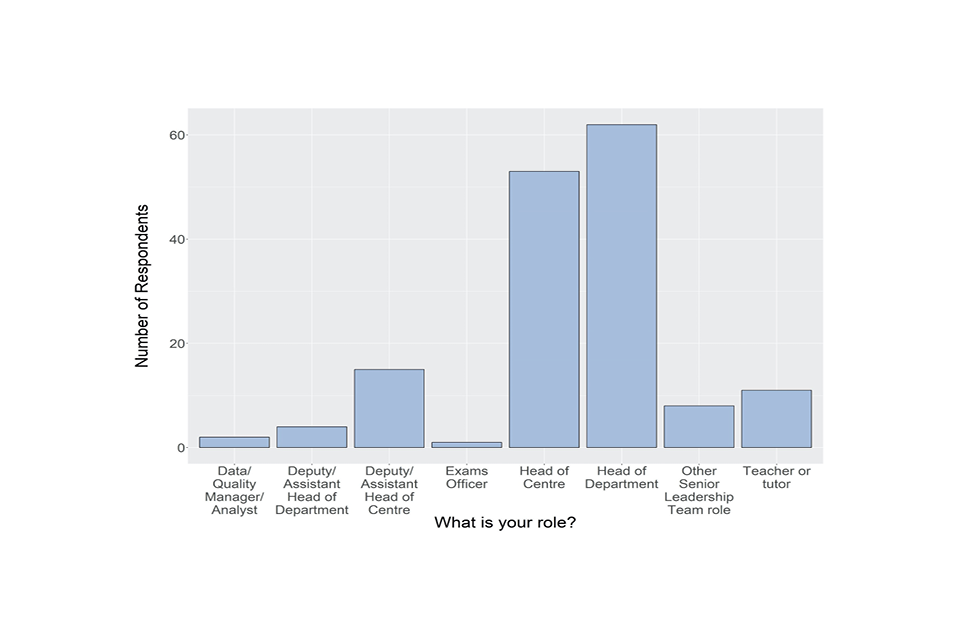
Bar chart showing responses to the question described in the caption for Figure 67 and the text that follows it.
Figure 67: Role type of those who stated that they signed the centre declaration form(s) for submission to Awarding Organisations/Exam Boards? (N = 156)
These individuals were predominantly either head of centre (34%) or head of department (40%, see Figure 67)). This indicates that the task of signing the centre declaration form was often delegated to the member of staff who were also managing the judgements at a qualification level. These respondents were then asked the questions that follow in this section.
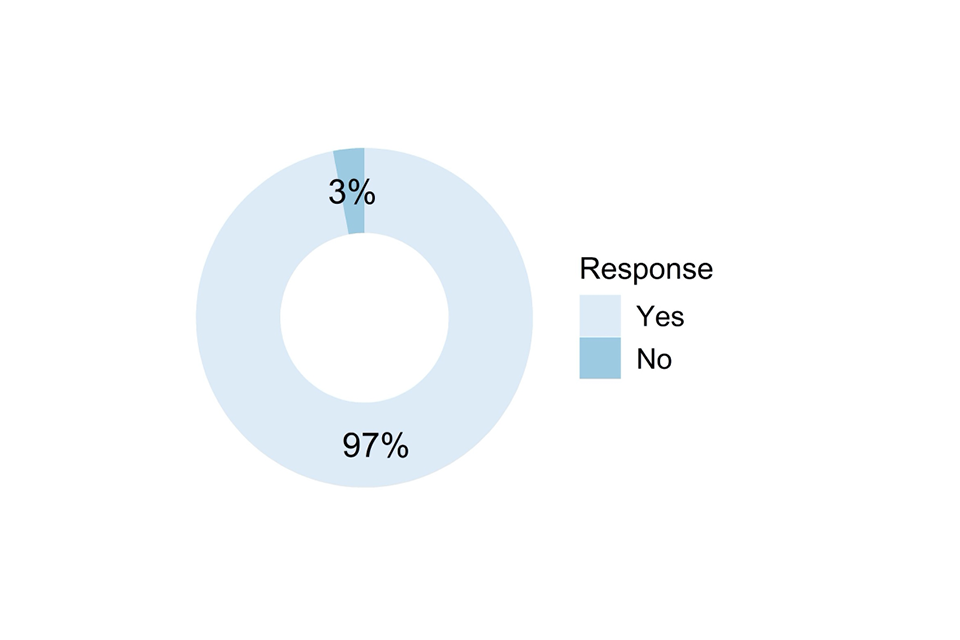
Doughnut chart showing responses to the question described in the caption for Figure 68 and the text that follows it.
Figure 68: Did the Awarding Organisations/Exam Boards make available to you/your centre general guidance around making the Centre Assessment Grade submission? (N = 156)
Almost all (97%) of the senior staff who signed the centre declaration form confirmed that they had received guidance from awarding organisations around making judgements (see Figure 68). Given the cross-section of staff roles who signed the centre declaration, the 3% who said ‘No’ represent those who reported they were not sent the information direct from awarding organisations, or through the centre’s own sharing of information. Those who had received guidance from awarding organisations answered the following pair of questions.
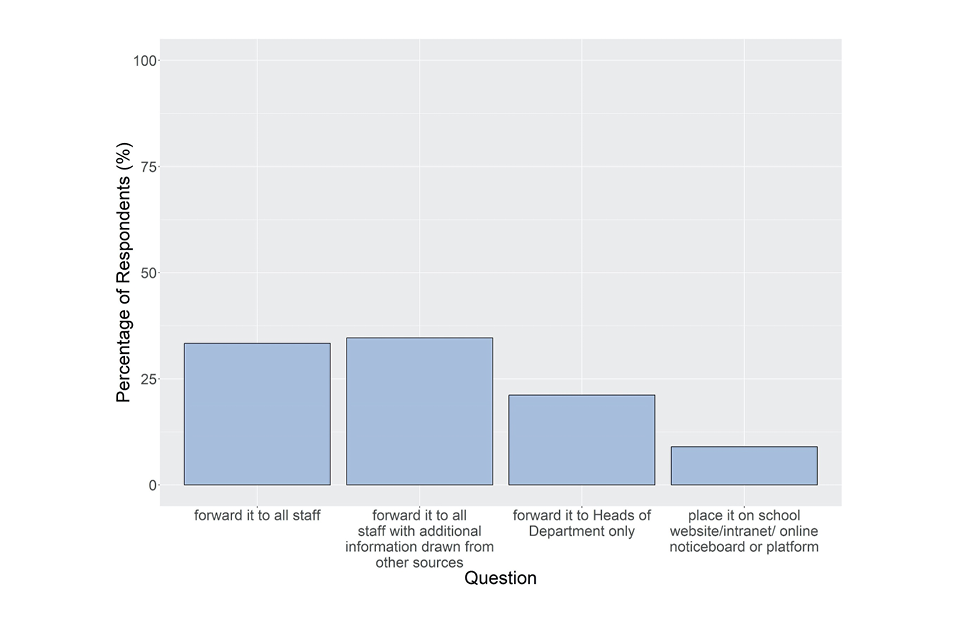
Bar chart showing responses to the question described in the caption for Figure 69 and the text that follows it.
Figure 69: What did you do with this exam bord/awarding organisation guidance? (N = 151)
The question shown in Figure 69 had the following response options, with multiple selections allowed:
- forward it to all staff
- forward it to all staff with additional information drawn from other sources
- forward it to Heads of Department only
- place it on school website/intranet/online noticeboard or platform
- other (please specify)
A substantial proportion of centres appear to have shared the exam board/awarding organisation guidance. In total, 68% of respondents suggested they had forwarded the information to all staff, either on its own or with additional information added by the centre to the communication. Because some of the respondents may not have been the individuals who received communications from awarding organisations, this may represent an under-estimate of the sharing of this information. Given that 21% also forwarded the information to heads of department only, a substantial proportion of centres do appear to have shared this information.
Thirteen respondents (9%) selected ‘Other’ and describe other forms of sharing such as the use of the guidance in preparation and training meetings, and discussions with staff (mentioned by 4 respondents) including summarising it as part of bespoke centre guidance to all staff. Three respondents shared the guidance only with SLT, leaving them to use/distribute it appropriately. A couple of responses mentioned the AO guidance being too late and only using the Ofqual guidance.
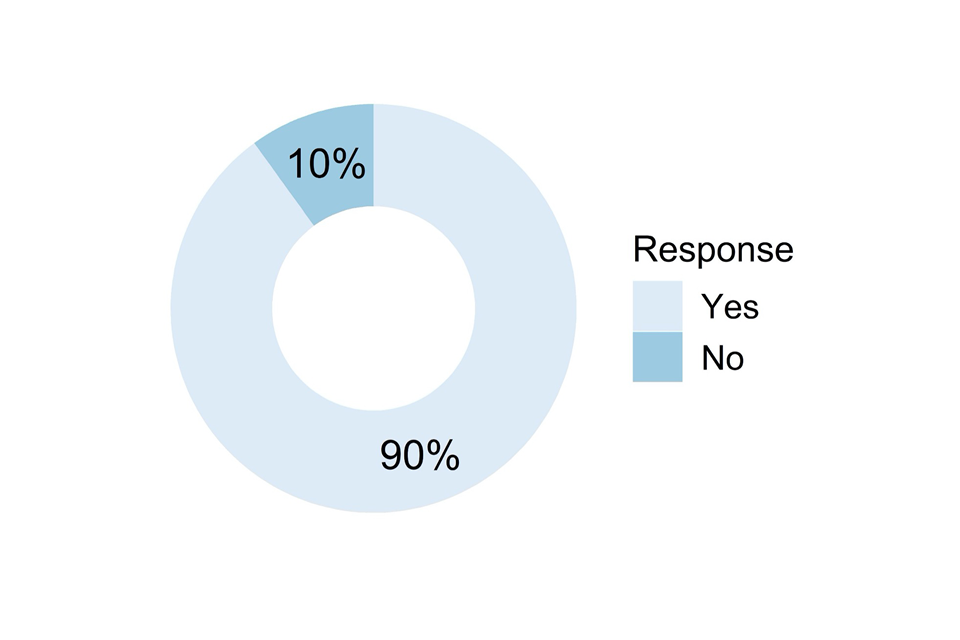
Doughnut chart showing responses to the question described in the caption for Figure 70 and the text that follows it.
Figure 70: Did this exam board/awarding organisation guidance include information on making bias-free judgements? (N = 140)
Information on making bias-free judgements was included in the information from awarding organisations received by 90% of our respondents who received guidance from the awarding organisations (see Figure 70).
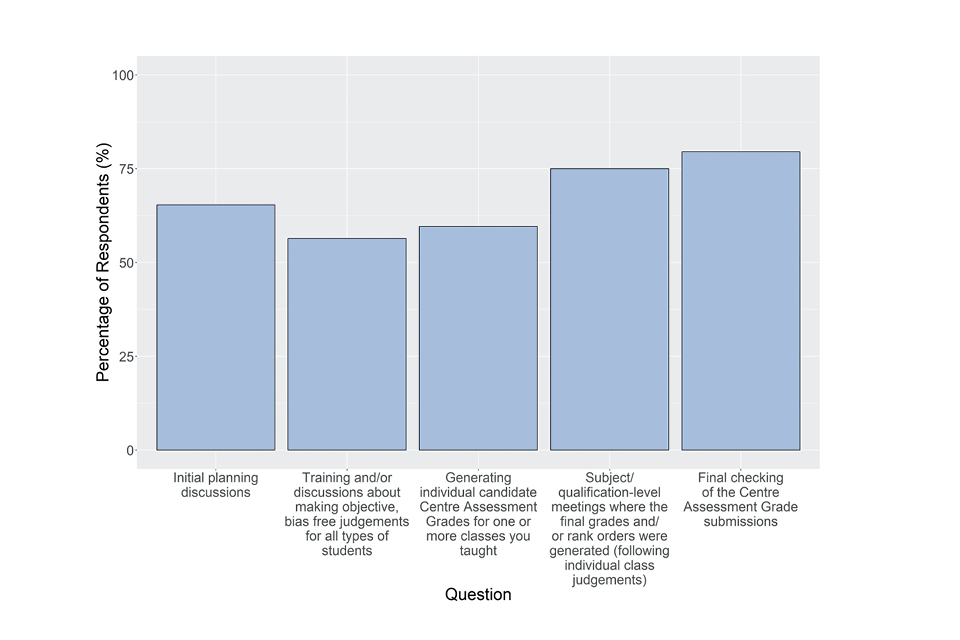
Bar chart showing responses to the question described in the caption for Figure 71 and the text that follows it.
Figure 71: Which aspects of the whole process of generating Centre Assessment Grades were you directly involved in? (N = 156)
The question shown in Figure 71 had the following response options, with multiple selections allowed:
- Initial planning discussions
- Training and/or discussions about making objective, bias free judgements for all types of students
- Determining individual candidate Centre Assessment Grades for one or more classes you taught
- Subject/qualification-level meetings where the final grades and/or rank orders were produced (following individual class judgements)
- Final checking of the Centre Assessment Grade submissions
We wanted to understand the level of involvement in the whole centre judgement process from start to finish of those individuals who signed a head of centre’s declaration form. There was a level of involvement of these respondents in all aspects of the process. Involvement in the earlier stages were a little less frequent, such as planning the process (65%) and bias training (56%). Sixty per cent made judgements for individual students.
Involvement in the later stages of agreement at qualification-level (75%) and final checks of the centre judgements (79%) were higher. These numbers suggest that there were multiple designs in place, with individuals signing centre declaration forms sometimes being staff involved in the early stages of designing and planning the process, or the later checking stage, or both. However, they may also have taught classes, and worked within departments on the judgements. There appears to be no single common design in place.
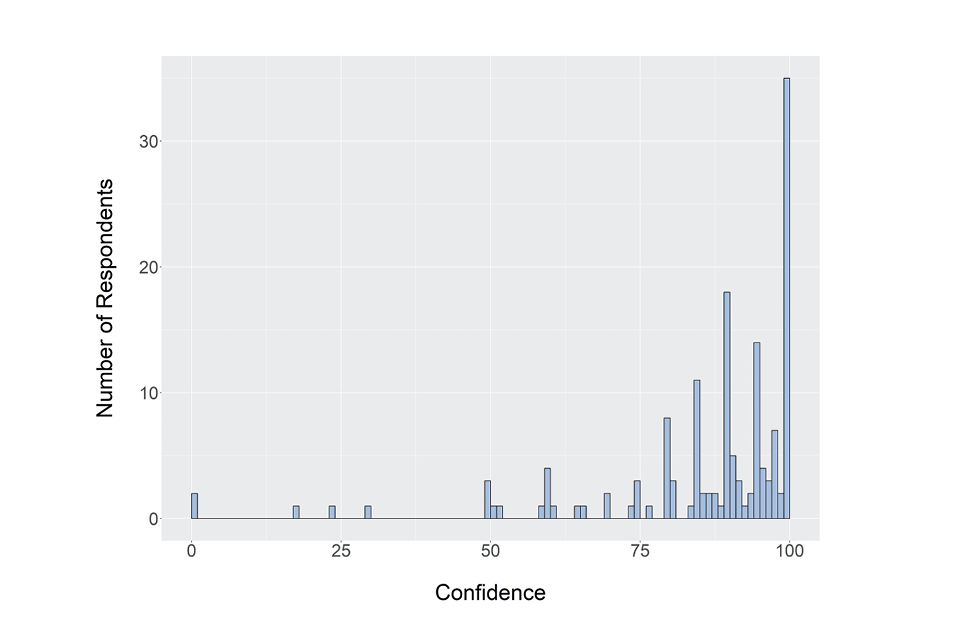
Bar chart showing responses to the question described in the caption for Figure 72 and the text that follows it.
Figure 72: How sure are you that the final submitted outcomes across all qualifications you signed off are free from any bias? (N = 149)
We presented a slider running from 0 to 100 with the marker starting position on 0. Respondents were asked to drag the slider to indicate their confidence, with 0 indicating low confidence and 100 indicating high confidence. The confidence that the final submitted outcomes at qualification-level were free from any bias (out of 100) across the respondents who signed the centre declaration form was 86.3, with a median value of 91 (see Figure 72). This same question was asked to all respondents involved in the qualification-level agreement process (see Figure 61). There, the mean confidence reported was 89.4. It is not clear why those signing the centre declaration had marginally lower confidence. It may be that they had slightly lower involvement in the discussions around individual students and so had less direct evidence to increase confidence. Indeed, some respondents did indicate quite low levels of confidence, with (5% of responses given a rating of 50 or less). However, this does not mean the submissions did have bias, just that some respondents were less confident about this.

Bar chart showing responses to the question described in the caption for Figure 73 and the text that follows it.
Figure 73: Thinking about the final submitted outcomes across all qualifications you signed off, what is your overall confidence in these Centre Assessment Grades? (N = 149)
We presented a slider running from 0 to 100 with the marker starting position on 0. Respondents were asked to drag the slider to indicate their confidence, with 0 indicating low confidence and 100 indicating high confidence. The overall mean confidence in the final judgements submitted to awarding organisations across the responses from those signing centre declarations was 85.2, with a median value of 92 (see Figure 73). This is a higher level of confidence than was expressed by all staff involved in making the qualification-level judgements in Figure 64, where the mean was 78.9 and median was 88. We noted then that the confidence there was reduced by class teacher/tutors who had lower confidence, perhaps after SLT applied changes to their initial CAGs. The data here represents the confidence of those taking responsibility for the submissions that the correct process was followed to produce fair outcomes, and closely matches that of the heads of centre alone in Figure 64. The graph shows clearly that confidence ratings of 100, 95 and 90 were the most frequent ratings given, with 63% of responses 90 or higher. This shows high overall confidence.
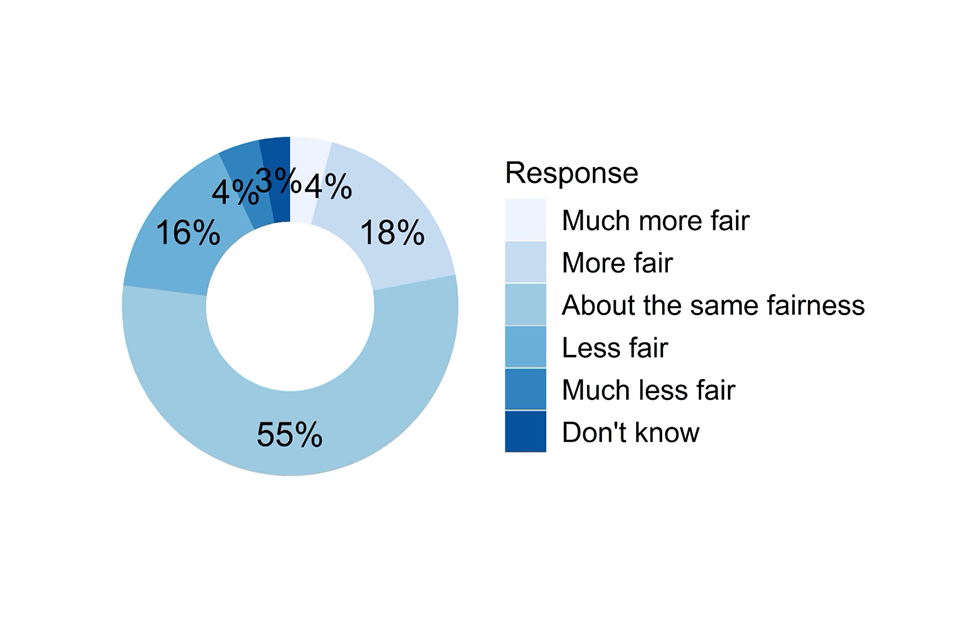
Bar chart showing responses to the question described in the caption for Figure 73 and the text that follows it.
Figure 74: Overall, how fair are these Centre Assessment Grades compared to the grades awarded to your students last year? (N = 147)
Those respondents who signed centre declarations forms largely thought that the submitted grades were of equal fairness to the grades in previous years awarded through normal assessment procedures, with 55% believing there was equal fairness (see Figure 74). Where one set of grades was considered fairer than another year, there were roughly equal numbers believing that CAGs were more fair (22%) compared to those who thought last year’s results were more fair (20%). In comparison to the view of those involved in qualification-level agreement in Figure 65, there was more belief in the CAGs from those signing centre declaration forms. ## 3.9 Final questions for all respondents
Respondents answered the following two questions at the end of the survey.
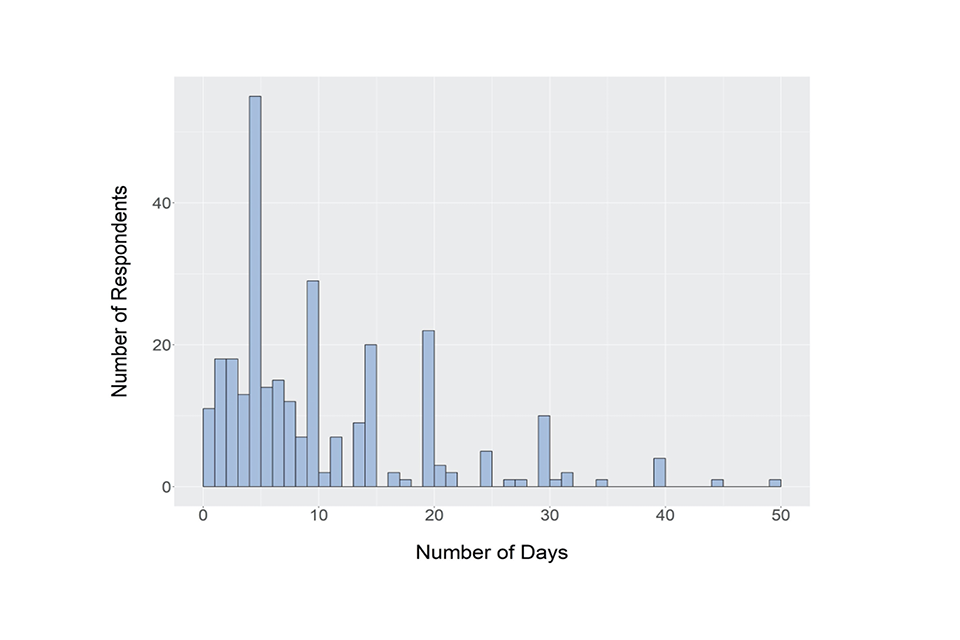
Bar chart showing responses to the question described in the caption for Figure 75 and the text that follows it.
Figure 75: Please give your best estimate as to how long you dedicated to work on Centre Assessment Grades in total? (N = 288)
Respondents were asked to type in the number of days they believed they (individually) had spent on the whole judgemental process. Due to an error in routing when the survey first went live, only 288 respondents answered this question.
The data above represents a range of staff involvement (see Figure 75). The mean of 10.9 represents a variety of different levels of involvement in the whole process. The overall median was 7 days. If we select just those with teacher/tutor as their role, their median was five days, which is probably a reasonable representation of those involved in making class level judgements, and often agreeing them within departments. More senior respondents had greater commitment, such as heads of department with a median of 8 days and heads of centre, with a median of 10 days.
Finally, we asked respondents “Please tell us anything else you wish to tell us about generating Centre Assessment Grades”. There were 314 responses to this open question. The respondents took the opportunity to express their opinions about the process or to clarify any of the points touched upon earlier in the survey. It is worth noting that the survey was conducted before the follow-up interviews and therefore this question gave them the main opportunity to voice their views and concerns even if they were not willing to take part in the follow-up interview. There were few themes that emerge in the responses to this question:
Challenges faced during the process
It was clear that those who completed the survey found the rank-ordering relatively challenging as some thought it was something ‘new’ they were requested to do. Challenges also emerged around the published guidance, in some instances, was provided too late, was too generic, or was not clear enough. This led to some of those who responded worrying about other schools’ interpretation of the guidance and therefore the perception that schools may have implemented different processes to make judgements.
In some instances, teachers mentioned that there were differences in the requirements from different awarding organisations (particularly between general and vocational qualifications), which was an added challenge to the process. Other challenges that were highlighted were those linked with the technology and arranging meetings remotely. Some mentioned that not having clear information about the appeal process whilst they were making their judgements made it more difficult.
Fairness of the process
There were around 200 responses around the fairness of the process. Overall, those who responded felt positive about the process implemented by their school or department. They felt that it was a thorough process and they spent time to ensure that the students were awarded the grades they deserved. It also emerged that there was a concern that other schools may not have been as thorough and that the students of those who had a solid process in place may be disadvantaged by the standardisation because of those other schools. There were also different views around the ranking: some teachers felt ranking was fair, whilst other felt it was not, in particular when they had to rank students from different classes that they did not know, or those students at the edge of the grade boundary.
Teachers overall felt less positive about the standardisation process. Some of those interviewed felt that the process was unfair to the students, but also to their professional judgement. The main concerns around the standardisation were the use of the school’s previous attainment which may have disadvantaged brighter cohorts this year, as well as those students from schools on an improving trajectory. Overall, teachers felt that the standardisation would have brought the grades down and this was perceived as being unfair.
Unpredictability of students’ performance
Another point that was touched upon was the unpredictability of the students’ performance. Respondents highlighted that it was difficult to award grades to those students that “pull it out of the bag” at the end and felt that these students may be disadvantaged due to lack of evidence to support their potential ability. Some also mentioned that it was also difficult to predict grades for those students who would have underperformed in the exams and in these cases, they were likely to give the benefit of the doubt.
I feel the grades we submitted were fair based on the students’ data and performances to date. However, there are always one or two students who perform outstandingly, who will not receive the high grades, because their performance to lockdown did not warrant it. Head of Department, Independent school.
The grades we submitted represented our best guess but didn‘t account for pupils not sitting the exam or failing to write anything, skewing the average in some subjects significantly. Deputy Head of Centre, Comprehensive
Overall, respondents felt that their professional judgement was valued in the unprecedented circumstances and that they were, as professionals, best placed to determine the most appropriate grades students should receive after the news of the cancellation of the exams in summer 2020. However, some indicated they would not be happy to go through the process again, and some found the process stressful. Some of the responses highlighted that the process was lengthy and not without challenges. It was highlighted that the information provided could have been clearer so that there was no room for interpretation by their SLT. A few responses mentioned that their SLT did not involve the teachers in the final decision of the grades before submission, which they found unfair.
An emotional side emerged from the responses: the teachers felt that they were responsible for the students’ progression to their next stage, as an examiner, not as a trainer. One of those who filled this section summed it up nicely:
I teach these students, preparing them ‘for battle’ against the exam paper. I train them, we are a team, working together. I know their weaknesses, I help them overcome or hide their weaknesses and work to their strengths. Suddenly I am asked to switch sides and be the examiner - forced to choose between them, who should have which grade, knowing there will not be enough to go around for all of them.” Head of Department, 6th Form College
In summary, responses highlighted that the centre judgements allowed the students to progress to their next stage and overall, those who took part in the survey felt positive about the judgements (just a few expressed a negative view about the judgements). However, generally, those surveyed disliked the idea that their CAGs may be adjusted down to be in line with previous years’ performance whether by their SLT or the standardisation performed by Ofqual and the awarding organisations.
Finally, respondents who had reached the end of the survey were asked whether they would be willing to take part in a follow-up interview. If they answered No the survey was completed. If they answered Yes, they were given more information including a privacy statement, and asked to provide their name and email address if they consented to be contacted about an interview. The interviews we carried out are detailed here.
4 Discussion
There was a great deal of confidence in the centre assessment grades and rank orders produced throughout this survey. Respondents reported high levels of confidence in the submitted centre judgements, with a median confidence rating of 88 out of 100, with many ratings of 95 or 100. Teaching staff also reported high confidence that they were bias free (a median rating of 95 out of 100) and believed that largely these grades would be comparable in fairness to the grades they would have received had they sat exams or completed other assessments.
We did observe differences in confidence across seniority. Confidence in the final submission was higher for those who signed the Head of Centre’s declaration form, with a mean rating of 85 out of 100, and a median of 92. One possibility is that the greater involvement of more senior staff in the entire process from start to finish, and their overview across different subjects, gave them higher confidence. Teacher/tutors had slightly lower confidence, which appeared to be related to concerns in some of the free text responses around having their own judgements changed, at some stage of the process before submission, to match centre results in previous years.
Many of the aspects of the process that we might have expected to cause difficulties, such as the logistics of remote working due to centre closures, did not apparently cause great difficulties – staff were generally happy that they had everything they needed, including information and contact with other staff, to complete the job well. There were no specific difficulties reported, although certain aspects of the task, particular relating to rank ordering candidates was more difficult.
A wide variety of evidence was used to make judgements, with mock and practice exams weighted the most in general qualifications, and assignments (a fairly broad category) weighted most highly in vocational and technical qualifications. Different qualifications would have weighted different evidence depending on their final assessment types, and when we analysed the evidence weightings by subject, these followed the structure of the assessment in the qualifications.
It appeared as though the various guidance from Ofqual and the exam boards was widely seen and used. Most individuals saw the guidance on bias from Ofqual and the awarding organisations, and found it useful, and senior members of staff usually shared this information with either all staff, or with heads of department.
Perhaps because of the nature of the survey, and the desire to gather numerical responses we used mostly closed-response questions. There were perhaps only a few opportunities for respondents to express dissatisfaction or disquiet. The word cloud derived from the 3 words respondents entered to summarise their experience highlights both the confidence in the judgements we have already mentioned, but also the other side of the experience. Negative feelings related to the stress and pressure of carrying out this exercise were present. We could summarise this by saying that the end result was usually viewed positively, but the experience of arriving at that result was often difficult.
The kind of issues picked up in some of the free text responses were interesting in themselves, but are more suitable for exploration in more free-ranging discussions. The interviews we carried out following this survey, with some of these respondents, included detail on all the issues touched on in this report. They are detailed in a companion report.
Annex A – Information screen on survey
When first entering the survey, potential respondents saw the following information on-screen to help decide whether to take part.
What is this survey about?
In England, many teachers, tutors and members of staff in schools, colleges and training providers have been involved in providing Centre Assessment Grades and other information as a result of the cancellation of examinations and assessments this year.
Now that the Centre Assessment Grades have been submitted to exam boards and awarding organisations, Ofqual wants to understand the professional perspectives of those who have been involved in this important process. This understanding will be invaluable for us to understand from a research perspective how the process worked, how your expert judgement was exercised, and the experience of those involved including any challenges faced. It would also inform future practice in the event that anything similar was required again.
We will publish our findings later in the year. The information you give will not influence any standardisation or quality assurance measures taken by awarding organisations, and we will not identify individuals or centres in any way - the survey does not require you to give this information.
Who is this survey for?
This survey is designed to capture the perspectives of teaching professionals at all levels of seniority, who were involved in producing the submissions to awarding organisations and exam boards, for both General Qualifications (GCSE, AS, A level) and Vocational and Technical Qualifications, provided you have already submitted your Centre Assessment Grades. This includes:
- heads of centres (or other nominated member of the senior leadership team) who signed centre declaration forms to support the submissions
- heads of department or other senior teachers who put together the submissions at qualification level and may have led the decision making around how to combine grades across multiple classes
- class teachers and tutors who may have generated Centre Assessment Grades for individual students in the classes they taught
How long will this take?
Depending on the number of aspects of generating and assuring Centre Assessment Grades you were involved in, the survey will likely take 10-15 minutes.
If you were involved in many aspects and want to give fuller answers, it may take up to 30 minutes.
The survey is mostly made up of closed response/multiple selection questions, although there are a few places to tell us more in your own words.
How will my responses be treated?
Before you start, we would like to assure you that your answers will be treated in strict confidence in accordance with the Data Protection Act and the General Data Protection Regulation (GDPR). It will not be possible to identify any individual in the results. The information that you provide will be used only for the purposes of research and to help us regulate more effectively.
If you have any questions about this survey please contact us at:
To continue with the survey please confirm both statements below:
My centre has completed the submission of Centre Assessment Grades to Awarding Organisations/Exam Boards for the qualifications I will tell you about.
I have read the information on this page and wish to continue with the survey.