Carbapenemase-producing Gram-negative organisms in England since October 2020: quarterly update, Q4 2025
Updated 9 July 2026
Applies to England

© Crown copyright 2026
This publication is licensed under the terms of the Open Government Licence v3.0 except where otherwise stated. To view this licence, visit nationalarchives.gov.uk/doc/open-government-licence/version/3 or write to the Information Policy Team, The National Archives, Kew, London TW9 4DU, or email: psi@nationalarchives.gov.uk.
Where we have identified any third party copyright information you will need to obtain permission from the copyright holders concerned.
This publication is available at https://www.gov.uk/government/publications/carbapenemase-producing-gram-negative-organisms-laboratory-surveillance/carbapenemase-producing-gram-negative-organisms-in-england-since-october-2020-quarterly-update-q4-2025
Main messages
Main messages from this report are that:
- between October 2020 and December 2025, 27,815 acquired carbapenemase-producing organism (CPO) episodes were reported to UKHSA – the majority were identified from screening samples, accounting for 71.3% of notifications, with 1,265 (4.5%) reported from sterile site specimens
- the quarterly rate of reported CPO episodes fell from 3.5 to 2.9 per 100,000 population per quarter between Q3 and Q4 2025, with all regions reporting fewer positive screening samples than in the previous quarter
- the rate of sterile site samples reported remained stable between 2024 and 2025 (0.14 per 100,000 population) – there were 68 sterile site CPO specimen reports in Q4 2025, a 32.7% decrease from the 101 specimens reported in Q3 2025
- the Office for National Statistics (ONS) regions with the highest annual rates of CPO in the last year (Q1 2025 to Q4 2025) were London and the West Midlands (22.8, and 19.6 per 100,000 population, respectively) – at the Integrated Care Board (ICB) level, NHS Staffordshire and Stoke-on-Trent ICB had the highest annual rate (37.9 per 100,000 population) and NHS Gloucestershire ICB had the lowest (0.5 per 100,000 population)
- the most reported acquired carbapenemase families over the last year (Q1 2025 to Q4 2025) were NDM and OXA-48-like (both 39.1%), followed by KPC (14.4%) – similarly, for most ONS regions, NDM was the most reported mechanism; except West Midlands, Yorkshire and the Humber, and the North West, where OXA-48-like was the most reported mechanism
- no changes since the last report occurred in the populations with the highest rates of CPOs (males, the 85 years and over, and the most deprived decile)
Background
Since 1 October 2020, all diagnostic laboratories in England have a duty to notify the following via UKHSA’s Second Generation Surveillance System (SGSS) (1):
- acquired carbapenemase-producing Gram-negative bacteria identified in human samples
- the results of any antimicrobial susceptibility test and carbapenem resistance mechanism in any of the causative agents listed in Schedule 2 of the Health Protection (Notifications) Regulations 2010.
This requirement was launched in conjunction with the national Framework of actions to contain carbapenemase-producing Enterobacterales (CPE), which sets out a range of measures that, if implemented well, can help health and social care providers minimise the impact of carbapenemase-producing organisms (CPOs).
The analyses below are based on data relating to notifications of CPOs confirmed to produce an acquired carbapenemase (‘acquired CPOs’) between 1 October 2020 and 31 December 2025 in England. The data were extracted on 3 March 2026 from both UKHSA’s voluntary surveillance database, SGSS, and the Antimicrobial Resistance and Healthcare-Associated Infections (AMRHAI) Reference Unit‘s database.
Both annual and quarterly rates of acquired CPOs were calculated using mid-year resident population estimates for the respective year (where available, or the closest available year as a proxy) and geography. Geographical analyses were based on the patient’s residential postcode. Where this information was unknown, the postcode of the reporting laboratory was used. Cases in England were further assigned to one of 9 local areas and one of 42 integrated care boards (ICBs), formed from the administrative local authority boundaries and Office for National Statistics ICB boundaries.
Samples are split into 3 specimen types: sterile site specimens (for example, blood or cerebrospinal fluid), screening site specimens (for example, faeces or lower gastrointestinal tract) or ‘other’ specimen type (for example, urine or lower genital tract). Patients with multiple positive samples with the same specimen type, organism, and carbapenemase family during a rolling 52-week period from the initial positive sample were considered part of the same episode and were de-duplicated. CPO isolates referred to the AMRHAI Reference Unit and local laboratory isolates were combined for this de-duplication process, with resistance mechanism results from the AMRHAI Reference Unit retained preferentially where patient specimen overlap occurred. (Note: not all specimens in this report are confirmed by the AMRHAI Reference Unit). This method differs slightly from the weekly causative agent notification data, where data is not de-duplicated incorporating specimen type. In addition, the data presented in the weekly notification reports is utilising SGSS reports only.
Each carbapenemase in the report is presented as a separate mechanism and not as a combination (for example, NDM + OXA-48-like), unless specified.
The index of multiple deprivation (IMD) is a way of summarising the level of deprivation within a geographical area, based on a set of factors that includes its residents’ levels of income, employment, education and local levels of crime. Episodes were linked to IMD using the patient’s residential postcode (or laboratory postcode when patient postcode was unavailable) and the IMD decile score was identified by the lower super-output area the patient resided in.
Please refer to the Q1 2025 report for the most recent data on ethnicity (2).
Reporting of quarterly totals of rectal swabs and faecal specimens taken for CPO screening was added to the mandatory quarterly laboratory returns (QMLR) section of the HCAI DCS in October 2019, and reporting became mandatory in October 2020.
The following report summarises trends and geographical distributions of carbapenemase mechanisms identified in Gram-negative bacteria isolated from human samples. Bacterial species, mechanism, sample type, age, sex and IMD of patients, as well as QMLR data for CPO screening, are also described. For the purposes of this report, quarters are calendar quarters; as such, January to March is referred to as ‘Q1’, April to June is ‘Q2’, July to September is ‘Q3’ and October to December is ‘Q4’.
Please note that scientific names are not italicised in this report to ensure our content is inclusive for all users and in compliance with web accessibility legislation and associated guidelines.
Microbiology services
For reference services, including species identification and confirmation of antimicrobial susceptibility testing results, laboratories should contact UKHSA’s Antimicrobial Resistance and Healthcare Associated Infections (AMRHAI) Reference Unit in Colindale, London.
Table 1 summarises the carbapenemase gene families that are targeted using the PCR applied to referred isolates of Enterobacterales, Pseudomonas spp. and Acinetobacter spp. that are suspected to harbour an acquired carbapenemase gene. UKHSA strongly recommends that all diagnostic laboratories seek at least the 4 carbapenemase families in bold in the table (the ‘big 4’) using either PCR or immunochromatographic methods.
Isolates should be sent to the AMRHAI Reference Unit for confirmation when (one of the following):
- an ‘exceptional’ carbapenemase and genus combination result has been identified (cells without a ¥ symbol in Table 1)
- an unusual organism has been identified with an acquired carbapenemase (that is, any bacterial genera other than members of the Enterobacterales, Pseudomonas spp. or Acinetobacter spp.)
Table 1. Distribution among bacterial pathogens of carbapenemase gene families covered by AMRHAI Reference Unit’s molecular assay (based on AMRHAI data) [note 1]
| Carbapenemase gene families | Associated with common ‘host’ organism Enterobacterales | Associated common ‘host’ organism Pseudomonas spp. | Associated with common ‘host’ organism Acinetobacter spp. |
|---|---|---|---|
| KPC | ¥ | <10D | <10D |
| OXA-48-like | ¥ | <50E | 0 |
| NDM | ¥ | ¥ | ¥ |
| VIM | ¥ | ¥ | <10D |
| IMP | ¥ | ¥ | ¥ |
| IMI/NMC-A | ¥B | 0 | 0 |
| GES | ¥ | ¥ | <10D |
| FRI | <10 D | 0 | 0 |
| SME | ¥ C | 0 | 0 |
| DIM | 0 | <50E | 0 |
| GIM | <10D | <10D | 0 |
| SIM | 0 | <10D | 0 |
| SPM | 0 | <10D | 0 |
| OXA-23-like | <50E | 0 | ¥ |
| OXA-40-like | 0 | 0 | ¥ |
| OXA-51-likeA | 0 | 0 | ¥ |
| OXA-58-like | 0 | 0 | ¥ |
Note 1. Table 1 uses the following symbols:
¥ = combinations of mechanism and genus are not considered exceptional.
A = intrinsic to A. baumannii and only expressed when associated with an insertion element.
B = almost exclusively reported in Enterobacter spp. with less than a handful of reports in other genera.
C = reported only in Serratia marcescens.
D = fewer than 10 in total ever confirmed by AMRHAI Reference Unit.
E = fewer than 50 in total ever confirmed by AMRHAI Reference Unit.
Recent developments
Of the unusual carbapenemase and genus combinations referred to the AMRHAI Reference Unit in Q4 2025, one included a GES non-metallo-carbapenemase-positive Pseudomonas aeruginosa (from urine) referred from London. One IMI-positive Enterobacter sp. (from a rectal swab) was referred from the East of England.
As GES and IMI genes are not detected using diagnostic assays that target the ‘big 4’ or ‘big 5’ carbapenemase families (‘big 5’ includes IMP), laboratories are reminded to refer isolates that meet AMRHAI referral criteria (3) to the Reference Unit for screening for rarer carbapenemase genes.
The most common dual carbapenemase combination observed amongst Reference Unit referrals was NDM + OXA-48-like. However, in Q4 2025 one KPC + IMP-positive Enterobacter hormaechei and one IMP + OXA-48-like-positive Enterobacter cloacae (both from rectal swabs) were referred from Yorkshire and Humber, and one IMP + VIM Pseudomonas aeruginosa (from urine) was referred from the West Midlands. Isolates with these combinations are currently rare amongst AMRHAI submissions and should be referred for confirmation (free-of-charge for NHS laboratories) and inclusion in the AMRHAI strain collection.
Locally-confirmed unusual combinations of organism and mechanism should also be referred to the AMRHAI Reference Unit for confirmation. Follow up of these unusual combinations has sometimes identified mixed cultures or reporting errors as the underlying cause, rather than genuine unusual resistance mechanisms.
Specimen type
Between October 2020 and December 2025, there were 27,815 acquired CPO episodes reported. The majority were identified in screening samples, accounting for 71.3% of notifications, with 1,265 (4.5%) reported from sterile site specimens (Table 2).
Table 2. Number and percentage of acquired CPO episodes by specimen type (England): October 2020 to December 2025
| Specimen type | All reports number | All reports percentage [note 3] | AMRHAI reports number |
AMRHAI reports percentage [note 4] |
|---|---|---|---|---|
| Sterile site | 1,265 | 4.5 | 347 | 10.2 |
| Other clinical samples [note 2] | 6,707 | 24.1 | 1,437 | 42.3 |
| Screening | 19,843 | 71.3 | 1,616 | 47.5 |
| All samples | 27,815 | 100 | 3,400 | 100 |
Note 2. Samples that did not fall into either ‘sterile site’ or ‘screening’ samples, for example, urine and lower genital tract specimens.
Note 3. The percentages presented in this table are column percentages, with the breakdown of specimen types shown for all reports and AMRHAI reports separately.
Note 4. The AMRHAI Reference Unit actively encourages submission of sterile site isolates for carbapenemase confirmation; the distribution of specimen type will reflect this.
Quarterly trends
For Q1 2025 to Q4 2025, the overall annual rate of CPO episodes in England was 12.0 per 100,000 population, which is a reduction from the 2024 annual rate of 13.0 per 100,000 population (4). The quarterly rate of CPO episodes decreased from 3.5 CPO episodes per 100,000 in Q3 2025 to 2.9 episodes per 100,000 in Q4 2025 (Figure 1). This was due to a 18.3% decrease in positive screening samples between Q3 2025 and Q4 2025 (n=1,464 to 1,196). The decrease in reported positive screening samples was across all ONS regions (see accompanying data tables, Appendix table 1). The rate of sterile site samples reported remained stable between 2024 and 2025 (0.14 per 100,000 population). In Q4 2025, the number of sterile site samples decreased from last quarter by 32.7% (n=101 episodes in Q3 2025 to 68 in Q4 2025) (Figure 1), and was 30.9% lower than the number of episodes reported in Q4 2024 (n=89, 0.16 per 100,000).
Changes to screening policies, outbreaks and/or an improvement in national reporting of CPO episodes can have a substantial impact on overall CPO trends. It is therefore important to note that the reported change in CPO screening episodes may be due in part to changes in screening policies and improved reporting over time. There appears to be seasonality in the number of positive reported screening samples, with peaks in Q3 over the last 4 years and subsequent drops in Q4 and Q1. However, caution should be taken when interpreting seasonal trends, especially for ‘other’ and sterile site specimens, and local outbreaks may influence sampling and incidence.
Figure 1. Quarterly rate of acquired CPO episodes by specimen type and quarter (England): October 2020 to December 2025
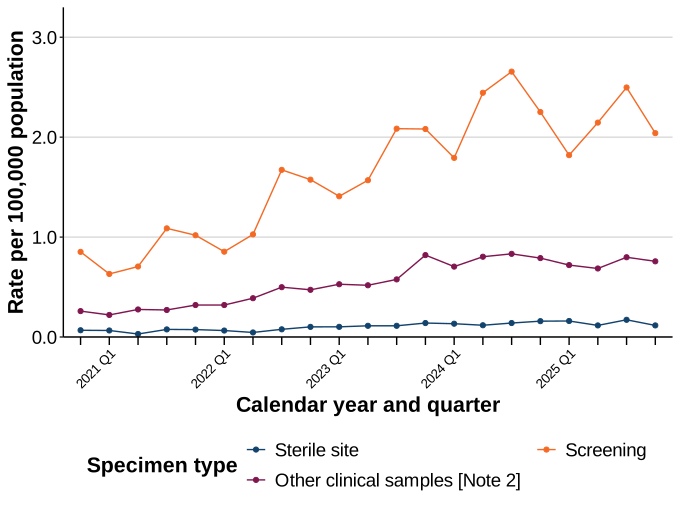
Note 2. Samples that did not fall into either ‘sterile site’ or ‘screening’ samples, for example, urine and lower genital tract specimens.
Epidemiology of CPO episodes over the past year (Q1 2025 to Q4 2025)
The data summaries in the rest of this report consider all sample types grouped together and only for the past rolling year (January 2025 to December 2025), using both annual and quarterly rates.
Geographical distribution
The annual rate of acquired CPO episodes varied by ONS region (Figure 2a). The highest overall rate between January 2025 to December 2025 was reported in London (22.8 episodes per 100,000 population), followed by the West Midlands (19.6 episodes per 100,000 population). The lowest annual incidence during the last year was reported in the South West region (2.8 episodes per 100,000 population).
At the ICB level, NHS Staffordshire and Stoke-on-Trent ICB had the highest rate of CPO reports (37.9 episodes per 100,000 population). This was followed by NHS North West London ICB (34.2 episodes per 100,000) and NHS Birmingham and Solihull ICB (27 episodes per 100,000 population) (Figure 2b). The lowest annual incidence over the last year was reported in the NHS Gloucestershire ICB (0.5 episodes per 100,000 population). Regional and ICB variation can be due to differences in incidence, as well as variation in screening policies, outbreaks and reporting to national surveillance.
Figure 2a. UKHSA regional distribution of acquired CPO annual incidence rates per 100,000 population (England): January 2025 to December 2025 [note 5]
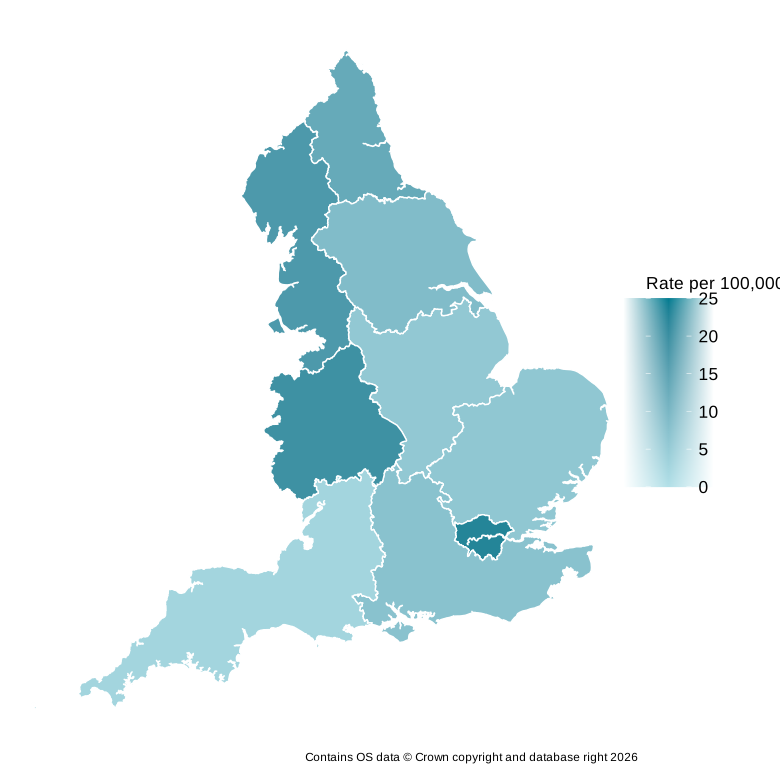
Figure 2b. Integrated Care Board (ICB) regional distribution of acquired CPO annual incidence rates per 100,000 population (England): January 2025 to December 2025 [note 5]
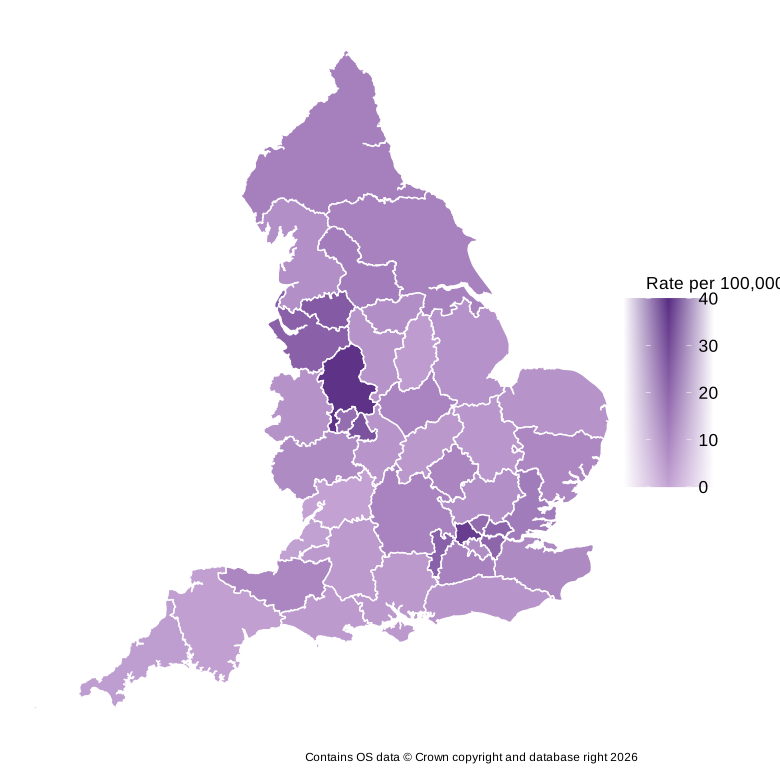
Note 5. The region and ICB geographies is based on the patient’s residential postcode (if unknown, the reporting laboratory postcode was used) and linked to the ONS data for regions (Figure 2a) and for ICBs (Figure 2b). Forty-nine CPO episodes (0.7% of all CPO episodes) were excluded as the patient postcode could not be linked to an ICB.
The numbers and quarterly rates of reported acquired CPO episodes for each ONS region by calendar quarter are shown in Table 3. The quarterly rate of reported CPO episodes decreased between Q3 2025 and Q4 2025 in all nine ONS regions. The largest decrease in rates from Q3 2025 and Q4 2025 was seen in the North West (5.4 to 3.7 per 100,000 population) and Yorkshire and the Humber (2.5 to 1.9 per 100,000 population). London had the highest rate of reported CPO episodes in Q4 2025 of 6.3 per 100,000 (Table 3).
Table 3. Number of acquired CPO episodes and quarterly rate per 100,000 population for all specimen types by ONS region (England): January 2025 to December 2025
| ONS region | Number (n) (rate per 100,000 population) of 2025 Q1 | Number (n) (rate per 100,000 population) of 2025 Q2 | Number (n) (rate per 100,000 population) of 2025 Q3 | Number (n) (rate per 100,000 population) of 2025 Q4 |
|---|---|---|---|---|
| London | 449 (4.9) | 461 (5.1) | 588 (6.5) | 571 (6.3) |
| North East | 102 (3.7) | 133 (4.8) | 72 (2.6) | 60 (2.2) |
| West Midlands | 294 (4.8) | 295 (4.8) | 324 (5.2) | 301 (4.9) |
| North West | 283 (3.7) | 357 (4.6) | 421 (5.4) | 287 (3.7) |
| Yorkshire and The Humber | 116 (2.0) | 125 (2.2) | 143 (2.5) | 108 (1.9) |
| South East | 172 (1.8) | 168 (1.8) | 196 (2.1) | 150 (1.6) |
| East of England | 82 (1.2) | 81 (1.2) | 142 (2.1) | 118 (1.7) |
| East Midlands | 53 (1.0) | 72 (1.4) | 89 (1.8) | 77 (1.5) |
| South West | 32 (0.5) | 36 (0.6) | 58 (1.0) | 36 (0.6) |
| England | 1,583 (2.7) | 1,728 (2.9) | 2,033 (3.5) | 1,708 (2.9) |
Geographical differences in carbapenemase family distribution
Between January 2025 to December 2025, the most common carbapenemase families reported nationally were NDM (39.1%), OXA-48-like (39.1%), and KPC (14.4%). However, the distribution of carbapenemase families varied regionally (Figure 3). The diversity of carbapenemases reported in regions may be impacted by individual outbreaks, especially in regions with small numbers of cases or in trends over time for less commonly identified mechanisms.
In London, which had the highest annual incidence rate, the most reported carbapenemase families were NDM (50.4%) and OXA-48-like (39.2%). In contrast, KPC (32.6%) was one of the more dominant carbapenemase families in the North West, along with OXA-48-like (36.5%). KPC was not as common in the other regions, accounting for fewer than a third of episodes in each region. In London, KPC accounted for only 4.5% of episodes.
The largest proportions of reported IMP were from the East Midlands (23.4%), North East (15.5%), and Yorkshire and the Humber (12.6%). Other regions ranged between 1.5% and 9.3%. Nationally, IMP represented 5.5% of all reported CPOs.
Although representing the smallest proportion of the ‘big 5’ carbapenemase families nationally (1.7%), the largest proportion of VIM producers compared with the other ‘big 5’ families were reported in the South West (3.1%) and East of England (2.6%) (Figure 3, see accompanying data tables).
The distribution of carbapenemase families varied in each quarter in some ONS regions (see accompanying data tables, Appendix table 2). For example, in Q1 2025, the most reported carbapenemase family in the North West was KPC (36.4%, n=103), but by Q4 2025, the most reported family was OXA-48-like (39.0%, n=112), followed by KPC (33.4%, n=96).
Figure 3. Geographical distribution of acquired CPO episodes by carbapenemase family (England): January 2025 to December 2025 [note 6]
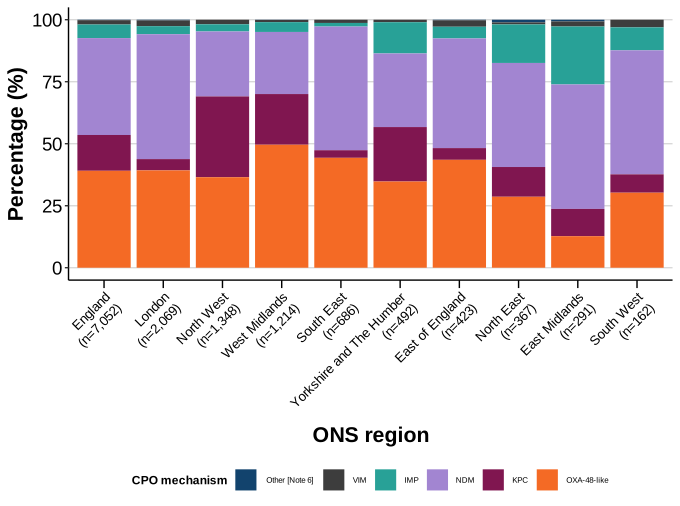
Note 6. Other carbapenemase families included DIM, GES, OXA-23 (in Enterobacterales), and IMI.
Distribution of species and carbapenemase family
Between January 2025 and December 2025, the most frequently isolated Gram-negative bacterial species with an acquired carbapenemase were Escherichia coli (38.1%), Klebsiella pneumoniae (29.6%) and Enterobacter spp. (17.9%) (Figure 4).
The carbapenemase family most frequently identified in E. coli and K. pneumoniae isolates was OXA-48-like (51.4% and 39.4%, respectively). In E. coli and K. pneumoniae, NDM (42% and 33.7%, respectively) and KPC (5% and 22.9%, respectively) were the next most frequently identified carbapenemase families. In Enterobacter spp., the most common carbapenemase family was NDM (41.4%), followed by OXA-48-like (19.8%), and KPC (18.8%).
Aside from the ‘big 5’ carbapenemase families (KPC, OXA-48-like, NDM, VIM, IMP), the AMRHAI Reference Unit also screens for rarer carbapenemase families, and it is recommended that all isolates suspected to produce an acquired carbapenemase but that test negative for the ‘big 4’ or ‘big 5’ carbapenemase families (depending on the testing capabilities of the local laboratory) are referred to the AMRHAI Reference Unit for further testing. Between October 2020 and December 2025, DIM, GES, GIM, IMI, OXA-23 (in Enterobacterales) and SME carbapenemases were identified in small numbers of isolates and collectively represented 2.6% of all reports.
Figure 4. Proportional split of carbapenemase family by organism (England): January 2025 to December 2025
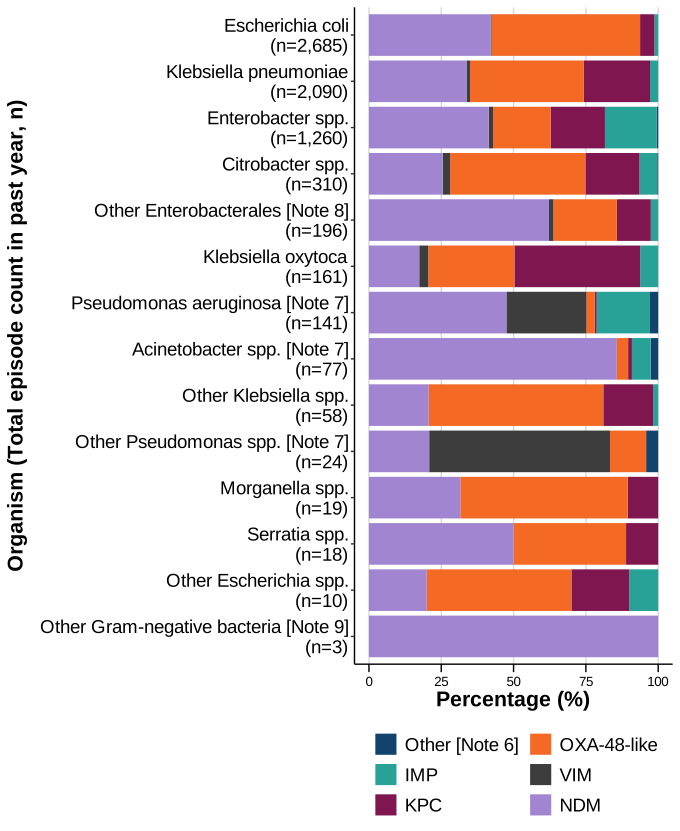
Note 6. ‘Other’ carbapenemase families included DIM, GES, OXA-23 (In Enterobacterales), and IMI. Isolates identified as positive for ‘Other’ carbapenemase families should be referred to the AMRHAI Reference Unit for confirmation.
Note 7. KPC and OXA-48-like in Pseudomonas spp. and Acinetobacter spp. are extremely rare, and positive results should be interpreted with caution. Laboratories identifying these unusual mechanisms in these genera should refer the isolates to the AMRHAI Reference Unit.
Note 8. Includes coliform, Cronobacter spp., Hafnia alvei., Kluyvera spp., Leclercia spp., Lelliottia amnigena, Mixta calida, Pantoea spp., Phytobacter ursingii, Pluralibacter gergoviae, Proteus spp., Providencia spp., Pseudescherichia vulneris, Raoultella spp., Salmonella spp., and Shigella spp.
Note 9. The isolates reported here have not all been confirmed by the AMRHAI Reference Unit and laboratories identifying carbapenemases in other species should refer such isolates to AMRHAI.
Distribution of demographic risk factors
Between January 2025 and December 2025, the annual rate of reported acquired CPO episodes was highest among the oldest and youngest members of the population. A similar age pattern was noted for both sexes, although overall the annual rate was higher in males compared with females (overall rates of 13.5 and 10.6 episodes per 100,000 population, respectively – Figure 5). This aligns with the age group and sex distribution noted in previously published reports for Gram-negative bacteraemia caused by E. coli, Klebsiella spp., P. aeruginosa and Enterobacter spp.
Figure 5 shows the reported acquired CPO annual rates by age group between January 2025 and December 2025, with the highest annual rate reported in those 85 years and over (55 per 100,000 population), followed by those aged 75 to 84 years (38.5 per 100,000 population).
Figure 5. Annual rate of acquired CPO episodes per 100,000 population by age and sex [note 10] (England): January 2025 to December 2025
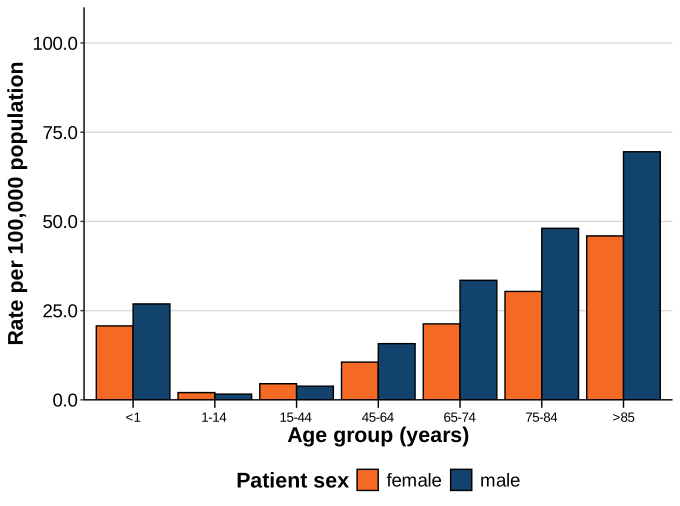
Note 10. Information about patient sex is recorded in 99.7% of cases.
Figure 6 shows the acquired CPO annual rates by IMD decile and sex between January 2025 and December 2025. The highest annual rate was reported in those in the most deprived decile (first decile, 18.8 per 100,000 population). The annual rate generally declines as the IMD decile increases, with the lowest annual rate reported in the least deprived IMD decile (tenth decile, 7.6 per 100,000 population). A similar pattern was noted for both sexes, although overall the annual rate was higher in males compared with females (Figure 6).
Figure 6. Annual rate of acquired CPO episodes per 100,000 population by index of multiple deprivation decile [note 11] and sex [note 10] (England): January 2025 to December 2025
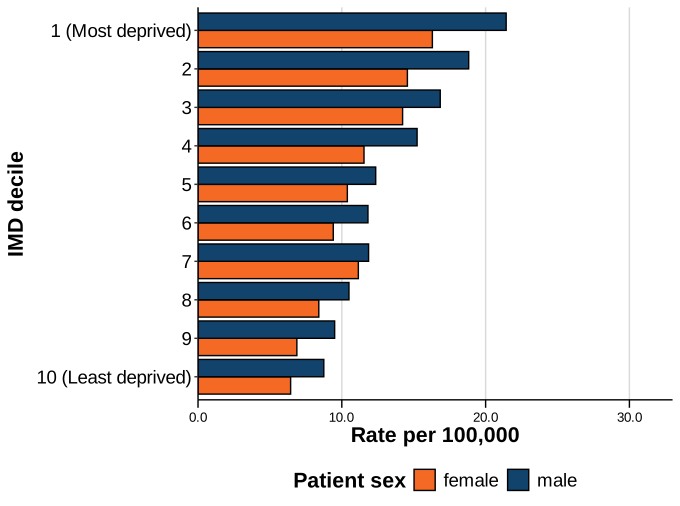
Note 10. Information about patient sex is only recorded in 99.7% of cases.
Note 11. Information about patient IMD is only recorded in 99.3% of cases.
Figure 7 shows the annual acquired CPO episode counts by IMD decile and carbapenemase family between January 2025 and December 2025. The three carbapenemase families with the highest annual proportions across all IMD deciles were NDM, OXA-48-like, and KPC (Figure 7).
Figure 7. Annual number of acquired CPO episodes by index of multiple deprivation decile [note 11] and resistance mechanism (England): January 2025 to December 2025
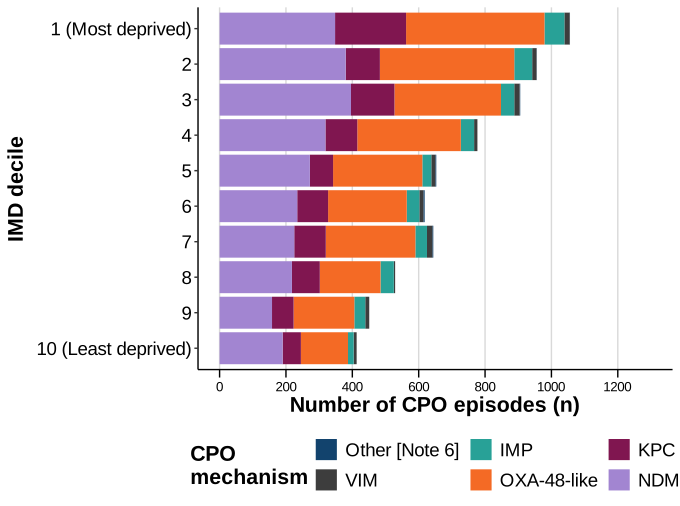
Note 6. ‘Other’ carbapenemase families included DIM, GES, OXA-23 (in Enterobacterales), and IMI (in Enterobacterales). Isolates identified as positive for ‘Other’ carbapenemase families should be referred to the AMRHAI Reference Unit for confirmation.
Note 11. Information about patient IMD is recorded in 99.3% of cases.
Quarterly mandatory laboratory return reporting (January 2025 to December 2025)
In Q4 2025, there were 220,709 CPO screens reported by 111 NHS acute trusts, representing an overall trust reporting rate of 82.8% (Table 4). At the time of writing of this report, 8 (6.3%) trusts had not reported any screens and one (0.7%) trust reported zero screens between Q1 2025 and Q4 2025. The lower report rate for Q4 2025 may be due to late reports, as the report rate for Q2 2025 has changed since the previous report (5).
The full list of reporting, including those that did not submit a return, is available in the data tables by individual NHS acute trust (see accompanying data tables, Appendix table 3).
Table 4. Quarterly mandatory laboratory returns (QMLR) for the total number of rectal swabs and faecal screening specimens taken for CPO screening by acute Trust type [note 12] (England): January 2025 to December 2025
| Trust type [note 12] |
Q1 2025 reported screens (%) |
Q1 2025 total number screens |
Q2 2025 reported screens (%) |
Q2 2025 total number screens | Q3 2025 reported screens (%) | Q3 2025 total number screens | Q4 2025 reported screens (%) | Q4 2025 total number screens |
|---|---|---|---|---|---|---|---|---|
| Large (n=23) | 21 (91.3) | 24,777 | 21 (91.3) | 27,561 | 21 (91.3) | 29,952 | 18 (78.3) | 29,961 |
| Medium (n=20) | 20 (100.0) | 13,234 | 20 (100.0) | 18,282 | 19 (95.0) | 19,679 | 18 (90.0) | 20,184 |
| Multi-service (n=7) | 5 (71.4) | 12,967 | 6 (85.7) | 13,051 | 6 (85.7) | 12,352 | 6 (85.7) | 9,120 |
| Small (n=19) | 16 (84.2) | 8,501 | 17 (89.5) | 8,977 | 17 (89.5) | 9,088 | 15 (78.9) | 7,756 |
| Specialist (n=16) | 15 (93.8) | 13,556 | 14 (87.5) | 13,556 | 15 (93.8) | 17,772 | 15 (93.8) | 17,306 |
| Teaching (n=49) | 47 (95.9) | 140,387 | 46 (93.9) | 152,568 | 45 (91.8) | 148,049 | 39 (79.6) | 136,382 |
| Total (n=134) | 124 (92.5) | 213,422 | 124 (92.5) | 233,995 | 123 (91.8) | 236,892 | 111 (82.8) | 220,709 |
Note 12. Trust type obtained through NHS Digital Estate Return Information Collection (ERIC).
References
-
Department of Health and Social Care (2020). The Health Protection (Notification) (Amendment) (No. 2) Regulations 2020 No. 674
-
UKHSA (2025). Carbapenemase-producing Gram-negative organisms in England since October 2020: quarterly update, Q1 2025
-
UKHSA (2024). Bacteriology reference department user manual
-
UKHSA (2024). Carbapenemase-producing Gram-negative organisms in England since October 2020: quarterly update, Q4 2024
-
UKHSA (2025). Carbapenemase-producing Gram-negative organisms in England since October 2020: quarterly update, Q2 2025
Acknowledgements
These reports would not be possible without the weekly contributions from microbiology colleagues in laboratories across England. The support from colleagues within the UK Health Security Agency, and the AMRHAI Reference Unit in particular, is valued in the preparation of the report. Feedback and specific queries about this report are welcome via hcai.amrdepartment@ukhsa.gov.uk