Cancer survival in England for patients diagnosed between 2014 and 2018, and followed up to 2019
Updated 16 November 2021
Applies to England

© Crown copyright 2021
This publication is licensed under the terms of the Open Government Licence v3.0 except where otherwise stated. To view this licence, visit nationalarchives.gov.uk/doc/open-government-licence/version/3 or write to the Information Policy Team, The National Archives, Kew, London TW9 4DU, or email: psi@nationalarchives.gov.uk.
Where we have identified any third party copyright information you will need to obtain permission from the copyright holders concerned.
This publication is available at https://www.gov.uk/government/statistics/cancer-survival-in-england-for-patients-diagnosed-between-2014-and-2018-and-followed-up-until-2019/cancer-survival-in-england-for-patients-diagnosed-between-2014-and-2018-and-followed-up-to-2019
Main points
- Melanoma of the skin had the highest age-standardised net survival for 1-year in both males (97.6%) and females (98.8%) and for 5-year in males (90.1%) and females (94.5%) for diagnoses between 2014 and 2018.
- Pancreatic cancer had the lowest age-standardised net survival for 1-year in males (25.3%) and females (26.6%), and for 5-year in females (8.2%) for diagnoses between 2014 and 2018. For males, the lowest 5-year survival is in mesothelioma cancer (6.7%).
- We provide survival by stage estimates for 23 cancer sites. Stage data is complete for 86.8% of diagnoses in 2014 to 2018.
- Childhood cancer survival has continued to improve for 1-, 5- and 10-years, with the 5-year survival seeing the greatest improvement over time; an increase of 7.4 percentage points, from 77.2% in 2001 to 84.6% predicted for children diagnosed in 2019.
- For Cancer Alliances (CAs), the difference between the minimum and maximum 1-year survival estimates varies from 1.5 percentage points for breast cancer (females only) to 13.1 percentage points for brain cancer (all persons).
Note: All graphs can be found on the interactive R Shiny App.
Melanoma has the highest survival estimates
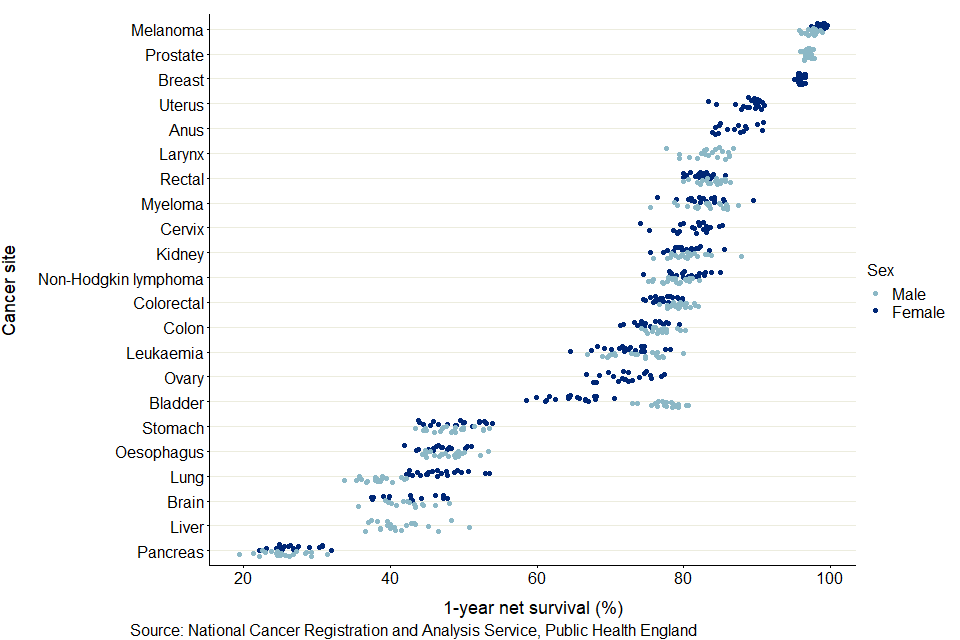
Age-standardised estimates of 1-year and 5-year net survival by cancer site are presented in Figure 1 for males and Figure 2 for females, ordered by 1-year net survival estimates.
Figure 1: Age-standardised 1-year and 5-year net survival for males (aged 15 to 99 years) diagnosed with cancer in 2014 to 2018

Notes:
- The 5-year age-standardised estimate is not available for testicular cancer because robust estimates were unavailable.
Figure 2: Age-standardised 1-year and 5-year net survival for females (aged 15 to 99 years) diagnosed with cancer in 2014 to 2018

Notes:
- The 5-year age-standardised estimate is not available for mesothelioma and stomach cancers because robust estimates were unavailable.
Figures 1 and 2 were ordered by 1-year net survival. They show the pattern of cancers from high to low 5-year net survival estimates are not always the same as for 1-year net survival, or between males and females. Melanoma of the skin had the highest survival estimate of all cancers for both 1-year and 5-year survival, for both males and females. Pancreatic cancer had the lowest survival estimate of all cancers for 1-year, for both males and females. For 5-year survival, pancreatic survival was lowest for females, but mesothelioma was lowest for males. For melanoma of the skin, the 1-year survival estimate for males was 97.6% and for females was 98.8%, and the 5-year net survival estimates for males and females were 90.1% and 94.5% respectively. Pancreatic cancer had the lowest 1-year survival for males (25.3%) and females (26.6%) and 5-year survival for females (7.6%). Mesothelioma had the lowest 5-year survival for males (6.7%).
For males, 5-year survival was below 20% for oesophagus, liver, lung, and pancreatic cancers. For females, 5-year survival was below 20% for liver, oesophagus and pancreatic cancers.
Improving completeness of stage leads to better estimates of survival by stage
Many cancers have a system of classifying how far they progressed called a ‘stage’ which usually ranges from stage 1 (small with little or no spread) to stage 4 (cancer has spread to other parts of the body). Patients diagnosed with stage 1 or 2 cancers have a higher chance of receiving curative treatment than if diagnosed at a later stage (stage 3 or 4). A stage at diagnosis may not be recorded for a cancer if there is missing or inconsistent diagnostic information, or if there is no appropriate staging system for the specific tumour type (unstageable).
Net survival estimates by stage at diagnosis for 1- and 5-years are presented for 23 cancer sites. Estimates by stage are not available for brain, non-Hodgkin lymphoma (including follicular (nodular) non-Hodgkin lymphoma and large cell (diffuse) lymphoma), leukaemia (including myeloid leukaemia), pancreas and small intestine. This is because of complexities within different subtypes of a cancer site or because staging systems do not exist for all or some subtypes of the cancer.
TNM is the staging system used for most cancer sites. The FIGO system is used to stage gynaecological cancers. The Ann Arbor system is used to stage Hodgkin Lymphomas. The International Staging System (ISS) is used to stage myelomas and only has stages 1 to 3. TNM can complement the staging information provided by the 3 other systems, except for cervix where only FIGO is used.
For the 23 cancer sites with reported survival by stage estimates in 2014 to 2018, there is a known stage for 86.8% of diagnoses. This is 1.4 percentage points higher than in the diagnosis years 2013 to 2017 and reflects the increases in the proportion of known stage at diagnosis for each of these sites. An increase in known stages means that survival by stage estimates capture a more accurate and wider range of patient survival.
It is possible that improvements in the stage data quality cause survival estimates, for some stages, to decrease slightly, but cause the all-stages combined survival estimate to increase. This can happen where the overall increase in the proportion of early stage diagnoses (which typically have higher survival than late stage diagnoses) more than compensates for small falls in individual survival by stage estimates.
Until the proportion of unknown stage is stable, we would caution against comparing the proportions of individual stages at diagnosis or their survival estimates over time.
Cancer survival by stage
Cancer survival varies by cancer site and by stage at diagnosis. The range in 5-year age-standardised net survival for all stages combined is from 6.7% (mesothelioma for males) to 94.5% (melanoma for females). The range in 5-year age-standardised net survival by stage ranges from 2.7% (stage 4 lung cancer for males) to 100.3% (stage 1 melanoma for persons).
Net survival for all stages combined is affected by the proportion of cases diagnosed at each stage, which varies considerably by cancer site.
For some cancer sites, the survival for all stages combined is close to that for early stage diagnoses, for example, uterine cancer. While for other cancer sites it is closer to that for later stage diagnoses, for example, colorectal cancer.
Figure 3: For uterine cancer, 5-year age-standardised net survival for all stages combined is higher than survival for stage 2, with a large proportion of cases being diagnosed at stage 1 in 2014 to 2018

As shown in figure 3, for uterine cancer, 5-year net survival for all stages combined (76.3%) falls between survival for stages 1 (93.0%) and 2 (76.2%). This is largely influenced by the fact that over two-thirds of females with a staged tumour were diagnosed at stage 1 (73.6%). In comparison, fewer than 27% of females were diagnosed at each of the other 3 known stages.
Figure 4: Colorectal cancer, 5-year age-standardised net survival for all stages combined, for persons, is lower than survival for stage 3 with a larger proportion of cases diagnosed at stage 4 and low survival for stage 4 in 2014 to 2018

As shown in figure 4, in contrast, all stage combined 5-year net survival (58.7%) for colorectal cancer falls between survival for stages 3 (65.6%) and 4 (10.3%). While the proportion of known staged colorectal cancer cases is more evenly spread than uterine cancer, stage 1 (18.4%), stage 2 (25.9%), stage 3 (30.0%), the proportion diagnosed at stage 4 (25.7%) is much higher than for uterine cancer (7.9%). Additionally, colorectal cancer survival for stages 1 to 3 is relatively high with a large drop for stage 4, whereas there is a more even decrease in uterine cancer survival by stage.
Geographic patterns of cancer survival
England trend
In England, 1-year survival improved between 2006 to 2010 and 2014 to 2018 for all cancers and both sexes except for bladder cancer. The largest improvement was 1.4% on average per year for lung cancer in females. There was a small reduction in 1-year bladder cancer survival in both males (0.2%) and females (0.3%). This continues the observed decreasing trend noted in the previous publication.
A possible reason for this decrease is that, during some of the periods under observation, there have been worldwide shortages of the therapeutic treatment Bacille Calmette-Guérin (BCG) used to treat higher risk bladder cancer patients diagnosed at an early stage. About 1 in 5 of all bladder cancer patients may benefit from the use of this treatment. This may explain the contrast between the decreasing trend for 1-year bladder cancer survival and improvements in cancer sites other than bladder.
For 5-year survival estimates, there was an average increase in net survival over the period between 2006 to 2010 and 2014 to 2018 in all cancer sites reported in this bulletin, except for the following sites:
- bladder cancer (males, females and persons)
- colon cancer (males, females and persons)
CAs show significant improvements in cancer survival
Estimates for 1-year and 5-year survival have been calculated for all 21 CAs. Cancer sites are included if 1-year age-standardised survival estimates are available for at least 75% of CAs for either males or females. Estimates for persons are presented if estimates are included for both males and females.
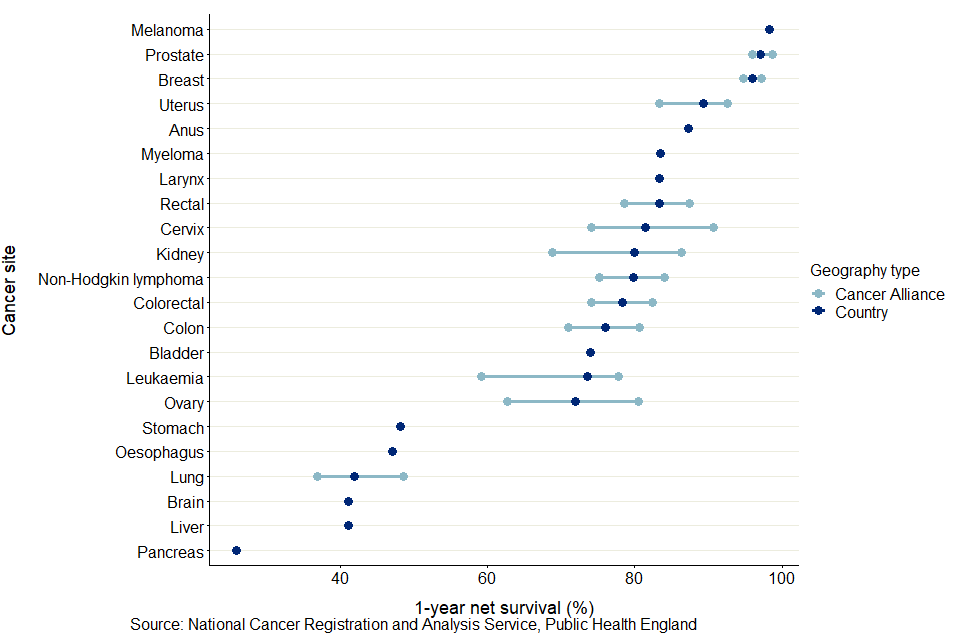
Figure 5 shows the minimum and maximum 1-year net survival estimates for each cancer site and CA, including the national estimate for England. Across CAs, the site-specific variation in 1-year survival estimates varies from 1.5 percentage points for breast cancer to 13.1 percentage points for brain cancer.
Figure 5: Age-standardised 1-year net survival (%) for adults diagnosed in the period 2014 to 2018 and followed up to 2019, and the site-specific variation in survival estimates for CA
Notes:
- Survival estimates were age-standardised using a standard set of age-specific weights provided by the International Cancer Survival Standard (ICSS).
- Survival estimates presented are for all persons except for:
a) sex-specific cancers (cervix, ovary, uterus and vulva for females and prostate for males);
b) larynx and liver cancers are presented only for males because robust estimates were not obtained for 75% of CAs for females;
c) anus and breast cancers are presented only for females because robust estimates were not obtained for 75% of CAs for males. - The International Classification of Diseases 10th Revision (ICD-10) was used to classify cancer sites.
Across all CAs, the site-specific variation in 1-year survival estimates are most narrow for breast cancer in females, with the difference between the minimum (95.1% for North East London CA) and maximum (96.6% for Thames Valley CA) being 1.5 percentage points. The smallest range for a cancer affecting all persons is for melanoma, with a range of 1.8 percentage points between the lowest (97.0% for North East London CA) and the highest (98.8% for Northern CA).
The largest range in 1-year survival estimates is for brain cancer in persons, with a range of 13.2 percentage points between the lowest (36.3% for East of England - North CA) and highest (49.5% for North Central London CA).
Across the 22 cancer sites, the CA with the largest difference between cancer sites in 1-year survival estimates was Lancashire and South Cumbria CA, a difference of 75.9 percentage points from 21.9% for pancreas cancer to 97.8% for melanoma.
The CA with the smallest difference between cancer sites in 1-year survival estimates was North Central London CA with a difference of 67.3 percentage points from 31.3% for pancreas cancer to 98.6% for melanoma.
These differences are driven by variation in pancreas cancer survival estimates, as these 2 CAs had the lowest and highest, respectively, pancreas cancer survival estimates.
Figure 6: Age-standardised 1-year net survival (%) for adults diagnosed in the period 2014 to 2018 and followed up to 2019: 22 common cancers, by sex for selected CAs
Notes:
- Survival estimates were age-standardised using a standard set of age-specific weights.
- Survival estimates presented are for males and females except for:
a) sex-specific cancers (cervix, ovary, uterus and vulva for females and prostate for males);
b) larynx and liver cancers are presented only for males because robust estimates were not obtained for 75% of CAs for females;
c) anus and breast cancers are presented only for females because robust estimates were not obtained for 75% of CAs for males. - The International Classification of Diseases 10th Revision (ICD-10) was used to classify cancer sites.
As shown in figure 6, pancreas cancer had the lowest 1-year survival in all CAs. Cancer survival in males is typically lower than survival in females, most noticeably in lung cancer. Only for bladder cancer was survival in females significantly lower than in males, reflecting the national cancer survival estimates.
For 5-year survival, robust age-standardised estimates could not be obtained for most cancer sites and most CAs. It was only possible to provide age-standardised estimates for all CAs in breast cancer (females).
Between 2006 to 2010 and 2014 to 2018, 224 significant trends were seen for 1-year survival estimates of 13 cancer sites in the 11 CAs for which a back series exists. Of these significant trends, 203 (or 91%) were positive trends, meaning there were statistically significant improvements in survival over the period. These were evenly spread across the 11 CAs and most cancer sites. However, there were 21 significant negative trends observed, of which 10 came from bladder cancer, broadly reflecting the national findings on cancer survival.
STPs
Sustainability and Transformation Partnerships (STPs) are partnerships between NHS organisations and local councils to improve health and care in practical ways. STPs are the smallest geographical areas in this publication and so fewer age-standardised estimates can be presented. There is more volatility and uncertainty in their estimates because of the smaller populations.
The site-specific variation in 1-year survival estimates was larger than 10 percentage points in STPs for the following cancer sites:
- anus
- bladder
- brain
- Hodgkin lymphoma
- larynx (males)
- liver
- melanoma
- mesothelioma
- myeloma
- oesophagus
- pancreas
- stomach
- testis (males)
- thyroid
- vulva (females)
As shown in figure 7, the other cancer sites have a smaller variation in survival estimates, particularly for melanoma, prostate and breast cancer. Across STPs, the site-specific variation in 1-year survival estimates varies from 2.5 percentage points for breast cancer (females) and melanoma (persons) to 17.9 percentage points for ovary cancer (females).
Figure 7: age-standardised 1-year net survival (%) for adults diagnosed in the period 2014 to 2018 and followed up to 2019, and the site-specific variation of survival estimates for STPs

Notes:
- This chart uses age-standardised survival estimates; individual STPs were not included in this chart if robust age-standardised estimates were not available.
- Survival estimates were age-standardised using a standard set of age-specific weights.
- Survival estimates presented are for all persons except for:
a) sex-specific cancers (cervix, ovary, uterus and vulva for females and prostate for males);
b) larynx which is presented only for males because robust estimates were not obtained for 75% of CAs for females;
c) breast which is presented only for females because robust estimates were not obtained for 75% of CAs for males. - The International Classification of Diseases 10th Revision (ICD-10) was used to classify cancer sites.
- Cancer sites are included if there are enough age-standardised estimates available for STPs. A combination of site and sex is presented for all geographies if age-standardised 1-year survival estimates can be produced for at least 75% of STPs.
As shown in figure 7, between 2006 to 2010 and 2014 to 2018, 578 significant trends were seen for 1-year survival estimates of 13 cancer sites in the 37 STPs for which a back series exists. Of these significant trends, 534 (or 92%) were positive trends, meaning there were statistically significant improvements in survival over the period. These were evenly spread across the 37 STPs and most cancer sites. However, there were 44 significant negative trends observed, 19 of which came from bladder cancer, broadly reflecting the national findings on cancer survival.
Estimates of 5-year survival for STPs are provided in the data tables where they are deemed to be robust. However, a full comparison of these estimates is not reported due to the suppression of many estimates.
NHS regions
England has 7 NHS regions:
- North East and Yorkshire
- North West
- Midlands
- East of England
- London
- South East
- South West
NHS regions have a smaller variation in survival estimates relative to CAs and STPs due to having larger populations.
For both 1-year and 5-year survival, the North East and Yorkshire, North West, Midlands and East of England tend to have lower estimates. Conversely, the South East, South West and London tend to have higher estimates. Data for these regions are available in the data tables.
Childhood cancer survival continues to improve
Childhood cancer survival is estimated using a different method, without reference to the mortality in the general population. This allows annual estimates to be calculated, although interpretation should focus on trends rather than the individual estimates.
For children (aged 0 to 14 years) diagnosed with cancer, estimates of 1-year survival have improved between 2002 and 2019. This increasing trend is also reflected in each group: 0 to 4 years, 5 to 9 years and 10 to 14 years. For 5-year and 10-year estimates, survival for children aged 0 to 14 years generally improved in the earlier years in the period 2002 to 2019, with smaller increases from 2012 to 2019. This trend was observed in each group.
Childhood cancers accounted for 0.4% of all new cancer diagnoses registered in 2018. The 3 most common cancers in children were leukaemia, malignant neoplasms of the brain and NHL in 2018. Survival estimates for separate cancer sites are not available due to the small numbers of patients.
5-year survival continue to see the greatest improvements over time
When comparing unsmoothed estimates, for children diagnosed with cancer, the 1-year age-standardised survival estimate was 90.6% in 2002 and is predicted to be 93.4% in 2019, a difference of 2.8 percentage points. Between 2002 and 2019, 5-year survival increased by 6.8 percentage points, from 77.8% in 2002 to 84.6% predicted for children diagnosed in 2019. For children diagnosed in 2019, 10-year survival is predicted to be 81.6%, 6.0 percentage points higher than for children diagnosed 17 years earlier (75.0%).
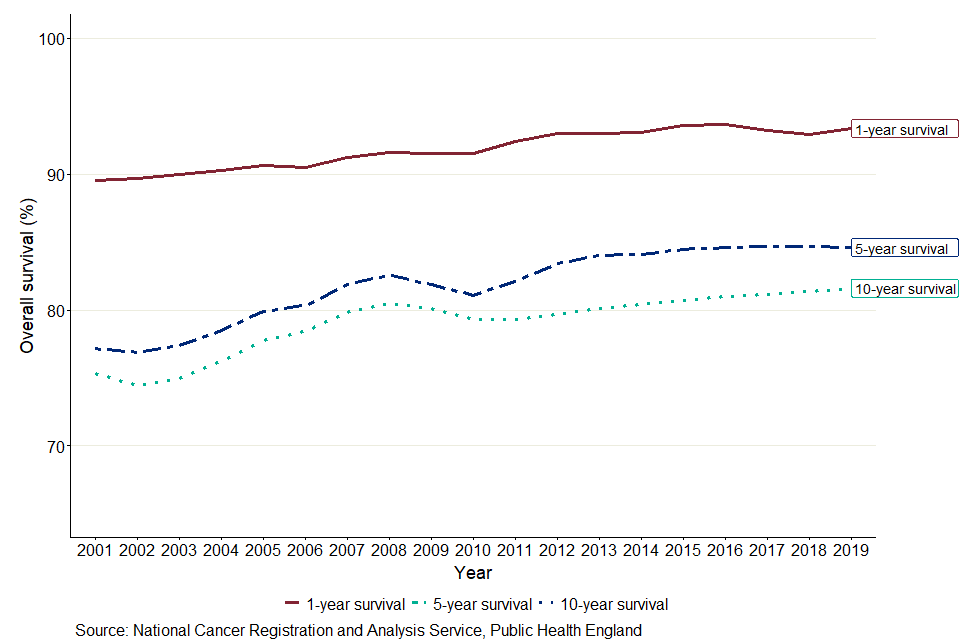
Differences between smoothed 1-, 5- and 10-year survival
As shown in figure 8, in 2019, the 1-year cancer survival estimate for all ages combined is predicted to be 8.7 percentage points higher than the 5-year survival estimate, which is predicted to be 3.0 percentage points higher than the 10-year survival estimate. The smaller difference between 5-year and 10-year survival means that children who survive for 5 years often live at least a further 5 years after diagnosis.
Figure 8: Smoothed trends in 1-, 5- and 10-year age-standardised survival (%) for children (aged 0 to 14 years) diagnosed with cancer in England between 2002 and 2019
Notes:
- Age-standardised survival estimates are presented for all children (aged 0 to 14 years).
- The survival estimates were smoothed by applying the ‘lowess’ technique (locally weighted scatterplot smoothing) because of wide year-to-year variation (due to sparse data) in childhood survival. The smoothed data are used to highlight temporal trends in survival.
- 1-year survival estimates from 2002 to 2019 are based on the following methods: cohort from 2002 to 2018 and hybrid for 2019.
- 5-year survival estimates from 2002 to 2019 are based on the following methods: cohort from 2002 to 2014, period from 2015 to 2018 and hybrid for 2019.
- 10-year survival estimates from 2002 to 2019 are based on the following methods: cohort from 2002 to 2009, period from 2010 to 2018 and hybrid for 2019.
Interpretation of these statistics
This publication defines cancer in adults using the International Statistical Classification of Diseases, 10th Revision (ICD-10) and by morphology and behaviour codes in the International Classification of Diseases for Oncology, Second Edition (ICD-O-2).
The third edition of the International Classification of Childhood Cancer (ICCC-3) is used to define cancer in children. Different systems are used for adults and children because of the different pattern of cancer in children and adults.
Adult cancer patients often die from causes unrelated to their cancer diagnosis. To show only the effect of cancer deaths on survival, adult survival estimates are net survival estimates. Net survival estimates compare the survival of cancer patients with that of the general population.
Childhood cancer survival estimates are overall survival estimates. Comparisons to the general population are not needed for childhood cancer patients. This is because death of a child within 10 years of a cancer diagnosis is almost always due to their cancer diagnosis.
The datasets present age-standardised estimates for adult, stage and childhood cancer. Age-standardisation allows comparisons between population groups and over time. To age-standardise, the adult estimates use the International Cancer Survival Standard weightings with 5 age groups. The childhood estimates are age-standardised by giving equal weight to each age group (0 to 4, 5 to 9 and 10 to 14 years). All age groups must pass robustness tests to present an age-standardised estimate.
If estimates fail the quality tests for more than 2 of the 5 age groups or 2 non-adjacent age groups, it is not possible to present age-standardised estimates. If a single age group or 2 adjacent age groups fail the quality tests, a combined age group is formed with an adjacent age group. The combined age group is re-tested for statistical quality. If the statistical quality tests are now passed, an age-standardised estimate using 4 age groups may be presented.
The datasets also present confidence intervals at the 95% level. A confidence interval is the range of values that quantifies the uncertainty of an estimate. This uncertainty arises from random variation in the measurement of the estimate. Confidence intervals at the 95% level will contain the true underlying value 19 times out of 20.
Prostate cancer
During the 1990s, a Prostate-Specific Antigen (PSA) test became available. PSA tests often reveal prostate cancer before the patient notices symptoms. Males diagnosed with prostate cancer in this way have higher survival than others diagnosed with prostate cancer. There is continuing geographic variation in the use of PSA tests. This will contribute to the geographical variation of survival estimated in prostate cancer.
The Cancer survival Quality and Methodology Information report has more details on the methods used.
Things you need to know about this release
What’s included in this bulletin
This bulletin provides data for patients diagnosed with cancer between 2014 and 2018 and followed up to 2019. Breakdowns are available for 1-year and 5-year net cancer survival in adults for 31 common cancers. For 23 of these cancers, survival by stage of diagnosis estimates for 1-year and 5-year net cancer survival by stage at diagnosis are also presented. Cancer survival by local geographies are also included, with breakdowns by CA, STPs and NHS Regions for 22 cancer sites.
Survival estimates are presented for males, females and both sexes combined (persons). Six cancers occur for a single sex only (cervix, ovary, uterus, vulva, testis and prostate). We present survival for cancer of the larynx only in males and for breast cancer only in females, since these cancers are relatively uncommon in the opposite sex. We report survival by age group and for all ages combined. To allow comparisons, estimates are age-standardised using the International Cancer Survival Standard (ICSS). Confidence intervals are provided in datasets to indicate the precision of survival estimates.
1-year and 5-year survival have been estimated using the complete approach. Survival estimates are only presented if sufficient data were available to make robust estimates of survival. Further information on the methods can be found in the Quality and methodology section.
What’s changed in this release
This publication combines 2 separate publications into one:
- Geographical patterns of cancer survival in England
- Cancer Survival in England
We have also expanded the number of cancer sites presented, with estimates for these new cancer sites available for adults in England, by age group and sex. The new cancer sites included are:
- follicular (nodular) non-Hodgkin lymphoma
- large cell (diffuse) lymphoma
- myeloid leukaemia
- small intestine
The 2013 to 2017 estimates cannot be compared with releases prior to, and including, the 2011 to 2015 time series due to the difference in methodology used. Changes were made to the method of calculating survival in England in adults and by stage at diagnosis beginning with the release, Cancer survival in England: national estimates for patients followed up to 2017, published in January 2019. The main change involved updating the life tables, further details of this change and other minor changes to the process used for calculating survival in England and to the back-series data are provided in The impact of updating cancer survival methodologies for national estimates, 2019.
Links to other related statistics
Cancer registrations in England can take up to 5 years after the end of a given calendar year to reach 100% completeness, due to the continuing accrual of late registrations. We do not revise the back series to account for late registrations. Please see the Cancer Registrations Statistics bulletin for more information.
Estimates for CAs and STPs are also presented in the Index of cancer survival for Clinical Commissioning Groups in England for breast, colorectal and lung cancers and an index of all cancers combined.
The index bulletin uses a different methodology to this publication. This means results presented here are not directly comparable with those from the Index. The main use for the Index of cancer survival in other geographies is the calculation of an all-cancer estimate of survival for small health geographies.
The estimates on childhood cancer survival for children (aged 0 to 14 years) diagnosed with cancer in England, uses a different methodology than those for adults, stage and geographical patterns, because of the different ages covered.
More information on the contents and uses of these publications can be found in Cancer statistics explained: different data sources and when they should be used. Statistics on cancer around the UK are produced in:
- Scotland by the Scottish Cancer Registry
- Wales by the Welsh Cancer Intelligence and Surveillance Unit
- Northern Ireland by the Northern Ireland Cancer Registry
International comparisons
Overall, cancer survival has been improving steadily in England and cancer mortality continues to decrease. Despite this, cancer survival in England remains lower than similar countries in Europe and around the world according to recent studies. These international comparisons have been reported by International Cancer Benchmarking Partnership (ICBP), EUROCARE-5 and CONCORD-3.
Policy context
Users of cancer survival estimates include government organisations, health policymakers, cancer charities, academics and researchers, cancer registries, the general public and the media. Population-based cancer survival statistics are used to:
- monitor the implementation of the NHS long term plan, including the target to diagnose 75% of cancers at stages 1 or 2 by 2028 and a variety of services aiming to improve cancer prevention, earlier detection and treatment
- feed in to national cancer plans, such as Achieving world-class cancer outcomes: A Strategy for England 2015 to 2020, which recommends 6 strategic priorities to help improve cancer survival in England by 2020
- inform the NHS Outcomes Framework, which was established to monitor overall changes in performance of the NHS and the quality of health outcomes; the NHS Outcomes Framework 2016 to 2017 introduced a cancer survival indicator for children and in the NHS Outcomes Framework 2015 to 2016 indicators were set for 1-year and 5-year survival from colorectal, breast and lung cancers
- demonstrate the pattern of survival by stage at diagnosis, to help show where earlier diagnosis could lead to improvements in survival
- provide reliable and accessible information about cancer outcomes to a wide range of groups, including patients and health professionals via health awareness campaigns, cancer information leaflets and web pages
Quality and methodology
The Cancer survival Quality and Methodology Information (QMI) and Quality assurance of administrative data used in cancer registrations and cancer survival statistics reports contain important information on:
- the strengths and limitations of the data and how it compares with related data
- uses and users of the data
- how the output was created
- the quality of the output including the accuracy of the data
Authors
Responsible statisticians: Kwok Wong (Public Health England)
For queries relating to this bulletin, please contact us via email at ncrasenquiries@phe.gov.uk
Production Team: Kwok Wong, John Broggio; Marta Emmett; Sophie Finnigan; Thomas Higgins; Roger Hill; Dian Xu.
Acknowledgements
Data for this work is based on patient-level information collected by the NHS, as part of the care and support of cancer patients. The data is collated, maintained and quality assured by the National Cancer Registration and Analysis Service, which is part of Public Health England (PHE).