Cancer services profiles: short statistical commentary, December 2018
Published 4 December 2018

© Crown copyright 2018
This publication is licensed under the terms of the Open Government Licence v3.0 except where otherwise stated. To view this licence, visit nationalarchives.gov.uk/doc/open-government-licence/version/3 or write to the Information Policy Team, The National Archives, Kew, London TW9 4DU, or email: psi@nationalarchives.gov.uk.
Where we have identified any third party copyright information you will need to obtain permission from the copyright holders concerned.
This publication is available at https://www.gov.uk/government/statistics/cancer-services-profiles-2018-annual-update/cancer-services-profiles-short-statistical-commentary-december-2018
New in this update
All indicators have been updated with the 2017 to 2018 financial year of data, with the exception of:
- the crude cancer incidence rate which has been updated with data from 2015 to 2016 and 2016 to 2017
- the Two-Week Wait (TWW) conversion rate metrics which have an expected release date of 5 February 2019
Main findings
The latest updates show that in the year 2017 to 2018:
- 72.1% and 71.7% of females attended breast cancer and cervical screening within the target period respectively
- for bowel cancer screening, 59.6% of 60 to 74 years olds attended in the last 30 months
- for diagnostic investigations per 100,000 population, there were 747 colonoscopy procedures, 1,253 upper gastro-intestinal (GI) endoscopy procedures and 522 sigmoidoscopy procedures performed
- there were 3,263 TWW referrals per 100,000 population
- the proportion of new cancer cases treated that were referred by TWW (detection rate) was 51.3%
- the number of new malignant cancer cases was updated for 2015 to 2016 and 2016 to 2017, reporting 296,151 and 302,072 new cases respectively (excluding non-melanoma skin cancer)
- per 100,000 population, the incidence for 2015 to 2016 and 2016 to 2017 was 515 and 521 cases respectively
- the rate of individuals diagnosed with cancer through an emergency route was 85 per 100,000 population
Summary
More information on selected indicators in the Cancer Services profile is described here at a National level. Boxplots are provided to show the range of values across all GP practices in England for selected indicators, and the trend over time as illustrated below:
Figure 1: Description of the values within a boxplot
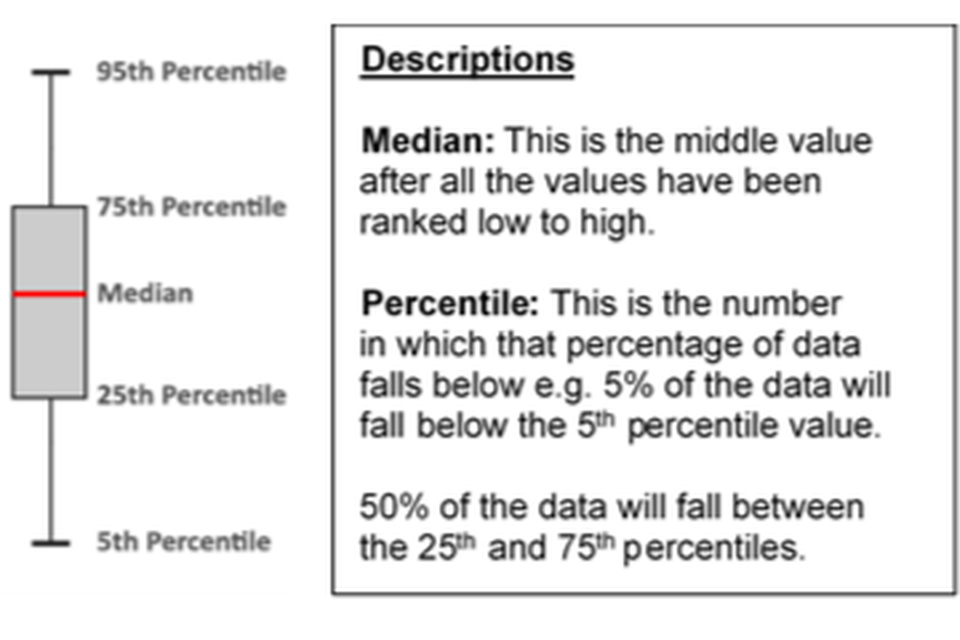
Description of the values within a boxplot
Please note that the numbers described in the text are national average (mean) rates and percentages, which are different to the national median values across all GPs shown in the boxplots.
Cancer Screening
The proportion of females (aged 50 to 70 years) screened for breast cancer in the last 36 months has remained relatively constant over the past 5 years, with 72.3% of females being screening for breast cancer in 2013 to 2014 and 72.1% in 2017 to 2018.
The recent trend shows that the proportion of females attending cervical screening within the target period has been steadily decreasing from 75.4% in years 2009 to 2010 to 71.7% of females in years 2017 to 2018.
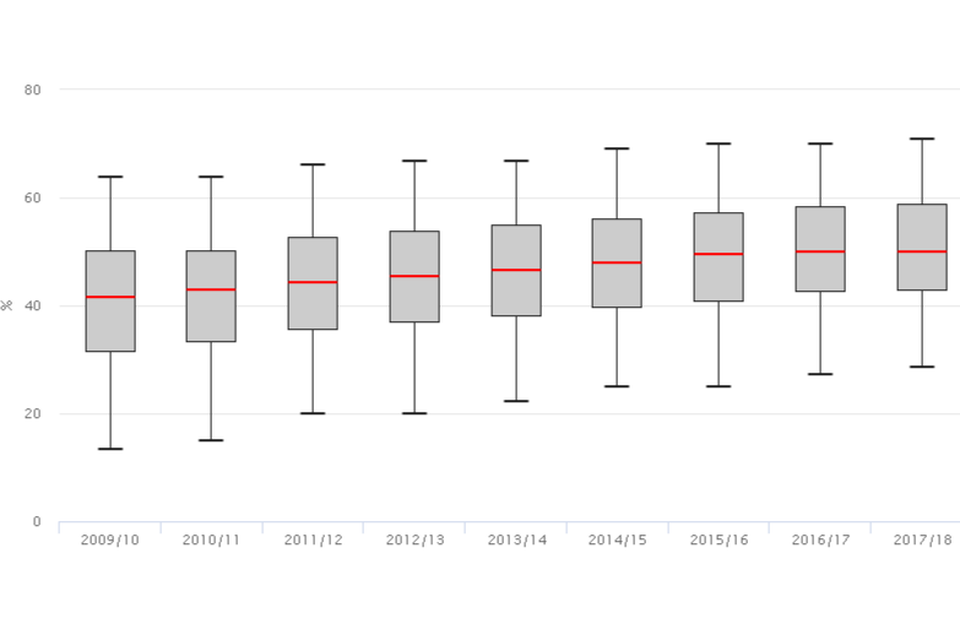
For bowel cancer screening, the proportion of individuals screened in the last 30 months has been decreasing slightly over the last 5 years for the 60 to 69 year age group and increasing for those aged 60 to 74 years (as shown in Figure 2). In years 2017 to 2018, there were 57.3% of 60 to 69 year old and 59.6% of 60 to 74 years old who were screened for bowel cancer in the last 30 months.
Figure 2: Trend over time for the proportion of persons aged 60 to 74 years screened for bowel cancer within 2.5 years (coverage) for GP practices in England
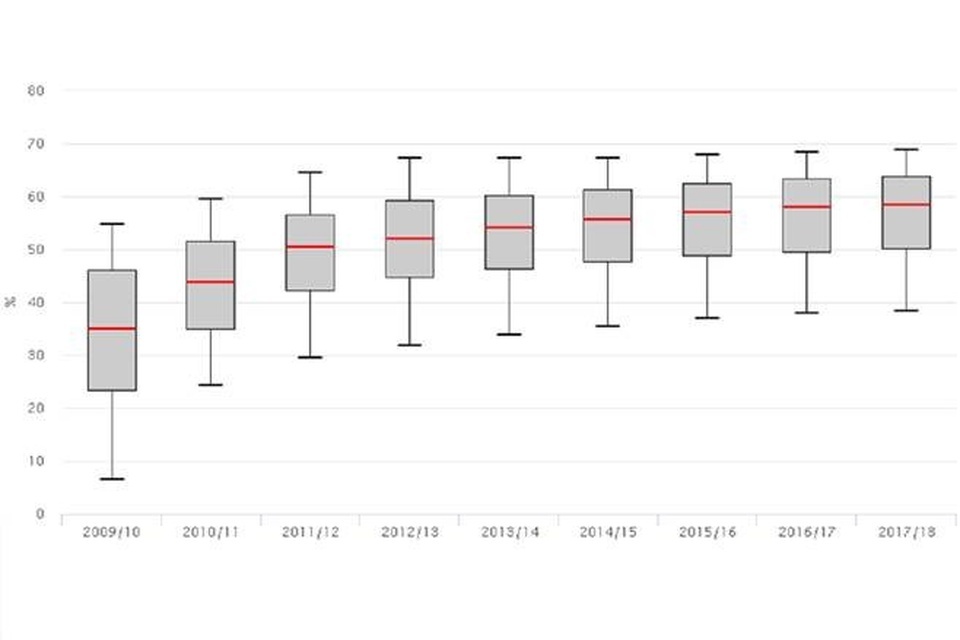
A boxplot showing a trend over time for the proportion of persons aged 60 to 74 years screened for bowel cancer within 2.5 years (coverage) for GP practices in England
Diagnostic procedures
The general recent trend for all of the diagnostic investigations reported in the Cancer Services profile is increasing.
-
in 2009 to 2010 there were 536 colonoscopy procedures performed per 100,000 population which increased to 747 per 100,000 in 2017 to 2018; although compared to year 2016 to 2017, the number of colonoscopy procedures per 100,000 people decreased from 764 to 747
-
for sigmoidoscopy procedures, the rate increased from 385 per 100,000 population in 2009 to 2010 to 522 per 100,000 in 2017 to 2018
-
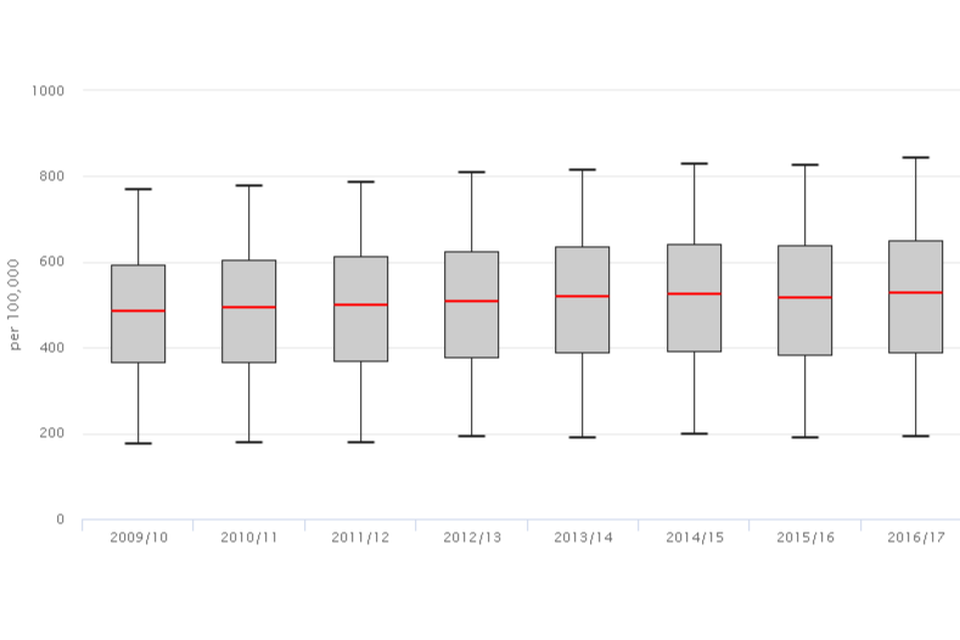
the number of upper-GI endoscopy procedures increased from 1,013 per 100,000 population in 2009 to 2010 to 1,253 per 100,000 in 2017 to 2018, although the 2017 to 2018 value was a decrease compared to 2015 to 2016 (1,309 per 100,000)
Figure 3: Trend over time in the number of in-patient or day-case upper-GI endoscopy procedures (per 100,000 population) for GP practices in England
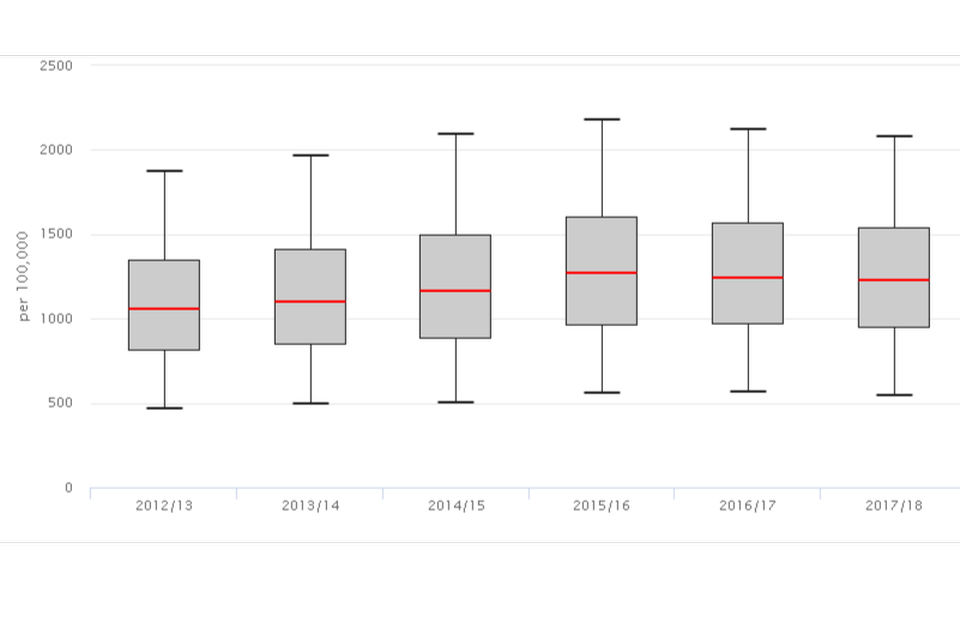
A boxplot showing a trend over time in the number of in-patient or day-case upper-GI endoscopy procedures (per 100,000 population) for GP practices in England
Two-Week Wait referrals
The rate of TWW referrals for suspected cancer has been increasing since the first time point of the indicator. In the year 2009 to 2010, there were 1,643 referrals per 100,000 population. This number almost doubled in 2017 to 2018, where there were 3,263 TWW referrals per 100,000 population.
Figure 4: Trend over time for the number per 100,000 population of TWW referrals for suspected cancer for GP practices in England
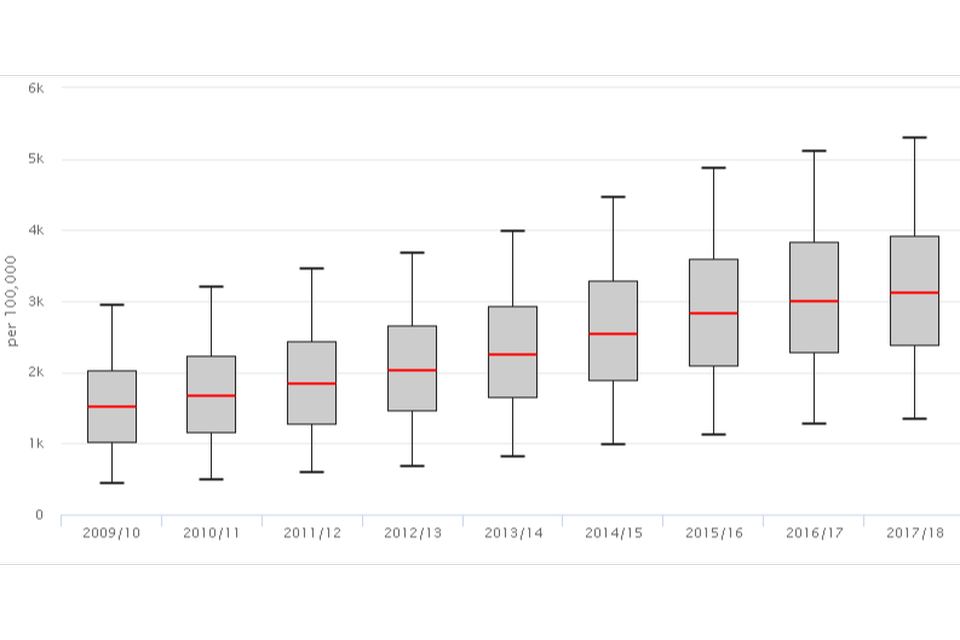
A boxplot showing a trend over time for the number per 100,000 population of TWW referrals for suspected cancer for GP practices in England
The 2017 to 2018 data for the proportion of TWW referrals that resulted in a cancer diagnosis (the conversion rate) will be available soon. The data from the previous financial year showed a decrease from 10.8% in year 2009 to 2010 to 7.6% in year 2016 to 2017.
The proportion of new cancer cases treated who were referred through by TWW (detection rate) has been increasing since the year 2009 to 2010, which was 42.4% compared to 51.3 for the last financial year.
Figure 5: Trend over time in the proportion of new cancer cases treated as a result of a Two-Week Wait referral (detection rate) for GP practices in England
A boxplot showing a trend over time in the proportion of new cancer cases treated as a result of a Two-Week Wait referral (detection rate) for GP practices in England
Cancer Incidence
There were 296,151 and 302,072 new malignant cancer cases for the 2015 to 2016 and 2016 to 2017 financial year respectively (excluding non-melanoma skin cancer). The incidence for years 2015 to 2016 and 2016 to 2017 was 515 and 521 cases per 100,000 population respectively which was similar to the 523 cases per 100,000 population in 2014/15.
Figure 6: Trend over time for the number of new cancer cases (per 100,000 population) for GP practices in England
A boxplot showing a trend over time for the number of new cancer cases (per 100,000 population) for GP practices in England
Emergency Presentations
The rate of individuals diagnosed with cancer through an emergency route has been decreasing and was 85 per 100,000 population in 2017 to 2018 compared to 89 per 100,000 in 2016 to 2017 and 92 per 100,000 5 years ago.
Figure 7: Trend over time for the number of emergency presentations of cancer (per 100,000 population) for GP practices in England
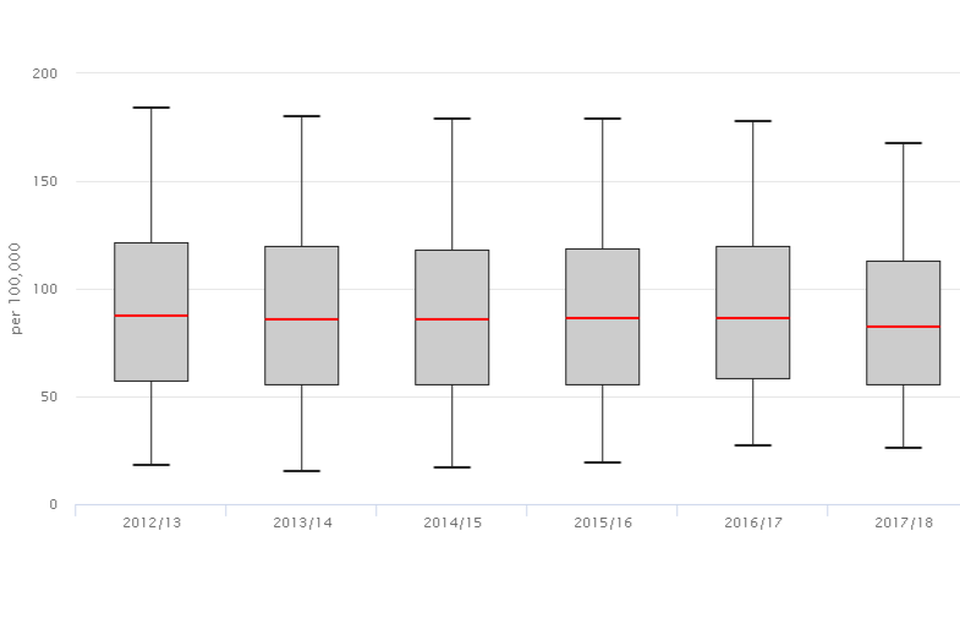
A boxplot showing a trend over time for the number of emergency presentations of cancer (per 100,000 population) for GP practices in England
Background
31 indicators in the Cancer Services profile have been updated to include the latest financial year of data that are available (2017 to 2018), collated by the National Cancer Registration and Analysis Service (NCRAS). The cancer incidence indicator has been updated to include the 2015 to 2016 and 2016 to 2017 data. The TWW conversion rate indicators will be available in the coming months.
The profiles are for commissioners and health professionals to use when assessing the impact of cancer in their local population and making decisions about services. The indicators provide information on demographics; cancer screening; TWW referrals; diagnostic services; emergency presentations and admissions by GP practices, CCG and at National level.
Data are shown for the 7,147 GP practices which have a list size of ≥1000 patients and were either listed in the QOF 2017 to 2018 or were listed in both the ADS and GPPS datasets.
Further Information
Please follow the links for more details on the following:
Public Health England’s 5-year approach to cancer from 2017 to 2021
Cancer Research UK’s Facilitator Programme
Responsible lead: Ruth Swann, CRUK-PHE Partnership
For queries relating to this publication, please contact: ruth.swann@phe.gov.uk