Building Safety Remediation: monthly data release - April 2026 (Accessible Version)
Published 27 May 2026
Applies to England

© Crown copyright 2026
This publication is licensed under the terms of the Open Government Licence v3.0 except where otherwise stated. To view this licence, visit nationalarchives.gov.uk/doc/open-government-licence/version/3 or write to the Information Policy Team, The National Archives, Kew, London TW9 4DU, or email: psi@nationalarchives.gov.uk.
Where we have identified any third party copyright information you will need to obtain permission from the copyright holders concerned.
This publication is available at https://www.gov.uk/government/publications/building-safety-remediation-monthly-data-release-april-2026/building-safety-remediation-monthly-data-release-april-2026-accessible-version
Date of next publication: 9.30am on Wednesday 24 June 2026
All figures in this release can also be found in an interactive dashboard.
Headlines
Overall remediation
As at the end of April 2026, there are 4,378 residential buildings 11 metres and over in height identified with unsafe cladding whose remediation progression is being reported on in this release, an increase of 56 since the end of March 2026. This is an estimated 60-75% of all buildings 11 metres and over in height expected to be remediated as part of MHCLG’s remediation programmes. This is considerably different from the 50-76% reported in the March 2026 data release because the estimates of the number of buildings with unsafe cladding have been updated. See the Estimated number of buildings with unsafe cladding section of the data release for more information.
Since the department first began reporting on all five remediation programmes in October 2023, the overall number of 11m+ buildings with unsafe cladding whose remediation progress is being monitored by MHCLG is 581 more.
Overall, 2,415 buildings (55% of monitored buildings) have either started or completed remediation works. Of these, 1,544 buildings (35% of monitored buildings) have completed remediation works.
Figure 1: 4,378 11m+ buildings have been identified with unsafe cladding, and there are an estimated 1,500-2,900 11m+ buildings expected to be remediated as part of MHCLG’s remediation programmes yet to be confirmed as eligible for a remediation programme.
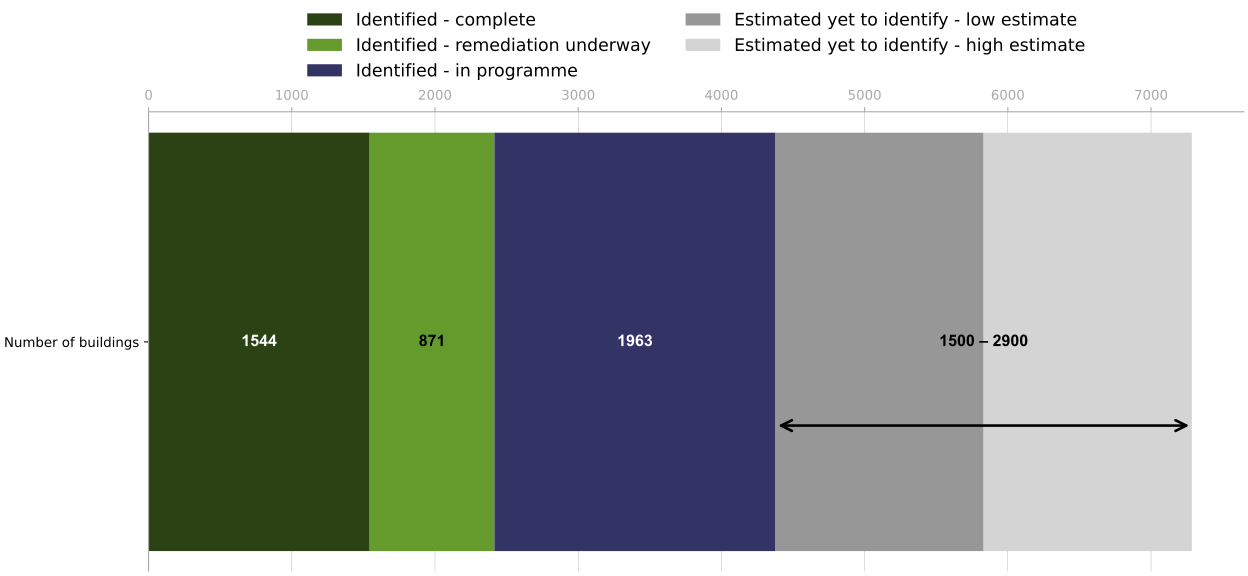
Figure 2: Of the 4,378 buildings identified with unsafe cladding, 2,415 (55%) have started or completed remediation works, of which 1,544 (35%) have completed remediation works.
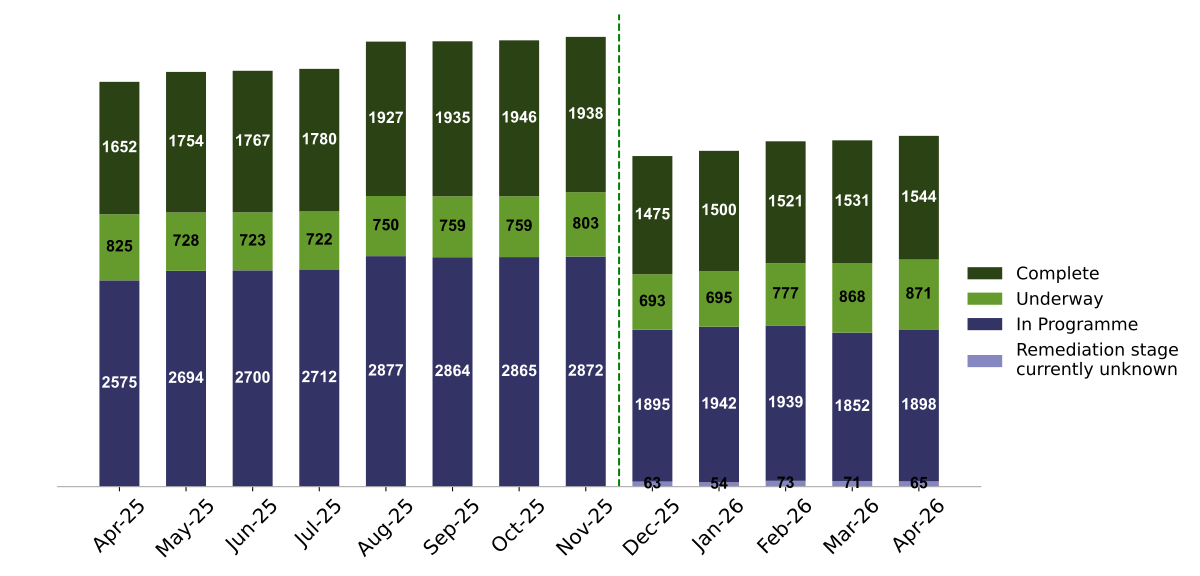
Note: The total number of buildings identified with unsafe cladding, reported in the Overall Remediation section of the data release, does not sum to the total number of buildings in each remediation programme, reported in each respective section of the data release. This is due to some buildings appearing in more than one remediation programme.
The total number of 11m+ buildings identified with unsafe cladding decreased between November 2025 and December 2025 due to a change in the data collection and categorisation of social sector buildings used in our monitoring and reporting. The overall remediation progress figures from December 2025 are therefore not directly comparable to prior months. Fluctuations in the social self-funded data is expected over the coming months, which will affect the overall remediation progress figures. Further information is available in the Technical Note.
ACM remediation – monthly update (as at end April 2026) since previous publication.
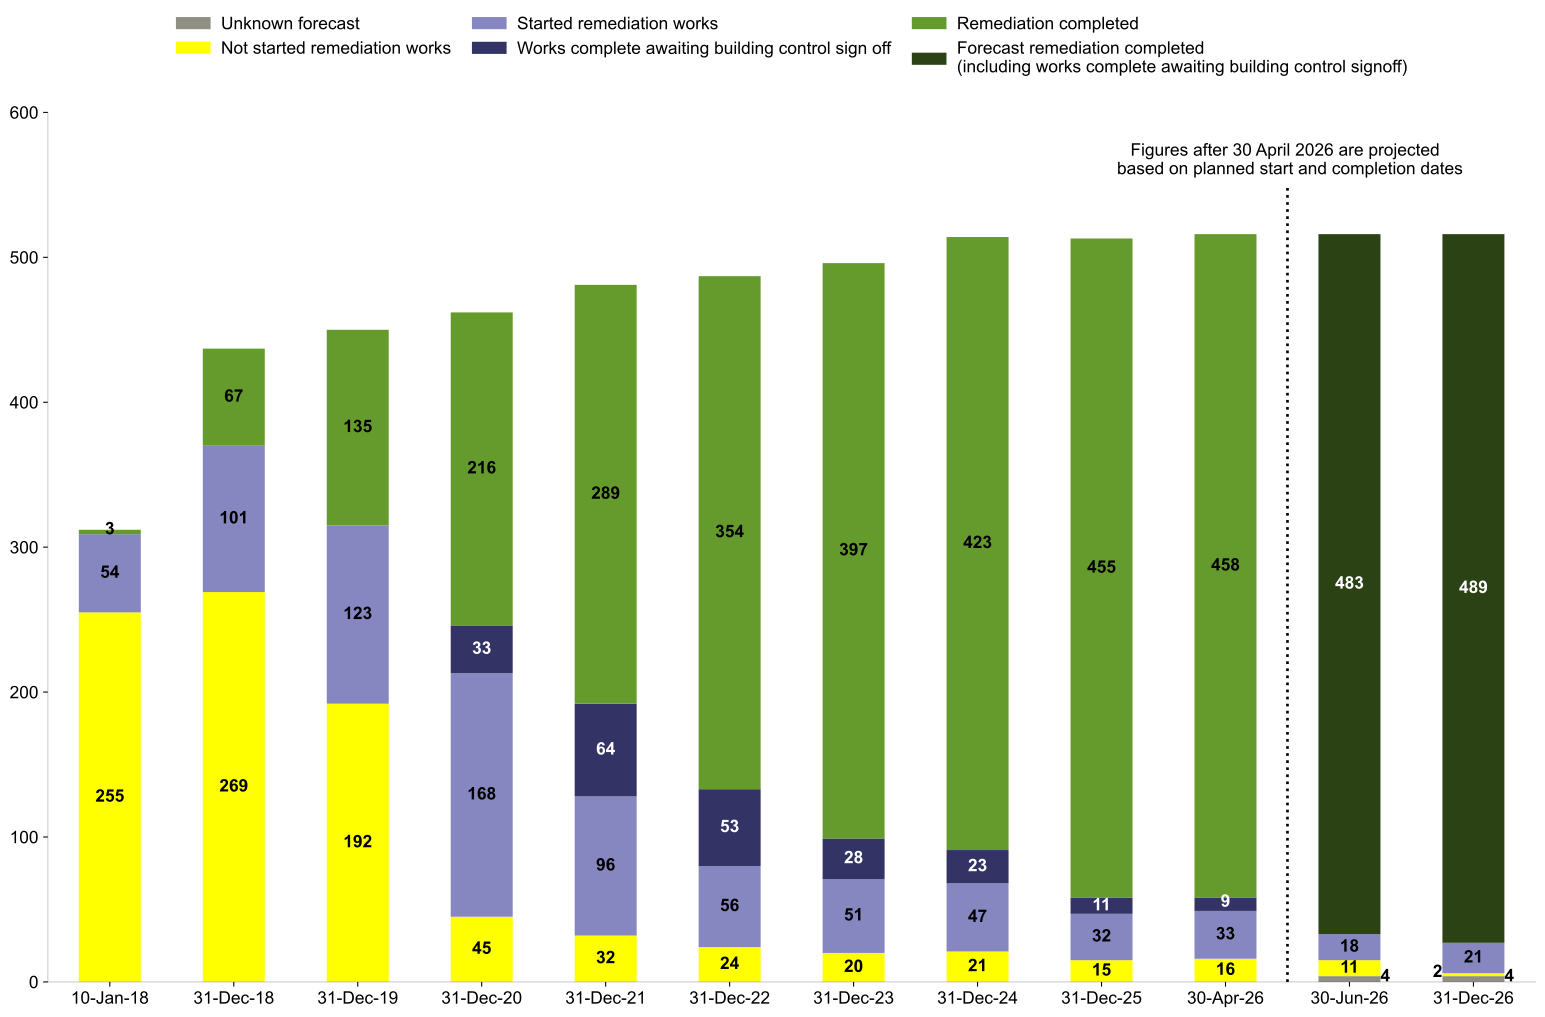
As at 30 April 2026 of the 516 high-rise (18 metres and over in height) residential and publicly owned buildings with ACM cladding systems, unlikely to meet Building Regulations, 500 (97%) have either started or completed remediation works, an increase of two since the end of March.
Of these, 467 buildings (91%) have completed ACM remediation, including those awaiting building control sign-off, an increase of one since the end of March.
There are 16 buildings yet to start ACM remediation (3% of all buildings), a decrease of two since the end of March. Two buildings are vacant so do not pose a risk to resident safety, 11 occupied buildings have forecast start dates, two further buildings have had local authority enforcement action taken against them and the remaining building came into scope in 2026.
Building Safety Fund (BSF) – monthly update (as at end April 2026) since previous publication.
As at 30 April 2026, of the 678 high-rise (18 metres and over in height) residential buildings proceeding with an application for funding through the Building Safety Fund, 470 (69%) have completed remediation works, including those awaiting building control sign-off, and 87 buildings (13%) in the BSF have started remediation works on non-ACM cladding.
Overall, 557 high-rise buildings (82%) in the BSF have either started or completed remediation works on non-ACM cladding, an increase of six since the end of March. Of these, 470 buildings (69% of buildings) have completed remediation works, an increase of one since the end of March.
Cladding Safety Scheme (CSS) – monthly update (as at end April 2026) since previous publication.
As at 30 April 2026, 1,239 buildings 11 metres and over in height have been assessed as eligible for the Cladding Safety Scheme (including 244 buildings that have transferred from the BSF), an increase of 65 since the end of March. Of these, 363 buildings (29%) have either started or completed remediation works, an increase of two since the end of March. Of these, 100 buildings (8%) have completed remediation works, including those awaiting building control sign-off, an increase of seven since the end of March.
The CSS continues to investigate and pull in potentially eligible buildings. There are a further 2,388 buildings 11 metres and over in height in the pre-eligible stages of the Cladding Safety Scheme, which launched fully in July 2023. Of these, 1,284 buildings are progressing through eligibility checks, and 1,104 buildings are in the pre-application stage.
Developer remediation – data received from developers as at 31 January 2026. Data received from other programmes relating to developer-led remediation is as at 30 April 2026.
As at 30 April 2026, 2,553 buildings 11 metres and over in height have been identified as having life-critical fire safety defects (including cladding and non-cladding defects) which developers have committed to remediate or pay to remediate (where the cladding remediation works are being carried out in a government funded remediation programme), no change since reported in the March data release.
Of these, developers reported that 1,181 (46%) have either started or completed remediation works, no change since reported in the March data release. Of these, 521 (20% of buildings) are reported to have completed remediation works, no change since reported in the March data release.
When excluding buildings reported with only non-cladding defects, there are 1,821 buildings which developers have reported as having unsafe cladding, no change since reported in the March data release. Of which 959 (53%) are reported to have started or completed remediation, no change since reported in the March data release, including 433 (24% of buildings) which are reported to have completed remediation, no change since reported in the March data release.
Social self-funded remediation – monthly update (as at end April 2026) since previous publication.
As at 30 April 2026, there are 570 11m+ social buildings identified with unsafe cladding where remediation is self-funded by registered providers of social housing – a decrease of five since the end of March.
Of these, 384 (67%) are reported to have started or completed remediation works – an increase of 11 since the end of March.
Registered providers of social housing are working with Homes England to finish compiling their records of buildings requiring remediation on the digital platform, the National Remediation System (NRS). While work is underway to migrate data to the NRS, fluctuations in the remediation progress figures for social buildings where registered providers are self-funding remediation is expected. Further information is available in the Technical Note.
Enforcement – monthly update (as at 24 April 2026) since previous publication
As at 24 April 2026, local authority enforcement action has been, or is being, taken under the Housing Act 2004 against 880 buildings over 11m with suspected unsafe cladding, an increase of 17 since the end of March.
Introduction
This Data Release provides data on:
-
The estimated number of residential buildings 11 metres and over in height in England that have or had unsafe cladding requiring remediation and the estimated cost to remediate them.
-
Remediation progress across MHCLG’s Building Safety Remediation portfolio, covering buildings in the ACM programme, Building Safety Fund, Cladding Safety Scheme, developer remediation contract and reported by registered providers of social housing.
-
Progress with remediation of high-rise (18 metres and over in height) residential buildings (including student accommodation and hotels) and publicly owned buildings with ACM cladding systems unlikely to meet Building Regulations in the ACM programme.
-
Progress with the applications for and remediation of medium-rise (11-18 metres in height) and high-rise residential buildings in England, and Northern Ireland, with non-ACM cladding systems in the Cladding Safety Scheme.
-
Progress of remediation of residential buildings 11 metres and over in height with life-critical fire safety risks under the developer remediation contract.
-
Progress of remediation of residential buildings 11 metres and over in height with unsafe cladding reported by registered providers of social housing as being self-funded.
-
Enforcement action taken by local authorities against high-rise residential buildings with unsafe cladding under the Housing Act 2004.
-
In additional management information tables only, the progress of the Waking Watch Relief Fund and Waking Watch Replacement Fund. From June 2025 this includes data on the Waking Watch Replacement Fund 2023.
The data in Figures 3 and 4 and the overall remediation progress section of the data release, shows the combined remediation progress across MHCLG’s Building Safety Remediation portfolio, covering buildings and accounting for crossover in the ACM programme, Building Safety Fund, Cladding Safety Scheme, developer remediation contract and reported by registered providers of social housing as being self-funded.
The figures in this publication are correct as at the specified dates. Remediation progress on the ACM programme, BSF, CSS and social self-funded buildings will be updated monthly, and remediation progress on the developer remediation contract will be updated quarterly.
From June 2025 the Building Safety Remediation data release includes estimates on the number of residential buildings 11 metres and over in height in England with unsafe cladding requiring remediation. These estimates have been updated in the April 2026 Building Safety Remediation data release, and are not expected to change frequently.
From November 2025 the Building Safety Remediation data release includes estimates on the cost of external wall system remediation of residential buildings 11 metres and over in height in England. These estimates have not been updated since the November 2025 Building Safety Remediation data release. These estimates will be updated in the future, but are not expected to change frequently.
Enquiries
Contact: BuildingSafetyData2@communities.gov.uk
Media enquiries: 0303 444 1209
User Engagement
We are committed to improving and broadening this data release further in the months ahead and would welcome feedback both on the revised content of this data release and what could be further done in the future. Please contact BuildingSafetyData2@communities.gov.uk
Dates of future publications
The publication dates for the next three months are:
-
24 June 2026
-
29 July 2026
-
26 August 2026
Building safety overview
This data release publishes data across all government remediation activities to give an overview of the status of progress to remediate unsafe cladding on residential buildings over 11m in England. This includes:
-
Estimates of the number of buildings that have or had unsafe cladding to be remediated in a government remediation programme.
-
Estimates of the total cost to remediate buildings that have or had unsafe cladding by funding source.
-
Data relating to the Aluminium Composite Material (ACM) cladding programme – those highest risk buildings that are high-rise buildings with unsafe, ‘Grenfell-style’ ACM cladding.
-
Data relating to the Building Safety Fund, which funds the remediation of eligible high-rise residential buildings with other forms of unsafe cladding.
-
Data relating to the Cladding Safety Scheme, which funds the remediation of residential buildings over 11m in height with unsafe cladding.
-
Data relating to developer-led remediation, which reports on those buildings that developers have agreed to remediate.
-
Data on social buildings over 11m in height whose cladding remediation is funded by registered social housing providers.
Estimated number of buildings with unsafe cladding
Information in this section shows MHCLG’s best estimates as at March 2026 and shows an update from the previous publication.
Key statistics:
MHCLG’s best estimates, as of March 2026, are that there are between 5,900 and 7,400 residential buildings, containing dwellings, 11 metres and over in height that have or had unsafe cladding requiring work in England. This equates to an estimated 8-14% of the residential building stock, containing dwellings, over 11 metres in England.
Of these:
-
An estimated 2,800 - 3,700 buildings are 11-18m (5-9% of the estimated 39,000 - 59,000 11-18m buildings).
-
An estimated 3,100 - 3,700 buildings are 18m+ (26-31% of the estimated 12,000 18m+ stock).
The estimates of the number of 11m+ buildings with unsafe cladding, as of March 2026, replace the estimates last published in June 2025. More information on the methodology is available in the Technical Note.
Estimates of buildings to be remediated in MHCLG’s remediation programmes:
MHCLG estimate there to be between 5,800 and 7,300 residential buildings, 11 metres over in height that have or had unsafe cladding that will be or have been remediated or mitigated as part of the department’s five remediation monitoring programmes, and therefore will be or are already monitored in the Building Safety Remediation monthly data release.
These figures differ from those in the Key Statistics section above because:
-
18m+ hotels, student accommodation or public buildings identified with unsafe ACM cladding are included in the estimates in this section, because these buildings are remediated through the ACM programme, but are excluded from the Key Statistics section above because the buildings do not contain dwellings. At the time the estimate was made there were 100 of these buildings.
-
The estimated number of 11m+ buildings which are assumed to be remediated privately, outside of one of the department’s remediation programmes, are included in the Key Statistics section above but excluded from the estimates in this section.
Of these:
-
An estimated 2,700 - 3,600 buildings are 11-18m.
-
An estimated 3,100 - 3,700 buildings are 18m+.
Table 1: Estimated number of residential buildings with unsafe cladding expected to be remediated or mitigated as part of MHCLG’s remediation monitoring programmes, over 11 metres with unsafe cladding, by height, England, March 2026. These figures include non dwelling 18m+ buildings with unsafe cladding, and excludes buildings assumed to be remediated outside of a remediation programme. Totals do not sum due to rounding.
| Height | Low Estimate | High Estimate |
| 11-18m | 2700 | 3600 |
| 18m+ | 3100 | 3700 |
| Total 11m+ | 5800 | 7300 |
Table 2: Estimated proportion of buildings with unsafe cladding expected to be remediated or mitigated in a government remediation programme that are currently monitored in a government remediation programme, 30 April 2026. Proportions are calculated from unrounded estimates so may not be derivable from rounded estimates in the data release.
| Height | Number of buildings currently monitored | As a proportion of the low estimate | As a proportion of the high estimate |
| 11-18m | 1939 | 72% | 54% |
| 18m+ | 2439 | 78% | 66% |
| Total 11m+ | 4378 | 75% | 60% |
As at the end of April 2026, MHCLG is monitoring the remediation progress of an estimated 60-75% of residential buildings with unsafe cladding expected to be remediated or mitigated in the department’s remediation programmes. More information on the remediation progress of buildings MHCLG are currently monitoring can be found in the Overall Remediation section of the data release.
These figures include buildings that have already completed remediation or mitigation of unsafe cladding.
Estimated cost of external wall system remediation of 11m+ residential buildings in England
Information in this section shows MHCLG’s best estimates as at March 2025 and remains unchanged from the previous publication.
Key statistics:
As of March 2025, MHCLG estimates that it will cost between £11.8bn and £22.7bn to remediate residential buildings, containing dwellings, 11 metres and above in height that have or had unsafe cladding in England.
Of this total estimated capital cost:
-
An estimated £6.7bn - £15.2bn will have been funded by government once all works have been completed (56% - 67% of the total capital costs);
-
An estimated £5.2bn - £7.4bn will have been funded by non-government actors once all works have been completed (33% - 44% of the total capital costs). This includes developers, registered providers of social housing and other actors.
These costs relate to buildings which will be or have been remediated or mitigated as part of the department’s five remediation programmes. The costs also include an estimated number of 11m+ buildings which are assumed to be remediated privately, outside of one of the department’s remediation programmes. The cost estimates relate to the estimated number of buildings requiring remediation and accessing government funding as of March 2025. They include the estimated cost of works to-date as well as future works. The estimates account for the change in funding eligibility criteria where social landlords will now receive equal access to government remediation funding as private landlords. They exclude costs which fall outside the scope of remediating buildings 11 metres and above in height that have or had unsafe cladding in England.
These estimates have not been updated to reflect the updated estimates, as of March 2026, of the number of 11m+ buildings with unsafe cladding. The cost estimates will be updated in the future.
These estimates update estimates previously published in the National Audit Office (NAO) report “Dangerous cladding: the government’s remediation portfolio” in November 2024.
More information on the methodology is available in the Technical Note.
Table 3: Estimated capital cost of external wall system works to residential buildings over 11 metres with unsafe cladding to be, and which have been, remediated or mitigated, by funding source, England, March 2025, £bn (nominal terms, nearest £0.1bn).
| Funding Source | Low Estimate | Central Estimate | High Estimate |
| Government Programmes | 6.7 | 8.9 | 15.2 |
| Non-government actors | 5.2 | 6.1 | 7.4 |
| Total | 11.8 | 15.1 | 22.7 |
Table 4: Estimated proportion of capital costs of external wall system works to buildings over 11 metres with unsafe cladding expected to be, and which have been, remediated or mitigated, by funding source, England, March 2025.
| Funding Source | Low Estimate | Central Estimate | High Estimate |
| Government Programmes | 56% | 59% | 67% |
| Non-government actors | 44% | 41% | 33% |
| Total | 100% | 100% | 100% |
Funding sources available to MHCLG for remediation:
It is estimated that under current plans, MHCLG will have £9.2bn available to fund the remediation of external wall system defects.
This includes:
-
a £5.2bn Exchequer contribution;
-
an estimated £0.7bn in refunds from developers;
-
a £3.4bn Building Safety Levy revenue target.
As cost estimates continue to be updated, the Levy revenue target will be reviewed and adjusted such that funding available for remediation aligns to government expenditure.
Overall remediation progress
Information in this section is correct as at 30 April 2026 and shows a monthly update from the previous publication.
Figure 3: 2,415 residential buildings (55% of identified buildings) have started or completed remediation on unsafe cladding, of which 1,544 (35% of identified buildings) have completed remediation works.
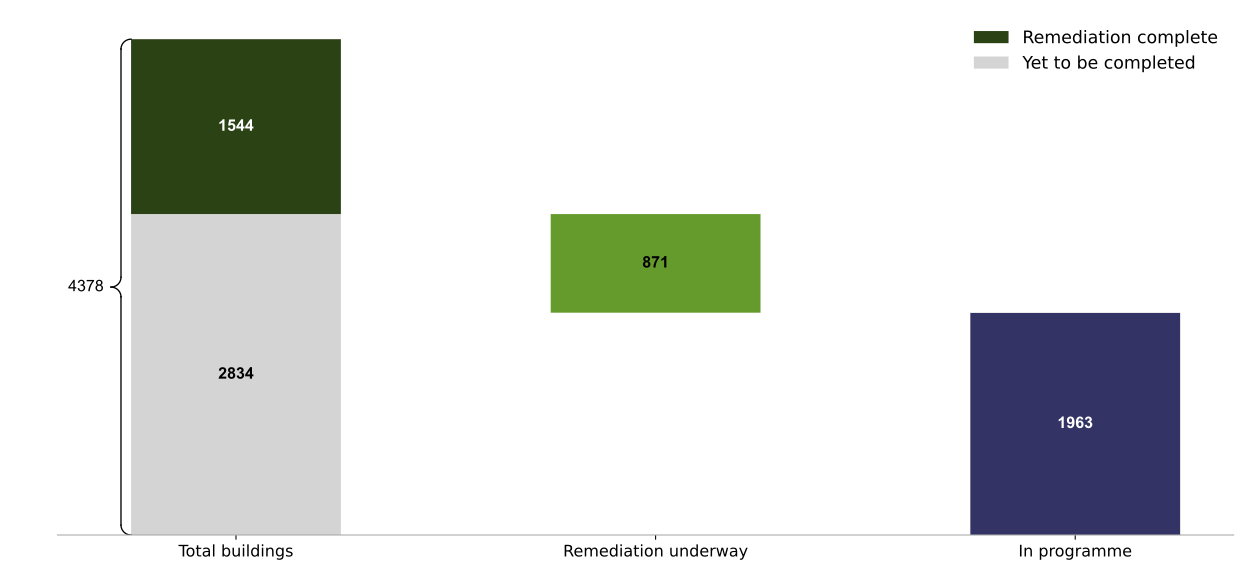
Table 5: Remediation progress for 11m+ buildings identified with unsafe cladding which are in the ACM programme, eligible for the Building Safety Fund and the CSS, remediated under the developer remediation contract and self-funded by registered providers of social housing, England, 30 April 2026.
| Remediation Stage | Number of buildings | Percentage | Cumulative Number | Cumulative Percentage |
| Remediation complete | 1544 | 35% | 1544 | 35% |
| Remediation underway | 871 | 20% | 2415 | 55% |
| In programme | 1963 | 45% | 4378 | 100% |
| Total | 4378 | 100% | 4378 | 100% |
The in programme figures currently include 65 social self-funded buildings where their remediation status is unknown as registered providers are yet to provide remediation dates. We expect buildings with unknown remediation status to be confirmed in coming months as further data is collected through engagement with Homes England.
Overall remediation: key statistics
Of the 4,378 residential buildings 11 metres and over in height with unsafe cladding the department is monitoring, as of 30 April 2026:
-
1,544 buildings (35%) have completed remediation, including those awaiting building control sign off
-
871 buildings (20%) have started remediation
-
1,963 buildings (45%) have not started remediation
Since the end of March 2026:
-
The department is monitoring the remediation progress of 56 more buildings.
-
16 more buildings are known to have started or completed remediation, and 13 more buildings are known to have completed remediation.
There are an estimated 238,000 dwellings in the occupied private and social sector 11m+ residential buildings with unsafe cladding that the department are monitoring. Of these an estimated 94,000 dwellings are in buildings that have completed remediation, and an estimated 48,000 additional dwellings are in buildings that have started remediation. An estimated 96,000 dwellings are in buildings that have not started remediation.
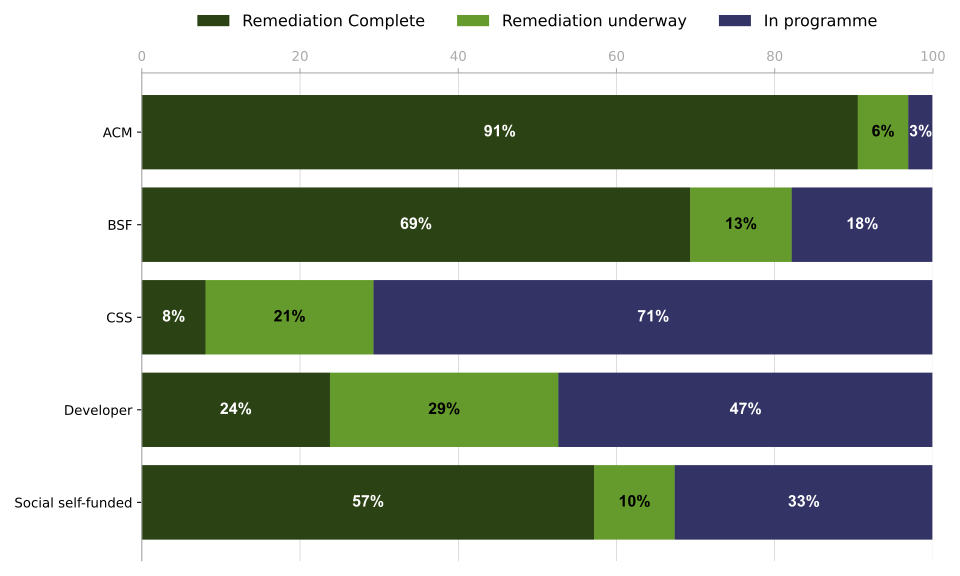
Figure 4: Progress of remediating unsafe cladding differs across the programmes and monitoring routes due to the differing maturity of the programmes.
Overall remediation by height
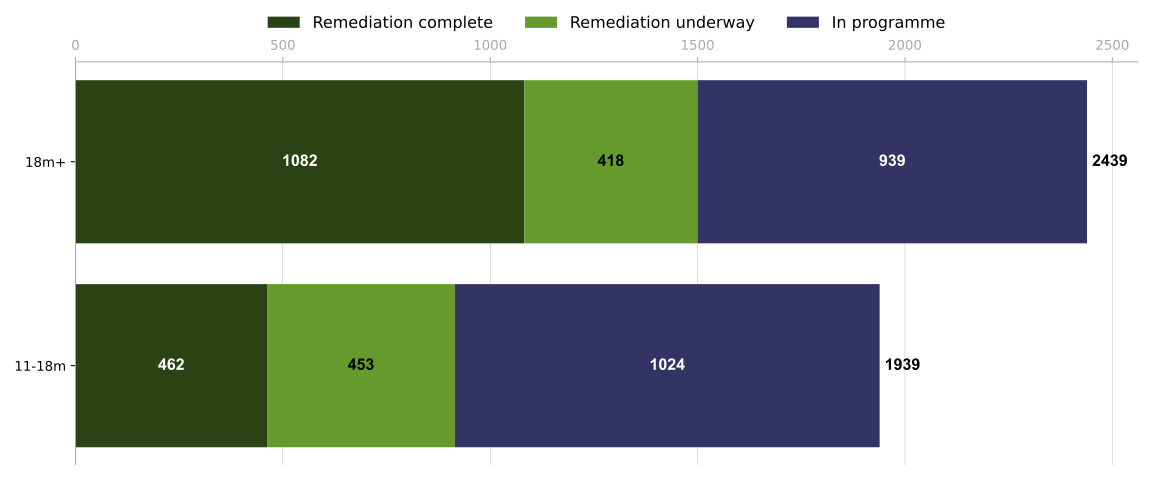
Figure 5: 62% of the 18m+ buildings the department is monitoring the remediation progress of have started or completed remediation on unsafe cladding, compared to 47% of 11-18m buildings.
Overall remediation by tenure
Figure 6: 54% of the social buildings the department is monitoring the remediation progress of have started or completed remediation on unsafe cladding, the same proportion as private sector buildings.
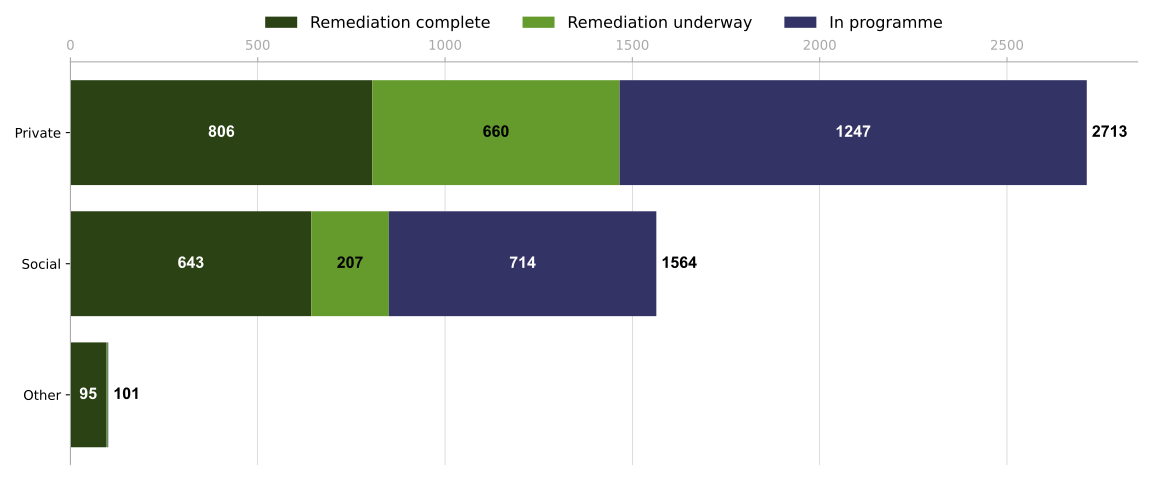
The ‘Other’ bar includes high-rise buildings with unsafe ACM that are hotels, student accommodation and public buildings.
Overall remediation by location
Figure 7: Most buildings that the department are monitoring the cladding remediation of are concentrated around urbanised areas in England, particularly the urban areas of Greater London, Greater Manchester, West Yorkshire and the West of England.
England, 30 April 2026
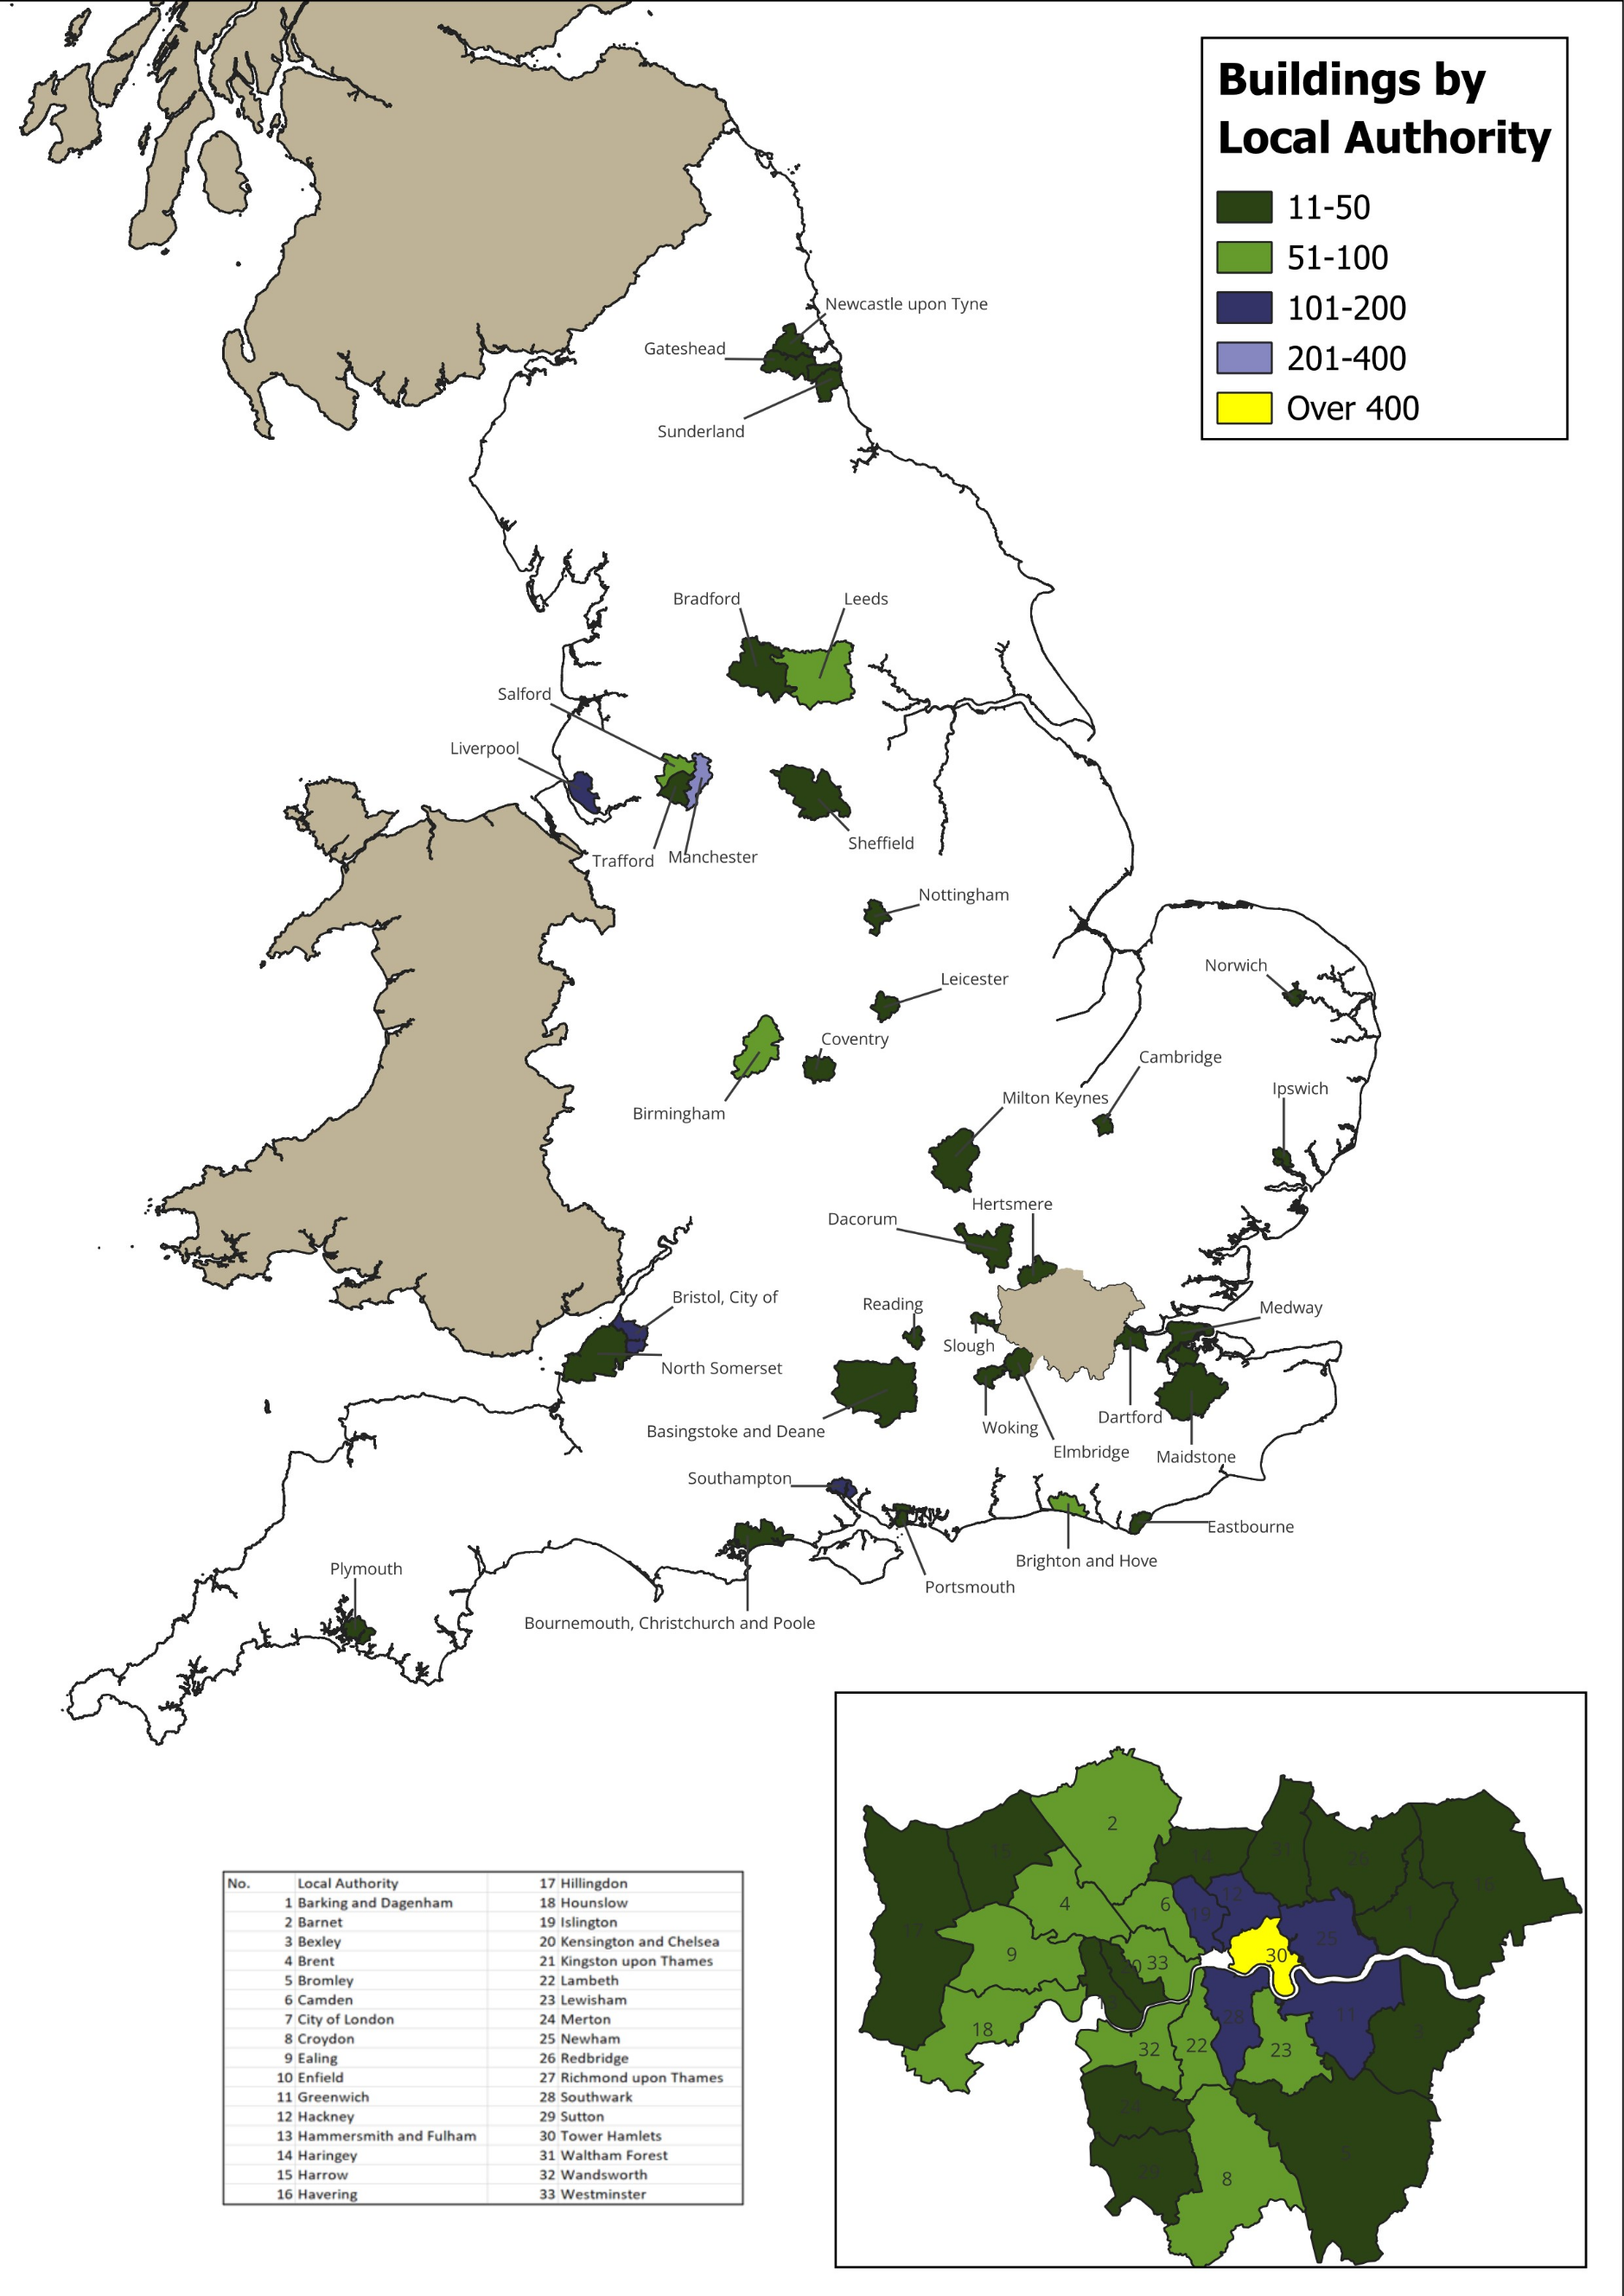
Local authorities with 10 or fewer 11m+ buildings monitored with unsafe cladding are excluded from this map as their inclusion could lead to the identification of buildings with unsafe cladding.
ACM remediation
Information in this section is correct as at 30 April 2026 and shows a monthly update from the previous publication.
Figure 8: 97% of the 516 identified ACM clad high-rise buildings have started or completed remediation, with 95% having had their ACM cladding removed and 91% having completed remediation, including those awaiting building control sign-off.
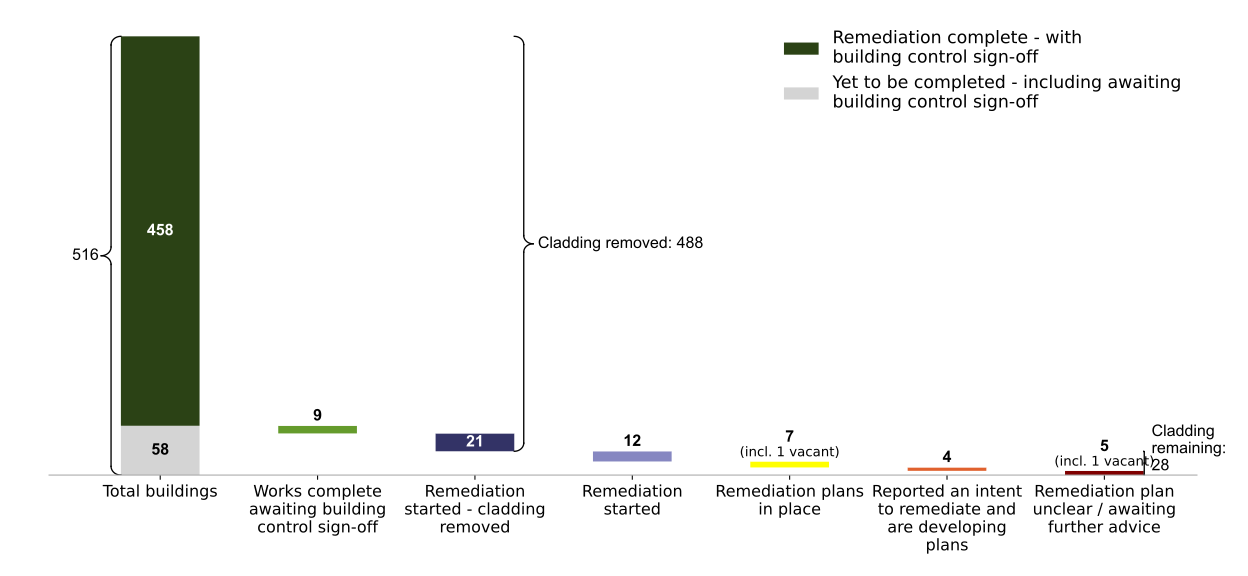
Table 6: Remediation status of buildings with ACM cladding systems unlikely to meet Building Regulations, 30 April 2026
| Remediation Stage | Number of buildings | Percentage | Cumulative Number | Cumulative Percentage |
| Completed Remediation | 458 | 89% | 458 | 89% |
| Remediation complete awaiting building control signoff | 9 | 2% | 467 | 91% |
| Remediation started - cladding removed | 21 | 4% | 488 | 95% |
| Remediation started | 12 | 2% | 500 | 97% |
| Remediation plans in place | 7 | 1% | 507 | 98% |
| Intent to remediate | 4 | 1% | 511 | 99% |
| Remediation plan unclear | 5 | 1% | 516 | 100% |
| Total | 516 | 100% | 516 | 100% |
ACM Remediation: key statistics
As of 30 April 2026, the department has identified 516 high-rise residential and publicly owned buildings identified with ACM cladding systems unlikely to meet Building Regulations, no change since the end of March.
-
467 buildings (91% of all buildings) have completed ACM remediation – an increase of one since the end of March. Of these, 458 buildings (89% of all buildings) have received building control sign off – no change since the end of March.
-
500 buildings (97% of all buildings) have started or completed ACM remediation – an increase of two since the end of March. Of these, 488 buildings (95% of all buildings) have removed ACM cladding – an increase of one since the end of March.
There are an estimated 28,800-32,100 dwellings in private and social sector buildings that have completed remediation, and a further 3,400-3,600 dwellings in occupied private and social sector buildings that have yet to be remediated.
Driving ACM remediation forward
There are 16 buildings yet to start ACM remediation (3% of all buildings) - a decrease of two since the end of March. Two buildings are vacant and so do not pose a risk to resident safety. This is an increase of one vacant building since last month due to a building recently being made vacant.
Table 7: Enforcement action and forecast start dates for occupied high-rise buildings yet to start ACM remediation, 30 April 2026
| Occupied buildings that have: | Undergone enforcement action | Undergone enforcement action supported by Joint Inspection Team | Forecast start available | Forecast to start by the end of June 2026 |
| Total | 7 | 3 | 11 | 1 |
Of the 14 high-rise occupied buildings yet to start ACM remediation:
-
One building is forecast to start works by the end of June 2026.
-
An additional nine buildings are forecast to start works by the end of December 2026, and four of these have had local authority enforcement action taken against them.
-
A further building is forecast to start works by the end of 2027, and has had local authority enforcement action taken against it.
-
Two buildings without a forecast start date have had local authority enforcement action taken against them.
-
The remaining one building was determined as in scope of the ACM monitoring programme in 2026. The department continues to engage with building owners to ensure their remediation is progressed.
These forecast estimates are based on information provided by building owners and agents and may change as further information is received. These estimates can also change as a result of buildings being newly identified. The department continues to engage with building owners to start remediation works on site as soon as possible, and will continue to support local authorities and fire and rescue services in the use of their enforcement powers.
Figure 9: 97% of buildings are forecast to have started or completed ACM remediation works by the end of June 2026.
ACM remediation progress by year of identification
Figure 10: 98% of buildings identified at 31 December 2024 have started or completed remediation compared to 97% of all buildings in the programme.
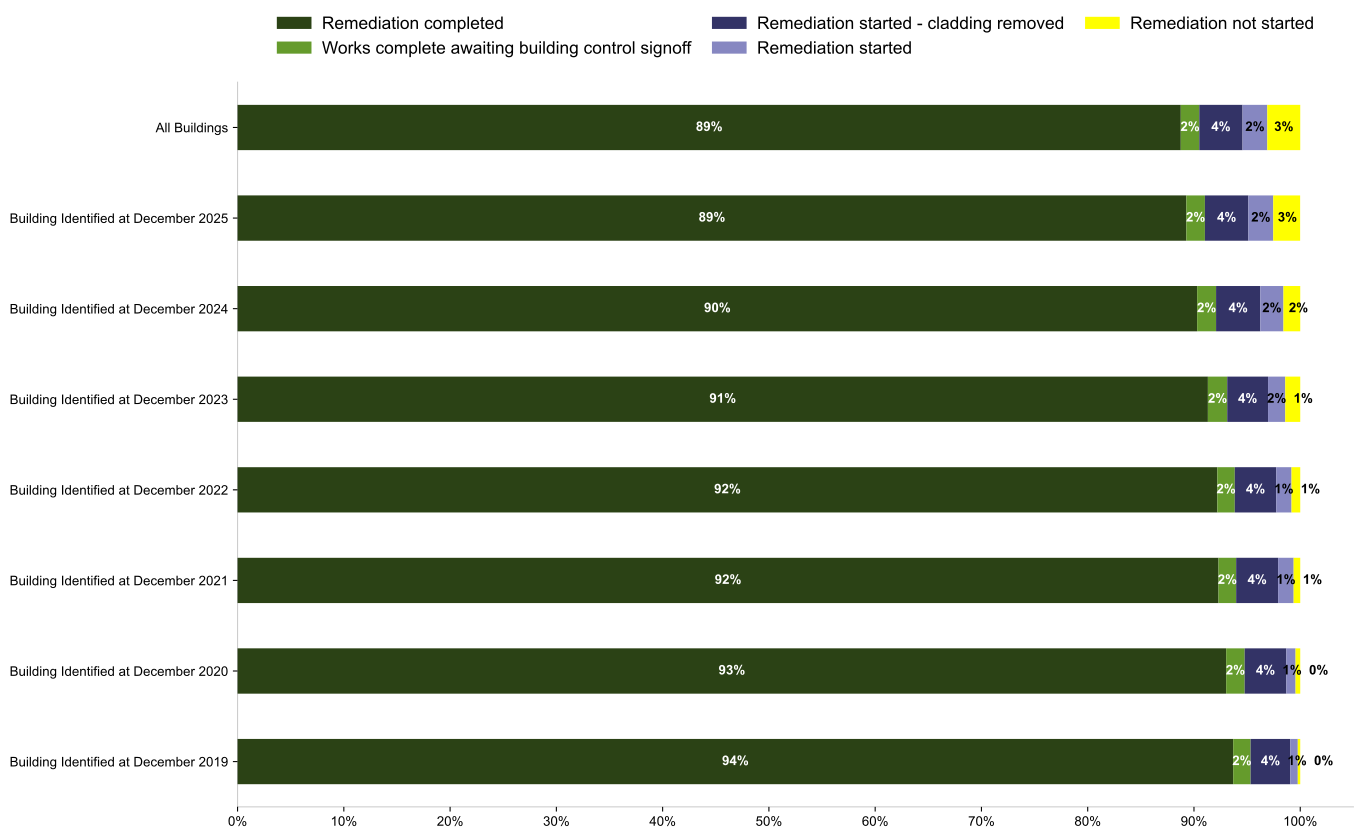
Since 31 December 2021, 35 further high-rise residential buildings have been identified with ACM cladding systems unlikely to meet Building Regulations and have moved into scope of the Building Safety Programme. Of these, six buildings were identified in 2022, eight buildings were identified in 2023, 10 buildings were identified in 2024, eight buildings were identified in 2025 and three buildings were identified in 2026.
Table 8: Buildings with unsafe ACM cladding by year of identification, 30 April 2026
| Year of identification | Number of buildings identified | Cumulative number |
| 2017 - 2019 | 428 | 428 |
| 2020 | 31 | 459 |
| 2021 | 22 | 481 |
| 2022 | 6 | 487 |
| 2023 | 8 | 495 |
| 2024 | 10 | 505 |
| 2025 | 8 | 513 |
| 2026 | 3 | 516 |
| Total | 516 | 516 |
ACM remediation by sector
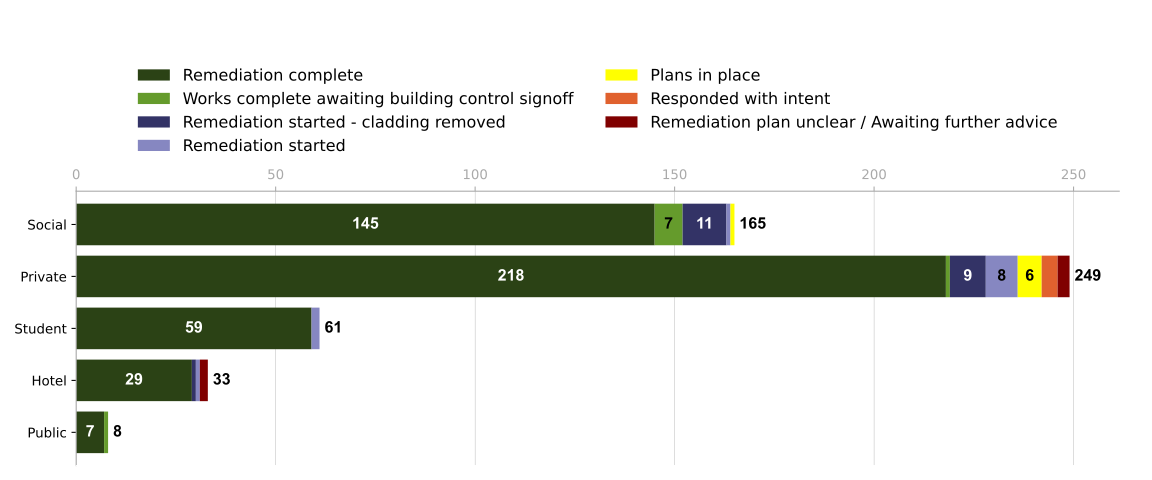
Figure 11: 99% of the 165 social sector residential buildings in the ACM programme have started or completed remediation, compared to 95% of the 249 private sector residential buildings.
Building Safety Fund
Information in this section is correct as at 30 April 2026 and shows a monthly update from the previous publication.
Figure 12: 82% of buildings proceeding with an application for funding in the BSF have started or completed remediation, with 69% having completed remediation, including those awaiting building control sign-off.
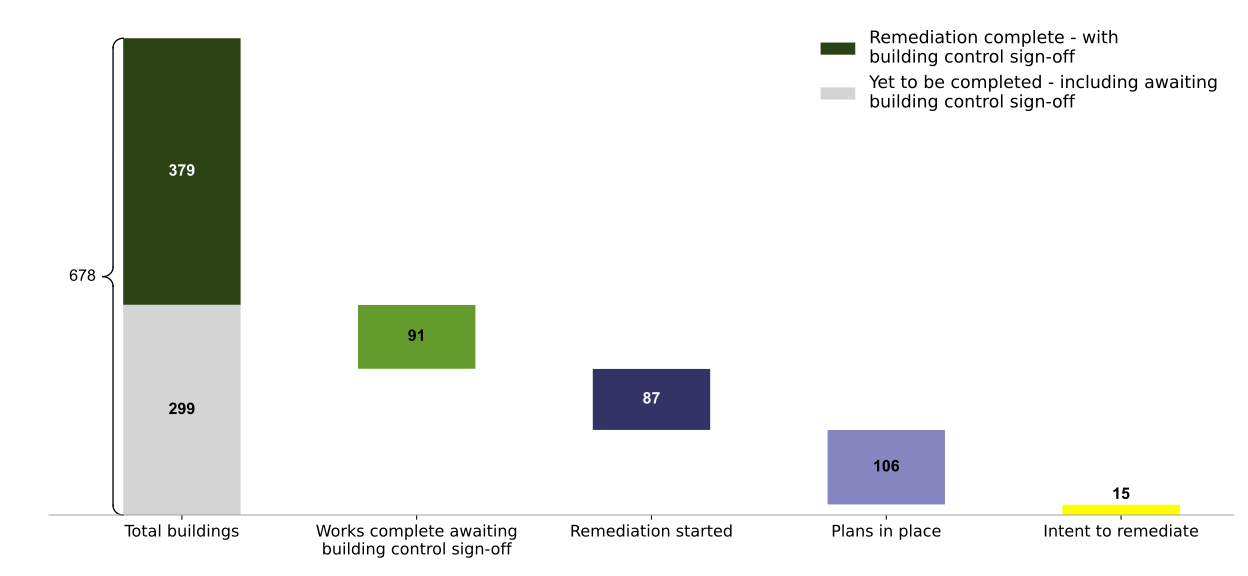
Table 9: Remediation status of buildings within the Building Safety Fund, 30 April 2026
| Remediation Stage | Number of buildings | Percentage | Cumulative Number | Cumulative Percentage |
| Remediation complete | 379 | 56% | 379 | 56% |
| Remediation complete: awaiting building control sign-off | 91 | 13% | 470 | 69% |
| Remediation started | 87 | 13% | 557 | 82% |
| Remediation plans in place | 106 | 16% | 663 | 98% |
| Intent to remediate | 15 | 2% | 678 | 100% |
| Total | 678 | 100% | 678 | 100% |
BSF remediation: key statistics
As at 30 April 2026, 678 buildings were assessed as eligible and are proceeding with an application for funding from the Building Safety Fund. The remaining 3,033 buildings registered with the fund are either ineligible (1,118), withdrawn (1,633), have transferred to the Cladding Safety Scheme (269), or have been retained by the Cladding Safety Scheme (13).
Of the 3,033 buildings that registered with the Building Safety Fund and are not currently proceeding with an application for funding, 461 buildings which were assessed as eligible have been transferred to developers.
As at 30 April 2026, 269 buildings have been transferred to the Cladding Safety Scheme for their remediation and are progressing through the CSS fund, no change buildings since reported at the end of March. Of these, 266 buildings had not started remediation works before transferring to the CSS.
The number of buildings reported as transferred from the BSF to the CSS in this section of the data release may not be the same as the number of eligible CSS buildings that have transferred from the BSF in the CSS section of the data release. This is because different programmes may define buildings differently due to how they operate. Three buildings have also withdrawn from the CSS since transferring from the BSF.
Of the 678 buildings proceeding with an application for funding in the Building Safety Fund:
-
156 buildings (23%) are remaining in the fund with developers set to reimburse the cost of remediation.
-
Four buildings are anticipated to be transferred to developers.
Of the 678 buildings proceeding with an application for funding, 118 buildings have been assessed with a Fire Risk Appraisal for External Walls (FRAEW), and 560 have been assessed under the BSF 2020 CAN criteria. It is possible for a building to submit a new application to the fund after having completed remediation, if it originally applied under the BSF 2020 CAN criteria. Therefore, buildings could be double counted. As of 30 April 2026 one building had undertaken remediation work from both application periods, so is double counted. Further details are available in the Technical Note.
Of the 678 buildings proceeding with an application for funding, 557 buildings (82%) have either started or completed remediation works – an increase of six since the end of March.
Of the 557 buildings that have started or completed remediation as at 30 April 2026:
-
87 buildings (13% of all buildings) have started remediation.
-
470 buildings (69% of all buildings) have completed remediation – an increase of one since the end of March. Of these, 379 buildings (56% of all buildings) have received building control sign off.
There are 121 eligible buildings proceeding with an application for funding that have not started remediation, of which:
-
106 (16% of all buildings) have remediation plans in place.
-
15 (2% of all buildings) have reported an intent to remediate.
There are an estimated 57,000 dwellings in buildings that are eligible and proceeding with an application for funding in the BSF.
BSF remediation progress over time
Figure 13: 13 more buildings proceeding with an application for funding in the BSF have started or completed remediation since the end of April 2025
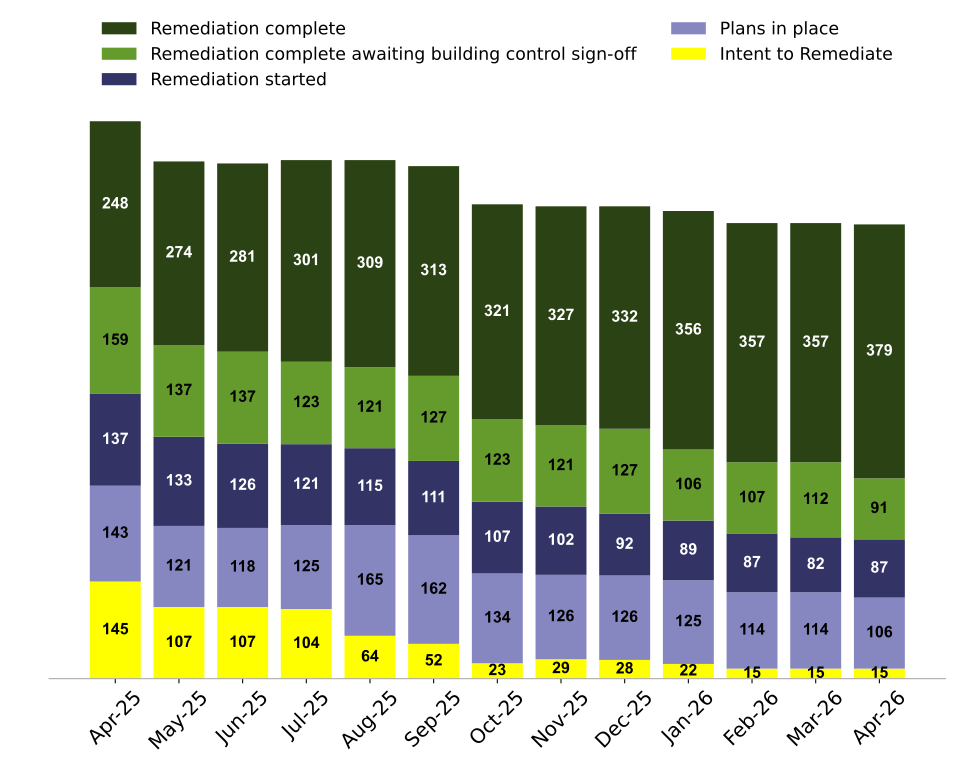
Since the end of April 2025:
-
154 fewer eligible buildings are proceeding with an application for funding from the Building Safety Fund.
-
13 more eligible buildings have started or completed remediation.
-
63 more eligible buildings have completed remediation.
BSF remediation by tenure
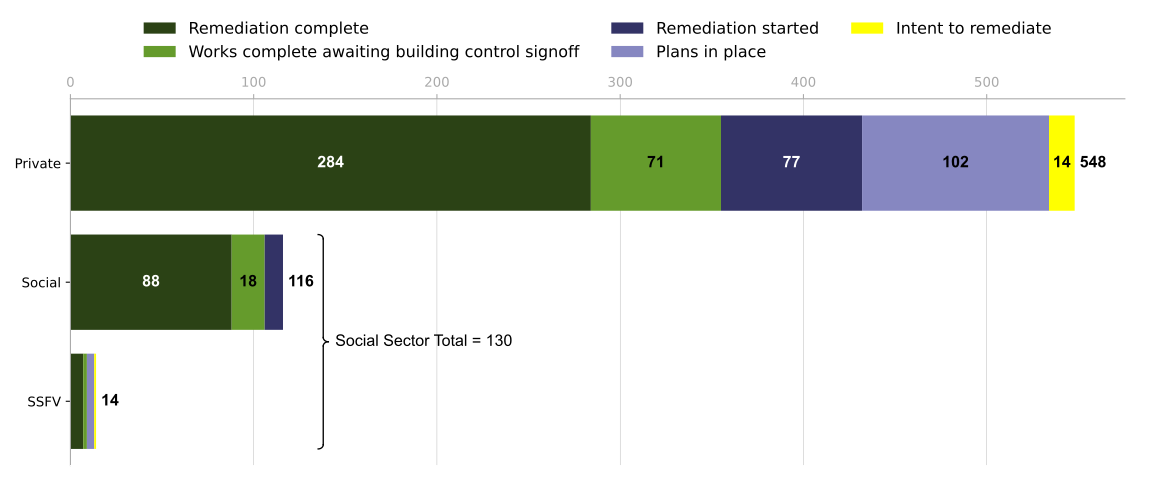
Figure 14: 96% of social sector buildings in the BSF, including buildings with a financial viability claim, have started or completed remediation compared to 79% of private sector buildings.
Cladding Safety Scheme
Information in this section is correct as at 30 April 2026 and shows a monthly update from the previous publication.
Figure 15: There are 3,627 buildings at different stages of the Cladding Safety Scheme, including 1,284 buildings with live applications and 1,239 eligible buildings, of which 363 buildings have started or completed works, with 100 having completed works.
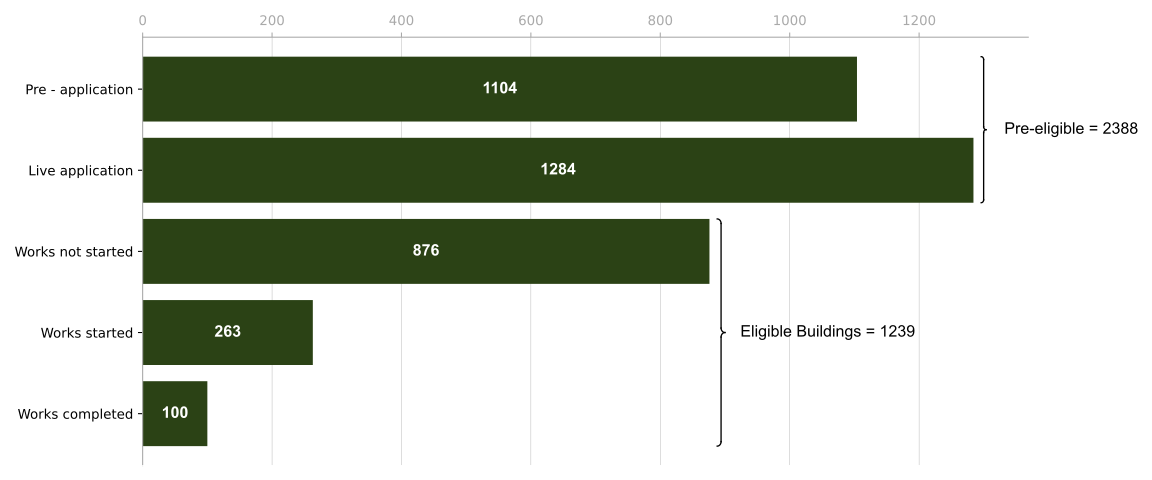
Table 10: Remediation status for buildings within the Cladding Safety Scheme, 30 April 2026
| Remediation Stage | Number of buildings | Percentage | Cumulative Number | Cumulative Percentage |
| Remediation complete | 100 | 8% | 100 | 8% |
| Works started | 263 | 21% | 363 | 29% |
| In programme | 876 | 71% | 1239 | 100% |
| Total | 1239 | 100% | 1239 | 100% |
Cladding Safety Scheme: Key statistics
As at the end of April 2026, there were 3,627 buildings in the different stages of the Cladding Safety Scheme (1,239 eligible buildings and 2,388 pre-eligible buildings). Of the 2,388 pre-eligible buildings:
-
1,104 buildings are in the pre-application stage.
-
1,284 buildings have a live application and are progressing through the eligibility stages.
There are 1,239 eligible buildings as at the end of April 2026, an increase of 65 since the end of March. None of the newly eligible buildings this month have been transferred from the BSF. In total, 244 of the eligible buildings in the CSS have been transferred from the BSF.
The number of eligible CSS buildings reported as transferred from the BSF to the CSS in this section of the data release may not be the same as the number of buildings that have transferred from the BSF to the CSS in the BSF section of the data release. This is because different programmes may define buildings differently due to how they operate. Three buildings have also withdrawn from the CSS since transferring from the BSF.
Of the 1,239 eligible buildings:
-
1,182 buildings (95% of eligible buildings) have signed Grant Funding Agreements (GFA) - an increase of 49 since the end of March.
-
Of these, 1,030 buildings (83% of all eligible buildings) have received a pre-tender support payment – an increase of 93 since the end of March.
-
363 buildings (29% of all eligible buildings) have started or completed remediation works on site – an increase of two since the end of March.
-
Of these, 100 buildings (8% of all eligible buildings) have completed remediation works on site, including those awaiting building control sign-off – an increase of seven since the end of March.
Four eligible buildings are in Northern Ireland, with the remainder in England.
Height breakdown
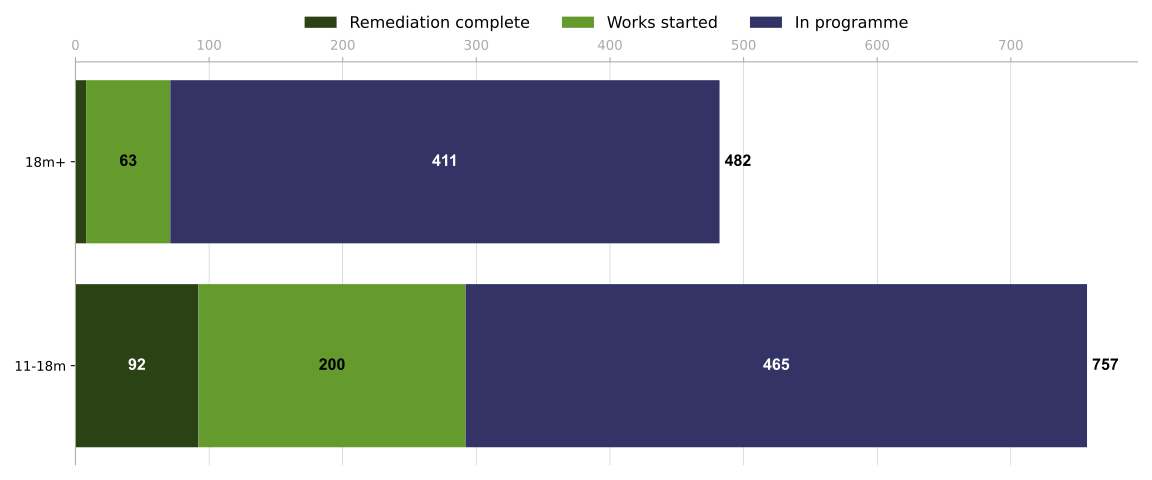
Figure 16: 39% of eligible 11-18m buildings in the CSS have started or completed remediation, compared to 15% of eligible 18m+ buildings.
Tenure breakdown
Figure 17: 23% of eligible social sector buildings in the CSS have started or completed remediation, compared to 34% of eligible private sector buildings.
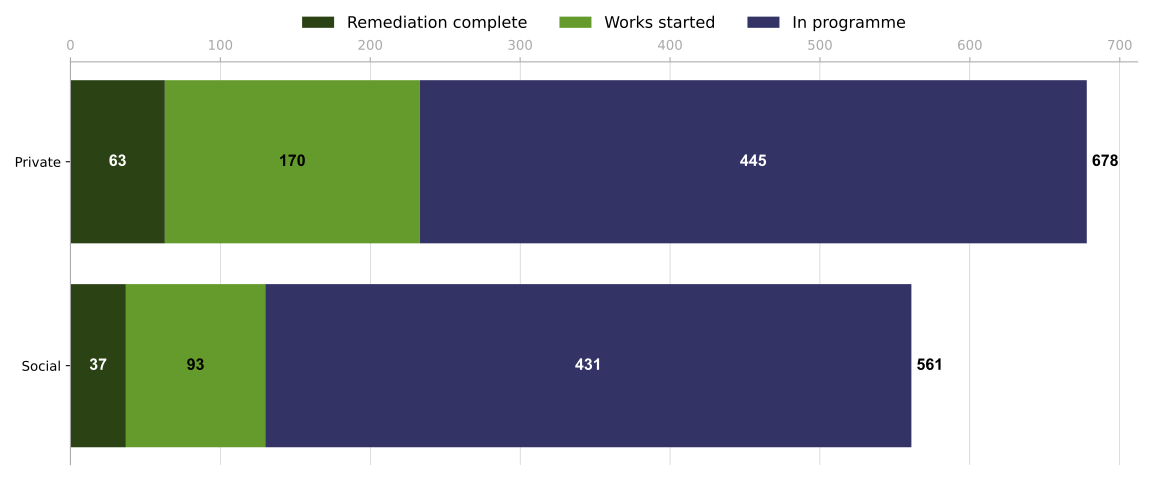
Social housing funding eligibility criteria changed in June 2025, allowing more social housing buildings to access government funding from the CSS. Therefore, we expect more eligible social buildings will appear on the social bar of this graph over time. As of the end of 30 April 2026, of the pre-eligible live applications to the CSS, 84% of the applications are social, 14% are private, and for 2% their tenure is currently unknown.
Developer-led remediation
Information in this section received by developers is correct as at 31 January 2026 and remains unchanged from the previous publication.
The estimates in this section include some buildings which are also included in other sections of this data release e.g., those reported under the following sections: ‘ACM Remediation’, ‘Building Safety Fund’ and ‘Cladding Safety Scheme’.
Figure 18: 46% of buildings in the developer remediation contract have either started or completed remediation works on life-critical fire safety risks, with 20% having completed remediation works, including those awaiting building control sign-off.
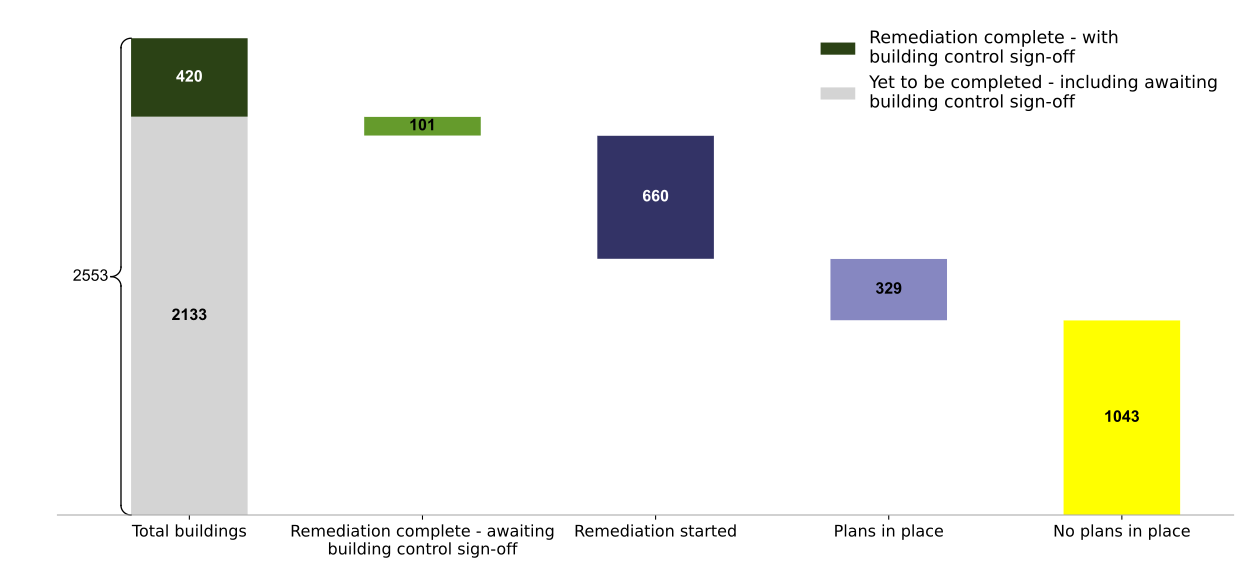
Table 11: Remediation status of buildings requiring works under the developer remediation contract, 30 April 2026. Percentages may not sum to 100% due to rounding.
| Remediation Stage | Number of buildings | Percentage | Cumulative Number | Cumulative Percentage |
| Remediation complete | 420 | 16% | 420 | 16% |
| Remediation complete – awaiting building control sign-off | 101 | 4% | 521 | 20% |
| Remediation started | 660 | 26% | 1181 | 46% |
| Remediation not started – plans in place | 329 | 13% | 1510 | 59% |
| Remediation not started – no plans in place | 1043 | 41% | 2553 | 100% |
| Total | 2553 | 100% | 2553 | 100% |
Developer remediation: key statistics
The estimates in this section are based on a combination of self-reported data submitted by developers and information that has been imputed from Building Safety Fund (BSF), Cladding Safety Scheme (CSS) and ACM programme data. A building is identified with life-critical fire safety defects if:
-
The developer has self-reported that works are (or were) required on the building
-
The developer has reported a remediation status of planned, started or complete
-
The building is eligible for funding in the BSF, Cladding Safety Scheme (CSS) or is being monitored under the ACM programme (including buildings developers have agreed to reimburse taxpayers for);
-
The building has had money paid out by the BSF or ACM remediation funds.
Furthermore, where a building has been identified with life-critical fire safety defects but the developer has not reported a defect type in the question ‘What do the issues relate to’ it is assumed that the defect type relates to cladding.
From February 2026, if a developer’s buildings will be monitored solely via government remediation schemes, we use the developer’s most recent data return held by MHCLG to report the number of buildings for which the developer is responsible under the Developer Remediation Contract, and we use relevant data from the government scheme(s) to impute whether a building requires works, the defect type, remediation status and cost of works.
Other data, unless otherwise stated, is based on self-reported data by developers in their latest data report.
As at 30 April 2026, 53 developers have signed the developer remediation contract. There are 4,745 buildings covered by the developer remediation contract. Of these, 2,553 have been identified as having life-critical fire safety defects that developers are obligated to remediate or pay to remediate – no change since the March data release.
Of the 2,553 buildings identified as having life-critical fire safety risks:
-
521 (20%) are reported to have completed remediation – no change since the March data release. Of the 521 buildings that are reported to have completed remediation, 420 buildings (16% of all buildings with defects) are reported to have received building control sign-off.
-
1,181 (46%) are reported to have started or completed remediation – no change since the March data release.
-
329 (13%) are reported to have not started remediation but have plans in place – no change since the March data release.
-
1,043 buildings (41%) have not started and have no plans in place - no change since the March data release.
Although information from developers is received quarterly, these statistics are subject to change and are updated monthly as information from other programmes which relate to remediation is updated monthly.
The 2,553 buildings identified as requiring remediation have an estimated cost of remediation of around £4.1 billion. This has not changed compared to the March data release. This cost is based on the self-reported cost of works in the developer data report. However, if the cost is not known it is imputed based on the average known reported cost by developers by height band of building.
There are an estimated 157,000 dwellings in buildings with defects that developers are committed to remediate. Of these, there are an estimated 77,000 dwellings in buildings that are reported as having either started or completed remediation works.
Based on start and completion dates reported by developers, 639 buildings which have not yet started are reportedly expected to start works between 1 February 2026 and 31 January 2027, and 432 buildings which have not yet completed are reportedly expected to complete their remediation between 1 February 2026 and 31 January 2027.
451 buildings have transferred from the Building Safety Fund to developers, an increase of one since the March data release:
-
66 (15%) have completed remediation - no change since the March data release. Of these 66, 44 buildings (10% of all buildings) are reported to have received building control sign-off.
-
212 (47%) have started or completed remediation – no change since the March data release.
-
95 (21%) are reported to have not started remediation but have plans in place – no change since the March data release.
-
85 (19%) are reported to have not started remediation and have no plans in place – no change since the March data release.
-
59 (13%) have not been identified by developers as having life-critical fire-safety defects – an increase of one since the March data release.
The 451 buildings in the developer remediation contract differs from the 461 reported in the Building Safety Fund section of the data release, due to developers defining buildings differently to in the Building Safety Fund. The same building structures are included in both sections of the release.
Height breakdown
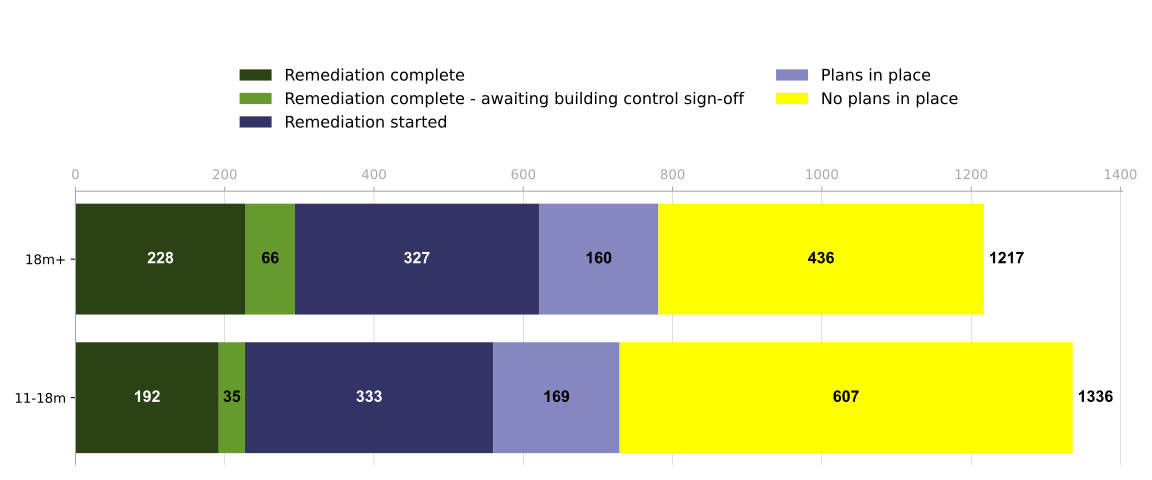
Figure 19: 51% of the 18m+ buildings have started or completed remediation, compared to 42% of the 11-18m buildings.
Cladding defects
The estimates in this section are based on a combination of self-reported data submitted by developers and information that has been imputed from Building Safety Fund (BSF), ACM and CSS programme data (please see above for further details).
Where a building has been identified with life-critical fire safety defects but the developer has not reported a defect type in the question ‘What do the issues relate to’ it is assumed that the defect type relates to cladding.
Some remediation being undertaken by developers on buildings with life-critical fire safety risks relate to non-cladding defects. When excluding buildings reported to have only non-cladding defects, there are 1,821 buildings which developers have reported as having unsafe cladding – no change since the March data release. Of these:
-
433 (24%) are reported to have completed remediation– no change since the March data release. Of the 433 buildings that are reported to have completed remediation, 339 buildings (19% of all buildings with defects) are reported to have received building control sign-off.
-
959 (53%) are reported to have started or completed remediation – no change since the March data release.
-
274 (15%) are reported to have not started remediation but have plans in place – no change since the March data release.
-
588 (32%) are reported to have not started remediation but have plans in place – no change since the March data release.
These estimates are subject to change each month due to the monitoring of buildings under the developer remediation contract in other remediation programmes.
Self-reported and developer-led remediation
The figures reported for developers above combine information received directly from developers as well as information held by the department from other programmes which relate to remediation. This is to help better estimate a figure for buildings requiring remediation under the developer remediation contract. The figures reported above will also include buildings which are being remediated solely under a government remediation scheme, for which the developer will reimburse taxpayers.
The estimates in this section report on buildings which have been self-reported by developers as requiring remediation to life-critical fire safety risks. Furthermore, this section reports on buildings which are being remediated by the developer directly, rather than being remediated through a government fund and being reimbursed to taxpayers. However, some buildings being remediated under a government remediation programme will be included if other relevant fire safety defects have been found, which were not eligible for a government remediation programme and which the developer is remediating themselves. Developers have self-reported that 2,403 buildings require life-critical fire safety remediation, which will be directly remediated by the developer, no change since the March data release.
Buildings that are being remediated in the BSF, ACM or CSS programme, but are also reported to have other non-EWS life-critical fire safety defects by the developer will be included in these statistics. Of these 2,403 buildings being directly remediated by the developer:
-
439 buildings (18%) have completed remediation, no change since the March data release. Of these, 353 buildings (15% of all buildings with defects) are reported to have received building control sign-off.
-
1,060 buildings (44%) have started or completed remediation, no change since the March data release.
-
328 buildings (14%) have not started remediation but have a plan in place, no change since the March data release.
-
1,015 buildings (42%) have not started and have no plans in place, no change since the March data release.
Further information on the progress developers have made regarding the buildings they’ve reported on is available in the accompanying management information tables and quarterly Developer remediation contract data release. From August 2025 these include an update against the commitments set out in the joint plan to accelerate developer-led remediation and improve resident experience, which was published alongside the department Remediation Acceleration Plan (RAP).
Additionally, alongside the Building Safety Remediation Data Release, MHCLG publishes a ‘developer progress chart’ which allows you to compare the progress developers have made on determining whether works are required on buildings they are responsible for, as well as progress being made on buildings requiring works that have started on site. This chart represents the self-reported information shown above and is published in the accompanying dashboard.
Social housing self-funded remediation
Information in this section is correct as at 30 April 2026 and shows a monthly update from the previous publication.
Data quality
Homes England are continuing to work with registered providers to review records of their 11m+ buildings which have or had unsafe cladding to the NRS. While this work is underway, fluctuations in the remediation progress figures for social buildings where registered providers are self-funding cladding remediation is expected. Once this work is complete, we expect to be able to provide more accurate and frequent information on social housing remediation progress. Further information on the data collection of social self-funded buildings is available in the Technical Note.
Social Housing remediation: Key statistics
Figure 20: 67% of social self-funded buildings reported to have unsafe cladding have started or completed remediation works, with 57% (of monitored buildings) having completed remediation works.
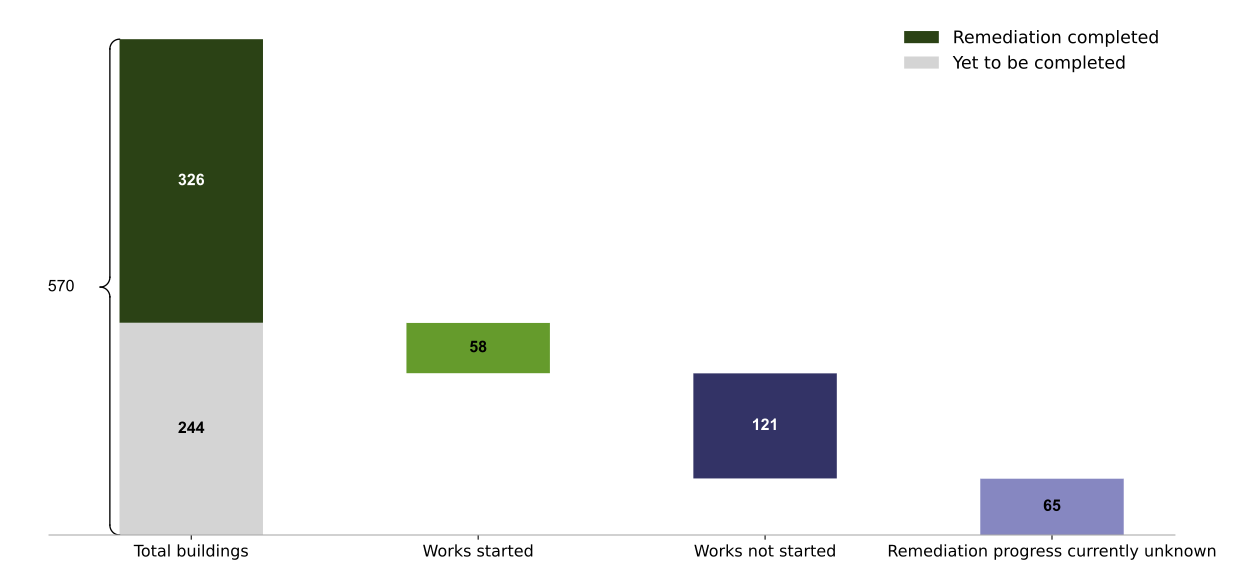
Table 12: Remediation status of social self-funded buildings with unsafe cladding, 30 April 2026.
| Remediation Stage | Number | Percentage | Cumulative Number | Cumulative Percentage |
| Remediation completed | 326 | 57% | 326 | 57% |
| Works started | 58 | 10% | 384 | 67% |
| Works not started | 121 | 21% | 505 | 89% |
| Remediation progress currently unknown | 65 | 11% | 570 | 100% |
| Total | 570 | 100% | 570 | 100% |
As at 30 April 2026, there are 570 11m+ social buildings identified with unsafe cladding which registered providers are self-funding the remediation of, a decrease of five since the end of March 2026. Two buildings were added to reporting this month, and seven were removed – due to continued data cleansing by registered providers. This includes social buildings that registered providers reported to be self-funding the cladding remediation of in the NRS, that were not identified in another remediation programme, and 19 social buildings monitored in the ACM programme where registered providers have self-funded ACM remediation.
Of these 570 11m+ social buildings where registered providers are self-funding remediation:
-
326 (57%) are reported to have completed remediation – an increase of six since the end of March 2026.
-
384 (67%) are reported to have started or completed remediation – an increase of 11 since the end of March 2026.
-
121 (21%) are reported to have not started remediation – a decrease of 10 since the end of March 2026.
-
The remediation status of 65 (11%) buildings is currently unknown as registered providers are yet to provide remediation dates on the NRS – a decrease of six since the end of March. We expect buildings with unknown remediation status to be confirmed in coming months as further data is collected.
Height breakdown
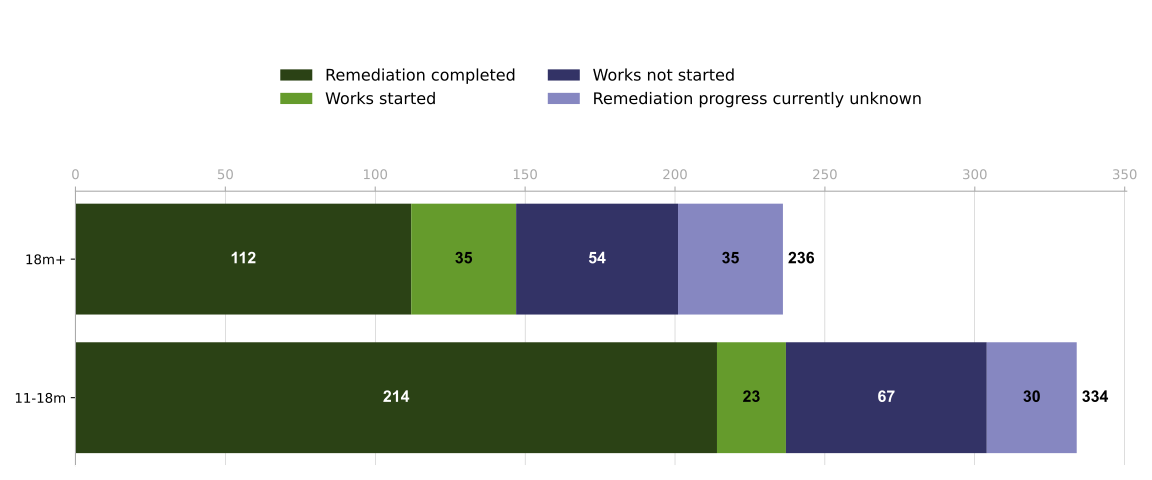
Figure 21: 71% of the 11-18m social self-funded buildings are reported to have started or completed remediation compared to 62% of the 18m+ social self-funded buildings.
Enforcement
Information in this section is correct as at 24 April 2026 and shows a monthly update from the previous publication.
This section includes local authority enforcement action on buildings 11 metres or over in height. Up until June 2024 only enforcement action taken on buildings over 18m in height was reported on.
Local authority enforcement action: key statistics
As at 24 April 2026, enforcement action has been, or is being, taken under the Housing Act against 880 buildings reported as over 11m with suspected unsafe cladding - an increase of 17 since the end of March. Some of these buildings will have been found to be safe, and others may not have unsafe cladding but other building safety defects. The department has monitored or is currently monitoring the cladding remediation progress of 48% of these 880 buildings, including those which have completed remediation.
187 of the 880 buildings where enforcement action has been, or is being taken, have had 190 inspections with Joint Inspection Team support – an increase of three inspections since the end of March.
Of the 880 buildings where a local authority had undertaken an inspection, we are aware of the following HHSRS ratings in relation to fire hazards only:
-
146 had a Category 1 rating
-
654 had a Category 2 rating
As several buildings have now had two or more inspections, from August 2024, only the most recent inspection’s category rating is reported on, as this is used to gauge the risks of the buildings in each Local Authority’s portfolio. Additional inspections are still reported as enforcement action.
Of the 880 buildings, we are aware that at least 264 improvement notices, 110 hazard awareness notices and 1 prohibition order have been served to date. Some buildings may have received multiple notices. We understand that 61 of the improvement notices have been subject to appeals.
Accompanying dashboard
An additional interactive dashboard showing the information in this release is available.
Accompanying tables
Additional management information tables are available.
The tables provide data on:
-
The estimated number of residential buildings 11 metres and over with unsafe cladding and the estimated cost to remediate them,
-
the remediation progress of high-rise (18 metres and over) residential buildings identified with unsafe Aluminium Composite Material (ACM) cladding systems,
-
the remediation progress of high-rise residential buildings with unsafe non-ACM cladding systems that are pursuing successful applications from their Building Safety Fund (BSF) Registration,
-
data on buildings in the Cladding Safety Scheme (CSS),
-
the remediation progress of buildings covered by the developer remediation contract, including a developer-by-developer breakdown,
-
the remediation progress of social housing buildings reported by registered providers as being self-funded,
-
the progress of the Waking Watch Relief Fund and Waking Watch Replacement Fund, and
-
building safety enforcement action undertaken by Local Authorities in England.
Related statistics
BRE Testing
Previously, MHCLG published a table on samples received by BRE for testing which has been discontinued as of October 2019 (see technical notes document). The data table of descriptions of large-scale system tests undertaken by the BRE and the number of buildings with similar cladding systems was discontinued in November 2020.
Developer Data
MHCLG has published data provided by developers who have signed the developer remediation contract. This release provides information on the number of buildings in scope of the contract, assessments in place, number of buildings requiring remediation works and status of those works by developer.
English Housing Survey: Feeling Safe from Fire
MHCLG has published the English Housing Survey 2020 to 2021: Feeling Safe from Fire report, providing information on the extent to which people feel safe from fire in their homes.
Estimating the prevalence and costs of external wall system life-safety fire risk in mid-rise residential buildings
MHCLG has published data on the prevalence of external wall system life-safety fire risk in mid-rise (11-18m) residential buildings in England, and the estimated cost as at July 2021 to remediate or mitigate these buildings. The estimate of the prevalence of external wall system fire risk in mid-rise buildings has been updated on 27th May 2026, after a previous update in July 2025. This does not include an update of the estimated cost, which is unchanged since the last update in July 2025, and uses the previous estimate of the number of buildings with unsafe cladding as of March 2025.
EWS1 requirements on residential buildings in England
MHCLG publishes quarterly data on the numbers of EWS1 forms (or equivalent) that have been required on mortgage valuations for flats.
Population and Dwelling Numbers
Previously, MHCLG published estimates on population and dwelling numbers of residential buildings in the Building Safety Programme data release. Should these figures change, MHCLG will publish a new update. On 17 July 2025, MHCLG published an updated estimate of the number of 11-18m residential buildings in England. Should these figures change further, MHCLG will publish a new update.
RSH publication
On 18 December 2025, the Regulator of Social Housing published findings from the Fire Safety Remediation Survey (FRS) collected from Registered Providers of Social Housing for buildings 11 metres and over in height as at 30 September 2025.
Waking Watch costs
On 16 October 2020, MHCLG published information on Waking Watch costs based on data collected through a range of external stakeholders from July to September 2020.
Cladding remediation unit costs
On 19 December 2025, MHCLG published data on cladding remediation unit costs, providing data on costs per square metre of cladding remediated for high-rise and mid-rise non-ACM buildings, including analysis by cladding area and cost categories.
Technical note
Please see the accompanying technical notes document for further details.