Investigation into the risk to human health of avian influenza (influenza A H5N1) in England: technical briefing 3
Updated 14 July 2023
Applies to England

© Crown copyright 2023
This publication is licensed under the terms of the Open Government Licence v3.0 except where otherwise stated. To view this licence, visit nationalarchives.gov.uk/doc/open-government-licence/version/3 or write to the Information Policy Team, The National Archives, Kew, London TW9 4DU, or email: psi@nationalarchives.gov.uk.
Where we have identified any third party copyright information you will need to obtain permission from the copyright holders concerned.
This publication is available at https://www.gov.uk/government/publications/avian-influenza-influenza-a-h5n1-technical-briefings/investigation-into-the-risk-to-human-health-of-avian-influenza-influenza-a-h5n1-in-england-technical-briefing-3
The UK Health Security Agency (UKHSA) is working with the Animal and Plant Health Agency (APHA), the Department for Environment, Food and Rural Affairs (DEFRA) and the public health agencies of the 4 nations to investigate the risk to human health of avian influenza (influenza A H5N1) in England. This briefing is produced to share data useful to other public health investigators and academic partners undertaking related work. It includes early evidence and preliminary analyses which may be subject to change.
Data reported in the technical briefing is as of 15 March 2023 (or as specified in the text) to allow time for analysis.
Code associated with technical briefings can be found on GitHub.
Levels of human health risk related to the outbreak of avian influenza in England
Since the previous technical briefings, risk levels have been updated by the Technical Group. These adjusted levels synthesise epidemiological, virological and genomic indicators at every stage.
The following indicators are used for assessment of the risk level:
- detections in wild and farmed birds, avian host range and seasonal pattern
- the frequency, nature and host range of mammalian spillover infections
- exposures of confirmed human cases
- the size of any clusters of mammalian or human infections, the implied mode of transmission (for example, evidence of long-range aerosol transmission), and estimated transmissibility where possible
- genomic and phenotypic evidence of changes in receptor binding or other changes that may impact transmissibility (haemagglutinin)
- genomic and phenotypic evidence of other adaptation for mammalian infection (non-haemagglutinin)
The avian influenza outbreak can be considered to fall into one of 7 potential levels of transmission:
Level 0
Avian influenza circulating in birds, with normal epidemiology.
Level 1
Avian influenza circulating in birds, with abnormal epidemiology.
Level 2
Evidence of propensity to infect humans or other mammalian species.
Level 3
Limited mammalian transmission (excluding human).
Level 4
Limited human-to-human transmission.
Level 5
Sustained transmission in mammals.
Level 6
Sustained human-to-human transmission.
Emerging influenza viruses may jump levels in this scheme (for example, from level 3 to 6), either because they emerge directly and successfully into humans, or because intermediate stages are not detected through surveillance.
Assessment
The UK risk is assessed as level 3 (limited mammalian transmission, low confidence).
Influenza A(H5N1) clade 2.3.4.4b can successfully infect mammals and humans with high levels of direct exposure (for example, scavenger mammalian species, humans working closely with birds).
Polymerase basic protein (PB2) mutations associated with mammalian adaptation, including E627K, are seen in mammalian infections. There is evidence of transmission in farmed mink and possible, though unconfirmed, transmission in populations of seals and sea lions.
There is limited mammalian surveillance.
The confidence level is assessed through the synthesis of epidemiology, genomic and virology data.
Summary
Avian infections
Avian influenza A(H5N1) in avian species has been detected in a further 4 infected premises and 45 wild birds across England since the last technical briefing. Detections in infected premises remain at low levels compared to earlier in the season, however wild bird detections continue to be geographically widespread across England.
Mammalian infections
UK situation
An APHA-led programme of mammalian surveillance detected influenza A(H5) in 23 out of 219 wild mammals collected from October 2021 to date. This includes 6 detections since commencement of enhanced mammalian surveillance in January 2023.
In addition to these findings, influenza A(H5) was retrospectively detected in a group of 10 captive bush dogs in a zoological premises from November 2022. There are plausible routes of direct exposure to infected wild birds but investigations into the possibility of mammal-to-mammal transmission are ongoing. This appears to be a defined acute event with no evidence of ongoing risk at the premises.
Initial sequence analysis by APHA shows the presence of PB2 E627K, as seen in other mammalian H5N1 sequences, but show no other genetic indicators of increased mammalian risk compared to circulating avian sequences; this sequence is available on the Global Initiative on Sharing Avian Influenza Data (GISAID) database (EPI_ISL_17257532). Further sequence generation and interrogation is planned to look across all dogs that succumbed during the disease event.
Global situation
International surveillance data of non-avian A(H5N1) detection continues to show spillover into mammalian species, though mammalian surveillance varies internationally. There are no new outbreaks with confirmed mammalian transmission since those reported in the last technical briefing, although some investigations continue.
Since the last technical briefing, a study was published describing the investigation of the H5N1 highly pathogenic avian influenza virus (HPAIV) outbreak in Harbour (Phoca vitulina) and Gray (Halichoerus grypus) seals in New England, USA, from June to July 2022. The authors report that genetic analysis of the viral sequences suggested that bird-to-seal spillover was then the most likely transmission route as opposed to seal-to-seal transmission.
Genomics
Updated genomic data from APHA are now available as open access on GISAID. APHA reports no change in the avian population genomic surveillance data suggesting increased risk to mammals. PB2 E627K, associated with replication in mammals, continues to be found in viral genomes from mammalian infections.
Planning scenarios
Scenarios of early human transmission have been developed by UKHSA and reviewed by the Technical Group and the Scientific Pandemic Influenza group on Modelling (SPI-M). The scenarios are designed to assess the likely time to detection of an emerging influenza virus through different surveillance approaches and can also be used to provide the basis to assess the potential impact of pharmaceutical and non-pharmaceutical interventions in the very early stages of an outbreak.
These scenarios are neither predictive nor exhaustive, but provide some example trajectories which highlight strengths and weaknesses of different detection systems. The scenarios assume sustained human transmission with a reproduction number (R) of 1.2 to 2.0. The clinical severity of a human influenza A(H5N1) outbreak is highly unpredictable and variations of infection-fatality rate (IFR) (0.25%, 2.5%, 5%) and options for the age profile of clinically severe disease have been provided. The surveillance approaches tested are also generic examples of different systems and are not exact equivalents of current UK respiratory surveillance.
The code for the models is available on GitHub in the avian influenza scenario calculations repository, and can be run with alternative parameters.
Part 1. Epidemiology update
1.1 Current epidemiological situation
The dominant subtype currently circulating in avian species across England continues to be highly pathogenic avian influenza (HPAI) A(H5N1).
Avian epidemiology
Since the start of the 2022 to 2023 season, APHA has confirmed HPAI A(H5N1) in avian species at 148 premises in England and in 708 wild birds from 458 locations in England. As of 15 March 2023, there have been 4 new infected premises and 45 further detections in wild birds since the last update (data as of 14 February 2023). Further information on the latest avian influenza situational update in England is available online.
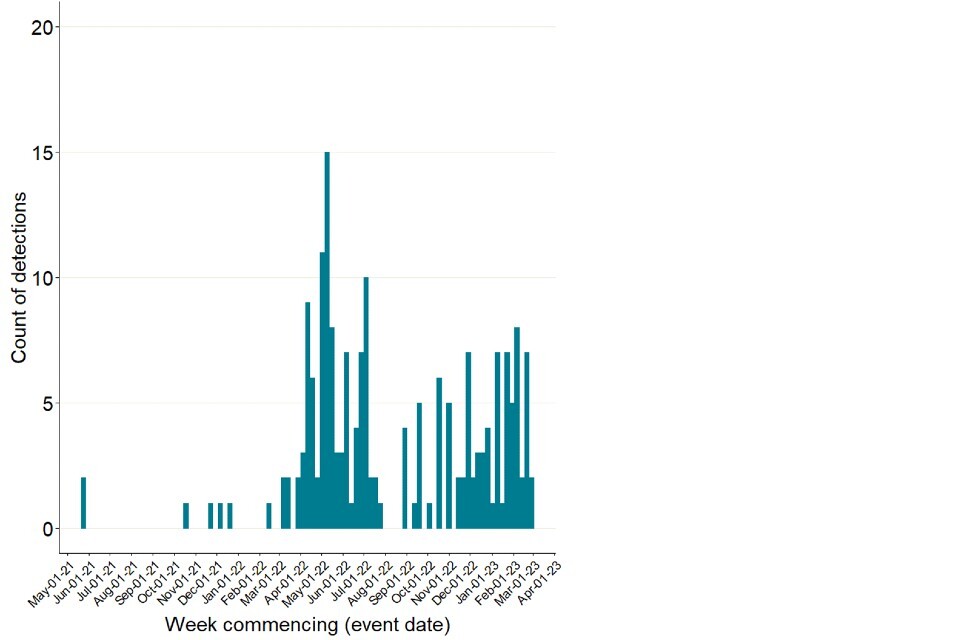
The number of detections at infected premises remains relatively low compared to the period before the housing order was implemented (Figure 1). Detections of avian influenza in wild birds are decreasing but have maintained their geographical spread across England (Figures 2a and 2b). The joint DEFRA and APHA assessment is that there continues to be high levels of influenza transmission in wild birds across the UK.
Figure 1. Confirmed detections of avian influenza in poultry and wild birds by setting type in England from 1 October 2022 to 15 March 2023. Data provided by APHA
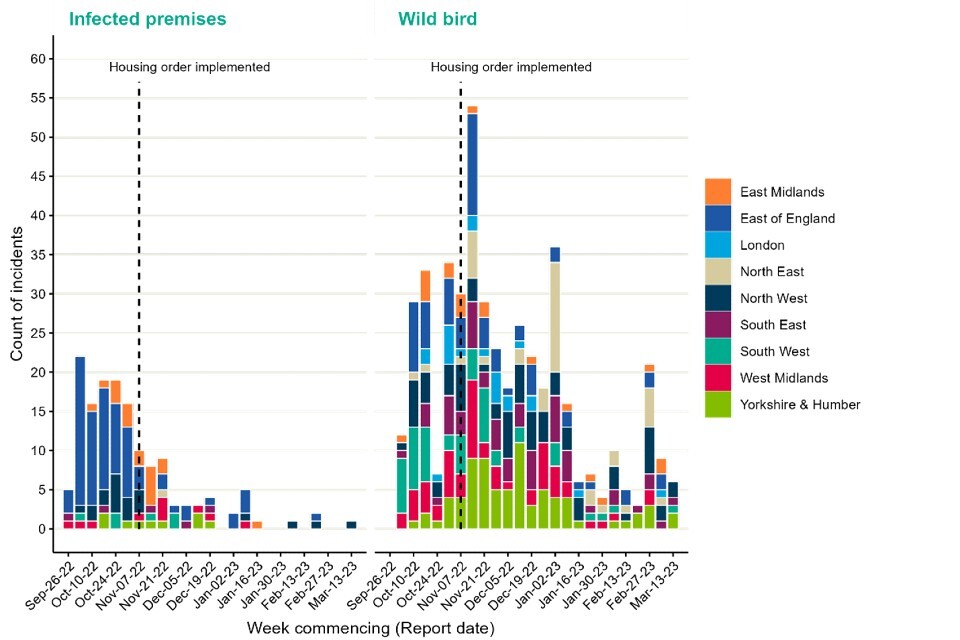
The data used in this graph can be found in the accompanying spreadsheet.
Figure 2a. Confirmed detections of avian influenza at infected premises by quarter in England from 1 October 2022 to 15 March 2023. Data provided by APHA
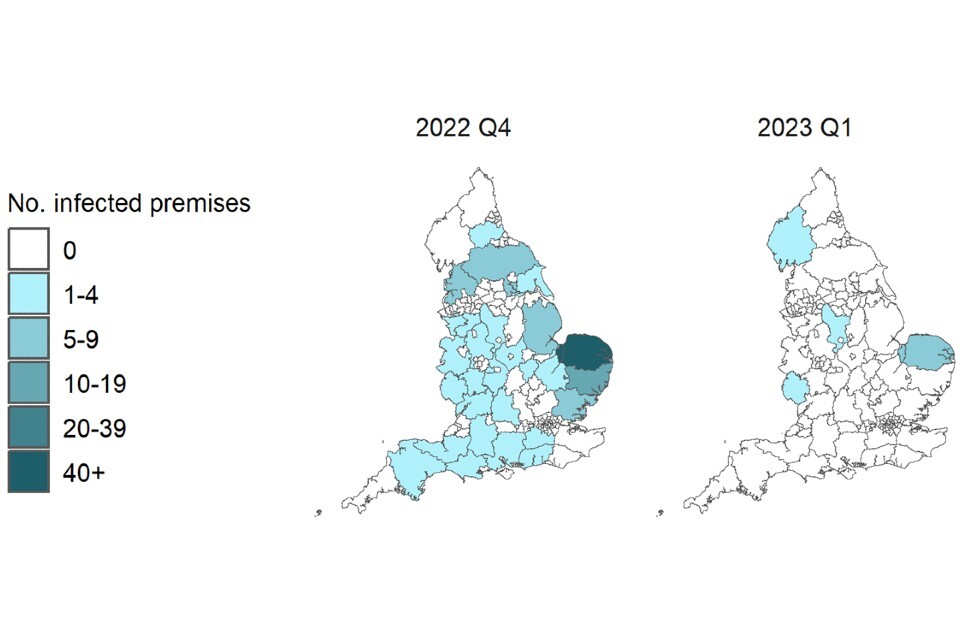
Figure 2b. Confirmed detections of avian influenza in wild birds by quarter in England from 1 October 2022 to 15 March 2023. Data provided by APHA
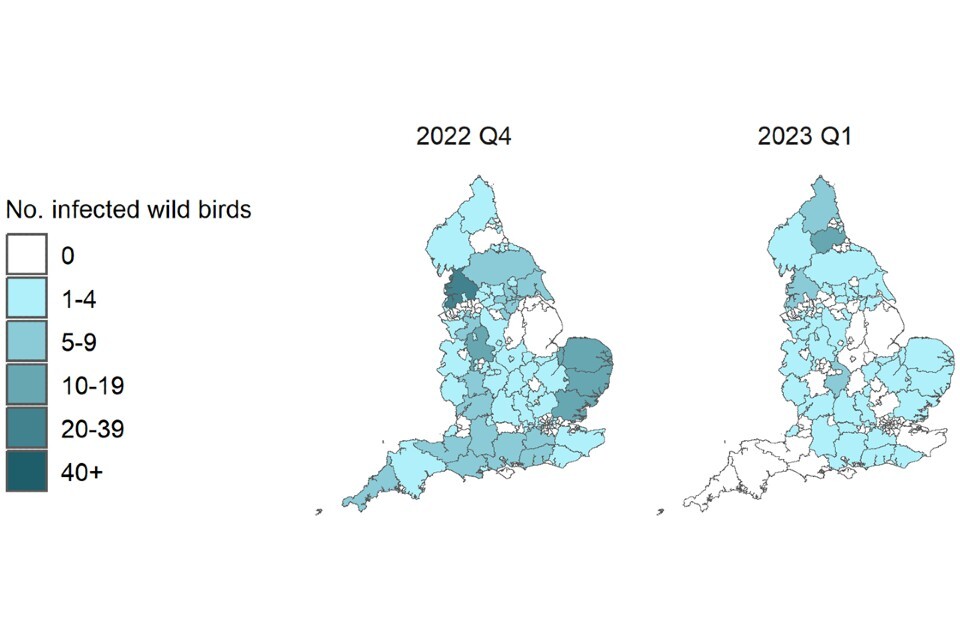
These maps contain National Statistics data © Crown copyright and database right 2022.
Q4 (2022) = Quarter 4 (1 October 2022 to 31 December 2022)
Q1 (2023) = Quarter 1 (1 January 2023 to 15 March 2023)
Supplementary data is not available for these figures to prevent deductive disclosure.
Mammalian detections
APHA surveillance has detected influenza A(H5) in 23 of 219 wild mammals collected since October 2021, representing a further 9 detections of 85 tested since the last update (data as of 14 February 2023). This total figure includes samples tested in real time as well as samples tested retrospectively (Figure 3).
Of the 23 detections, 9 were in Scotland, 12 were in England, and 2 were in Wales. This includes 6 foxes, 6 grey seals, 5 otters, 3 harbour seals, 2 common dolphins and one harbour porpoise.
Figure 3. Detections of A(H5N1) in wild mammals collected between 1 October 2021 and 15 March 2023 through APHA surveillance programme
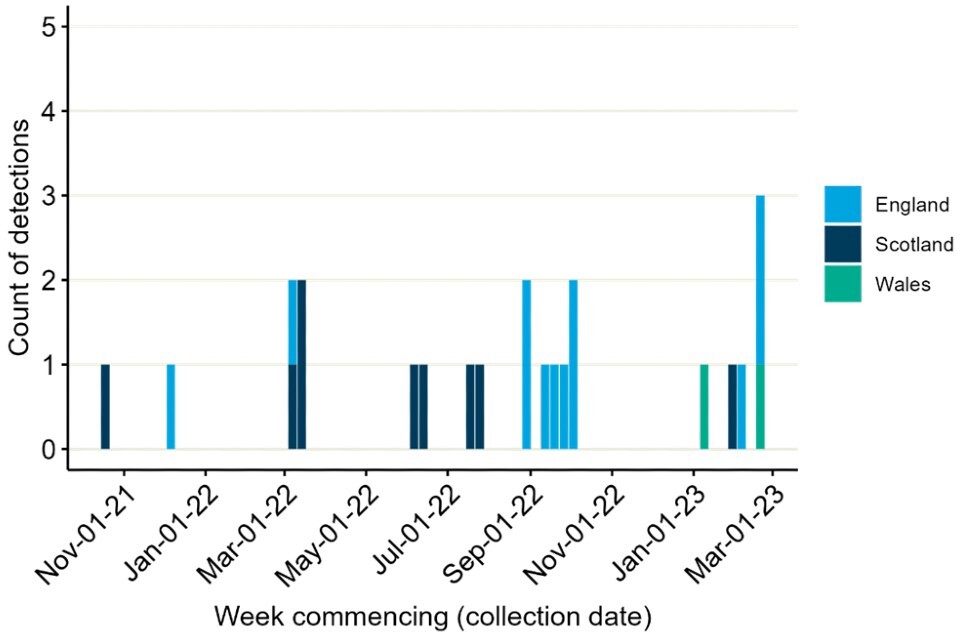
The data used in this graph can be found in the accompanying spreadsheet.
In addition to these detected mammalian cases, influenza A(H5) has been retrospectively detected in a group of 10 captive South American bush dogs (Speothos venaticus), part of a captive breeding programme in a zoological premises in England from November 2022. They were tested as part of a routine investigation into an unusual mammal die-off. There are plausible routes of direct exposure to infected wild birds but investigations into the possibility of mammal-to-mammal transmission are ongoing. This appears to be a defined acute event and there is no ongoing risk at the premises.
Preliminary analysis by APHA shows the presence of PB2 E627K, as seen in other mammalian H5N1 sequences; this sequence is available on GISAID (EPI_ISL_17257532). Further sequence generation and interrogation is planned to look across all dogs that succumbed during the disease event.
There have also been continued reports of detections in mammals internationally (Figure 4). These do not appear to be increasing in frequency though there is no standardised approach to surveillance or reporting. Die-off of sea lions with H5N1 detections in Peru was previously noted. However, no sequence data is publicly available.
Figure 4. International reports of mammalian A(H5N1) detections collated through epidemic intelligence surveillance from 1 January 2021 to 15 March 2023
The data used in this graph can be found in the accompanying spreadsheet. Data is sourced from the Emerging Infections and Zoonoses epidemic intelligence scanning database from official and unofficial reports (including media reports), which may include a small number of duplicate entries due to incomplete information. Event date indicates collection date where known, or notification date when collection date unknown.
Potential human exposures
Human exposures to avian influenza undergo a risk assessment by UKHSA health protection teams (HPTs). These teams manage and record exposures in the outbreak information system HPZone, as detailed in previous technical briefings.
Between 1 October 2022 and 15 March 2023, 2,348 exposure episodes across England were entered into HPZone (Figure 5). Guidance on interpreting HPZone data has been published in previous technical briefings.
There have been no human detections of influenza H5 in England over the 2022 to 2023 season.
Figure 5. Exposures to infected birds reported on HPZone from 1 October 2022 to 15 March 2023
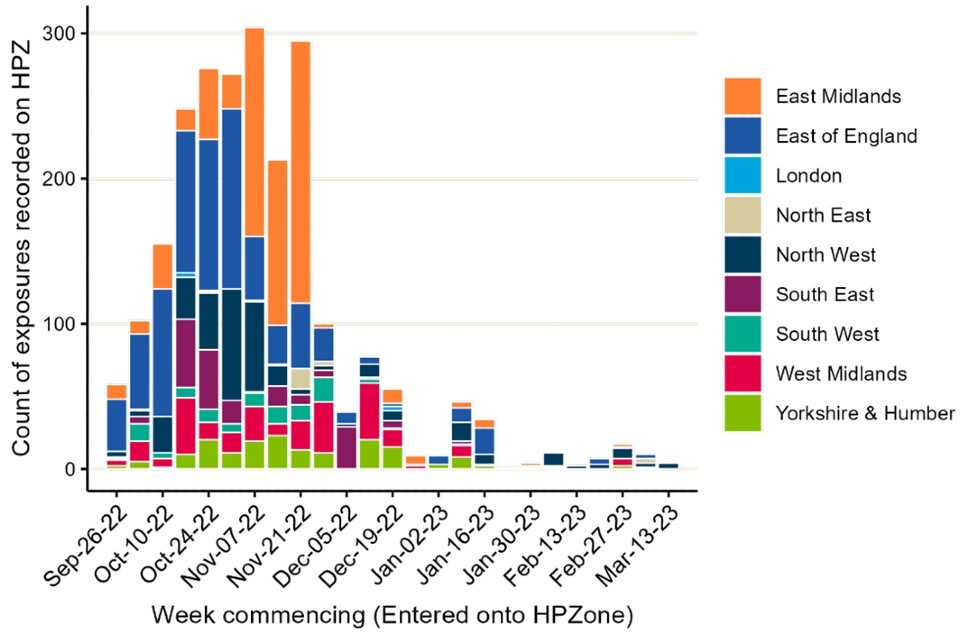
The data used in this graph can be found in the accompanying spreadsheet.
Information is also collected by HPTs using surveillance forms, as described in technical briefing 1, with caveats on completeness and lag. Between 1 October 2022 and 15 March 2023, information was returned for 261 (43%) out of 607 incidents this season and 3,226 exposure events documented (individuals may be recorded in more than one event if they are exposed multiple times).
Over half of the surveillance forms received from HPTs relate to wild bird incidents (150 out of 261 forms returned). Wild bird incidents often involve fewer exposed individuals.
Personal protective equipment (PPE) use was reported in 696 (21.6%) exposures. Antiviral prophylaxis was reported for 300 (9.3%) exposures. Symptoms were reported following 69 (2.1%) exposures, with 51 symptomatic swabs being carried out (73.9% of those eligible); all tests were reported H5N1 negative. Forty-one asymptomatic swabs were performed and reported as part of an enhanced surveillance pilot from consenting individuals with no H5N1 detected.
1.2 Human cases
In total, 7 human cases of A(H5N1) 2.3.4.4.b have been reported by WHO since December 2021. This includes:
All 4 cases from Europe and the USA reported mild symptoms or were asymptomatic when tested. The cases from the USA and Spain were involved with poultry work including the culling of poultry and disinfection of infected premises. Spain has subsequently reported that the absence of symptoms, low viral load and lack of H5 specific antibodies may indicate that their cases were environmental contamination rather than infection.
The cases from China and Ecuador were reported as severe infections with a fatality reported in one of the cases from China. All 3 cases had exposure to poultry.
There was one case of influenza A(H5N1) reported from Vietnam, however clade information is unavailable.
No human-to-human transmission has been reported between any of these human A(H5N1) cases.
Since the last technical briefing, 2 cases of A(H5N1) 2.3.2.1.c were reported from Cambodia. One of the cases was fatal, whilst the other was asymptomatic.
UKHSA continues to carry out horizon scanning for epidemiological reports relevant to emerging influenza in humans and animals.
1.3 Influenza samples referred to UKHSA for characterisation
UKHSA receives influenza positive clinical samples referred from NHS and regional public health laboratories (PHLs) for whole genome sequencing, virus isolation and antigenic characterisation, year-round. This is described in further detail in technical briefing 1. The sensitivity of this system for detecting emerging viruses is currently under assessment.
Between 3 October 2022 and 2 March 2023, 125 samples which were positive for influenza A and not subtypable locally or at regional laboratories were referred to the UKHSA Respiratory Virus Unit. Of these, 79% (n=99) were characterised as seasonal H1 or H3 viruses, with 15% (n=19) having no virus detected and 6% (n=7) as having detectable but insufficient viral load to achieve a subtyping result.
Part 2. Genomic surveillance
2.1 UK avian and mammalian data
Complementary genomic analysis is currently being performed by both APHA and UKHSA using genomic sequencing data shared by APHA. The following analysis is reported by APHA and refers to UK genomes only. APHA has uploaded all available data to GISAID.
Across the whole period of genomic surveillance of the current influenza A (H5N1) outbreak to date, as of 17 March 2023 APHA report that they have assessed 558 influenza genomes from poultry and wild bird detections.
Over the same period, 10 influenza genomes from mammalian detections have also been analysed. These have a similar genetic profile the avian sequences, with the exception of the polymerase basic protein (PB2) E627K mutation which was identified in 8 out of the 10 mammalian sequences and has only been detected once in UK avian sequences. The E627K mutation is of particular importance as it has been demonstrated to enhance the replication efficiency in mammalian cells, consequently being shown to increase virulence and airborne transmission potential of avian influenza viruses in mammalian in vitro and in vivo models (Suttie and colleagues, 2019).
From the 2022 to 2023 season, 251 genomes are available from poultry and wild bird detections in the UK. Whilst these sequences do possess a number of genetic changes associated with mammalian adaptation, the nature and prevalence of such mutations have not increased since the beginning of the current epizootic in October 2021.
Since publication of the previous technical briefing, a further 2 mammalian genomes have been generated from samples collected during the 2022 to 2023 season, including one genome from samples collected during the die-off in captive bush dogs from November 2022. Both genomes were found to be the AIV09 genotype that has been predominant in the UK since October 2022. Unlike the first mammalian sequence from 2023, these sequences do contain the PB2 E627K mutation. This mutation has been observed in other mammalian H5N1 sequences. All other mutations within these additional mammalian H5N1 genomes (including in the PB2 and haemagglutinin (HA) proteins) have been previously detected in avian and mammalian sequences. Additional work is currently ongoing to further investigate the bush dog die-off.
APHA have recently updated GISAID with additional H5 sequences, including the sequence obtained from the bush dog investigation (EPI_ISL_17257532). This brings the total number of publicly available UK H5 genomes for 2020 to 2023, to 594.
2.2 Haemagglutinin (HA) genomic diversity
The HA segment sequence data from UK samples shows similar diversity to that seen in samples from other European countries.
Figure 6 shows a phylogenetic tree of the HA segment from all H5 sequences identified as clade 2.3.4.4b from the GISAID database since 2016, with a length of at least 1500 nucleotides (nt), and all AHPA data shared to date.
Candidate vaccine virus (CVV) sequences are included for reference (brown squares). Sequences from samples collected after 1 October 2021 are shown on the tree and coloured by continent. European data is split into UK data (light green) and all other European countries (dark green).
The tree shows recent clade 2.3.4.4b sequence data splits into 2 sub-lineages, B1 and B2, as described by Pohlmann and colleagues (2022). Although initially both clades contained sequences from Europe, B1 has more recently been associated with the Americas and B2 has mainly been observed in European countries and in the UK.
Figure 6. Phylogenetic tree of HA segment sequences

The tree contains all data shared by APHA and GISAID data from all H5 genomes submitted since 2016 with a length of at least 1,500 nt. CVV sequences were included for reference (brown squares). Sequence data was aligned to the 1996 Goose Guangdong HA sequence with Multiple Alignment using Fast Fourier Transform (mafft). The maximum-likelihood tree was produced using the general time reversible (GTR) method from IQTree, and visualised using ggtree.
Supplementary data is not available for this figure.
Part 3. Planning scenarios
3.1 Scenario development: summary of assumptions
UKHSA has developed scenarios of early human transmission of influenza A(H5N1). It is not possible to know key parameters in advance, so these scenarios are not predictive. They are useful to explore the very early period of circulation of a new influenza virus in the UK, up to the time human-to-human transmission is detected, and the potential impact of pharmaceutical and non-pharmaceutical interventions.
The Technical Group reviewed and agreed the following parameters to be used in preliminary scenarios:
Transmission
These scenarios assume that sustained human-to-human transmission has begun – by definition a reproduction number (R) above one. Past avian influenza outbreaks which have not led to sustained human-to-human transmission cannot be used as a guide to transmission parameters. Based on pandemic influenza data, we judge that looking at scenarios where R is between 1.2 and 2 (or where doubling times are roughly between 3 days and 11 days) is a useful initial assumption.
Severity
Three scenarios have been developed, each assuming a different level of clinical severity associated with the disease. All 3 scenarios should be considered severe compared to the most recent influenza pandemic in 2009.
In scenario 1, the infection-fatality rate (IFR) is around 0.25%, similar to that of coronavirus (COVID-19) in autumn 2021, though considerably higher than the overall severity of the 2009 H1N1 outbreak (0.01% IFR) (Riley and colleagues, 2011; Wong and colleagues, 2013). There are very few studies with estimates of an infection-hospitalisation rate (IHR), and for this scenario it has been set at 1%.
Scenario 2 is more severe. We base our parameters on the 1918 influenza pandemic, which had an IFR of around 2.5% (Murray and colleagues, 2006). We also assume in this scenario an IHR of 5%. Although various H5N1 outbreaks have much higher fatality estimates, these are not examples of sustained human-to-human transmission and are therefore not directly comparable (for example see Li and colleagues, 2008; Poovorawan and colleagues, 2013).
In scenario 3, we choose a higher IHR of 10%, with IFR 5%. This approximates the type of outbreak seen with SARS-CoV-1 in 2002 (9% reported case fatality rate). We note significant variation in reported CFR rates for SARS-CoV-1, suggesting the underlying IFR may have been even higher than the crude average of reported deaths as a fraction of reported cases.
3.2 Scenarios and parameters
As described above, the R value for scenario development is assumed to be between 1.2 and 2. While this is lower than that of COVID-19, we also expect a shorter serial interval for avian influenza, which would be consistent for seasonal and pandemic influenza in general. We have modelled the scenarios assuming a serial interval of 3 days (Vink and colleagues, 2014) which, combined with the R values, indicates a doubling time of 3 to 11 days, assuming exponential growth.
The age profile of severity in an H5N1 outbreak is unpredictable. For example, the 1918 outbreak led to an excess of deaths in younger adults. Such an occurrence today, even with a fairly low IFR could lead to significant behavioural differences relative to the recent pandemic experience.
For each of the 3 scenarios, 3 potential age distributions are considered:
- a flat distribution, that is, the IHR and IFR are the same for all ages
- a monotonic, continually increasing rate. Here the severity increases with age, similar to COVID-19 or seasonal influenza. Compared to 0 to 4 year olds, the risk in 5 to 19 year olds is 10 times higher; in 20 to 64 year olds is 100 times higher; and in those aged 65 years or above is 1,000 times higher
- a distribution with equal risk in the oldest and youngest (referred to here as ‘young risk’). Severity in those aged 0 to 4 years is 50 times higher than those aged 20 to 64 years. In those aged 5 to 19 years, severity is 10 times higher than those aged 20 to 24 years. In those aged 65 years or above, severity is 100 times higher than those aged 20 to 64 years
Combining the severity scenarios and age distributions yields the following age-specific IHRs and IFRs (Table 2). For each scenario, the overall number of hospitalisations and deaths is the same, however there will be differing impact by age for different distributions.
Table 2. Age-specific IHRs and IFRs for 3 severity scenarios and 3 possible distributions (as percentage of population).
Table 2 a) Scenario 1
| Age bracket (years) | IHR (%): flat | IHR (%): monotonic | IHR (%): ‘Young risk’ | IFR (%): flat | IFR (%): monotonic | IFR (%): ‘Young risk’ |
|---|---|---|---|---|---|---|
| 0 to 4 | 1 | 0.0041 | 2.1 | 0.25 | 0.001 | 0.53 |
| 5 to 19 | 1 | 0.041 | 0.43 | 0.25 | 0.01 | 0.11 |
| 20 to 64 | 1 | 0.41 | 0.043 | 0.25 | 0.1 | 0.011 |
| 65 or above | 1 | 4.1 | 4.3 | 0.25 | 1.0 | 1.1 |
| Total | 1 | 1 | 1 | 0.25 | 0.25 | 0.25 |
Table 2 b) Scenario 2
| Age bracket (years) | IHR (%): flat | IHR (%): monotonic | IHR (%): ‘Young risk’ | IFR (%): flat | IFR (%): monotonic | IFR (%): ‘Young risk’ |
|---|---|---|---|---|---|---|
| 0 to 4 | 5 | 0.02 | 11.0 | 2.5 | 0.01 | 5.3 |
| 5 to 19 | 5 | 0.2 | 2.1 | 2.5 | 0.1 | 1.1 |
| 20 to 64 | 5 | 2.0 | 0.21 | 2.5 | 1.0 | 0.11 |
| 65 or above | 5 | 20.0 | 21.0 | 2.5 | 10.0 | 11.0 |
| Total | 5 | 5 | 5 | 2.5 | 2.5 | 2.5 |
Table 2 c) Scenario 3
| Age bracket (years) | IHR (%): flat | IHR (%): monotonic | IHR (%): ‘Young risk’ | IFR (%): flat | IFR (%): monotonic | IFR (%): ‘Young risk’ |
|---|---|---|---|---|---|---|
| 0 to 4 | 10 | 0.041 | 21.0 | 5 | 0.02 | 11.0 |
| 5 to 19 | 10 | 0.41 | 4.3 | 5 | 0.2 | 2.1 |
| 20 to 64 | 10 | 4.1 | 0.43 | 5 | 2.0 | 0.21 |
| 65 or above | 10 | 41.0 | 42.0 | 5 | 20.0 | 21.0 |
| Total | 10 | 10 | 10 | 5 | 5 | 5 |
3.3 Time to detection
The above scenarios are used to derive estimates of time to detection (TTD) of avian influenza under various testing scenarios. This is based on the assumption of sustained person to person transmission, and no cross-immunity from previous influenza vaccination or infection.
Disease growth in such a situation can be simply modelled as daily growth equals R to the power of 1 over the serial interval (SI). To account for variation in the SI, it is sampled from a Weibull distribution, with mean and median of 3 days, and growth simulation run 100,000 times to yield an expected growth curve and confidence intervals.
The TTD is determined for a number of testing scenarios, estimating the point at which the outbreak will have grown large enough we expect to detect a case. This depends both on the growth rate and the severity (for hospital-based testing). Testing scenarios modelled are:
- sampling of asymptomatic individuals in the community with coverage of 1 in 1,000 people tested daily
- sampling of asymptomatic individuals in the community with coverage of 1 in 200 people tested daily
- testing of all hospital admissions (with influenza-like illness (ILI) symptoms)
- testing of admissions to intensive care units (ICU) only (with ILI symptoms).
Figure 7 shows the expected TTD in each scenario with an R of 1.2, with Figure 8 showing the equivalent when R equals 2. Day 0 is the day the first case becomes infected. The TTD includes delays for: testing (2 days); admission to hospital (9 days); and admission to ICU (a further 2 days) as appropriate. For simplicity the community testing is assumed to take place in the mild severity scenario.
With a lower R (and hence longer doubling time) it may take twice as long to detect an avian influenza case using lower coverage community testing, as it does to detect when testing hospital admissions. Therefore, there may be substantial numbers of infections in the community by the time the first case is detected.
Tables 3a and 3b show the expected number of infections by the time each testing scenario detects the first case. Being able to test in multiple settings improves the speed of detection across a range of plausible R values.
Table 3a. Time to detection (TTD) in each scenario (R=1.2)
| Testing scenario | TTD and CI (days after the first infection that results in exponential growth) | Cumulative infections at the time of first detection |
|---|---|---|
| Scenario 1 (community testing at 1 in 1,000) | 70 (43 to 95) | 1,168 |
| Scenario 1 (community testing at 1 in 200) | 45 (30 to 58) | 236 |
| Scenario 1 (hospital testing) | 44 (34 to 52) | 218 |
| Scenario 1 (ICU testing) | 67 (47 to 85) | 935 |
| Scenario 2 (hospital testing) | 25 (22 to 26) | 57 |
| Scenario 2 (ICU testing) | 43 (34 to 50) | 203 |
| Scenario 3 (hospital testing) | 19 (18 to 20) | 36 |
| Scenario 3 (ICU testing) | 34 (29 to 38) | 111 |
Table 3b. Time to detection (TTD) in each scenario (R=2)
| Testing scenario | TTD and CI (days after the first infection that results in exponential growth) | Cumulative infections |
|---|---|---|
| Scenario 1 (community testing at 1 in 1,000) | 27 (17 to 36) | 1,788 |
| Scenario 1 (community testing at 1 in 200) | 20 (13 to 26) | 360 |
| Scenario 1 (hospital testing) | 26 (21 to 30) | 1,502 |
| Scenario 1 (ICU testing) | 34 (26 to 41) | 9,254 |
| Scenario 2 (hospital testing) | 19 (17 to 21) | 331 |
| Scenario 2 (ICU testing) | 27 (22 to 31) | 1,954 |
| Scenario 3 (hospital testing) | 17 (16 to 18) | 194 |
| Scenario 3 (ICU testing) | 24 (21 to 27) | 998 |
CI = confidence intervals
Figure 7. Expected time to detection (TTD) for avian influenza under a number of testing and severity scenarios, when R=1.2
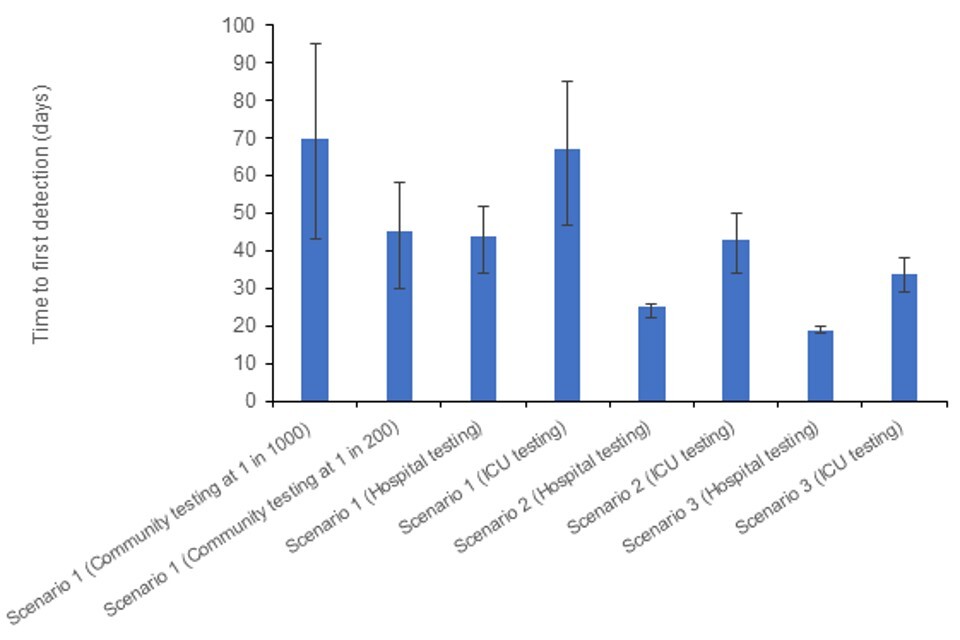
The data used in this graph can be found in table 3a and in the accompanying spreadsheet.
Figure 8. Expected TTD for avian influenza under a number of testing and severity scenarios, when R=2
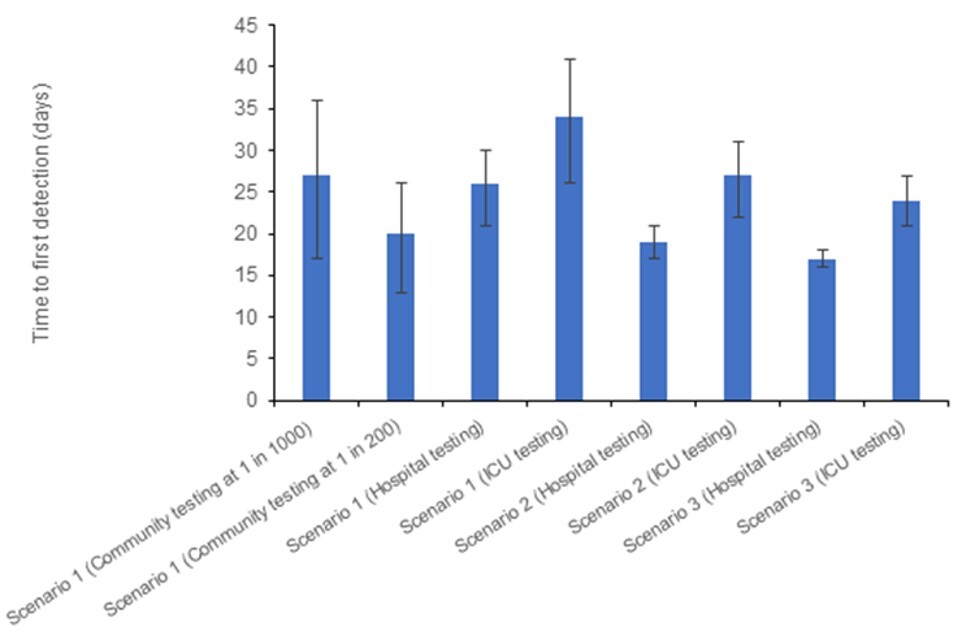
The data used in this graph can be found in table 3b and in the accompanying spreadsheet.
The code scripts which produced the above outputs are available on the avian influenza scenario calculations repository on GitHub.
Sources and acknowledgments
Data sources
Data relating to animal health surveillance and investigations taking place across England obtained from the APHA. This includes data from wild bird surveillance, notifiable disease reports at infected premises and detections in mammals.
Data on international reports of mammals is sourced from the UKHSA Emerging Infections and Zoonoses epidemic intelligence scanning database from official and unofficial reports (including media reports).
Surveillance forms are completed by UKHSA HPTs for each confirmed setting (includes both poultry and wild bird settings). This includes the follow-up of exposed persons and details of exposure. Data is enhanced with laboratory records for respiratory testing held by UKHSA.
Details of exposed individuals are also collected from HPZone, the UKHSA case management system.
International surveillance data of human cases of avian influenza is reported by the World Health Organization under the International Health Regulations and routinely collated by UKHSA.
Authors of this report
Rachel Abbey, Emma Bennett, Ian Brown, Alexander Byrne, Fernando Capelastegui, Christopher Carroll, Lorenzo Cattarino, Meera Chand, Fergus Cumming, Eileen Gallagher, Natalie Groves, Susan Hopkins, Munir Iqbal, Joe James, Anissa Lakhani, Luke Hounsome, Steven Riley, Nick Watkins.
Contributors
- UKHSA Data, Analytics and Surveillance Team
- UKHSA Data Science and Geospatial team
- UKHSA Genomics Public Health Analysis
- UKHSA Respiratory Virus Unit
- UKHSA Research and Evaluation
- UKHSA Research Support and Governance Office
- UKHSA Emerging Infections and Zoonoses Team
- Animal and Plant Health Agency
- Imperial College London
- Francis Crick Institute
- The Pirbright Institute
Avian Influenza Technical Group
The Avian Influenza Technical Group includes members with expertise in clinical infectious diseases, clinical research, epidemiology, genomics and virology:
- Meera Chand (Chair), UKHSA
- Wendy Barclay, Imperial College London
- Alexander Byrne, APHA
- Ashley Banyard, APHA
- Eileen Gallagher, UKHSA
- Ian Brown, APHA
- Neil Ferguson, Imperial College London
- Yper Hall, UKHSA
- Bassam Hallis, UKHSA
- Susan Hopkins, UKHSA
- Katja Hoschler, UKHSA
- Munir Iqbal, The Pirbright Institute
- Joe James, APHA
- Angie Lackenby, UKHSA
- Nicola Lewis, Francis Crick Institute
- Nicholas Loman, UKHSA / University of Birmingham
- Thomas Peacock, Imperial College London
- Richard Puleston, UKHSA
- Andrew Rambaut, University of Edinburgh
- Nick Watkins, UKHSA
- Maria Zambon, UKHSA
- Esther Robinson, UKHSA
- Alastair McGregor, UKHSA
- Andre Charlett, UKHSA
- Fergus Cumming, UKHSA
- Helen Roberts, DEFRA
- Oliver Pybus, Royal Veterinary College / University of Oxford
- Rowland Kao, University of Edinburgh
- Philip Veal, Health and Social Care Northern Ireland
Acknowledgements
The authors are grateful to those teams and groups providing data for these analyses including:
- Animal and Plant Health Agency
- Pirbright Institute
- Imperial College London