Artificial Intelligence sector study 2025 (web version)
Published 29 October 2026

© Crown copyright 2026
This publication is licensed under the terms of the Open Government Licence v3.0 except where otherwise stated. To view this licence, visit nationalarchives.gov.uk/doc/open-government-licence/version/3 or write to the Information Policy Team, The National Archives, Kew, London TW9 4DU, or email: psi@nationalarchives.gov.uk.
Where we have identified any third party copyright information you will need to obtain permission from the copyright holders concerned.
This publication is available at https://www.gov.uk/government/publications/artificial-intelligence-sector-study-2025/artificial-intelligence-sector-study-2025-web-version
Executive summary
This report provides findings regarding the size and scale and profile of private sector artificial intelligence (AI) business activity in the UK in 2025.
It is based on analysis of:
- secondary data
- a survey of 376 AI companies
- 50 in-depth interviews with AI businesses, academic and policy stakeholders, and investors
Headline sector metrics
- an estimated 130,400 people were employed in AI-related roles, an increase of 51% on 2024
- AI-related revenues increased by 41% to £33.6 billion, with revenues among dedicated AI companies almost doubling to £9.2 billion
- AI-related gross value added (GVA) increased by 58% to £18.6 billion, including a more than doubling of GVA among dedicated AI companies to £4.8 billion
Figure 1: headline sector metrics (2022 to 2025)
Employment (headcount)
| Year | Employment (change on previous year) |
|---|---|
| 2022 | 50,040 |
| 2023 | 64,539 (+29%) |
| 2024 | 86,139 (+33%) |
| 2025 | 130,403 (+51%) |
Revenue (£ billion)
| Year | Revenue £ billion (change on previous year) |
|---|---|
| 2022 | 10.6 |
| 2023 | 14.2 (+34%) |
| 2024 | 23.9 (+68%) |
| 2025 | 33.6 (+41%) |
GVA (£ billion)
| Year | GVA £ billion (change on previous year) |
|---|---|
| 2022 | 3.7 |
| 2023 | 5.8 (+57%) |
| 2024 | 11.8 (+103%) |
| 2025 | 18.6 (+58%) |
Registered AI firms (count)
| Year | Registered AI firms (change on previous year) |
|---|---|
| 2022 | 3,170 |
| 2023 | 3,713 (+17%) |
| 2024 | 5,862 (+58%) |
| 2025 | 10,488 (+79%) |
Source: Perspective Economics
Key findings
Market growth and scale
A total of 10,488 AI companies were identified, up 79% on 2024. While some of this increase reflected improved coverage and the growing prominence of AI in how companies describe their products and services, it is underpinned by genuine market expansion.
Approximately 1,750 new AI companies were incorporated in 2025 alone, and 186 large companies entered the scope of the study across a broader range of sectors than in previous years. The balance of the sector shifted towards dedicated AI companies (68%, up from 56% in 2024), pointing to a wave of small, AI-native market entrants and a ‘doubling down’ on AI as a core business driver.
Revenue, employment and GVA
The sector’s economic contribution grew strongly across all headline measures. AI-related revenues increased by 41% to £33.6 billion in 2025, with growth more balanced between companies that have AI products and services as their core focus, and those that have AI activity as part of a broader business offer (referred to as dedicated and diversified companies) than in previous years.
Dedicated company revenues almost doubled (from £4.9 billion to £9.2 billion), accounting for 44% of total revenue growth. An estimated 130,400 people were employed in AI-related roles (+51% compared to 2024), with companies identified in the 2024 study increasing AI-related headcount by 31% on a like-for-like basis.
AI-related GVA reached £18.6 billion (+58%). Large companies continued to generate the majority of AI-related revenue (82%), although the SME share rose from 15% to 18%.
Growth enablers and barriers
Despite notable increases in fundraising evidenced in this study, firms reported that access to capital remained the most significant constraint on growth. Access to equity investment was the barrier most commonly cited as significantly affecting businesses’ ability to meet their goals (61% of survey respondents).
The availability of scale-up funding was the factor most commonly expected to significantly affect future AI activity (57%), and the most commonly cited potential reason for relocating activity away from the UK. Competition for experienced AI talent, and visa and immigration barriers, remain prominent concerns.
Access to computing power became a more significant issue than in previous years. For example, 72% of surveyed businesses reported an increased compute requirement over the past 12 months (up from 66% of businesses in 2024).
91% of those using compute expect costs to rise, with energy costs and grid connections identified as the underlying constraints on UK AI infrastructure. Lack of regulatory clarity was cited as a significant barrier by 25% of businesses (up from 16% in 2024).
Funding and investment
Fundraising by dedicated AI companies more than doubled to £6.3 billion in 2025. Growth was driven at both ends of the investment market. Rounds of £100 million or more accounted for around 60% of 2025 investment value, with 2 companies accounting for almost half of all funds raised since the start of 2025, while record numbers of companies secured investment for the first time.
More than 1 in 4 dedicated AI companies raised external investment since 2020. Inward investment also strengthened, with 79 AI-related foreign direct investment (FDI) projects announced or opened in 2025, associated with an estimated $8.9 billion of capital investment and approximately 8,600 expected jobs.
However, qualitative evidence indicates a ‘bifurcated’ funding environment. Very large sums are reaching a small number of infrastructure and frontier companies, while many application-layer businesses report a much tougher fundraising climate.
Geographic distribution
AI activity remained concentrated in London, the South East, and the East of England, which together accounted for 72% of registered office locations. However, the sector’s operational footprint extends further across the UK’s nations and regions, with distinct regional specialisms evident (for example, life sciences in the East of England and autonomous systems in Scotland). Approximately 1 in 7 AI companies operated from more than one UK location.
The sector is increasingly international. 1,372 internationally headquartered AI companies now operate in the UK (13% of the total, of which 54% are US-headquartered), while more than 1 in 5 UK-headquartered AI companies maintains at least one overseas location, spanning 4,805 locations across 136 countries.
Strategic and geopolitical considerations
Interviewees continued to place the UK among the leading AI nations, in line with qualitative evidence from previous studies, but cited growing pressure from heavily investing states. Dependence on a small number of overseas (predominantly US) technology providers emerged as a key theme.
47% of surveyed businesses import AI products or services, and 38% of importers described themselves as entirely dependent on them. However, few interviewees advocated full self-sufficiency.
Instead, the prevailing view favoured diversification (including greater use of open-source models), securing the UK’s data assets, and targeted investment in sovereign capability, with AI model efficiency and specialised applications seen as the UK’s most practical competitive response.
Qualitative insights
The qualitative research provided additional depth on how AI businesses experienced the market conditions described elsewhere in the main report.
Interviews explored businesses’ views on:
- infrastructure and compute capacity
- procurement
- funding
- growth expectations
- competition
- sovereignty
- copyright
- energy costs
- future market scenarios
The findings should be taken as contextual evidence that helps explain the reasons behind business views, rather than as representative measures of the wider UK AI sector.
Across the interviews, businesses described a sector with strong innovation potential, but where growth depended on a set of interconnected market conditions.
These included:
- access to scale-up capital
- reliable and affordable compute
- experienced talent
- customer adoption
- regulatory clarity
- routes to commercial deployment
A recurring theme was the distinction between starting and scaling an AI business in the UK. The UK was viewed as a positive environment for founding AI companies, supported by strong research capability, entrepreneurial activity, and a growing pool of AI firms. However, businesses were more cautious about the UK’s ability to support later-stage growth.
Qualitative insight boxes like these throughout the report present findings from Ipsos qualitative interviews with 30 AI businesses. Findings reflect the views and experiences of participating businesses and are not intended to be representative of the wider UK AI sector or the views of the Department for Business, Innovation, Science and Trade (BIST) or the UK government.
Acknowledgements
The authors would like to thank members of the BIST team for their input throughout the study. BIST and the report authors would also like to thank all those who contributed to the research. This includes those who took part in strategic stakeholder interviews, responded to the business survey, or otherwise offered evidence and insights to the study.
1. Introduction
Perspective Economics, in collaboration with Beauhurst, Ipsos, and a consortium of advisors was commissioned in February 2026 to deliver an analysis of the UK’s artificial intelligence (AI) sector in 2025.
The aim of the study is to continue building a better understanding of the scale, profile and economic contribution of the UK’s AI sector by updating previous data compiled since 2022. This is to support the government’s ongoing development and monitoring of key AI policies.
In addition to providing updated economic data, this report offers insights from UK AI businesses and stakeholders regarding the ongoing opportunities, challenges, enablers, and barriers to the continued growth of AI activity in the UK.
1.1 Methodology and sources
This study forms part of the broader BIST evidence base on AI, building on similar studies conducted since 2022. The study has several overarching objectives as follows:
- Draw on a comprehensive range of data sources to identify and document UK AI companies.
- Conduct qualitative research to understand a range of issues including UK AI company collaboration, sector challenges, growth opportunities, and enablers.
- Produce AI sector demographics and economic estimates.
- Use qualitative and quantitative research findings to produce thematic analysis, including analysis of UK market dynamics and competition.
- Develop scenarios based on findings regarding UK market dynamics and competition and their implications for UK AI economic activity.
A list of research questions that informed the design of the study is available in the report appendices.
1.2 Approach
The study used a mixed methods approach, combining desk-based review, qualitative and quantitative research and analysis.
A multi-modal survey of AI firms was conducted by Ipsos in May 2026, returning 376 responses. A total of 50 in-depth interviews were completed with businesses (30), academic and policy stakeholders (10), and investors (10).
A majority of interviews were conducted between April and May 2026, with a small number completed in June according to stakeholder availability. A regional expert advisory panel was also convened to test emerging findings.
The baseline company dataset was reviewed and updated between March and June 2026, with the research team identifying, verifying, and enriching UK-registered firms with evidence of AI-related commercial activity.
In total, 10,488 unique active firms were included in the study, informing sector estimates for revenue, employment, and GVA.
The identification and analysis of firms followed 7 stages, set out in full in Appendix 4.
1. Desk research and data discovery
A review of AI-related literature, announcements, and investment activity (January 2025 to March 2026) to ground the analysis, update AI-related key terms, and identify new sources for review.
2. Initial longlisting
Identification of potentially relevant firms across a wide range of official, commercial, and web-based sources.
3. Taxonomy refinement
Workshops with BIST to test the study scope and definitions, and to update the AI taxonomy against market developments while maintaining comparability with previous studies.
4. Enrichment and verification
Automated and manual checks verifying each firm’s web presence, registered entity, and activity, with structured review of web content to evidence AI-related products and services, and removal of duplicates, dormant entities, and non-commercial organisations.
5. Survey and qualitative engagement
The Ipsos survey, in-depth stakeholder interviews, and regional expert advisory panel noted.
6. Final identification and shortlist
Final additions and verification checks (June 2026), including newly registered firms and firms coming out of ‘stealth’, resulting in the final study population.
7. Sectoral modelling
Estimation of AI-related employment, revenue, and GVA for each firm, using known accounts where available and conservative estimation for unknown values, aggregated for sector-level analysis.
Key data sources used in this iteration of the study are summarised in Table 1.1.
Table 1.1: key data sources
| Purpose | Sources |
|---|---|
| Company identification | 2024/25 AI baseline dataset; Web data;[footnote 1] Companies House;[footnote 2] Beauhurst;[footnote 3] Lightcast;[footnote 4] UK Research and Innovation (UKRI) Gateway to Research;[footnote 5] Financial Times fDi Markets;[footnote 6] HM Revenue and Customs (HMRC) Trade Info;[footnote 7] Tussell.[footnote 8] |
| Revenue, employment, GVA | Bureau van Dijk Financial Analysis Made Easy (FAME); Beauhurst; Lightcast; Web data; survey responses. |
| Investment | Beauhurst. |
| Business insights and perceptions | Survey of 376 AI firms (Ipsos, May 2026); 50 in-depth stakeholder interviews; regional expert advisory panel. |
1.3 Interpretation of data
Artificial intelligence activity in the UK is not defined by a formal Standard Industrial Classification (SIC) code. This study therefore uses experimental methods to identify and quantify AI activity across traditional economic sectors.
The approach and methodology are consistent with those employed to deliver analyses of the UK cyber security sector annually since 2018, and with the method used to create baseline evidence regarding the AI sector since 2022.
The data used to inform the study includes identification of AI firms according to a taxonomy developed and agreed with academic experts and BIST, applied using multiple corroborating sources. This includes review of websites, news, and official sources supported by large language models (LLMs), subject to manual validation and review throughout.
Enrichment of web data using open and proprietary data sources were also used to used to inform the study, including:
- Companies House (company name, registration number, locations, incorporation date)
- Bureau van Dijk FAME (revenue, employment, profitability, remuneration, research and development (R&D) spend)
- Beauhurst (external grants, fundraisings, accelerator attendance, M&A activity)
The estimates within this study are experimental in nature and do not constitute official statistics. All figures reflect a best estimate at a point in time (final checks were undertaken in June 2026).
Only a small proportion of firms file full detailed accounts with directly observable revenue and GVA. For the remainder, values are modelled using per-employee estimates applied to estimated AI-related employment, calibrated against anonymised survey responses and baseline data.
Estimates are therefore best used to indicate the broad size, scale, and composition of the sector, and to compare relative contributions across sub-sectors, regions, and firm sizes rather than as precise values, particularly at the level of individual firms.
Quality assurance was applied at each stage of the research, combining automated checks with manual review, with final decisions on ‘edge’ cases made by the research team using expert review, and with the study scope, taxonomy, and emerging findings reviewed with BIST and the regional expert advisory panel.
The full research methodology, including quality assurance and research limitations, is set out in Appendix 4.
1.4 Comparison to previous study
This study builds on the previous AI sectoral analyses.[footnote 9] It uses the same approach and methodology to identify AI companies and produce headline sector estimates of revenue, employment, and GVA.
As the sector continues to evolve, so do the analytical parameters used to produce lower-level analyses of the sector. The study team worked with BIST representatives and external experts to update the taxonomy used to categorise the sector. This has evolved from 3 key business models and 7 high-level capability domains to a more detailed multi-level framework within this iteration of the study. This year’s taxonomy is included in Section 2 of the report, with explanations regarding key changes.
The tools and language used to identify AI firms also continue to develop. We note that year-on-year changes reflect both ongoing methodological improvement and widening terminology, as well as genuine market growth, and comparisons over time should be interpreted accordingly (see Appendix 4).
The following updates have been made to the research methodology.
Updated study context
The study context has been updated to reflect market and policy developments since the previous report, informed by a desk-based review of AI-related literature, announcements, and investment activity covering January 2025 to March 2026 (see Stage 1).
Updated identification approach
The identification, enrichment, and classification of firms has been undertaken in-house by the research team, supporting greater consistency, quality assurance, and comparability with the previous baseline dataset.
Improved use of web data and classification approaches
The research team has continued to innovate and improve processes for capturing, triaging, and reviewing web data at scale, strengthening the evidence base used to assess each firm’s AI-related products and services.
Improved company tagging informed by multiple sources
All firms are tagged against the updated taxonomy using multiple corroborating sources (such as web content, company accounts, investment activity, and employment signals), rather than reliance upon any single source.
Improved source coverage
Additional sources have been incorporated within the longlisting process (inward investment, trade, public procurement, and publicly funded research data) to support the identification of relevant firms (see Stage 2).
Use of enhanced frontier models and agentic research tooling
The research team has continued to make use of leading LLMs and agentic web research tooling to support the review, verification, and classification of firms, subject to manual validation and quality review throughout. This enables analysis of company data at a rapid scale that would not be possible by human review alone, while preserving review and human-in-the-loop checks.
Automated and manual review in all stages
Automated checks are combined with manual review at each stage of the process, with final decisions regarding ‘edge’ cases undertaken by the research team using expert review.
Expanded survey and interview coverage
The study is supported by a survey of 376 AI firms and 50 in-depth stakeholder interviews, expanding the firm-level and qualitative evidence base relative to previous studies.
Regional expert advisory panel
A regional expert advisory panel was convened to test emerging findings, provide challenge regarding regional coverage and interpretation, and identify firms or initiatives for further consideration.
1.5 Further detail on method
The following sub-sections provide further information regarding the approach and methodology used to produce the study, including scoping and definitions, data sources and research limitations. It also provides a note about how the estimates provided in the study should be read and interpreted.
1.5.1 Scope and definitions
This study provides an estimate of the size and scale of AI activity in the UK, continuing the time-series analysis undertaken since 2022. AI activity is not captured by a SIC code, and the study therefore adopts an experimental approach, combining, analysing and estimating using a range of official, commercial, and web-based sources.
The analysis covers firms that:
- have a clear presence within the UK market, through a UK-registered business that reports to Companies House
- demonstrate an active provision of commercial activity related to AI (for example, via website or social media content)
- provide AI products or services to the market (for example, sell or enable the selling of AI products or services, rather than simply adopting AI tools)
- appear to be active at the time of writing – charities, universities, networks, and individual (non-registered) contractors are excluded
The study includes internationally headquartered firms with an evidenced UK trading presence. All economic estimates relate to UK activity only (for example, revenue reported within UK entities, UK-based employment, and GVA).
Firms are classified as dedicated (typically smaller, specialised AI-first companies) or diversified (typically larger companies with an AI offer alongside a broader business). For dedicated firms, all UK activity is included within sector estimates, and for diversified firms, only the estimated AI-related share is included in the sector estimates.
1.5.2 Data sources
The study draws upon multiple complementary sources.
Official and registry data
This includes:
- Companies House data and filed accounts (via Bureau van Dijk FAME), used to verify registered entities and to provide employment, revenue and GVA data
- HMRC Trade Info, providing a supporting signal of trading activity
- the UKRI Gateway to Research, identifying firms engaged in publicly funded AI-related research
Commercial data
This includes:
- Beauhurst, used to identify external investment raised (dedicated firms only)
- Lightcast and anonymised web profiles, used to identify AI-related employment and estimate the AI-related share of activity within diversified firms
- fDi Markets, identifying announced inward investment
- Tussell, identifying AI-related public procurement
Web data
Company websites and wider web content collated by Perspective Economics, used to identify firms, evidence their AI-related products and services, and classify each firm against the agreed taxonomy.
Primary research
A multi-modal survey of 376 AI firms (conducted by Ipsos, May 2026), used to understand firm-level performance and perceptions and to calibrate modelled estimates (for example, pre-revenue firms); and 50 in-depth interviews with stakeholders across industry, academia, government policy and investment.
In bringing these sources together, the research team combined a range of analytical tools (including LLMs) with manual review at each stage, with the evidence and rationale underpinning each classification recorded within the final dataset.
The approach and emerging findings were also reviewed with BIST and a regional expert advisory panel throughout. Further detail on quality assurance is set out in the methodology annex. We note this dataset and analysis have been developed for research purposes only.
1.5.3 Research limitations
Defining the AI sector
There is no single agreed definition of what constitutes the AI ‘sector’, and its boundaries are rightly contested. Identification relies on definitional scoping and review of web and trading data, and determination of AI firms in scope represents a best estimate by the research team against agreed parameters, rather than a definitive classification.
Further, the line between firms that develop value-adding AI products and services and those that adopt AI is increasingly difficult to draw, particularly among diversified firms. However, all firms have been reviewed with regard to evidence of providing an AI-related product or service to the market.
Comparisons over time
The tools and techniques used to identify and classify firms have improved considerably since the first analysis in 2022, while the language of AI as a technology and as a sector continues to broaden.
Year-on-year changes therefore reflect both ongoing methodological improvement and widening scope, as well as genuine market growth, and should be interpreted with that in mind. The research sets out time-series analysis accordingly.
Reliance on estimation
Where values are not available via filed accounts, revenue, GVA, and AI-related employment are estimated or modelled on a per-employee basis, with ‘conservative’ low-end estimates applied for unknown values (see methodology in full).
Interpretation of web data
Identification of products, services and capabilities is informed by review of descriptive web content, where the extent of a firm’s self-reported AI activity can vary. This has been subject to quality review.
Survey representativeness
Survey and interview findings rely upon voluntary engagement and may not fully represent the wider population of AI firms.
Point-in-time assessment
The study reflects a dynamic market, with final checks undertaken in June 2026. Many of the data sources (such as accounts) may vary in time reported but typically reflect the most recent year of trading.
A fuller statement of the research scope and limitations is set out in the methodology annex.
1.5.4 Reading the estimates
The estimates within this study are experimental in nature and do not constitute official statistics. All figures reflect a best estimate at a point in time (final checks were undertaken in June 2026), derived from multiple official, commercial, and web-based sources.
Only a small proportion of firms file full detailed accounts with directly observable revenue and GVA. For the remainder, values are modelled using conservative per-employee estimates applied to estimated AI-related employment, calibrated against anonymised survey responses (including pre-revenue firms).
Where activity cannot be reliably verified (for example, recently incorporated firms yet to file accounts), null values are applied rather than imputed estimates. Reported revenue and GVA figures should therefore be regarded as a conservative estimate of AI-related activity.
Estimates are best used to indicate the broad size, scale, and composition of the sector, and to compare relative contributions across sub-sectors, regions, and firm sizes rather than as precise values, particularly at the level of individual firms.
2. UK artificial intelligence sector profile
According to the Organisation for Economic Co-operation and Development (OECD), AI is “a transformative technology capable of tasks that typically require human-like intelligence, such as understanding language, recognising patterns, and making decisions.”[footnote 10]
In the UK, AI is used by innovative companies across sectors to solve problems and improve processes that affect millions of lives every day, for example:
- Google DeepMind is an AI research and development company that uses advanced machine learning to solve problems in healthcare, scientific research, digital transformation, and more
- Darktrace is a cyber security company that uses AI for real-time threat detection and response by recognising abnormal network patterns, providing a proactive approach to cyber resilience that keeps data, networks, and systems safe
- Wayve is developing general-purpose, self-learning driving intelligence for autonomous vehicles. Its embodied AI learns from data rather than relying on HD maps, allowing it to scale across new roads, cities, and vehicle types
- Synthesia is a leading AI video platform that lets businesses create professional videos from text using AI avatars and voices – no cameras, actors, or studios required – making video content creation scalable and affordable
- Isomorphic Labs applies frontier AI to drug discovery, using predictive and generative models to accelerate scientific breakthroughs to address major diseases
- Quantexa is a data, analytics and AI company whose decision intelligence platform unifies scattered data into a single trusted view, using explainable AI to power decisions in fraud, financial crime, and risk
- Luminance uses AI built by mathematicians to automate and enhance how businesses handle contracts, with automated legal agents now used by over 1,000 organisations across 70 countries
- Fractile is building chips, systems, and software to improve the speed and cost of running frontier AI inference via a new approach to fusing computation with memory
- Olix Computing is developing a new paradigm for AI compute infrastructure through its optical digital processor with a novel memory and interconnect architecture
This section explains how AI is defined for the purposes of the sectoral analysis, before providing key statistics regarding the profile of the AI sector in the UK.
Key takeaways
- 10,488 AI companies identified in the UK
- 79% increase in number of AI companies since previous study
- AI-driven opportunities increasingly relevant for companies of all sizes
2.1 Defining the UK artificial intelligence sector
Given that SIC codes do not yet include a specific ‘artificial intelligence’ classification, the analyses contained in this report are based on a business-focused taxonomy that can help to better understand AI business activity in the UK.
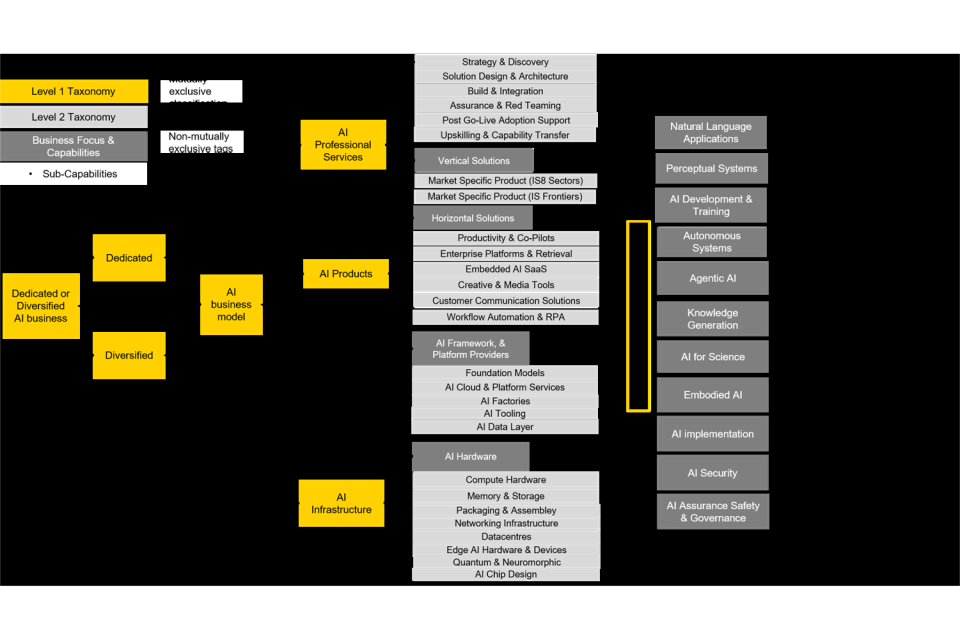
The taxonomy was drafted with input from the research team’s expert advisory panel, developed with input from BIST via an online workshop, and finalised following further review from the expert advisory panel. The final version of the taxonomy is illustrated in Figure 2.1.
Figure 2.1: UK AI taxonomy
Source: Perspective Economics
Salient points regarding the sector taxonomy include the following:
Classifications and tagging
The taxonomy includes a combination of mutually exclusive classifications (depicted by yellow boxes) and non-mutually exclusive tags. Each company therefore receives a single best-fit classification that depicts whether it is a dedicated or diversified AI company and what its primary business model is.
Beyond those classifications, each company is ‘tagged’ to denote more granular detail regarding, for example, business model segments and capabilities, which tend not to be mutually exclusive.
Dedicated vs diversified AI companies
At the highest level, the taxonomy segments the business population according to whether they are a dedicated AI company, or whether AI activity makes up a smaller proportion of a much broader commercial business offering.
Dedicated AI companies are businesses that provide a proprietary AI technical service, product, platform, or hardware as their primary revenue source. Diversified companies provide AI products or services as part of a broader business offer.
AI business model
At a lower level, the taxonomy segments between creators of strategic AI infrastructure,[footnote 11] developers of AI products,[footnote 12] and AI service providers.[footnote 13] Adopters of AI products or services developed by others are outside the scope of this study.
The distinction between using AI to produce a product or service (AI adoption) and building either foundational AI products and services, or AI products and services on top of the AI technologies of others (AI product or service development) has become increasingly difficult to define.
Consequently, in this year’s study, more web data was collated on in-scope companies, and processed using industry-leading language models to better understand and assess the product and service offer of companies included in the 2025 dataset.
AI capabilities
Capabilities, such as natural language processing (NLP) or computer vision and image processing, apply across business models, and an AI business may have more than one capability. Core capabilities were updated following a taxonomy workshop comprising industry and academic experts and policy representatives.
Changes include:
- further disaggregation of capabilities to reflect increasing specialisation in the market for AI products and services
- grouping of unique AI capabilities into a new set of higher-level categories
Further segmentations are applied, including but not limited to:
- segmentation of AI products according to whether they have been built for a specific industry (for example life sciences, finance, or creative) or offer more general tools used across sectors (such as customer service, workforce, and enterprise applications)
- segmentation according to the core AI capability within each company such as language and text, image and speech recognition, agentic and autonomous systems, scientific applications, and AI safety, security, and governance
- alignment to the sectors and markets served and to broader themes that cut across the whole dataset, including classification into the 8 high-growth Industrial Strategy sectors (IS8)
2.2 Number of AI companies
A total of 10,488 firms were identified within the scope of this study, an increase of 79% from 5,862 firms in 2024. This includes 4,580 firms in the 2024 study that remain active and in scope, and 5,908 firms brought into the study dataset.
Newly identified firms include those newly registered with Companies House (2,159), and existing firms that have been identified based on the way they describe their activity online and/or their recent inclusion in one of the wider study datasets. For example, via UKRI due to an AI-related research project, or via Tussell due to an AI-related public procurement contract.
2.3 Size profile
The size profile of AI companies in this iteration of the study remained largely consistent with previous years. Ninety-six percent of companies identified in 2025 were SMEs (2024 = 95%, 2023 = 96%) and 4% were large companies (2024 = 5%, 2023 = 4%, Figure 2.2).
A total of 186 large firms entered the scope of the analysis due to a combination of new AI service provision, and how companies are now communicating their product offer (for example, more common reference to AI, 2024, 165 additional large firms).[footnote 14]
Figure 2.2: AI size profile
| Size | Share of AI companies |
|---|---|
| Micro | 74% (7,806) |
| Small | 15% (1,573) |
| Medium | 6% (648) |
| Large | 4% (461) |
Source: Perspective Economics (percentages do not sum due to rounding)[footnote 15]
In the 2024 study, additional large-sized firms fell predominantly within the Information Technology and Professional Services sectors (77%, 126). This year, two-thirds of the additional large-sized companies were within 5 sectors including Information Technology, Financial Services, Security, Entertainment, and Aerospace (67%, 125).
Inclusion of additional large-sized firms across a wider range of sectors in this year’s study may indicate that AI-related opportunities are seen as increasingly relevant for a broader base of large companies.
Examples of large-sized companies entering the scope of the study this year due to increased prominence of AI activity in web content include:
- ServiceNow (enterprise AI workflow provider)[footnote 16]
- S&P Global (financial intelligence provider[footnote 17]
- Schneider Electric (data centre energy management and automation)[footnote 18]
Comparison to wider business population estimates in Table 2.1 suggests that the AI sector has a smaller share of micro businesses than the general UK business population. Comparison to the 2024 study shows that the share of micro businesses increased by a further 4 percentage points (pp) (2024 study +10pp), while the share of small and medium sized companies is around 3pp lower.
Table 2.1: AI size profile comparison
| Size | UK business population estimates (2025) | Percentage | AI sectoral analysis number 2025 (2024) | AI sectoral analysis percentage 2025 (2024) |
|---|---|---|---|---|
| Large (over 250 employees) | 8,335 | 1% | 461 (320) | 4% (5%) |
| Medium (50 to 249) | 38,435 | 3% | 648 (532) | 6% (9%) |
| Small (10 to 49) | 220,085 | 15% | 1,573 (896) | 15% (15%) |
| Micro (1 to 9) | 1,150,875 | 81% | 7,806 (4,114) | 74% (70%) |
| All Employers | 1,417,730 | 100% | 10,488 (5,862) | 100% |
Source: BIST,[footnote 19] Perspective Economics (totals may not sum due to rounding)
2.4 Dedicated and diversified AI companies
Of the 10,488 active companies identified through the study, 68% were dedicated and 32% were diversified (2024 = 56% and 44% respectively).
Having previously increased year-on-year, the share of diversified companies fell, suggesting greater emphasis on AI products and services within descriptive information, and pointing to a potential ‘doubling down’ on AI as a business driver (Figure 2.3).
Figure 2.3: dedicated vs diversified companies over time
| Year | Dedicated | Diversified | Total |
|---|---|---|---|
| 2022 | 60% (1,909) | 40% (1,261) | 100% |
| 2023 | 59% (2,204) | 41% (1,509) | 100% |
| 2024 | 56% (3,292) | 44% (2,570) | 100% |
| 2025 | 68% (7,172) | 32% (3,316) | 100% |
Source: Perspective Economics
Figure 2.4 shows how the population of firms identified within this year’s study grew, with the increase concentrated among micro, dedicated companies (reflected in a 15pp rise in the dedicated share of micro firms).
This points to a wave of small, AI-native market entrants, and is confirmed by the fact that a total of more than 1,700 dedicated AI companies (within the scope of this study parameters) were incorporated in 2025 (1,707).[footnote 20]
At the same time, diversified shares continued to rise across the medium and large size bands (+10pp and +1pp respectively), indicating that AI-related products and services continued to be an increasing focus among established, diversified businesses.
Figure 2.4: dedicated vs diversified companies by size
| Size | Dedicated | Diversified | Total |
|---|---|---|---|
| Micro | 81% (6,290) | 19% (1,516) | 100% |
| Small | 45% (715) | 55% (858) | 100% |
| Medium | 22% (140) | 78% (508) | 100% |
| Large | 6% (27) | 94% (434) | 100% |
Change since 2024: micro dedicated share +15pp, small dedicated share +2pp, medium diversified share +10pp, large diversified share +1pp.
Source: Perspective Economics
2.5 AI company incorporations
Since the AI sector study was first published in 2022, the number of AI company incorporations continued to increase, reaching around 1,750 new registrations across both dedicated and diversified segments in 2025 (Figure 2.5, 1,752).[footnote 21]
While some of this recent increase reflected improved coverage of newly registered firms in this year’s study, it does also continue to point to a vibrant AI start-up ecosystem.
The acceleration coincided with the rapid mainstreaming of generative AI tools from late 2022 onwards, and with a succession of policy milestones over the period, including the AI Sector Deal,[footnote 22] the National AI Strategy,[footnote 23] and most recently the AI Opportunities Action Plan.[footnote 24]
Approximately 7% of all dedicated new company incorporations since 2011 were by internationally headquartered firms (380 of 5,429 dedicated AI companies incorporated since 2011).
Figure 2.5: AI company incorporations
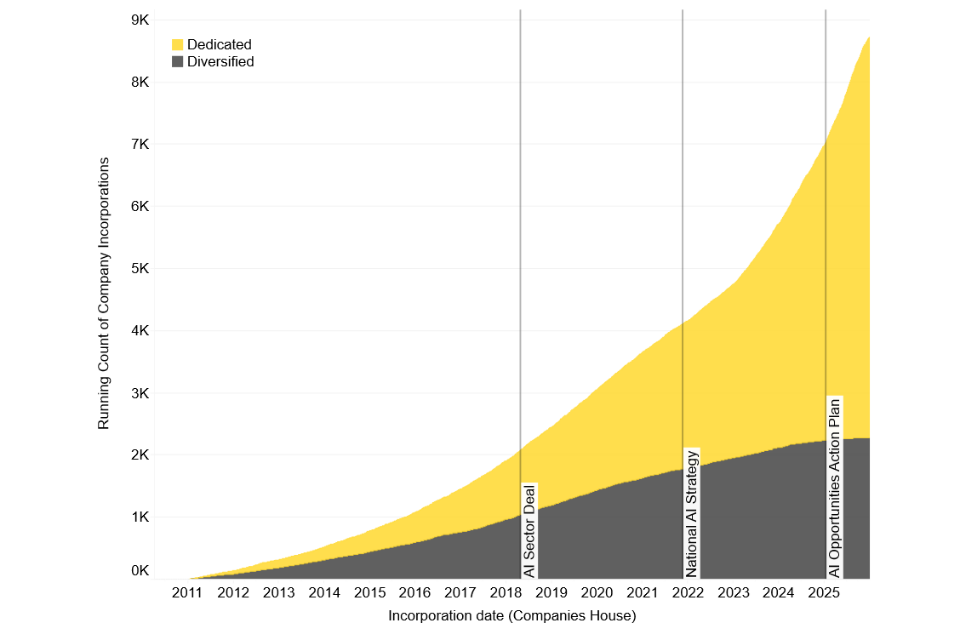
Source: Companies House (2011 to 2025, 6,991 incorporations since 2011)
Of the 3,292 dedicated companies from the previous study, 88% (2,907) remained active at the time of writing and 12% (385) had changed status.
Of those that had changed status, 74% (285) were dissolved, 13% (51) were in liquidation and 13% (49) were in administration, default, or receivership.
93% of companies with changed status were micro entities (353), 5% were small-sized and 2% were medium-sized companies (20 and 8 respectively).
2.6 AI business models
Previous iterations of the study discussed the balance between AI product and AI service-oriented companies, finding that the UK AI sector has been largely product-driven over time, with an uptick in AI service provision in 2023 and 2024.
This year’s study sets out a more detailed breakdown of business models among dedicated AI companies (Figure 2.6). Most dedicated AI companies remain focused on developing AI products (79%, 5,672). A further 5% provide AI frameworks, software, and platforms (349), and 1% (81) produce AI hardware. The remaining 15% primarily offer AI-related services (1,070).
Taken together, this shows a dedicated AI company base that remained strongly oriented towards products, alongside a smaller services segment, and a small number of firms supplying the frameworks, platforms, and hardware that underpin the wider sector.
Figure 2.6: AI business models (dedicated companies only)
| Business model | Share of dedicated AI companies |
|---|---|
| AI products | 79% (5,672) |
| AI services | 15% (1,070) |
| AI frameworks, software and platforms | 5% (349) |
| AI hardware | 1% (81) |
Source: Perspective Economics
2.7 AI capabilities
Figure 2.7 shows the proportion of dedicated businesses with each of the following capabilities.[footnote 25]
- Natural language applications
- Perceptual systems
- AI development and training
- Autonomous systems
- Embodied AI
- Agentic AI
- Knowledge generation
- AI implementation
- AI security
- AI assurance, safety and governance
- AI for science
The most common capability, natural language applications, is present in a majority of dedicated companies (84%), reflecting the central role of LLMs and generative AI across the sector.
Beyond this, a majority of companies are developing or applying AI implementation capabilities (58%) and perceptual systems (57%), for example, computer vision and image processing, speech and audio processing, multi-modal integration, and anomaly / signal detection.
Approximately half are tagged as having agentic AI capability (53% – ahead of more established areas such as AI development and training), reflective of how quickly agentic approaches moved into the mainstream of AI development.
There is also a substantial base of dedicated firms with AI assurance, safety and governance capabilities (35%), covering model evaluation, assurance, and governance tooling.
Smaller proportions are primarily involved in more specialised capabilities: autonomous systems (9%), AI for science (7%), embodied AI (6%), and AI security (3%).
Figure 2.7: AI capabilities (high-level domains)
| Capability | Share of dedicated AI companies |
|---|---|
| Natural language applications | 84% |
| AI implementation | 58% |
| Perceptual systems | 57% |
| Agentic AI | 53% |
| AI development and training | 45% |
| Knowledge generation | 39% |
| AI assurance, safety and governance | 35% |
| Autonomous systems | 9% |
| AI for science | 7% |
| Embodied AI | 6% |
| AI security | 3% |
Source: Perspective Economics
The study subsequently applied tailored LLM-enabled scripts to tag each company based on whether detailed web data evidenced the development or use of lower-level technologies.
Results of that tagging process provide a more granular illustration of AI capabilities present within AI companies in the UK and are provided in the report appendices.
3. Economic contribution of UK AI companies
This section presents updated estimates of the economic profile and contribution of AI companies to the UK economy in 2025. Findings draw on modelled data based on reported company data (where available) and survey responses.
Key takeaways
Since 2024, there was:
- a 41% increase in AI-related revenues to £33.6 billion
- an increase in dedicated AI revenues, which accounted for 44% of total growth (+£4.3 billion)
- a 51% increase in AI-related employment (around 130,400 people)
- a 58% increase in total AI-related GVA to £18.6 billion
- an approximate doubling of GVA among dedicated AI companies to £4.8 billion
3.1 Estimated revenue
In 2025, total estimated AI revenue increased to £33.6 billion (+£9.7 billion, +41%), of which approximately 60% was attributable to incumbent firms and 40% was generated by new market entrants. This included newly incorporated firms and firms that have entered the scope of the study due to increased prominence of AI activity.
Dedicated company revenues almost doubled, from £4.9 billion in 2024 to £9.2 billion in 2025 (+£4.3 billion).
Compared to previous years, revenue growth was more balanced between dedicated and diversified companies, with the increase in dedicated company revenues accounting for approximately 44% of this year’s increase (compared with just 4% of the increase in 2024).
Growth was driven by organic expansion among UK-owned, applied-AI firms selling into regulated enterprise (fraud, financial crime, compliance, credit, and insurance) such as Cleo, Quantexa, LoopMe, Featurespace, and ComplyAdvantage. This was together with newly scaled and newly in-scope large companies that made smaller contributions in prior years, including NScale, Isomorphic Labs, OpenAI, and Wayve.
A significant share of dedicated revenue continued to sit with UK arms of internationally headquartered firms (for example, Google DeepMind, Databricks, Palantir, NVIDIA, and Snowflake).
Table 3.1: revenue estimates
| Type | 2022 | 2023 | 2024 | 2025 |
|---|---|---|---|---|
| Dedicated | £5.2 billion (49%) | £4.5 billion (32%) | £4.9 billion (21%) | £9.2 billion (27%) |
| Diversified | £5.4 billion (51%) | £9.7 billion (68%) | £19.0 billion (79%) | £24.5 billion (73%) |
| Total | £10.6 billion | £14.2 billion | £23.9 billion | £33.6 billion |
Source: Perspective Economics
3.1.1 Revenue by company size
82% of AI-related revenues (£27.6 billion) were generated by large firms, which made up around 4% of all companies identified.[footnote 26] The percentage of AI-related revenues among SMEs increased from 15% last year (£3.5 billion) to 18% this year (£6.0 billion) – a higher proportional increase suggesting that SMEs are finding opportunities in domestic and/or international markets (see Section 6.3 on international trade).
Figure 3.1: revenue estimates by firm size
| Size | Estimated AI revenue £ billion (share of total) |
|---|---|
| Large | 27.6 (82%) |
| Medium | 2.9 (9%) |
| Small | 2.5 (8%) |
| Micro | 0.6 (2%) |
Source: Perspective Economics (totals do not sum due to rounding)
3.2 Estimated employment
In 2025, an estimated 130,400 people were employed in AI-related roles within the 10,488 companies identified – an increase of 51% on the 2024 figure.
While some of this increase is likely the result of changes in how roles are described (for example, roles that referenced data or software may now be positioned as AI-related roles), it nevertheless offers a strong signal of the increasing significance of AI-related employment in the economy.
Companies with identified AI-related employment in the 2024 study increased headcount from around 81,000 to around 106,000 (+31%). As such, total AI-related employment growth came from both increases within the previously known base of firms, and from new firms, or firms entering the study’s scope and building AI teams.
39% of employment was within dedicated AI companies (36%, 2024) and 61% is within diversified companies (64%, 2024) (50,942 and 79,461 respectively). Table 3.2 provides a summary of headline revenue and employment figures compared to 2022, 2023 and 2024.
Table 3.2: economic estimates
| Metric | 2022 | 2023 | 2024 | 2025 |
|---|---|---|---|---|
| Revenue | £10.6 billion | £14.2 billion | £23.9 billion | £33.6 billion |
| Employment | 50,040 | 64,539 | 86,139 | 130,403 |
| GVA | £3.7 billion | £5.8 billion | £11.8 billion | £18.6 billion |
| Revenue change (%) | 34% | 68% | 41% | |
| Employment change (%) | 29% | 33% | 51% | |
| GVA change (%) | 57% | 103% | 58% |
Source: Perspective Economics
3.3 Estimated gross value added
Combined AI-related GVA (across dedicated and diversified firms) in 2025 was estimated to have reached £18.6 billion (+58%). Dedicated company GVA more than doubled within the past year, from £2.2 billion in 2024 to £4.8 billion in 2025, and accounted for more than a quarter of total GVA (26%).
While part of this increase reflected improved coverage and classification, underlying growth was strong. On a like-for-like basis (based on dedicated companies present in both years), GVA rose by 85% (from £2.17 billion to £4.02 billion). Figure 3.2 provides a breakdown of 2025 GVA across dedicated AI firms of different sizes.
Figure 3.2: dedicated company GVA by size
| Size | Estimated AI-related GVA (£ million) |
|---|---|
| Large | 3,116.4 |
| Medium | 726.9 |
| Small | 454.8 |
| Micro | 503.6 |
Average GVA per company: large £60 million, medium £4.4 million, small £1.6 million, micro £78,000.
Source: Perspective Economics
3.4 Summary of economic contribution
AI-related revenues increased by 41% between 2024 and 2025 to £33.6 billion. Increases in dedicated AI company revenues accounted for more than two fifths of total revenue growth (44%, +£4.3 billion).
More than 130,000 people were employed in AI-related roles (+51% on 2024), and AI-related GVA increased by 58% to £18.6 billion, including an approximate doubling of GVA among dedicated AI companies to £4.8 billion.
Qualitative insights
Qualitative interviews supported the view that the UK remained a strong environment for AI company creation. Businesses pointed to the UK’s research base, technical talent, entrepreneurial activity, and strengths in applied AI as important features of the ecosystem. The democratisation of AI tools was also seen as lowering barriers to entry, enabling new firms to build products and services on top of existing models and cloud infrastructure.
However, businesses also described a sector whose structure was increasingly shaped by dependency on a small number of international technology providers. Many AI businesses were not developing foundational models or core infrastructure themselves, but were building AI applications, services, and sector-specific products on top of models, cloud platforms and compute services supplied by major international firms.
A prevalent theme was that the UK’s strongest opportunities lay in applied AI rather than in competing directly with the USA or China on frontier model development. Interviewees identified areas such as fintech, life sciences, cyber security, professional services, AI assurance, and sector-specific AI applications as more realistic sources of UK competitive advantage.
A lot of companies are investing heavily in AI. Unfortunately, the thing of actually having decent data on which to build is again being forgotten.
Small AI business
4. Investment
This section provides findings from analysis of the fundraising activity of UK AI companies included in the study. It draws on investment data up to the end of 2025 from the Beauhurst platform.
Beauhurst tracks announced and unannounced equity investments in high-growth UK companies. While the Beauhurst methodology is designed to capture a complete and accurate picture of equity investment in UK private companies, certain limitations exist.
‘Stealth’ deals, where neither public disclosures nor prompt statutory filings occur, may not be captured immediately, resulting in potential underreporting of such transactions. This section also draws on findings from qualitative interviews with AI businesses, academic and policy stakeholders, and AI investors, and relevant AI business survey responses to provide a more holistic view of the UK AI investment landscape.[footnote 27]
Key takeaways
- fundraising by dedicated AI companies more than doubled to £6.3 billion in 2025
- more than 1 in 4 dedicated AI companies have successfully secured external investment since 2020
- a record number of dedicated AI companies at venture and growth stages secured funding in 2025
- growth-stage rounds accounted for 57% of total investment value in 2025
4.1 AI investment headlines
Having reached a new high of £2.9 billion in 2024, fundraising by dedicated AI companies more than doubled to £6.3 billion across 917 deals in 2025 (Figure 4.1). Momentum built throughout the year, with more than two-thirds of the total raised in the second half, and £2.7 billion raised in the final quarter, making it the strongest quarter on record.
Figure 4.1: total annual fundraising (dedicated companies only)
Amount raised (£ billion)
| Year | Amount raised (£ billion) |
|---|---|
| 2020 | 1.3 |
| 2021 | 1.5 |
| 2022 | 1.9 |
| 2023 | 1.4 |
| 2024 | 2.9 |
| 2025 | 6.3 |
Number of fundraisings
| Year | Number of fundraisings |
|---|---|
| 2020 | 374 |
| 2021 | 513 |
| 2022 | 560 |
| 2023 | 597 |
| 2024 | 768 |
| 2025 | 917 |
Source: Beauhurst (2020 to 2025)
Growth in AI fundraising was driven by a combination of small numbers of very large deals at one end, and record numbers of new companies raising money for the first time at the other.
In terms of large deals, rounds of £100 million or more accounted for approximately 60% of total investment value in 2025. Two companies (NScale and Isomorphic Labs) accounted for almost half of all funds raised during the year. At the other end of the market, almost half of all deals in 2025 were first-time fundraisings (49.5%), rising from approximately one-third of deals between 2021 and 2023, and 44% in 2024.
These first-time deals are typically small, so while deal activity continues to broaden, aggregate AI investment values remain sensitive to the fundraising activity of a small number of large companies.
More than 1,800 dedicated AI companies successfully raised funds between 2020 and 2025 – more than 1 in every 4 (1,835 of 7,172). Of these, 1,454 secured external investment for the first time (79%), offering another signal of a vibrant start-up ecosystem.
Figure 4.2: quarterly fundraising (dedicated companies only)
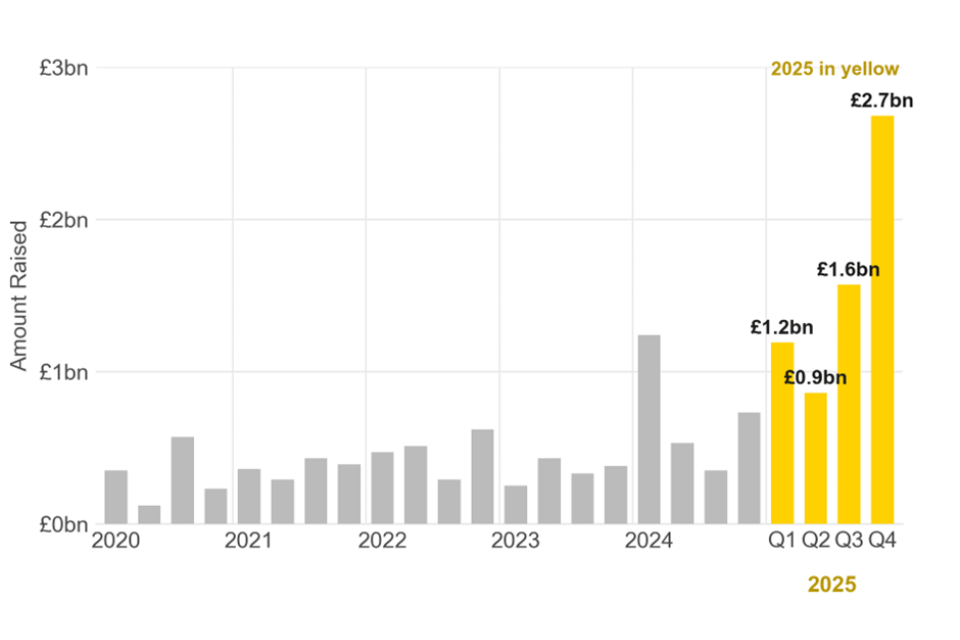
Source: Beauhurst (2020 to 2025)
International investors continued to dominate the largest fundraisings. NVIDIA (both directly and via its venture arm NVentures) participated in 14 rounds worth £3.9 billion since 2023, including NScale, Wayve, and PhysicsX. NScale’s fundraisings in late 2025 included a global corporate and financial consortium including Dell, Nokia, Lenovo and Aker, Google, SoftBank and Microsoft.
MMC Ventures was once again the largest UK-based contributor by value, having participated in 31 rounds worth £659m, followed by AlbionVC (29 rounds, £496 million). British Business Bank Investments was the second most frequent investor overall (49 fundraisings).
British Business Bank vehicles[footnote 28] participated in 45 dedicated AI fundraisings in 2025. This equates to approximately a fifth of all deals in 2025, and more than double the number of deals in any previous year. British Business Bank Investments was involved in the largest number of deals (34), supplemented by regional funds.
NScale secured the highest level of investment in 2025 (£2.5 billion across 3 rounds), followed by Isomorphic Labs (£464 million). Between 2020 and 2025, NScale, Wayve, Isomorphic Labs, and Synthesia secured the highest levels of investment.
4.2 Investment by stage of evolution
Defining stages of evolution
Businesses seeking investment can be classified into stages of evolution:
- seed
- venture
- growth
- established
Seed-stage companies are typically young start-ups with low employment, valuations, and total equity investment, often still proving product-market fit.
Venture-stage companies have developed their business model and technology over multiple years, with valuations in the millions and strong, growing revenues.
Growth-stage companies have typically been trading for more than 5 years, operate from multiple locations, and have substantial revenues and a large, growing headcount.
Established companies have been trading for over 15 years, or for 5 to 15 years with a sustained track record of significant profit (over £5 million) or turnover (over £20 million).[footnote 29]
The proportion of investment-raising firms at different stages of evolution (Figure 4.3) emphasises a strong start-up landscape. Two-thirds of the dedicated AI companies raising investment in 2025 were seed-stage businesses (66%, up from 65% in 2024 and 56% in 2023), driven by record numbers of newly formed companies securing initial investments.
Figure 4.3: stage of evolution (dedicated companies only)
| Year | Seed (start-up) | Venture (multi-year trading) | Growth (over 5 years trading) | Established (over 15 years trading) |
|---|---|---|---|---|
| 2020 | 210 (61.8%) | 105 (30.9%) | 24 (7.1%) | 3 (0.9%) |
| 2021 | 252 (57.5%) | 166 (37.9%) | 28 (6.4%) | 4 (0.9%) |
| 2022 | 278 (54.9%) | 178 (35.2%) | 48 (9.5%) | 7 (1.4%) |
| 2023 | 302 (55.9%) | 202 (37.4%) | 36 (6.7%) | 7 (1.3%) |
| 2024 | 477 (65.0%) | 214 (29.2%) | 40 (5.4%) | 9 (1.2%) |
| 2025 | 575 (66.2%) | 239 (27.5%) | 53 (6.1%) | 8 (0.9%) |
Values show the number of dedicated AI companies completing fundraising at each stage (and the share of that year’s total).
Source: Beauhurst (2020 to 2025)[footnote 30]
The absolute number of fundraising companies at venture and growth stages reached a record 292 companies in 2025, up 15% on 2024, and growth-stage rounds accounted for 57% of all investment value in 2025.
4.3 Investment by sector and capability
Beyond the core information technology sector, dedicated AI companies in transport, life sciences, and financial services attracted most investment since 2020. The largest sector totals reflect a small number of very large fundraisings, including Wayve (automotive and transportation) and CuspAI (research and development).
Deal activity was broadest in healthcare and financial services, which together accounted for over 800 fundraisings between 2020 and 2025.
Figure 4.4: investment by sector (dedicated companies only)
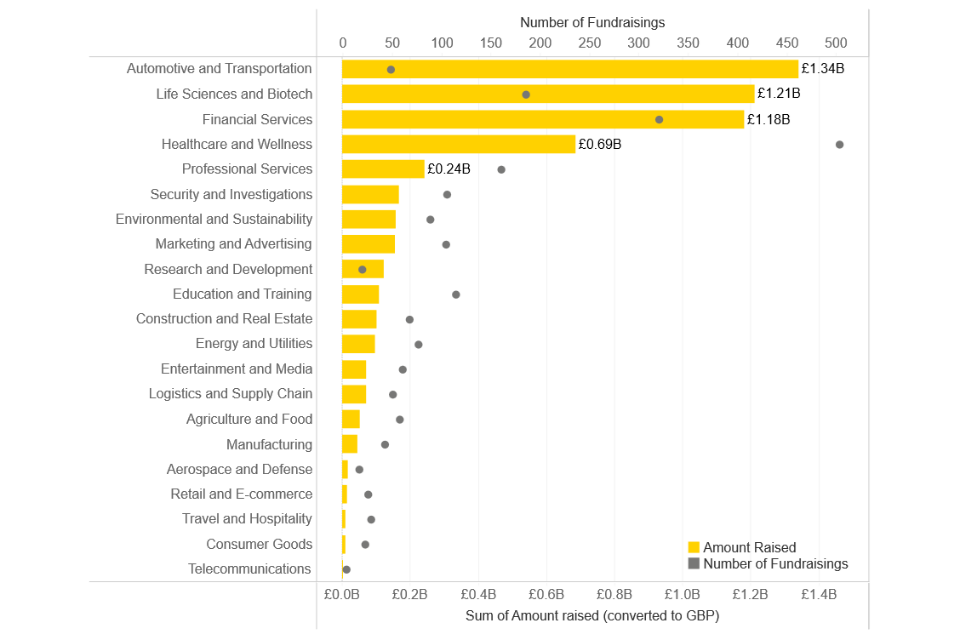
Source: Beauhurst (2020 to 2025)
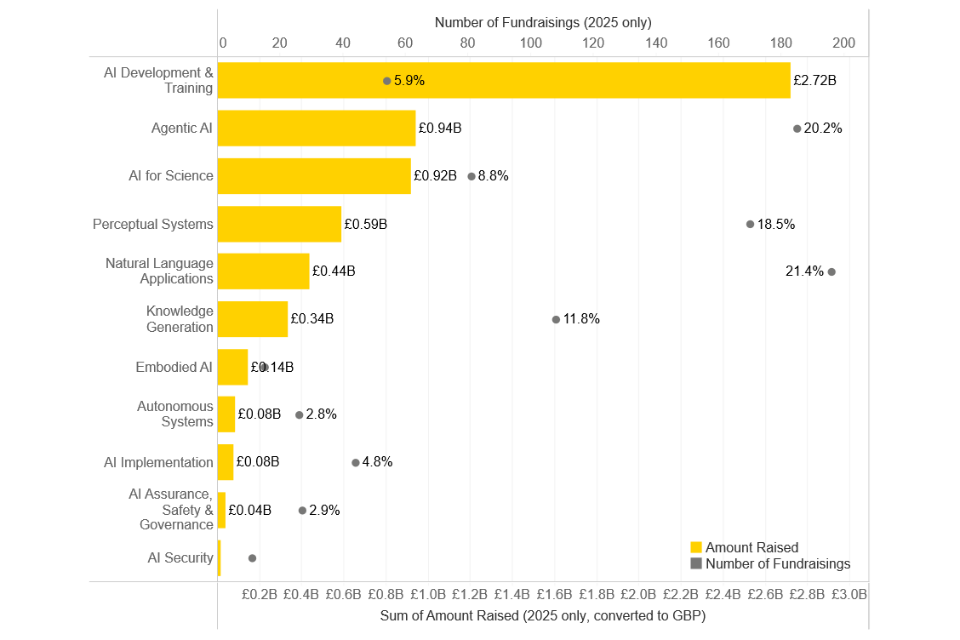
Analysis of investment by capability shows that deal volumes were concentrated in applied, language and perception-based capabilities. Natural language applications, agentic AI and perceptual systems accounted for approximately 60% of deals in 2025 (21%, 20% and 19% of 2025 fundraisings respectively), reflecting the wave of start-ups building applications on top of large language and multi-modal models.
However, the largest investment values in 2025 were directed towards AI development and training*(the capability group containing AI infrastructure and foundation-model companies), which attracted 43% of the total 2025 investment value in just 6% of deals.
AI for science is a fast-emerging investment target. Having never exceeded £300 million in investment in any year before 2025, companies such as Isomorphic Labs (drug discovery), CuspAI (materials), and PhysicsX (engineering simulation) raised £918 million in 2025. Note that aggregate deal values can be driven by a small number of large deals.
Figure 4.5: investment by capability (dedicated companies only)
Source: Beauhurst
4.4 Foreign direct investment
An introduction to FDI data
Each year the study collates inward investment data from fDi Markets, the Financial Times’ database of announced cross-border greenfield investment projects to understand the potential scale and focus of AI-related inward investment.[footnote 31]
The data includes capital investment and jobs figures as announced by the investing company where available. Otherwise, fDi Markets estimates capital investment and jobs based on typical jobs-to-investment ratios for comparable projects in the same country, sector, and activity.
Projects are initially recorded as ‘announced’ and are reclassified to ‘opened’ when a physical presence is publicly confirmed. fDi Markets undertakes additional verification of projects over $1 billion at the start of each calendar year.
Between 2019 and 2024, there were a total of 251 AI-related inward investment deals into the UK (announced or opened). In 2025 there were 79 additional inward investment projects (announced or opened) into the UK – almost one-third of all AI-related projects between 2019 and 2024.
fDi Markets estimates that these projects could create approximately 8,600 jobs, backed by around $8.9 billion of capital investment.[footnote 32] At the time of writing, 35 of these projects were recorded as being opened and 44 as announced. Opened projects represented $0.6 billion in capital investment and were expected to create 2,400 jobs.
The largest of these committed investments included Vantage Data Centers’ London campus,[footnote 33] Kyndryl’s technology hub in Liverpool, and Luma AI’s new London office.[footnote 34]
As is the pattern in private investment discussed previously, FDI was also heavily concentrated. The 5 largest FDI projects in 2025 (either announced or opened) accounted for roughly 85% of all recorded capital.
A single announced project (a $5 billion pledge by Oracle to expand its infrastructure and AI services over 5 years)[footnote 35] represented over half of total capital investment and more than 25% of all anticipated jobs. In September 2025, CoreWeave announced an around £1.5 billion investment in expanding its AI data centre capacity in the UK.[footnote 36]
Beyond these 2 substantive announcements, there were a number of communications and data centre projects announced in 2025, including but not limited to:
- Microsoft in Leeds
- Google at Waltham Cross
- Metrobloks in Manchester
- Vantage Data Centers in London
- Nebius
Outside of these infrastructure investments, FDI projects are more modest, with median capital investment of around $6.6 million and 50 jobs created. One-third of all projects are small software investments that represent initial UK footprints, including companies such as OmiSoft (Estonia, custom AI and Web3 development), Aimpoint Digital (US, enterprise AI platforms), and VTX365 (Brazil, AI Agent Builder).
Activity was strongly concentrated in London and the South East, which together accounted for 46 of the 79 projects (58% of projects in 2025) and approximately 2,400 expected jobs (28% of total jobs connected to 2025 FDI projects). A further 40% of expected jobs related to projects whose UK location was not yet specified.
Among projects with a known location, activity outside of London included:
- North West: 6 projects (Manchester and Liverpool), including Kyndryl’s investment in Liverpool[footnote 37]
- West Midlands: 3 projects (Birmingham and Solihull) including a first UK office for Alchemyst AI[footnote 38]
- East of England: 2 projects, including GoogleÕs data centre in Hertfordshire[footnote 39]
- Yorkshire and the Humber: 2 projects in Leeds (Microsoft[footnote 40] and Mastek[footnote 41])
- South West, East Midlands, and North East: 1 project each including Helsing in Plymouth, Atos in Nottingham, and Version 1 in Newcastle
- Devolved nations: Scotland x1 (Version 1), Wales x2 (Supreme Group and Cadence), and Northern Ireland x1 (Version 1)
By source country, the United States accounted for 44% of 2025 projects (35), ahead of Ireland (11), India (7), and Germany (6).
4.5 Sector perspectives on funding and investment
Analysis of investment data shows that AI funding and investment reached record levels in 2025. However, headline growth was driven by a small number of very large deals, and qualitative evidence from the survey and interviews suggests that these ‘mega-rounds’ may mask a much tougher fundraising environment for the broader base of UK AI businesses.
Investor interviews suggest that capital is “weirdly concentrated”, and that mega-rounds “can skew the picture.” One investor estimated that around three-quarters of the companies they engage with are struggling to raise in a “bifurcated” market.
Survey data corroborated these assertions, with 61% of respondents citing access to equity investment (post-seed angel or VC) as significantly affecting their ability to meet business goals (228, base = 376). A further 35% cited access to other external finance such as loans or guarantees as a barrier to business growth (131, base = 376).
Qualitative insights
Qualitative interviews suggested that businesses viewed the UK as a strong environment for starting AI companies, but a more challenging environment in which to scale them.
While early-stage funding and start-up support were viewed as relatively accessible, businesses described a scale-up gap once companies needed larger amounts of capital to:
- commercialise
- expand their teams
- meet compute costs
- build sustainable routes to market
A recurring perception was that UK investors were more conservative than their US counterparts, placing greater emphasis on proven revenue, commercial traction, and shorter-term performance.
Some businesses felt this led to lower valuations in the UK than in the USA, making it harder for UK firms to compete with better-funded international rivals or to remain headquartered in the UK as they grew.
Public funding was valued, but application processes were described as burdensome, highly competitive, and administratively intensive. R&D tax credits were viewed more positively as a simpler and more reliable mechanism, albeit one that provided retrospective rather than upfront support.
You have to go through so much process even to get a basic £30,000 to £40,000 worth of funding. And the amount of time that you spend doing it and what you get out of it, it’s just too much trouble.
Small AI business
5. Location of UK AI companies
Understanding the location of AI activity helps to identify and better understand notable clusters and regional strengths to inform policy making. This section presents findings regarding the location of AI companies identified in this iteration of the study and draws comparisons with findings in 2024.
Key takeaways
- London, the South East, and the East of England accounted for 72% of registered office locations
- approximately 1 in 7 AI companies operated from more than one UK location
- healthcare and wellness, professional services, and financial services were the leading application sectors nationally, representing a prominent focus across regions
- the number of internationally headquartered AI companies operating in the UK increased by 47%
- 54% of internationally headquartered companies operating in the UK have their headquarters in the USA
- more than 1 in 5 UK-headquartered AI companies maintained at least one overseas location, spanning 4,805 locations across 136 countries
5.1 AI activity by region
Since the sectoral analysis began in 2022, findings have shown high concentrations of AI companies in London, the South East, and the East of England. These 3 regions have consistently accounted for more than 70% of registered office locations.
However, analysis of all UK office locations suggests that the sector’s operational footprint – offices, labs, and technical teams – extends further into devolved nations and regions. Based on all UK locations data, the combined share of London, the South East, and the East of England falls slightly (from 72.3% to 71.0%), with corresponding gains across other regions.
Approximately 1 in 7 AI companies operates from more than one UK location (14%, 1,433) and 9% had a presence in more than one UK region (929).
Figure 5.1: location of UK AI firms
| Region | Registered office locations | All UK locations |
|---|---|---|
| London | 51.4% | 50.8% |
| South East | 13.3% | 13.0% |
| East of England | 7.6% | 7.2% |
| North West | 5.9% | 6.2% |
| South West | 4.8% | 4.9% |
| West Midlands | 4.0% | 4.0% |
| Scotland | 3.7% | 4.1% |
| Yorkshire and the Humber | 2.9% | 3.0% |
| East Midlands | 2.5% | 2.5% |
| Wales | 1.6% | 1.6% |
| North East | 1.3% | 1.4% |
| Northern Ireland | 1.0% | 1.2% |
Source: Perspective Economics, Companies House and Web Data
5.1.1 Regional sectors and capabilities
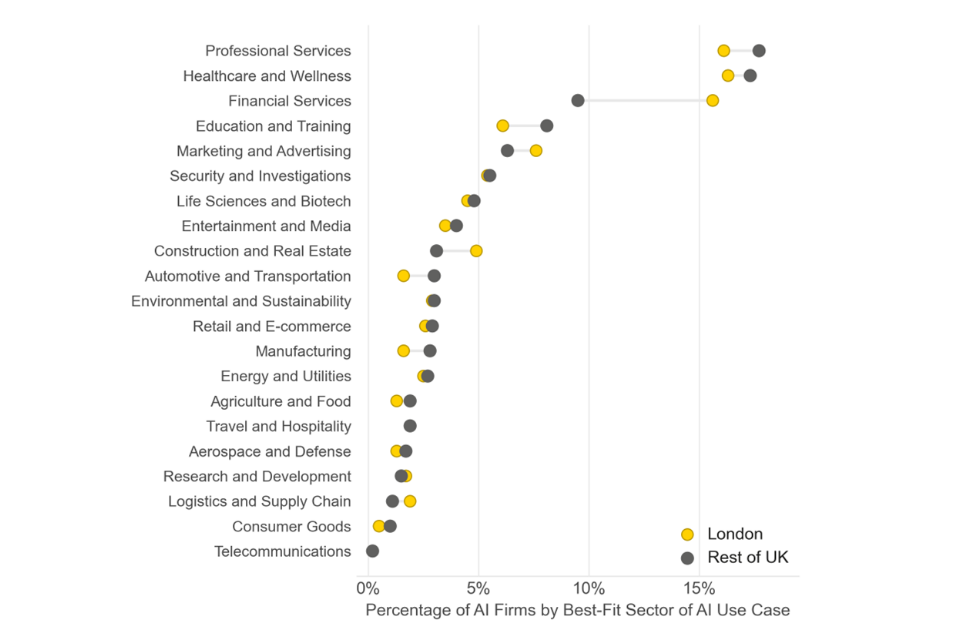
The sectoral orientation of dedicated AI firms was broadly consistent across the UK (Figure 5.2). Healthcare and wellness (17% of firms), professional services (17%), and financial services (13%) were the leading application sectors nationally, representing a prominent focus across regions.
The main geographic distinction is financial services, which accounts for 16% of London-registered dedicated firms – notably above that across regions (9%). Firms registered outside London showed a slightly greater orientation towards healthcare, education and training, and industrial sectors such as automotive and manufacturing.
Where regional variation does emerge, it often reflected local sectoral strengths. For example, life sciences and biotech accounted for 9% of dedicated AI firms registered in the East of England (against 5% nationally). Agriculture and food was most prominent in the East Midlands (8%, against 2% nationally) and healthcare accounted for around a quarter of dedicated AI firms registered in Northern Ireland.
Figure 5.2: sectoral focus across regions (dedicated only)
Source: Perspective Economics
While the sectors served by AI firms are mostly common across the UK, analysis of regional AI capabilities suggested that the nature of firms’ AI activity varied more by geography. For example, London-registered firms were more likely to work in agentic AI (22% of registered London firms compared to 12 to 18% elsewhere), while firms registered outside London had a greater focus on applying AI.
London recorded the lowest shares of both AI implementation (9% compared to, for example, 15% in Yorkshire and the Humber and 13% in the West Midlands) and perceptual systems (15% in London, compared to 17 to 22% across most other regions).
Natural language applications were the most geographically distributed capability, with highest proportions found in Wales, the North East (both 29%), and Yorkshire and the Humber (28%), which may be reflective of comparatively low barriers to entry. Distinct regional profiles were also evident, including AI for science in the East of England (highest share of any region at 8% of registered firms) and a concentration of autonomous systems, embodied AI, and AI assurance activity in Scotland.
Overall, this suggests a broad pattern in which frontier AI capabilities are developed disproportionately in London, while firms across the rest of the UK are more focused on deploying and applying AI within sector-specific contexts.
5.2 International locations
In 2022 and 2023, approximately 9% of AI companies identified were internationally headquartered, rising to 16% (936) in 2024. This year the number of internationally headquartered AI companies operating in the UK increased by 47% to 1,372.[footnote 42]
However, these companies now represent a smaller share (13%) of the total, reflecting the substantial growth in UK-headquartered company formation, additional UK companies entering the scope of the study, and improved identification of smaller domestic firms in this year’s study.
UK-US cooperation on AI remained close, reflected in collaboration on AI safety, joint research initiatives, and deep private sector ties.[footnote 43] This is also reflected in the location data, where 54% of internationally headquartered companies identified in this year’s study have their headquarters in the USA (735, 2024 = 57%).
Beyond the USA, Germany, France, India, Israel, and Canada are the most common international headquarters locations (61, 60, 50, 42 and 42 respectively). EU-headquartered companies collectively accounted for approximately one quarter (24%) of the international cohort. Overall, companies from 52 countries had established an AI presence in the UK (Figure 5.3).
Figure 5.3: internationally headquartered UK AI companies
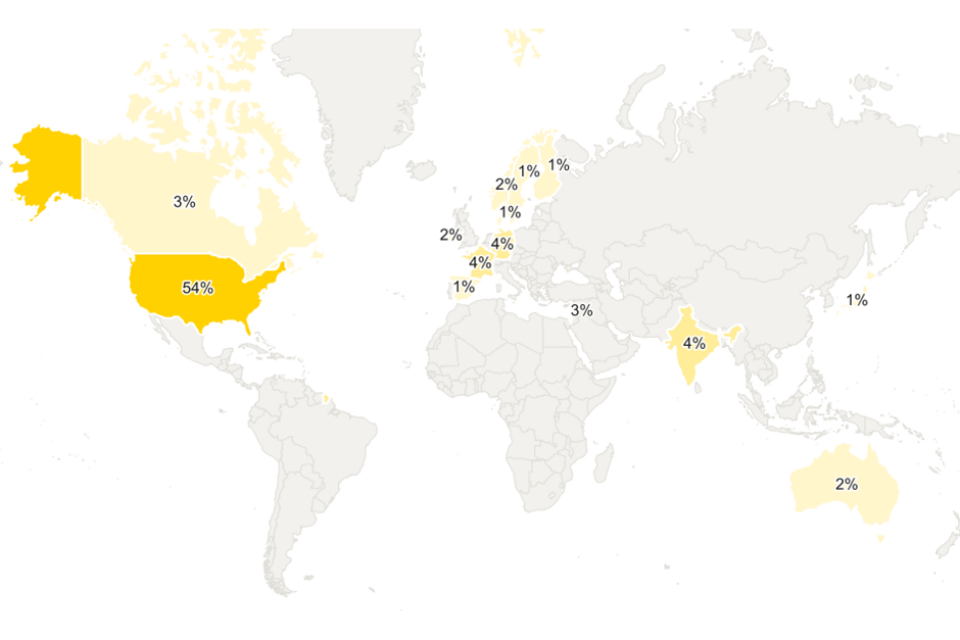
Source: Perspective Economics (locations accounting for 1% or more of international HQs)
More than 1 in 5 UK-headquartered AI companies (21%, 1,925) maintained at least one overseas location, spanning 4,805 locations across 136 countries. The USA is the most common destination by a considerable margin, home to 1,017 UK-headquartered AI companies with a presence across 1,268 US locations.
Figure 5.4: international footprint of UK-HQ AI companies
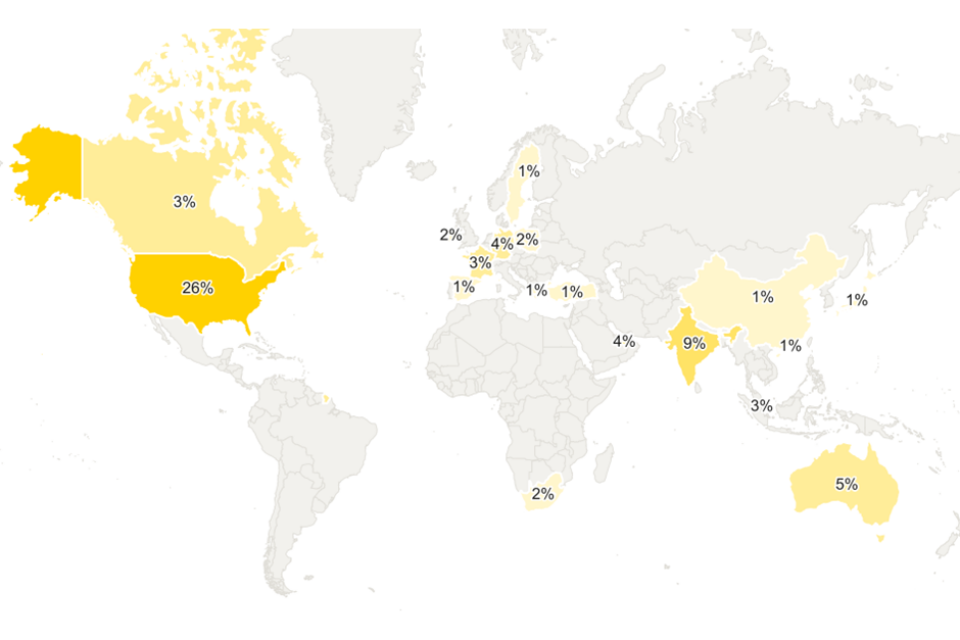
Source: Perspective Economics (countries with 1% or more of international locations)
Qualitative insights
The qualitative research did not provide detailed evidence on the regional distribution of AI companies, but businesses did describe several ecosystem factors that influenced choice of location.
These included proximity to:
- universities and access to technical and commercial talent
- investor networks
- major customers
- corporate headquarters
- other AI businesses
Businesses also highlighted the role of the UK’s higher education system as a key strength. University machine learning departments, wider engineering and life sciences expertise, and connections between academia, government and capital were viewed as important foundations for the UK AI ecosystem.
However, businesses also felt that more could be done to commercialise ideas emerging from universities and to improve links between academic research and industry needs.
The interviews also suggested that location decisions were not only about access to domestic clusters. Businesses viewed international markets as important routes to growth, and some described overseas markets as offering faster adoption, larger customer bases or more active demand for AI products and services.
6. Market dynamics
This section draws on a combination of secondary data, the sector survey (376 responses) and in-depth interviews with 50 representatives from industry, the investment community, academia, and the public sector.
Where survey evidence is presented in this section, it reflects the profile of the businesses that responded. Respondents were predominantly very small companies: 87% (325) were micro businesses with fewer than 10 employees, and a further 10% (36) were small businesses with 10 to 49 employees.[footnote 44]
The survey findings therefore describe the experience of the small firms that make up the large majority of the UK AI sector by company count. This profile is referred to where it is particularly relevant to interpreting the findings.
Key takeaways
- interviewees are broadly positive about the state of the UK’s AI ecosystem, pointing to a strong pipeline of new companies and a growing pool of experienced talent
- however, the sector remained intensely competitive and fast-moving, compounded by the fact that major model developers are moving ‘up the stack’ to provide applications and services directly
- the value of UK exports of software licensing and computer services more than doubled since 2018 and grew by 40% between 2022 and 2025
- both imports and exports of AI-related goods increased substantially in 2025. The value of imports grew by 40% to £11.4 billion and the value of exports grew by 46% to £4.4 billion
- 86% of exporters expect their export activity to increase over the next 12 to 18 months and 65% of currently non-exporting businesses intend to start
- 72% of AI businesses reported an increased requirement for computing power over the past 12 months, and 91% expect the cost of compute to increase over the coming year
6.1 Current state of the UK AI ecosystem
As in 2024, interviewees were again broadly positive about the state of the UK’s AI ecosystem. Investors pointed to a strong pipeline of new companies, a deep and growing pool of experienced talent, and the continued presence and expansion of large international AI companies in London.
Several described current conditions as the strongest they had seen – a perception that is supported by the quantitative data presented across preceding sections of the report.
It’s the healthiest I’ve seen it, from both a company-creation and a capital-raising perspective, in 20 years as a venture capitalist in the UK.
AI investor
However, interview findings, across businesses, investors, and wider stakeholders, also pointed to a consistent theme regarding how the market had become more uneven.
Very large amounts of capital are reaching a relatively small number of companies – typically those working at the foundational layer of AI, or founding teams with strong track records – while most companies building applications on top of AI models are finding it much harder to raise funding. One investor estimated that around three-quarters of application-layer companies are currently struggling to raise.
Bifurcated is probably the best way I’d describe it. We’re seeing huge amounts of investment going into the foundational layer… Beyond that, at the application layer, people are really struggling to break through in what’s quite a noisy investment environment.
AI investor
The landscape now, just in terms of funding, is completely different to a few years ago… either you’re trying to raise huge amounts of money at American scale and doing so successfully, or you’re basically oxygen-starved in a much tougher funding environment.
AI investor
On the UK’s international standing, interviewees continued to place the UK among the leading AI nations, but a clear step behind the USA and China. AI businesses typically placed the UK at the ‘upper end of the second tier’ globally, while strategic stakeholders noted that the UK’s position is under growing pressure as other countries – including the UAE, Saudi Arabia, and Singapore – invest heavily in AI.
The UK is typically somewhere between third and fifth place across all aspects of AI, whether you’re looking at talent and research, skills, or market opportunities.
Academic stakeholder
Interviewees also noted that recent political and policy turbulence internationally made the UK a more attractive destination for international AI talent. Several reportied that leading researchers and founders, who might previously have moved to the USA, are now more willing to build their careers in the UK and Europe.
At the same time, some investors cautioned that the AI investment market globally has become ‘frothy’, with company valuations that may not be sustained. Since headline UK investment figures are driven by a small number of very large rounds, these investors advised against reading too much into any single year’s figures.
Qualitative insights
Businesses were generally positive about the state of the UK AI ecosystem, identifying strengths in research, entrepreneurship, technical capability, and applied AI innovation. The UK was seen as a strong place to found an AI business, with a high-quality research base, credible institutions, and a growing community of AI-native companies.
However, businesses were more cautious about the UK’s ability to retain and scale successful companies. Businesses reported that larger pools of capital, faster customer adoption and more ambitious commercial environments were often easier to access overseas, particularly in the USA and parts of the Middle East.
Talent was one of the clearest areas of both strength and risk. Businesses viewed the UK as having strong technical foundations, but reported shortages of experienced AI professionals with practical, commercial expertise. They also described intense international competition for senior AI talent.
At the minute, there’s a real premium attached to any AI person with any kind of experience… and that is an expensive cost. We just can’t bear that. So [we’re trying to see] how graduates can start to bridge that gap.
Large AI business
6.2 Competition
Qualitative interviews again revealed an intensely competitive and fast-moving landscape. A key competitive theme this year was the behaviour of the largest international AI companies.
Interviewees consistently noted that the major model developers are moving ‘up the stack’ – expanding from building AI models into building the applications and services that sit on top of them. This is directly affecting which UK companies can attract investment: as one investor put it, “a lot of companies don’t get backed because investors believe the model companies will build into that space.”
What we’d traditionally call moats are increasingly not moats any more. There are a lot of very well-funded potential competitors for almost everything – the large labs in particular. When you’re worth a trillion dollars, it’s hard to explain why they couldn’t do something you’re doing.
AI investor
Market concentration was also a prominent concern among AI businesses, particularly in relation to the small number of large US companies that supply the cloud computing and AI models on which most UK AI businesses depend. Businesses reported having little influence over the pricing of these inputs.
It’s a very small pool of companies like Google, Anthropic and OpenAI who control [AI infrastructure]. And so they’ve basically got a monopoly over the pricing.
AI business representative
Some stakeholders argued that this dominance is self-reinforcing, because the largest companies also own the infrastructure their models run on, meaning that they have little commercial incentive to make models dramatically more efficient. This was described by one stakeholder as ‘market capture by infrastructure’.
Stakeholders also raised the longer-standing concern that the most successful UK AI companies tend to be acquired by larger international players before they reach scale. Others offered a counterpoint: the rapid improvement of open-source models means that dominance of the software layer may be less secure than it appears.
Survey findings reflected these concerns, with two fifths of respondents (40%, 150) expected market concentration or competition to have a significant impact on their future AI business activity, with a further 46% (174) expecting a modest impact.
As in previous years, UK businesses were seen to compete most effectively by focusing on specific sectors and applications rather than competing head-on with the largest players.
Interviewees identified applied AI – the practical application of AI within industries such as financial services, cyber security, legal and professional services, and life sciences – as the UK’s core strength, alongside emerging opportunities in AI assurance and safety.
The UK’s talent base was also seen as highly cost-competitive. One business noted that “if you want a competent AI engineer in the UK, you’re going to be paying [a quarter of what] you do in the US.”
Challenges for smaller AI businesses in accessing public sector contracts persisted. As in 2024, businesses described procurement processes that favour larger, established suppliers, and slow decision-making that made public procurement a more difficult route to market for early-stage companies.
Several business and investor interviewees argued that the public sector acting as a customer for UK AI companies would do more for the sector’s growth than additional grant funding.
Internationally, the global market was widely characterised as a 2-horse race between the USA and China, with the USA dominant in frontier models and private capital, and China increasingly influential through high-quality open-source models.
The EU was generally seen as constrained by its regulatory approach, while the emerging AI economies of the Gulf and Asia were viewed as moving quickly up the rankings on the strength of large-scale state investment.
Qualitative insights
Competition was often discussed through the lens of market concentration and the role of major international technology providers. Businesses described a market in which UK AI companies depended heavily on a small number of cloud providers, model developers, and infrastructure companies. This is while also competing against those same providers as they expanded further into applications, consulting, and services.
This dependency was seen as creating commercial risks for smaller firms. Businesses reported limited influence over pricing, exposure to sudden changes in costs or terms, and practical difficulties switching providers once products had been built around a particular ecosystem. Some businesses accepted this dependency as a pragmatic trade-off. Others actively tried to remain model-agnostic or to use open-source components to reduce vendor lock-in.
Businesses were also concerned that large providers could replicate or absorb the functionality offered by smaller AI companies. In this context, businesses suggested that UK firms were more likely to compete effectively through specialised, sector-focused applications, domain expertise, and trusted deployment in regulated or complex environments than by competing directly on foundational models.
6.3 International trade
This section uses published trade data from the Office of National Statistics (ONS) and HMRC, together with findings from the survey and in-depth interviews, to provide an overview of trade in AI goods and services.
6.3.1 Trade in services
The Office for National Statistics (ONS) gathers data on UK trade in services via the Annual Survey of International Trade in Services (AITIS).[footnote 45] Respondent businesses are asked which services they import and export. Services categories are aligned to the Extended Balance of Payments Services Classification (EBOPS2010)[footnote 46] for use within wider balance of payments statistics.
AI-related services may fall under a number of EBOPS classifications, including but not limited to:
- 8.3 Licences to reproduce and/or distribute computer software: rights and licences for reproducing and distributing computer software products, which may include AI software, algorithms, and trained models
- 9.2 Computer services: divided into computer software (9.2.1) including software originals, and other computer services (9.2.2). This category may include AI-as-a-Service platforms, cloud-based AI processing, and computational AI services
Figure 6.1 shows that the total value of UK exports of software licensing and computer services more than doubled since 2018, reaching £36.3 billion in 2025, and that it grew by 40% between 2022 (post-GPT) and 2025.
While it is not possible to attribute this export growth to AI-related services, the sustained increase since 2022 (in line with heightened interest in AI technology) suggests that AI-related services are likely to account for a share of the increase.
By comparison, other services (excluding manufacturing, maintenance and repair, and government services) grew by 67% since 2018 and by 26% between 2022 and 2025.
Figure 6.1: trade in AI-related services
| Year | Value £ billion (change on previous year) |
|---|---|
| 2018 | 16.2 |
| 2019 | 17.7 (+8.9%) |
| 2020 | 17.9 (+1.4%) |
| 2021 | 20.8 (+16.0%) |
| 2022 | 25.9 (+24.5%) |
| 2023 | 30.0 (+16.2%) |
| 2024 | 33.2 (+10.4%) |
| 2025 | 36.3 (+9.3%) |
Source: ONS trade in services, Perspective Economics
6.3.2 Trade in goods
Both imports and exports of AI-related goods increased substantially in 2025. The value of imports grew by 40% to £11.4 billion and the value of exports grew by 46% to £4.4 billion.
Growth in imports was driven by purchase of processing units, which rose 49% to £6.2 billion and accounted for approximately two-thirds of the £3.2 billion increase, with general compute equipment increasing by 38%, and memory and storage up 16% (from £1.53 billion to £1.77 billion). This is a pattern consistent with the data centre and compute build-out.
Growth in exports was spread across these 3 groups, with exports of processing units up 53%, general compute up 47%, and exports of memory and storage up 31%.
Figure 6.2: trade in AI-related goods
Imports (£ billion)
| Year | Imports £ billion (change on previous year) |
|---|---|
| 2018 | 8.0 |
| 2019 | 7.8 (-2.8%) |
| 2020 | 7.4 (-4.6%) |
| 2021 | 6.7 (-10.6%) |
| 2022 | 8.4 (+26.4%) |
| 2023 | 7.9 (-5.5%) |
| 2024 | 8.2 (+2.6%) |
| 2025 | 11.4 (+39.7%) |
Exports (£ billion)
| Year | Exports £ billion (change on previous year) |
|---|---|
| 2018 | 4.0 |
| 2019 | 4.1 (+1.9%) |
| 2020 | 3.7 (-11.1%) |
| 2021 | 3.4 (-7.3%) |
| 2022 | 3.7 (+9.8%) |
| 2023 | 3.3 (-11.3%) |
| 2024 | 3.0 (-8.2%) |
| 2025 | 4.4 (+46.4%) |
Source: UK Trade Info, Perspective Economics
UK imports of AI-related goods came from 145 partner countries in 2025.[footnote 47] The 10 largest import locations accounted for 82% of the total value of imports. The Netherlands was the largest single import location (£2.29 billion, around 20%), followed by the United States (£1.78 billion, around 16%), and Germany (£1.04 billion, around 9%).
Between 2024 and 2025 Germany accounted for around 20% of the £3.24 billion increase, the United States contributed 17%, and the Netherlands 15%. Imports from 2 Asian countries (Taiwan and Thailand) grew sharply from a lower base. The EU accounted for 56% of imports in 2025, down from 61% in 2024, and the lowest share since 2018.
UK exports reached 199 partner countries, but became markedly more concentrated since 2018. The 10 largest export locations accounted for 75% of total export values. Germany was the largest export location (£753 million, 17%), followed by the Netherlands (£652 million, 15%), and the United States (£503 million, 11%).
Exports to Norway rose 120% to £309 million, and exports to Iceland rose more than fourteenfold, from around £20 million to £295 million.
Figure 6.3: locations of UK trade in AI-related goods
Exports
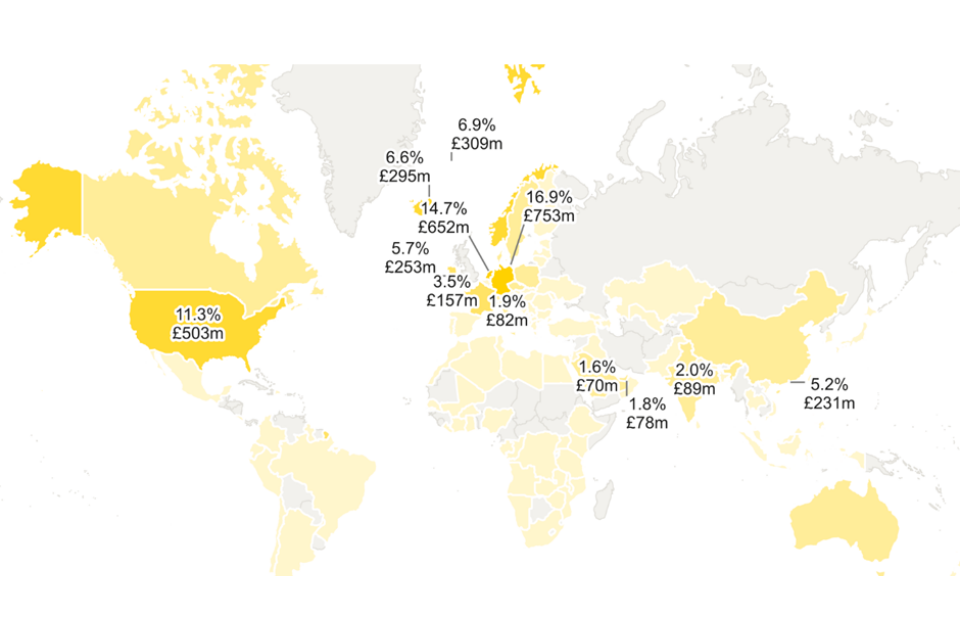
Imports
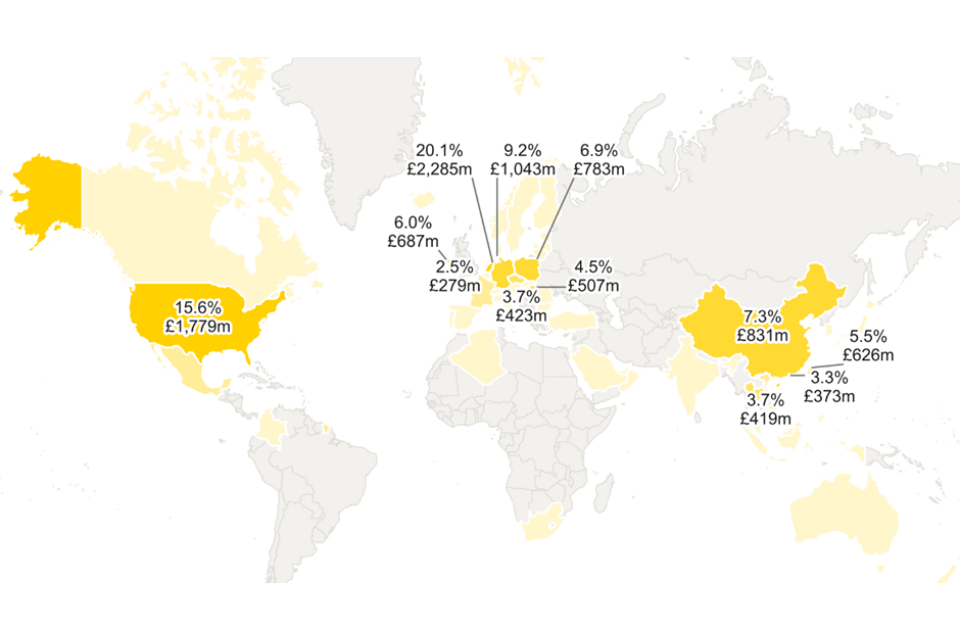
Source: UK Trade Info, Perspective Economics
6.3.3 Sector perspectives on trade
Just under two-thirds of surveyed AI businesses traded internationally in their most recent financial year (62%, 232). 44% reported that they exported AI products or services and 47% imported AI products or services (167 and 176 respectively), with just under one-third of businesses both importing and exporting (30%, 111).
Approximately one third of exporting businesses earn 60% or more of their AI-related turnover from exports (32%, 49, base = 152).
When asked about future trade expectations, 86% of exporters expect their export activity to increase over the next 12 to 18 months (130, base = 152 responses) and almost two-thirds of the 209 businesses not currently exporting intend to start (65%, 135). Expectations about future import requirements are similar, with three-quarters of importers expecting activity to rise (74%, 130, base = 176).
Survey findings suggest that AI businesses most commonly import items such as:
- off-the-shelf LLMs (73%, 129)
- AI frameworks and orchestration tools (55%, 97)
- data processing and analytics (51%, 89)
- pre-trained models for customisation (48%, 84)
Just 13% of respondent businesses reported importing microchips, GPUs or accelerator parts (23).[footnote 48]
Dependence on imported AI inputs emerged as a key theme across research strands. In the survey, 38% of businesses described themselves as entirely dependent on the AI products and services they import (67, base = 176).
In-depth interviews supported the survey findings, with business, investor and stakeholder interviewees all referring to considerable reliance on a small number of US providers to deliver current AI products and services, and investors describing compute and chip access as “becoming something of a geopolitical weapon.”
Qualitative insights
International markets featured prominently in businesses’ discussions of growth and competitiveness. There was a perception that overseas expansion was necessary to achieve scale, particularly where domestic customers were slow to adopt AI or where UK procurement cycles were long.
Larger customer markets, greater appetite for experimentation and more active demand for AI solutions were seen as advantages of some overseas markets.
Businesses contrasted these international opportunities with what they saw as a more cautious domestic market. In the UK, adoption was sometimes described as slow, particularly in older, regulated or enterprise sectors where buyers faced long procurement cycles, legacy systems, budget constraints, and uncertainty about how to implement AI.
The interviews also highlighted the importance of imported AI inputs. Businesses referred to reliance on imported models, cloud services, compute infrastructure, and hardware, particularly from US-based providers.
Exporting AI products and services offered routes to growth, but importing critical AI inputs potentially created dependencies that could affect resilience and competitiveness.
I can see faster growth in the Middle East, building products and selling products into the Middle East than I can into the UK.
Large AI business
6.4 Sovereign AI capability
In 2024, concerns about the UK’s dependence on foreign technology were largely raised as a hypothetical risk. This year, interviewees repeatedly referred to a concrete event. The decision by the USA government to restrict international access to Anthropic’s most capable model.[footnote 49]
For many interviewees, this changed the sovereignty debate from a theoretical discussion into a demonstrated business risk.
Any UK company that had built on top of that model – everything had just disappeared overnight… when you’ve got a trading partner that can switch on or switch off your services like this, it’s a bit more vulnerable [in terms of] continuity of service.
Industry stakeholder
Access is becoming something of a geopolitical weapon. Ultimately, this is a proxy for the ability to switch off intelligence to a large part of the world.
AI investor
These sentiments regarding dependence are supported by survey data (described in Section 6.3.3).
As a UK business, we’re 100% reliant on our AI needs from foreign vendors… that’s a huge business risk.
AI business representative
Despite this, few interviewees argued that the UK should attempt full technological self-sufficiency. Instead, interviewees focused on which specific capabilities matter most, and on reducing risk through diversification – including greater use of open-source models – rather than replacement.
A sovereign model is genuinely hard to build, and there’s no point having a bad one – if your sovereign model is worse than the open-source options, you might as well just use those.
AI investor
Interviewees were also careful to distinguish between different types of sovereignty. Physical location was not seen as the same thing as control. As one business put it, “it’s important not to confuse a data centre being physically in the UK with the data centre being under British control.”
Several stakeholders argued that the UK’s most valuable and defensible sovereign asset is not computing hardware but data – including national health, media, and research data – and that securing and making better use of these assets should be the priority.
A lot of these questions come down to data, not the GPUs.
Academic stakeholder
At the same time, interviewees acknowledged real capability gaps. As one investor noted, “we just don’t have foundational technology generally – we’re short a foundation model. That’s a massive gap.”
Recent government initiatives in this area – including dedicated sovereign AI funding – were broadly welcomed, although several interviewees questioned whether the scale of funding is sufficient given the capital intensity of the technologies involved.
Qualitative insights
Sovereign AI capability was one of the most debated themes in the qualitative research. Businesses broadly acknowledged the UK’s dependence on foreign providers for compute, cloud infrastructure, silicon chips, and foundational AI models. However, views differed significantly on whether greater sovereignty was desirable, feasible or commercially viable.
There were businesses who viewed sovereign capability as strategically important, particularly for defence, critical national infrastructure, public sector applications, and sensitive data.
These businesses argued that reliance on foreign providers created geopolitical and operational risks, including the possibility that access to models or compute could be restricted or used as leverage.
There were also businesses who were sceptical that a fully sovereign UK AI stack was realistic. They pointed to the scale of investment required, the dominance of US hyperscalers, the complexity of global supply chains and the infrastructure demands of frontier model development.
The range of opinions might reflect distinct but interrelated types of sovereignty, including data sovereignty, infrastructure sovereignty, and cultural sovereignty.
As a UK business, we’re 100% reliant on our AI needs from foreign vendors… that’s a huge business risk.
Medium AI business
6.5 Compute, infrastructure and energy
Access to computing power, and the energy needed to supply it, featured much more prominently in this year’s research than in 2024. Demand for computing power is rising quickly. 72% of surveyed businesses (270) reported an increased requirement for computing power over the past 12 months, and 91% (300) expected the cost of compute to increase over the coming year (base = 376 and 330 respectively).
Most compute demand was met through the cloud, and predominantly from overseas providers. 63% of businesses using compute relied on non-UK cloud services (208), compared with 52% using UK-based cloud services[footnote 50] (172) and 27% using their own on-premises computing (90).[footnote 51]
Businesses also reported paying a premium for UK-based computing where they need it – for example, to meet public sector or regulatory requirements for data to remain in the UK.
[Vendors] charge more for UK-based compute than they do for European compute… very significantly, 30%, 40% more.
AI business representative
Energy was consistently identified as the underlying constraint. Interviewees pointed to the cost of electricity and the difficulty of connecting new facilities to the power grid as fundamental barriers to building AI infrastructure in the UK. One investor cited the example of a major international technology company cancelling a planned UK data centre after its grid connection was significantly delayed.
The most important thing [government] can do to help start-ups across the UK economy, and to support AI, is sort out our power grid and power generation. It’s the universal input.
AI investor
Training is all about power consumption because you need gigawatt levels of power for training. So what that means is there will be no training data centres in the UK because there just simply isn’t that level of access to power, even if they could afford it.
AI business representative
Stakeholders also described a ‘missing middle’ in the UK’s compute provision. At one end, start-ups could access free or low-cost credits from commercial cloud providers. At the other, the UK had invested in large national supercomputing facilities.
In between, interviewees saw little accessible provision for growing companies whose needs have outgrown free credits, but who are not equipped to use national research infrastructure.
The way those facilities work, someone characterised it as like being given access to an Olympic-level training facility and you’re just a regular Joe. It can feel quite intimidating from a start-up perspective.
Industry stakeholder
Set against these constraints, many interviewees saw efficiency as the UK’s practical response. This is a view that was supported by survey findings, in which more than half of respondents (54%, 203) expected improvements in AI model efficiency to significantly drive sector growth over the next 3 years, and 22% (83) pointed to ‘edge AI’ – running AI locally on devices rather than in the cloud.
Several stakeholders suggested that smaller, more efficient and more specialised models played to the UK’s research strengths and reduced exposure to the cost of large-scale compute, and that the UK should focus its efforts there rather than attempting to match the infrastructure spending of larger economies.
Qualitative insights
Access to compute, cloud infrastructure and energy emerged as central issues for AI businesses. Businesses reported heavy reliance on major cloud and AI service providers and described compute costs as high, volatile, and difficult to forecast. These challenges were particularly acute where businesses had to provide fixed prices to clients while facing usage-based or token-based costs from suppliers.
There was a perception that compute access was sufficient during product development, but more challenging during commercial deployment and scaling. This reflected the different cost and capacity requirements of testing models compared with running customer-facing AI services reliably and at volume.
Energy and grid access were seen as underlying constraints on the UK’s ability to develop more domestic AI infrastructure. Businesses noted that training frontier models required very large volumes of power and that grid connections were already a barrier to developing data centre capacity.
Compute-wise at the moment, because we’re still product developing, it’s just about enough. But once we go to market with what we’re building, it won’t be enough.
Micro AI business
6.6 Future focus areas
Despite the broadly positive sentiment returned in qualitative research, interviewees highlighted a number of key issues for policy makers to consider.
The most commonly referenced issues were:
- the availability of scale-up and later-stage capital
- support for AI adoption across the wider economy
- clarity on AI regulation
- competition for talent
- public trust in AI
Scale-up and later-stage capital
As in previous years, the gap between the UK’s strength in starting companies and its ability to fund their growth was the most commonly cited issue. Despite improving sentiment among some investor interviewees, the overarching view was that the UK still has a structural dependence on overseas capital at the growth stage, and that there is a direct link between this funding gap and companies relocating.
Around 85% of investment in UK start-ups generally, and particularly AI start-ups, from Series B up, comes from outside the UK, and about half from outside Europe.
AI investor
Around a third of companies that are ‘born British’ end up leaving on day zero and go straight to San Francisco – there’s no chance for firms like us to even invest in them.
AI investor
Stakeholders reported the same dynamic from the company side, describing founders who want to build in the UK being told by investors: “we’ll give you all this funding, but you have to come to San Francisco.”
Survey findings support this sentiment, where the availability of scale-up funding was the factor most commonly expected to have a significant impact on future AI business activity (57%, 216), and it was also the most commonly cited potential reason for relocating AI activity away from the UK.
43% of survey respondents (161) indicated that relocation for this reason was likely – although relocation prompted by most other factors was generally considered unlikely.
In terms of responses to these challenges, investors most frequently pointed to pension reform as the key structural lever, and to protecting existing early-stage tax incentives[footnote 52] and improving the attractiveness of UK public markets for technology listings.
The oil tanker is turning in the right direction, very slowly, on those reforms, and it would be the easiest thing in the world for government to take its eye off the ball… It’s incredibly important that government stays the course there.
AI investor
AI adoption across the wider economy
Interviewees emphasised that the growth of UK AI businesses depends on demand from customers – and that most organisations are still struggling to turn AI experimentation into value.
Stakeholders described a persistent gap between pilots and deployment, and argued that practical support to help ordinary businesses adopt AI would benefit both the adopters and the UK’s AI suppliers.
95% of AI projects inside of Fortune 1000 companies are not delivering value. Yet 72% of those same companies are trying to deploy AI.
Industry stakeholder
There’s a long tail of companies that probably think they should be doing something, but they have no idea where to start.
Academic stakeholder
Regulatory clarity
Lack of regulatory or legislative clarity was cited as a significant barrier by 25% of surveyed businesses (93), up from 16% in 2024. The UK’s flexible, ‘pro-innovation’ approach was still broadly supported, and some saw it as a genuine advantage over the EU.
However, interviewees increasingly stressed that the absence of clear rules carries its own cost: “without a clear UK position, many businesses are simply planning against the strictest available standard.”
People seem to be [defaulting] back to the EU AI Act. Every single person that I speak to is accounting for that… they don’t know where the UK sits on that journey.
Industry stakeholder
There is a cost to the absence of regulation as well. If you don’t have very clear rules or very clear guidance on what good looks like when it comes to AI development, it does put some AI developers in a state of hesitancy.
Industry stakeholder
Copyright and intellectual property were raised as a specific area of uncertainty, reflected in the survey by concerns about copyright (19%, 71) and about the licensing and ownership of training data (17%, 65).
Competition for talent
The UK’s talent base remained its most consistently cited strength, but interviewees pointed to intense competition for experienced AI professionals, driven by the salaries on offer from large international companies.
Universities and research institutes reported particular difficulty retaining senior researchers. Visa and immigration barriers were the most common specific concern, particularly for international students and researchers seeking to found companies in the UK.
This competition for talent was echoed by respondents to the business survey, 80% of whom reported that availability of skills and talent had either a ‘significant’ or ‘moderate’ impact on their business over the past year (rating 40% each). Just over half of respondents indicated that they increased expenditure on recruitment in the past 12 months (52%, 195), and over two-thirds invested in skills, salaries and/or training (67%, 250).
Several interviewees argued that current international turbulence represents a rare window of opportunity to attract world-class talent, if the UK visa system makes it easy for that talent to come.
When you get salaries of 5 or 10 times being offered in industry just down the road… we can’t compete on salary.
Academic stakeholder
Trust, transparency, and assurance
Interviewees continued to stress that public trust is essential to the long-term adoption of AI, and several pointed to recent research suggesting that a large majority of the British public currently feel negative about the technology.
Alongside this, stakeholders identified AI assurance – independent testing, audit and certification of AI systems – as both a necessary safeguard and a significant commercial opportunity for the UK, building on its strengths in professional and financial services.
70% of the British public are negative about AI. That is not where we need to be.
Policy stakeholder
At the minute suppliers… are effectively marking their own homework. And I do think there’ll be a lot more scrutiny, or third-party scrutiny, through the assurance work.
Industry stakeholder
In addition to these commonly cited topics, interviewees identified a range of other future policy considerations including better coordination of the UK’s many AI initiatives and support programmes.
This was summed up by one stakeholder as “we’re all pulling in broadly the same direction, but we’re not pulling the same rope” – reform of public sector procurement to open it to smaller AI businesses, reducing the cost of energy, and doing more to celebrate and champion UK AI success stories.
Businesses interviewed in depth were also asked to consider 4 potential future scenarios for the AI market. Their responses reinforced many of the aforementioned themes:
- enthusiasm for open-source models and efficient
- device-based AI
- conditional interest in sovereign capability
- concern about a market dominated by a small number of large players
Table 6.1: business perspectives on potential scenarios
| Scenario | Description | Business views |
|---|---|---|
| Open-weights ascendancy | High-quality open-source (‘open-weight’) AI models continue to improve and spread. | Viewed overwhelmingly positively: seen as breaking vendor lock-in and levelling the playing field for smaller UK businesses. Some raised security concerns about the origin of certain open-source models, and noted that constantly improving open models could quickly commoditise a start-up’s unique features. |
| Edge-native inference | AI increasingly runs locally on devices (‘at the edge’) rather than in the cloud. | Seen as a major and imminent opportunity: expected to sharply reduce compute costs, remove latency, and improve resilience where connectivity is limited. |
| Sovereign AI stacks | The UK develops domestically controlled AI infrastructure, models, and services. | Support was conditional. A sovereign stack would need to be globally competitive on quality, and businesses would want confidence in its commercial longevity, citing experience of previous government-led infrastructure projects. |
| Regulated oligopoly | A small number of large international companies dominate the AI market, with regulation shaped around them. | Widely feared, and seen by many as already partly a reality. The main concern was regulatory capture – rules that place disproportionate compliance burdens on smaller businesses and open-source developers. |
Qualitative insights
Several priorities were identified by businesses as having a significant impact on the future growth of the UK AI sector. These centred on commercialisation, adoption, talent, regulation, procurement, and infrastructure. Across these areas, businesses called for support that was practical, targeted, and aligned with the realities of scaling AI products and services.
The most consistent priority was addressing the scale-up gap. Businesses wanted support to move from research, pilots and early product development into commercial deployment and revenue growth.
This included:
- funding for commercialisation
- reducing bureaucracy in grant processes
- improving signposting across public funding schemes
- using tax incentives to unlock private capital
Businesses also saw public procurement as a potentially powerful lever. They argued that government and major public bodies could act as early customers for UK AI businesses, helping to validate products, generate reference cases and support the creation of domestic AI champions.
Regulatory clarity was also viewed as an enabler of growth, particularly where clear standards and assurance frameworks would help customers adopt AI with greater confidence.
Accelerators are really helpful… getting facetime with a CEO or a trial period really cuts down the sales cycle and means you can sell something that they have already used rather than pitch something on PowerPoint from scratch.
Small AI business
Once UK and global regulation define how it wants to assure AI [in safety critical sectors], that’s going to go through the roof because then I’ve got a standard to meet, a standard to hit, a product quality to deliver to, and we can start churning those out.
Large AI business
Appendix 1: research questions
How much does the UK’s AI sector contribute to the UK economy?
- What do UK AI companies do?
- What are the revenues, employment, and GVA associated with UK AI activity?
- How productive is the UK’s AI sector?
What products and services does the AI sector produce and offer?
- Who are the customers of the AI sector?
- How do diversified companies procure AI products and services?
How mature is the AI sector?
- Is there strong competition?
- Have there been changes in market structure?
- Is funding and investment available to support sector growth?
- What merger and acquisition activity is taking place within the UK AI sector?
- What impact do regulatory decisions have on UK AI company locations?
- To what extent are UK AI businesses dependent on international investment?
How does the UK’s AI research expertise contribute to the UK economy?
What are the key drivers of growth in the market?
How is the UK AI sector expected to change in future?
What challenges and barriers are faced by the UK AI sector?
What AI-related goods does the UK export?
- Does the UK have any comparative advantages in trade of AI goods or services?
- To what extent are UK AI businesses dependent on imports?
What inputs are required by UK AI businesses, including capital, investment, and computing resources?
- Where does UK AI compute capacity come from?
- Is data processing done locally or internationally?
- Who provides cloud infrastructure?
How much do UK AI businesses spend on R&D?
What future AI technological trends are emerging and what is the UK’s place in them?
How stable is the UK AI sector within a global ‘bubble’ context?
Where do AI companies get their input data from?
Appendix 2: capability definitions
| Level 1 | Level 2 | Definition |
|---|---|---|
| Natural language applications | Natural language processing | Core NLP techniques – tokenisation, parsing, classification, entity recognition, translation. |
| Dialogue and interaction | Conversational AI, dialogue management and interactive language systems. | |
| Language understanding | Semantic understanding, intent recognition and contextual interpretation. | |
| Generative text and content | Generative text, summarisation, drafting and content creation capability. | |
| Text and data mining | AI-powered extraction, classification and analysis of structured and unstructured text/data inputs and outputs. | |
| Perceptual systems | Computer vision and image processing | Image classification, object detection, OCR and image generation. |
| Speech and audio processing | Speech recognition, synthesis, voice cloning, audio classification. | |
| Multi-modal Integration | Combined text, vision, speech and video processing within a single system. | |
| Anomaly / signal detection | Detection of anomalies, patterns and signals across visual, audio and sensor data. | |
| Video generation and understanding | Generative video, video analytics, scene understanding and multi-modal video-language models. | |
| AI development and training | Model architecture and deployment | Design and deployment of model architectures – covering frontier and sub-frontier models. |
| Model type (frontier vs sub-frontier) | Distinction between frontier (state-of-the-art compute, capability) and sub-frontier models. | |
| System optimisation | Tuning, compression, quantisation and optimisation of AI systems. | |
| Performance evaluation | Benchmarking, evaluation and performance assessment of AI models. | |
| Narrow models, AI integration and general-purpose AI | Distinction across narrow task models, AI-integrated solutions and general-purpose AI capability. | |
| Open-weight model development | Capability for fine-tuning, distributing and building on open-weight foundation models. | |
| Autonomous systems | Autonomous systems | Self-governing systems that operate without continuous human input. |
| System autonomy | Degree and architecture of autonomous control within wider systems. | |
| Agentic AI | Agent-based solutions | Single-agent products that complete multi-step tasks autonomously. |
| Multi-agent orchestration | Frameworks and products coordinating multiple agents and tools to achieve outcomes. | |
| Agentic workflow automation | Workflow and process automation augmented with agentic decision-making. | |
| Knowledge generation | Generative AI (formerly GAN) | General-purpose generative AI – models and methods producing new content (text, image, audio, video). |
| Retrieval augmented generation (RAG) | RAG architectures combining retrieval and generation for grounded outputs. | |
| Knowledge synthesis | Knowledge graphs, summarisation across sources and synthesis of complex information. | |
| AI for Science | Scientific discovery and simulation | AI for hypothesis generation, simulation and accelerated scientific discovery. |
| Materials discovery and development | AI-driven discovery and design of new materials. | |
| Drug design and bioinformatics | AI for drug discovery, molecular design and bioinformatics. | |
| Climate and earth systems modelling | AI for climate, weather and earth-systems modelling. | |
| Automated laboratories | AI controlling automated experimentation and self-driving laboratories. | |
| Embodied AI | Robotics | Humanoid, service and industrial robotics with AI-driven perception/control. |
| Autonomous vehicles and drones | AI for autonomous mobility, drones and aerial systems. | |
| Industrial and manufacturing robotics | AI-enabled robotics for manufacturing, warehousing and logistics. | |
| Cyber-physical systems | AI integrated with sensor networks, Internet of Things (IoT) and physical control systems. | |
| AI implementation | AI strategy development | Strategic advisory and use-case development for AI adoption. |
| AI skills and training | Capability transfer, upskilling and training delivery for AI. | |
| AI deployment consulting | Specialist consulting for AI deployment and integration. | |
| AI security | AI security (model and system protection) | Defensive tooling and services protecting AI systems against adversarial threats. |
| AI threat intelligence and adversarial testing | Capability for adversarial testing, jailbreak research and AI threat intelligence. | |
| AI assurance, safety and governance | AI assurance | Independent assurance, evaluation, model risk management and audit of AI systems. |
| AI safety, ethics, trust and fairness | Bias testing, fairness, model cards, explainability and ethical AI tooling. | |
| AI regulatory compliance, standards and certification | Services and tooling supporting EU AI Act, UK regulatory compliance, ISO/IEC 42001 and sector-specific AI rules. | |
| Human oversight and explainability | Tooling and services enabling meaningful human oversight, review workflows and contestability. | |
| AI interface, user experience (UX), accessibility and transparency | Design, UX and accessibility for AI outputs – clarity, transparency and trust in end-user presentation. |
Appendix 3: detailed capability tags
| Domain | Lower-level technology | % Dedicated firms with tag | Number |
|---|---|---|---|
| Natural language applications | 84% | 6,007 | |
| Natural language processing | 46% | 3,313 | |
| Text and data mining | 44% | 3,140 | |
| Language understanding | 42% | 3,024 | |
| Generative text and content | 37% | 2,681 | |
| Dialogue and interaction | 30% | 2,166 | |
| AI implementation | 58% | 4,187 | |
| AI deployment consulting | 51% | 3,633 | |
| AI strategy development | 33% | 2,376 | |
| AI skills and training | 12% | 885 | |
| Perceptual systems | 57% | 4,112 | |
| Anomaly / signal detection | 33% | 2,349 | |
| Computer vision and image processing | 26% | 1,845 | |
| Speech and audio processing | 17% | 1,220 | |
| Multi-modal integration | 16% | 1,150 | |
| Video generation and understanding | 4% | 295 | |
| Agentic AI | 53% | 3,791 | |
| Agentic workflow automation | 48% | 3,440 | |
| Agent-based solutions | 32% | 2,289 | |
| Multi-agent orchestration | 12% | 857 | |
| AI development and training | 45% | 3,248 | |
| Narrow models, AI integration and general-purpose AI | 38% | 2,734 | |
| Model architecture and deployment | 27% | 1,950 | |
| System optimisation | 13% | 943 | |
| Performance evaluation | 12% | 865 | |
| Open-weight model development | 1% | 95 | |
| Model type (frontier vs sub-frontier) | <1% | - | |
| Knowledge generation | 39% | 2,813 | |
| Knowledge synthesis | 39% | 2,810 | |
| Generative AI (formerly generative adversarial network (GAN)) | <1% | - | |
| Retrieval augmented generation (RAG) | <1% | - | |
| AI assurance, safety and governance | 35% | 2,510 | |
| Human oversight and explainability | 21% | 1,539 | |
| AI regulatory compliance, standards and certification | 16% | 1,112 | |
| AI assurance | 15% | 1,111 | |
| AI safety, ethics, trust and fairness | 15% | 1,082 | |
| AI interface, UX, accessibility and transparency | ~1% | - | |
| Autonomous systems | 9% | 641 | |
| Autonomous systems | 9% | 622 | |
| System autonomy | 4% | 318 | |
| AI for science | 7% | 495 | |
| Scientific discovery and simulation | 7% | 475 | |
| Drug design and bioinformatics | 3% | 224 | |
| Climate and earth systems modelling | 1% | 82 | |
| Materials discovery and development | 1% | 64 | |
| Automated laboratories | <1% | - | |
| Embodied AI | 6% | 436 | |
| Cyber-physical systems | 6% | 416 | |
| Robotics | 2% | 125 | |
| Autonomous vehicles and drones | 2% | 116 | |
| Industrial and manufacturing robotics | ~1% | - | |
| AI security | 3% | 193 | |
| AI threat intelligence and adversarial testing | 3% | 192 | |
| AI security (model and system protection) | <1% | - |
Appendix 4: research methodology
This appendix summarises how the AI Sectoral Analysis 2025 was produced.
It sets out:
- the approach used to identify UK firms with AI activity
- the data sources used
- the checks applied
- the limitations that readers should consider when interpreting the findings
It is intended to be read alongside the main report.
The analysis builds upon the previous UK AI Sectoral Analysis (published in September 2025) and continues the time-series analysis undertaken by the research team since 2022.
The research provides:
- an assessment of the number of businesses in the UK supplying AI products or services
- the estimated contribution to the UK economy in terms of GVA
- the estimated number of people employed in AI
- an overview of the products and services offered by these firms
How to read the estimates
AI activity in the UK is not captured by a SIC code. The study therefore adopts an experimental approach to identifying and measuring the economic contribution of AI activity. All estimates within the study are experimental in nature and do not constitute official statistics.
They reflect a best estimate of the size and scale of AI activity in the UK, derived from multiple official, commercial, and web-based sources, They are best used to indicate the broad size, scale, and composition of the sector, and to compare relative contributions across sub-sectors, regions, and firm sizes. This is rather than as precise values, particularly at the level of individual firms.
Research scope
Consistent with previous studies, the analysis explores firms that:
- have a clear presence within the UK market, through a UK-registered business that reports to Companies House on an annual basis
- demonstrate an active provision of commercial activity related to AI (for example, via website or social media content)
- provide AI products or services to the market (for example, sell or enable the selling of AI products or services to other customers)
- appear to be active at the time of writing (meaning they are not dissolved or in the process of dissolution)
- are not charities, universities, networks, or individual (non-registered) contractors – all excluded for analysis purposes
The study covers UK-registered businesses, including internationally headquartered firms with an evidenced UK trading presence. All estimates relate to UK activity only (for example, reported or estimated UK revenue, employment, and GVA).
Companies are classified as dedicated (typically smaller, specialised AI-first companies whose business is built around AI products or services) or diversified (typically larger companies with a broader offer, of which AI products or services form a part).
Where a company is dedicated, all of its UK activity is typically included within sector estimates. Where a company is diversified, only the estimated AI-related share of its activity is included (see ‘sectoral modelling’).
Research limitations
This study is our best estimate of the size, scale, activity, and scope of the UK’s AI ecosystem. The boundaries of what constitutes the AI ‘sector’ are rightly contested and should be subject to a plurality of views and feedback, rather than definitively coded or classified.
The following limitations should therefore be considered when interpreting the findings.
Definitional subjectivity
There is no single agreed definition or classification for mapping the AI ecosystem. Definitional scoping and the use of web data are therefore required to identify relevant companies, and inclusion decisions reflect a best estimate by the research team using agreed parameters rather than a definitive classification.
AI development versus adoption
The boundary between companies that develop value-adding AI products and services and those that simply adopt AI technologies is increasingly difficult to delineate, particularly for diversified firms. Additional steps have been taken to review and verify AI companies.
Fast-moving study boundaries
Since the first sectoral analysis in 2022, the tools and techniques used to identify, qualify and classify companies have improved significantly, while AI-related terms have become increasingly embedded in company language (such as ‘agentic AI’). Year-on-year changes may therefore reflect both genuine market change and methodological improvement, and comparisons over time should be interpreted with this in mind.
Use of estimation techniques
Where values are not available in full (for example, via filed accounts), estimation techniques are applied on a per-employee basis, with ‘conservative’ low-end estimates applied for unknown values. AI-related activity among diversified firms is apportioned using estimated AI-related employment (via accounts, survey or web profiles) and should be treated as an estimate only.
Quality and accuracy of self-reported data
Financial and operational metrics for early-stage firms may be limited or unavailable via reported company data (such as unaudited or limited accounts). The analysis also requires matching of fields such as company name, registered number, and website across multiple datasets. Several manual and automated steps are taken to minimise the risk of mismatch.
Interpretation of text and language data
The identification of products, services and capabilities relies on descriptive web content and may overstate or understate the extent of a firm’s actual AI activity or capabilities (for example, due to the language used within branding and marketing content). Full web data may not also be available for some firms where web review is explicitly prevented. This is mitigated by use of wider sources, web search, and manual review.
Survey and interview engagement
Survey and interview findings rely upon voluntary engagement from firms and stakeholders. The sample is reviewed and prioritised to be representative where possible. However, responses may not fully represent the wider population of AI firms.
Point-in-time assessment
This analysis represents a point-in-time assessment of a dynamic market, with final checks undertaken in June 2026. Firms registered or materially changed after this point are not reflected within the study. Users should consider these limitations when interpreting findings and making strategic or policy decisions based on this research.
Research method
The study was produced in 7 stages.
Stage 1: desk research and data discovery
The research team commenced with a desk-based review of AI-related literature, news articles, company posts, and investment announcements (covering January 2025 to March 2026), to identify:
- new programmes, progress, and key announcements across the UK AI ecosystem
- areas for further focus (such as sovereign capabilities, advancements in models and agentic tooling, and AI-related investment since the previous study).
This informed:
- an updated list of AI-related key terms to support identification (noting that keywords are only used to support potential longlisting, due to the risk of false positives or omissions)
- identification of web and wider sources for review (e.g. accelerator and support initiatives)
- a review of the 2025 baseline dataset to identify firms remaining active and in scope
Stage 2: initial longlisting
The identification stage aims to capture as many potentially relevant firms as possible within an initial ‘longlist’. This is deliberately broad. AI spans multiple sectors and is increasingly cited by companies across several use cases, technologies, and industries. Several firms may mention AI without being in scope of this study (for example, discussing AI adoption without commercially bringing AI products or services to market).
The longlist drew upon a wide range of sources, including:
- the previous baseline (2024 to 2025) dataset (with dissolved firms, and firms no longer in scope, removed)
- web data review, using weighted keyword matching and similarity searches across an internal dataset of UK-registered firms mapped to company websites
- a review of all newly active Companies House registrations mentioning AI or related terms within their trading name (many of which demonstrated ‘shell’-type characteristics without clear website or trading activity and did not progress to the final shortlist)
- commercial and official sources, including Beauhurst (investment), fDi Markets (inward investment), HMRC Trade Info (trade in AI-related commodities), Lightcast and anonymised web profiles (AI-related employment), UKRI Gateway to Research (publicly funded AI research), and Tussell (AI-related public procurement)
- a programme review of accelerators, incubators, and early-stage growth initiatives
All identified firms were collated into a single dataset, cleaned and deduplicated, assigned a unique ID, and enriched with known Companies House IDs and websites. This produced an initial longlist of potentially relevant firms for further review.
Stage 3: taxonomy refinement
In April 2026, Perspective Economics held a series of taxonomy workshops with BIST and wider colleagues to test the study scope and definitions, alongside internal review to identify new or novel areas for identification and classification.
The updated taxonomy introduces new capability groupings (such as agentic AI, AI for science, and embodied AI) to reflect market developments, while retaining core components so that UK capabilities can be tracked year-on-year. The taxonomy is summarised as follows.
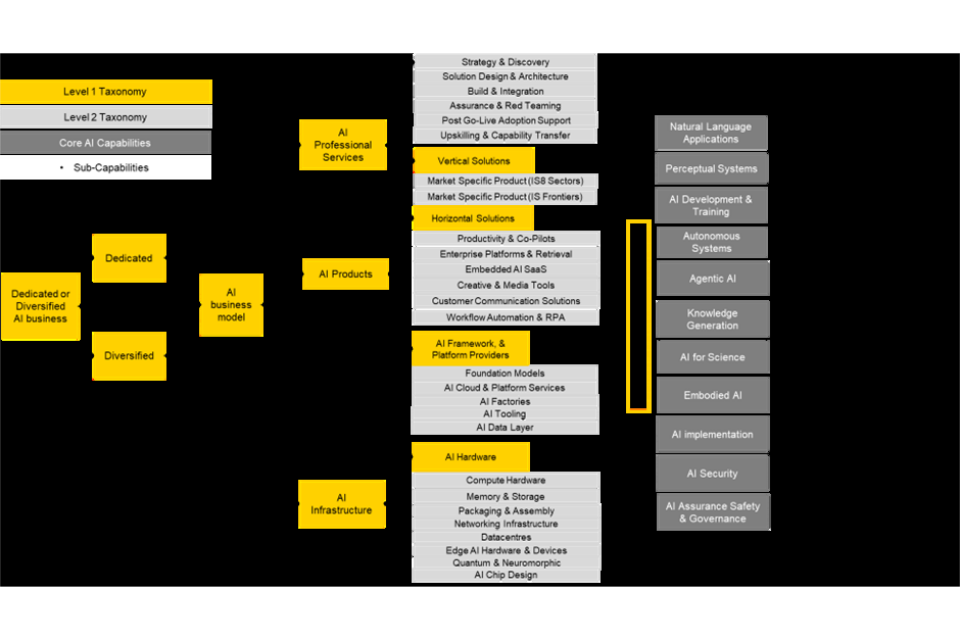
Stage 4: final longlisting and enrichment
The longlist was subject to several quality checks including verifying web presence (all companies required an evidenced web presence for inclusion), verifying and validating the registered entity (reviewing websites and accounts to match each firm to the correct registered entity), deduplication and removal of dormant or inactive entities.
Following this, the refined longlist was subject to enrichment and review, including:
- enrichment against official and internal data sources (for example, the Companies House API)
- a structured crawl of web data for each firm, reviewing the most relevant descriptive and trading content to identify descriptions, products, services, and use cases
- an assessment of each firm’s relevance to the study using LLMs, tested via manual review against a sample of dedicated and diversified companies prior to application across the full dataset
- manual review across multiple quality metrics, with ‘edge’ cases resolved by expert review requiring clear evidence of creating or implementing AI products or services
Where websites prohibited the use of agentic review, this was respected, and the research team drew upon wider data (such as. known descriptions, publicly filed accounts, and enhanced web searches). All firms carry evidence fields recording the content and source underpinning their inclusion.
Final manual refinement removed non-commercial entities (such as university centres, membership bodies, charities, public bodies), companies with limited evidence of AI activity, and companies without an evidenced UK trading presence.
Stage 5: survey and qualitative engagement
Ipsos conducted a multi-modal survey of 376 AI firms in May 2026, by telephone and online, including an open weblink distributed by BIST and publicly funded partners through which any AI firm could take part.
The survey explored firm-level performance and industry perceptions, including:
- extent of AI business activity
- business demographics (turnover, employment)
- AI-related capabilities
- products and use cases
- perceptions regarding future growth, enablers and barriers
- expectations on international trade
The study team also conducted 50 in-depth interviews with strategic stakeholders across industry, academia, government policy and investment, with findings analysed thematically. A regional expert advisory panel was convened to test emerging findings and provide challenge regarding regional coverage and interpretation.
Stage 6: final identification and shortlist
In June 2026, the research team revisited the shortlist to undertake final additions and checks. This included:
- review of survey responses against known values
- identification of newly registered firms (including inward investment announcements and AI firms coming out of ‘stealth’)
- final cleaning and verification checks regarding registered entities, websites, and firms in scope
In total, 10,488 unique active firms were shortlisted for final analysis and inclusion in the study.
Stage 7: sectoral modelling
Firms often sit across sectors and ecosystems. Further, some of the UK’s largest AI-related employers may hire hundreds of staff in their AI teams but have thousands of employees across other functions. Extensive data cleaning, enrichment, and modelling are therefore required to develop AI-related estimates of activity.
Apportioning AI activity
Where a company is dedicated, all UK activity (revenue, employment and GVA) is included within sector estimates.
Where a company is diversified, AI-related activity is estimated by reviewing anonymised web profile data regarding the number of employees using core AI-related terms (such as AI, data science, machine learning) in descriptive information, providing a proxy estimate of AI-related employment as a proportion of overall UK activity.
For larger firms, direct and manual review was also undertaken to test estimates, in addition to firm-level engagement and checks to calibrate estimates.
Revenue and GVA estimation
Known revenue and GVA values (from filed annual accounts of dedicated AI providers) are used to estimate average and median revenue and GVA per employee, with quality review removing anomalies. These estimated values are banded by firm size and applied to estimated AI-related employment where values are unknown, with ‘conservative’ low-end estimates for unknown values.
Known values are retained at the firm level. Estimates are augmented against survey responses where appropriate (such as to account for pre-revenue firms). Null values are applied for early-stage firms with no or limited accounts data including employment.
External investment
Analysis of external investment matched company registration numbers to the Beauhurst platform for dedicated firms only. The research team only considers ‘dedicated’ activity to prevent over-estimation of AI-related equity and VC investment.
Location data
All registered UK addresses and trading locations (UK offices identified via company websites) were reviewed, with markers for presence in each of the 12 UK regions and for country of origin (UK headquartered or internationally headquartered with a UK presence).
AI estimated revenue and GVA: interpretation and limitations
The AI sectoral population comprises over 10,000 firms undertaking AI-related market activity, but only a small proportion are ‘dedicated AI providers’ of sufficient size to file full detailed accounts (due to Companies House filing requirements), with directly reported revenue and GVA that can be observed and attributed to AI activity.
For the remainder, values are modelled by applying per-employee estimates to estimated AI-related employment. The resulting AI-related revenue and GVA figures should be read as an estimate of the scale of sectoral activity, derived from the best available data and modelled assumptions, rather than a precise measurement.
The methodology controls for over-interpretation through:
- outlier removal and segmentation of per-employee values (so ratios derived from large or multinational firms are not applied to SMEs and micro firms)
- use of anonymised survey evidence to calibrate estimates (including pre-revenue firms)
- null treatment for early or unverifiable firms (no employment, revenue or GVA is fed into the aggregate estimate where activity cannot be reliably verified)
- verification of significant changes since the previous baseline
The following limitations remain:
- observed accounts data are drawn from a subset of firms, whose revenue and GVA per employee may not hold across all business models
- filed accounts do not disaggregate AI-related turnover, so for diversified firms the AI share is estimated rather than observed
- revenue and GVA estimates inherit the uncertainty of the AI-related employment estimates from which they are derived
- accounts are filed with a lag (up to 15 months), so figures may not align precisely with the reference period
- year-on-year movements reflect changes in the identified population and data availability as well as genuine growth
The combined effect is that reported revenue and GVA figures should be regarded as a conservative estimate of AI-related activity, best used to indicate the broad size, scale, and composition of UK AI-related economic activity at a point in time.
Quality assurance
Quality assurance was applied at each stage of the research pipeline, combining automated checks with manual review throughout.
Staged, evidence-based decisions
Identification, deduplication, verification, classification, and enrichment were undertaken as distinct stages, so judgements were made using only the evidence relevant to that task. Rule-based checks and official data sources were used first, with LLMs applied to ambiguous cases.
Use of analytical tools, subject to human review
Market-leading LLMs (typically Anthropic Claude models) were used to support the review, verification, and classification of firms at scale. Models were benchmarked and piloted before use, with manual validation and review gates prior to any full run.
Bias controls
Classification prompts distinguished firms that develop or provide proprietary AI products or services from firms that simply use or cite AI tools built by others, with named exclusion rules for known false-positive types, and a precision bias towards exclusion where evidence was limited. All model outputs were returned in structured formats and validated prior to inclusion.
Conservative treatment of uncertainty
Where evidence was limited, models were instructed to lean towards exclusion or omission, and no firm was removed from the dataset without an evidenced rationale.
Full audit trail
Every classification carries a written rationale, a confidence rating, and a recorded evidence source, meaning each record in the final dataset can be traced back through the identification, enrichment, and classification process.
Review with BIST and expert stakeholders
The study scope, taxonomy, and emerging findings were reviewed with BIST throughout, with a regional expert advisory panel providing further challenge and feedback.
Classification consistency
To test classification consistency, every firm in the final dataset was reviewed against its 2025 baseline classification alongside its 2026 classification, enabling year-on-year consistency checks at firm level.
The large majority of retained firms received the same dedicated / diversified classification in both studies, with movements between classifications consistent with firms deepening their AI focus over the period, or with shifts in market language between the 2 studies (for example, firms previously described in generative content terms now describing their offer in agentic terms).
We note that the previous classifications are themselves study ‘views’ rather than an independent truth. These checks provide evidence of classification stability, rather than a formal accuracy measurement.
Data sources
The data sources used to underpin the sectoral analysis, and their role within the study, are set out as follows.
| Source | Description | Role within the study |
|---|---|---|
| Web data (Perspective Economics) | Web content collated by Perspective Economics across company websites and wider web sources. | Identification of AI firms classification against the agreed AI taxonomy; evidence base for products, services, and trading locations. |
| Bureau van Dijk FAME (and Companies House) | Companies House data and financial statements from all registered businesses within the UK. | Verification of registered entities; company accounts data for employment, revenue, and GVA analysis. |
| Beauhurst | Investment analysis platform enabling users to discover, track and understand the UK’s high-growth companies. | External investment raised (dedicated firms only); accelerator participation; supporting company information. |
| Lightcast | Labour market intelligence platform tracking job postings and anonymised employment profiles globally. | Identification of AI-related skills and employment in firms; estimation of AI-related employment shares within diversified firms. |
| fDi Markets | Identifies announced inward investment projects into the UK. | Identification of AI-related inward investment and new market entrants within longlisting. |
| HMRC Trade Info | Publicly available data identifying UK companies importing or exporting against relevant trade and commodity codes. | Supporting signal of trading activity within the longlisting process. |
| Tussell | Market insight into public sector procurement: contracts, spend, buyers and suppliers. | Identification of providers engaged in AI-related public procurement. |
| UKRI Gateway to Research | Publicly available data on companies in receipt of research and innovation funding. | Identification of firms engaged in publicly funded AI-related research within longlisting. |
| Survey of AI firms (Ipsos) | Multi-modal survey of 376 self-reported AI companies (May 2026). | Firm-level performance and perceptions; calibration of modelled estimates (for example, pre-revenue firms). |
| Depth interviews | Semi-structured interviews with 50 stakeholders spanning industry, academia, government policy, and investment. | Qualitative insight into growth drivers, enablers, and barriers. |
-
Company websites, social media, press releases, news articles. ↩
-
GOV.UK. Artificial Intelligence sector study 2022 (2023); Artificial Intelligence sector study 2023 (2024); Artificial Intelligence sector study 2024 (2025). ↩
-
OECD. Artificial intelligence. ↩
-
Including hardware, frameworks, software, libraries and platforms. ↩
-
Companies producing bespoke, value-adding AI solutions marketed and sold as products. ↩
-
Companies with AI expertise providing AI-related services. ↩
-
Large companies have more than 250 employees, medium-sized companies 50 to 249 employees, small companies 10 to 49 employees and micro companies 1 to 9 employees. ↩
-
Large companies have more than 250 employees, medium-sized companies 50 to 249 employees, small companies 10 to 49 employees and micro companies 1 to 9 employees. ↩
-
S&P Global. Essential Intelligence. Your AI Advantage. ↩
-
Schneider Electric (2025) Transforming data center services. ↩
-
GOV.UK (2025) Business population estimates 2025. ↩
-
The year-on-year change in the dedicated share of micro firms partly reflects improved coverage. Of the net increase of approximately 3,600 firms in the micro, dedicated cell, 2,140 are newly incorporated companies, with the remainder comprising pre-existing firms newly identified or reclassified through this year’s enhanced classification process. ↩
-
Companies that have been reviewed and verified as meeting study inclusion criteria. ↩
-
GOV.UK (2018) AI Sector Deal. ↩
-
GOV.UK (2021) National AI Strategy. ↩
-
GOV.UK (2025) AI Opportunities Action Plan. ↩
-
Capability definitions are available in Appendix 2. ↩
-
For context, large businesses account for 53% of turnover across the whole UK private sector, despite representing 0.6% of employer businesses (DBT Business Population Estimates 2025). However, this comparison should be treated as indicative only given significant differences in the datasets. ↩
-
Beauhurst algorithms collect information from Companies House, business websites and news articles. Data is also provided via data partnerships with granting bodies, investors, advisors, and universities. Data is manually verified by Beauhurst staff members. ↩
-
British Business Bank Investments, Future Fund, British Patient Capital, Northern Powerhouse Investment Fund (NPIF) and Midlands Engine Investment Fund (MEIF). ↩
-
Beauhurst (2026) How We Classify Company Stages of Evolution. ↩
-
Dedicated AI companies completing at least one fundraising in each year, by stage of evolution at the time of the deal, as a share of all dedicated companies raising that year (2025, 868). Companies raising at more than one stage within a year are counted at each stage, so shares may sum to slightly more than 100%.
Figures for all years are calculated from the current Beauhurst dataset and the 2026 study population of dedicated AI companies, and supersede those published in AISS 2024. Beauhurst data are revised continuously as unannounced fundraisings are captured from company filings, and the dedicated company population is re-identified at each study wave; historic figures therefore differ from previous editions. ↩ -
Note that the majority of project capital investment and job numbers were estimated by Financial Times fDi Markets analysts and should be considered as indicative. ↩
-
Vantage (2025) Vantage Data Centers Announces Opening of Second London Campus with Landmark Public Art Installation. ↩
-
Luma Labs (2025) Luma AI Opens for International Business With Former WPP Executive Jason Day Leading New London Office. ↩
-
Oracle (2025) Oracle Continues to Deliver on $5B Investment Plans with New AI Capabilities for UK Government and Defence Organisations. ↩
-
See: CoreWeave (2025) CoreWeave Announces £1.5 Billion Commitment to Power UK AI Innovation and Growth Through Sustainable Computing.
However, it is worth also noting that the precise scale of this investment has been debated: The Guardian (2026) Revealed: UK’s multibillion AI drive is built on ‘phantom investments’. ↩ -
Kyndryl (2025) Bengaluru-Based Alchemyst AI Expands to the UK. ↩
-
Analytics India (2025) Bengaluru-Based Alchemyst AI Expands to the UK. ↩
-
Google (2025) Our new Waltham Cross data center is part of our two-year, £5 billion investment to help power the UK’s AI economy. ↩
-
Harworth (2026) Harworth and Microsoft receive resolution to grant planning consent for hyperscale data centre and I&L space at Skelton Grange, Leeds. ↩
-
Mastek (2026) Mastek Expands Leeds Office, Strengthening AI-Led Innovation and Long-Term Commitment to the UK. ↩
-
Location data was compiled from Companies House registered office addresses and web-based evidence of operating locations (company websites, office listings, and filings). Of the 25,553 location records collected, 22,921 were verified and included in counts. ↩
-
GOV.UK (2025) Memorandum of Understanding between the Government of the United States of America and the Government of the United Kingdom of Great Britain and Northern Ireland regarding the Technology Prosperity Deal. ↩
-
The response rates among larger businesses were low despite targeted efforts to recruit them. Challenges included gatekeepers, getting through to the right person, and organisational policy not to take part in research studies. ↩
-
Office for National Statistics (2025) Annual Survey of International Trade in Services (AITIS). ↩
-
UN Statistics Division. Classifications on economic statistics. ↩
-
Note that partner countries are not necessarily countries in which goods are manufactured and may instead reflect international trade hubs, for example, Rotterdam in the Netherlands. Similarly, export data includes re-exports of goods not manufactured in the UK. ↩
-
Note that these findings are reflective of the survey population which includes a majority of respondents from micro or small sized businesses. ↩
-
Anthropic (2026) Statement on the US government directive to suspend access to Fable 5 and Mythos 5. ↩
-
Cloud services that are physically located in the UK but which could be owned or operated by non-UK-based companies. ↩
-
Note that respondents could select multiple responses to this question and therefore totals do not sum to 100%. ↩
-
Seed Enterprise Investment Scheme and Enterprise Investment Scheme. ↩