Apprenticeships and social mobility: technical report
Published 24 June 2020
Applies to England

© Crown copyright 2020
This publication is licensed under the terms of the Open Government Licence v3.0 except where otherwise stated. To view this licence, visit nationalarchives.gov.uk/doc/open-government-licence/version/3 or write to the Information Policy Team, The National Archives, Kew, London TW9 4DU, or email: psi@nationalarchives.gov.uk.
Where we have identified any third party copyright information you will need to obtain permission from the copyright holders concerned.
This publication is available at https://www.gov.uk/government/publications/apprenticeships-and-social-mobility-fulfilling-potential/apprenticeships-and-social-mobility-technical-report
Apprenticeships and social mobility: fulfilling potential
Technical report
June 2020
1. Introduction
London Economics were commissioned by the Social Mobility Commission to undertake an investigation of the effectiveness of the English apprenticeship system in fostering social mobility and of the impact of the recent reforms to the system on individuals from disadvantaged socio-economic backgrounds. This technical report provides supporting information to the study ‘Apprenticeship and Social Mobility: fulfilling potential’.
The technical report is organised into the following sections:
-
Data description, providing more detailed information on the data used in the study, the data matching strategy as well as the association between 2 measures of disadvantage available in the Longitudinal Education Outcomes data, namely the Income Deprivation Affecting Children Index (IDACI) and the free school meal registration criteria
-
Overview of disadvantaged neighbourhoods, presenting an overview of those neighbourhoods defined as disadvantaged throughout the study, using information from the 2011 census
-
Becoming an apprenticeship, providing supporting charts to the results presented in the main report on selection into apprenticeship training. To facilitate the navigation through the report, the information is organised in sub-sections reflecting the structure of the main report
-
Understanding the type of training received, providing supporting charts to the results presented in the main report on training quality. To facilitate the navigation through the report, the information is organised in sub-sections again reflecting the structure of the main report
-
Understanding apprenticeships’ completion and achievement, providing supporting information to the results presented in the main report on attrition
-
Progressing from apprenticeships into further and higher education, providing supporting information to the results presented in the main report on progression from apprenticeships to further and higher education
-
Entry into the labour market, providing supporting information to the results presented in the main report on labour market outcomes
2. Data description
2.1 Selection, training quality and attrition
The analysis of selection into apprenticeship, training quality and attrition (achievement rates) of the study ‘Apprenticeships and Social Mobility: fulfilling potential’ made use of information from a matched apprentice-employer dataset linking from several data sources, namely:
-
The Individualised Learner Record (ILR) for the academic years 2010/11 to 2017/18, providing administrative data on apprenticeships and other publicly funded training in England
-
The Inter-Departmental Business Register (IDBR) for the period 2010/2018 (September extracts), providing information on UK businesses
-
The English Index of Multiple Deprivation (2010)
Information on each dataset individually, as well as a detailed description of the ILR/EDS-IDBR matching strategy, is provided in this section.
Individualised Learner Record (ILR)
Information on apprenticeships and other publicly-funded training in England is recorded in the Individualised Learner Record (ILR), which collects data from further education and training providers receiving funding from the Education and Skills Funding Agency (ESFA) on:
-
Training characteristics, such as type of aim, start and end date, completion and achievement
-
Demographic characteristics of trainees (apprentices), such as age at start, gender, postcode of prior domicile and postcode at the time of the training, prior educational attainment
-
Providers’ characteristics, such as location, funding source
The ILR additionally includes an employer identifier for training undertaken through the employer. The ESFA commissioned a third-party provider (Blue Sheep) to collect information on the employers engaging publicly funded training. This firm-level information is based on a variety of sources and is compiled in a database called ‘Employer Data Service’ (EDS). Using the firm-level characteristics available in the EDS, it is possible to match with the IDBR, which is the official source of information for businesses in the UK and allows for further linking to ONS’ surveys. Read more about the ILR.
Inter-Departmental Business Register (IDBR)
The Inter-Departmental Business Register (IDBR) is the comprehensive list of businesses registered in the UK, covering approximately 2.6 million live businesses across all economic sectors.[footnote 1] The IDBR is organised at enterprise (and enterprise group), local unit and reporting unit-levels and reports information on employment, turnover and industry, gathered from a number of data sources, including: the Value Added Tax (VAT) system from HMRC (Customs) and Pay As You Earn (PAYE) from HMRC (Revenue). Read a detailed description of the IDBR.
English Index of Multiple Deprivation (IMD)
The 2010 Index of Multiple Deprivation (IMD) provides a geographical measure of disadvantage by assigning each neighbourhood in England - or Lower-layer Super Output Area (LSOA) - a rank from 1 (most deprived) to 32,844 (least deprived). The IMD combines information on 7 dimensions, each of these representing a specific form of deprivation experienced by individuals. These dimensions are:
- Income
- Employment
- Health
- Crime
- Housing
- Living environment
- Education deprivation
In England, in 2010, there were 32,844 LSOAs, with populations ranging between 1,000 and 3,000 individuals, thus identifying relatively homogeneous geographical area in terms of socio- economic background. Additional information on the 2010 IMD is available.
In order to identify apprentices from disadvantaged backgrounds, each apprentice was assigned an IMD rank on the basis of the postcode of domicile prior to the start of the training programme, as reported in the ILR. In case the information on previous postcode of domicile was missing or mis-recorded, the corresponding IMD rank was assigned on the basis of the postcode of the apprenticeship provider. Finally, consistent with the academic literature on deprivation, we defined ‘disadvantaged’ as encompassing those apprentices originating from the 20% most deprived English neighbourhoods.[footnote 2]
ILR-EDS/IDBR matching – Data Matching Approach
In order to identify employers’ information for apprentices in the ILR, we linked the ILR to the IDBR via the EDS for the period 2010/11 to 2017/18.[footnote 3] The match was undertaken linking the EDS data for companies with at least one training aim to the September IDBR extract after the end of each academic year (for example, September 2018 for the 2017/18 ILR).
The matching strategy is described in detail in the technical report for the CVER BN003.[footnote 4] However, compared to the description provided in the CVER briefing note, the approach has been revised with the inclusion of the following steps:
-
A pre-standardisation of company names for selected large companies with multiple units, so that they appear with the same name in both datasets and are more easily matched
-
We assigned the correct ‘entref’ to EDS entities genuinely identifying recruitment companies (for example, ‘Hays’ and ‘Carillion’) and dropped the IDBR records identifying these companies to ensure there was no mismatch[footnote 5]
-
We undertook a manual review of the most frequent company (and parent company) names left unmatched at the end of the process, and manually assigned records to the correct enterprise when possible. This was introduced to reduce the number of units belonging to large organisations left unmatched. In this final stage we did not match records with generic names not leading to a specific employer (for example, ‘corner shop’ and ‘the surgery’) and companies operating with franchising stores not matching to specific local units in the IDBR (for example, fast food companies)
-
Based on our manual assessment of units matched via Company Registration Number (CRN), we amended the matching priority (more information on ‘priority’ rules is provided below)
-
We also manually reviewed records matching to both live and non-live units to assess whether the match on live units should always be retained over the match on non-live units
Table 1: Description of main changes
| Stage | Description | Major changes |
| Cleaning | Minor changes in the sort order in various stages (for example, priority given to IDBR units with larger employment when same name but different entref) | |
| Stage 1 | Company name and postcode | |
| Stage 2 | EDS company name matched to IDBR trading name and postcode | Added a step swapping company name and trading name |
| Stage 3 | Company name and postcode district or EDS company name matched to IDBR trading name and postcode district | |
| Stage 4 | First 7 letters of company/trading name, postcode (with/without SIC code) | Removed entries with “pension scheme” in the trading name |
| Stage 5 | Parent/Ultimate name and postcode | New stage – information seems good |
| Stage 6 | First word of company name/trading name and postcode and company name without vowels and postcode | Small number of matches on company name without vowels are now included here |
| Stage 7 | Company name/First 11 letters of company name and postcode area | Use postcode sector/district with checks and postcode area if the company name does not appear anywhere else in the IDBR |
| Stage 8 | Trading name and postcode area | Use postcode sector/district with checks (no postcode area). Remove generic names (such as “wine store”). |
| Throughout the following stages, we identify council units in the IDBR, as schools and libraries are recorded as local council units | ||
| Stage 9 | First 7 letters of address (IDBR), company name, postcode and SIC code | |
| Stage 10 | Full SIC 2007 and postcode | |
| Stage 11 | 3-digit SIC 2007 and postcode | Added specific code to identify further schools, nurseries and care homes |
| Stage 12 | Reverse first 7 letters of company name and postcode | Removed common names (for example, services, solutions ) |
| Stage 13 | Last word of company name and postcode | Removed common names and names identifying the main geographical area |
| Stage 14 | Postcode and company name similarity | Removed postcode area name from company name. Tried to identify acronyms. |
| Stage 15 | Postcode and building number | New stage based on postcode and building number. Common names are removed and there are the usual checks on name similarity. |
| Stage 16 | Probabilistic matching based on company name and postcode | |
| Stage 17 | Company name (groups sharing same enterprise reference number) | The validation rules now refer to the group (rather than enterprise) level. We also manually added entrefs for large companies left unmatched at the end of the matching process. |
Source: London Economics
At the end of the process we combined information from the different matching steps (matching on live local units, matching on non-live local unit, matching based on Company Registration Number) to produce the final matched dataset according to the following ‘priority’ rules:
- match leading to live units were given priority on all other matches
- conflicting matches: When the match on non-live units is of high quality (stages 1 to 6) and the match on live units is of relatively low quality (stages 11 and below), we replace with the match based on non-live unit if the enterprise is live or dissolved within the last 2 years (although the matching unit is no longer live, the enterprise may still be live)
- match based on non-live units when matched stage live is missing and death date is in the last 5 years
- match based on company registration number
- match based on remaining non-live units (matching to long dissolved enterprises)
Matching rates
The matching rates of apprenticeship starts from the ILR and the IDBR for the academic years 2010/11-2017/18 are reported in Table 2. On average, the matching exercise identified employers’ information for about 92.0% of apprenticeship starts. The strategy appears to be more effective for the recent academic years compared to the previous periods, with the matching rate increasing from 89.3% in 2010/11 to 94.8% in 2017/18.
Table 2: ILR/EDS-IDBR matching rates for apprenticeship starters in each academic year, 2010/11-2017/18
| Apprenticeship starts | 2010/11 | 2011/12 | 2012/13 | 2013/14 | 2014/15 | 2015/16 | 2016/17 | 2017/18 | Total |
| Linked to the IDBR | 89.3% | 90.0% | 91.4% | 91.6% | 92.3% | 93.0% | 93.8% | 94.8% | 92.0% |
| Not linked to the IDBR | 10.7% | 10.0% | 8.6% | 8.4% | 7.7% | 7.0% | 6.2% | 5.2% | 8.0% |
Source London Economics’ analysis of ILR/EDS-IDBR matched data (2010/11-2017/18)
In order to understand potential biases in the analysis of employer’s characteristics introduced by the matching exercises, in the 3 panels in Figure 1 we present demographic and apprenticeship characteristics of apprenticeship starters that have been successfully linked to the IDBR and those who were left unmatched.
Figure 1: Characteristics of matched and unmatched starters, 2010/11-2017/18 pooled data

Matched and unmatched apprenticeship starters were evenly distributed across gender. However, some differences in the 2 groups exist with respect to:
- age at start of the programme: unmatched starters were generally younger than matched starters.
In particular:
-
32.3% of unmatched starters were aged 19 or below, compared to 25.2% of matched starters
-
36.0% of unmatched starters were aged over 24, compared to 43.4% of matched starters
-
apprenticeship level: 62.3% of unmatched starters undertook an apprenticeship at Intermediate-level, compared to 58.0% of matched starters
2.2 Progression and labour market outcomes
The analysis of progression into further and higher education and labour market outcomes of the study ‘Apprenticeships and Social Mobility: fulfilling potential’ made use of information from the Longitudinal Education Outcomes (LEO) data for the period 2001/02-2016/17.
The Longitudinal Education Outcomes (LEO) data
The LEO data combines information on education enrolment and attainment at school, further education colleges and higher education institutions (derived from the NPD, ILR and HESA respectively) with data on earnings, employment and benefits (derived from HMRC and DWP data). In this study, we focused on the 3 cohorts of English-domiciled pupils undertaking key stage 4 in the academic years 2001/02, 2002/03 and 2003/04 and subsequently enrolling into an apprenticeship program. Information from the various datasets is available up to the academic (or financial, depending on the dataset) year 2016/17, thus allowing us to follow pupils from the cohorts of interest up to age 28 to 30, depending on the cohort.
In order to identify individuals from disadvantaged backgrounds in LEO, the study made use of information on the Income Deprivation Affecting Children Index (IDACI), collected at key stage 4 and directly available in LEO. The IDACI is an area-based indicator, assigning a deprivation score (from 0 ‘least deprived’ to 1 ‘most deprived’) to each Lower Layer Super Output Areas (LSOAs) in England. For each LSOA, it measures the proportion of all children aged 0 to 15 living in income deprived families (i.e. defined as being in receipt of income based jobseeker’s allowance or pension credit, or those not in receipt of these benefits but in receipt of child tax credit with an equivalised income, excluding housing benefits, below 60% of the national median before housing costs).
Exploring the association between Income Deprivation Affecting Children Index (IDACI) and Free School Meal (FSM) registration
Along with the IDACI, the LEO data additionally provides information on whether the pupil was registered for Free School Meals (FSM) at KS4. Pupils are eligible for free school meals if their parents receive some form of income support (income support, income-based jobseeker’s allowance, income-related employment and support allowance). In order to claim FSM for their child, parents must submit an application to the relevant authority (local authority or school, depending on local rules).
Traditionally, the academic literature has made use of both the Income Deprivation Affecting Children Index (IDACI) and registration for free school meals (FSM) to measure deprivation for young people in England. However, despite being widely used in education research, a recent study[footnote 6] has cast doubt on the reliability of the free school meals indicator as a measure of deprivation, suggesting that, while labelled as ‘FSM eligibility’, this indicator fails to identify pupils who are eligible for free school meals but do not claim them.[footnote 7] Additionally, the eligibility criteria have been modelled in the past and illustrated that a family can be below the relative poverty line but ineligible for free school meals.[footnote 8] However, other studies find that while the FSM indicator is subject to many limitations, there are also challenges associated with other potential measures.[footnote 9] To provide a better understanding of these 2 measures of deprivation, in the next section we further explore the association between the 2 measures of disadvantage using evidence from LEO data.
Evidence from the Longitudinal Education Outcomes dataset
Data description
In order to understand the association between the 2 measures of disadvantage previously discussed, we used information from the Longitudinal Education Outcomes (LEO) dataset for the cohorts of English-domiciled pupils completing KS4 in 3 consecutive academic years: 2001/02, 2002/03 and 2003/04. After excluding pupils with no IDACI or FSM registration information (mostly pupils attending ‘other independent’ schools at KS4), the final dataset comprised around 1.5 million pupils.
Individual-level data were then combined at Lower Layer Super Output Area (LSOA) level in order to compute the proportion of pupils in the 3 cohorts of interest registered for free school meals in each LSOA. After restricting the dataset to LSOAs with at least 10 pupils from the 3 cohorts of interest, the final data comprised 31,999 LSOAs. The average number of pupils in each LSOAs was 48 (combining the 3 cohorts of interest). More generally, it should be noted that for LSOAs the minimum population is 1,000 and the maximum is 3,000, indicating that they typically identify highly homogenous areas.[footnote 10]
IDACI is typically an appropriate proxy for disadvantage status at a young age, as the index measures the proportion of all children aged 0 to 15 living in income deprived families in the LSOA and, for the cohorts used, is measured between 2002 and 2004 (when pupils were aged 15).[footnote 11]
Findings
Are more disadvantaged areas characterised by a higher concentration of free school meal registered pupils?
Consistent with the available literature, the analysis suggests a strong association between the IDACI score assigned to each area and the proportion of Free School Meals registered pupils in that area, with a correlation coefficient between the 2 variables of 0.87.[footnote 12] This is depicted in Figure 2, which shows data points for the IDACI score and the percentage of FSM registered pupils associated with each LSOA as well as the linear fit (in red).
Figure 2: IDACI score and % of FSM registered pupils for English LSOAs, data points and linear fit
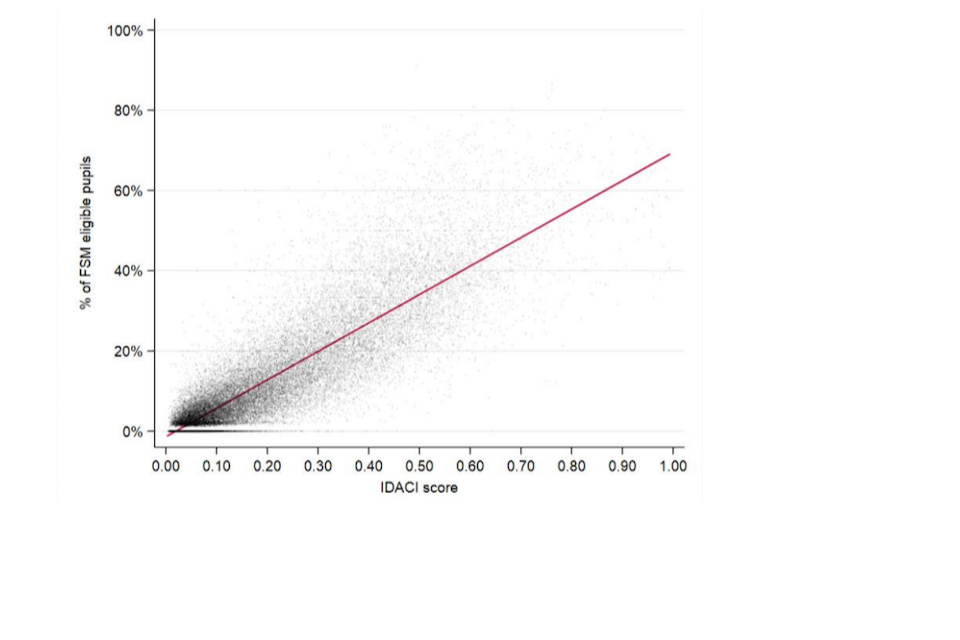
Source: London Economics’ analysis of Longitudinal Education Outcome (LEO) data (2001/02-2016/17)
Following the approach used in the main report, we classified LSOAs as ‘disadvantaged’ (or ‘non-disadvantaged’) according to their IDACI ranking position: those LSOAs belonging to the 2 most deprived deciles of the IDACI are classified as ‘disadvantaged’ with the remaining LSOAs being classified as ‘non-disadvantaged’. Figure 3 displays, in orange, data points for disadvantaged LSOAs (right hand side of the chart) and, in grey, data points for non- disadvantaged (left hand side of the chart).
Having reclassified the LSOAs into 2 groups, it is possible to look at the characteristics of the 2 groups in terms of percentage of FSM registered pupils. For this purpose, in Figure 4, we display the frequency distribution of the percentage of FSM registered pupils for areas defined as ‘disadvantaged’ (in orange) and ‘non-disadvantaged’ (in grey) separately. The Y-axis shows the proportion (frequency) of LSOAs in that group (for example, disadvantaged) with a specific value of the FSM variable (for example, the spike on the left hand side of the chart shows that 20% of non- disadvantaged LSOAs have no pupils in receipt of FSM - 0%).
On average, 33% of pupils from the 3 cohorts of interest living in disadvantaged areas were registered for free school meals (as opposed to 8% of those in ‘non-disadvantaged’ areas). However, the data indicates some within-group variation: the proportion of pupils registered for FSM ranges from between 0% to more than 90% for LSOAs classified as ‘disadvantaged’, with a standard deviation of 13.5 percentage points. Conversely, in the non-disadvantaged group, the distribution appears to be more concentrated, with half of the LSOAs having 5% or fewer pupils registered for free school meals. The long-right tail of the distribution for non-disadvantaged areas determines the discrepancies between the median and the average value in this group.
Figure 3: IDACI score and % of FSM registered pupils of English LSOAs, data points by group
Figure 4: Distribution of the percentage of FSM registered pupils of English LSOAs, by group
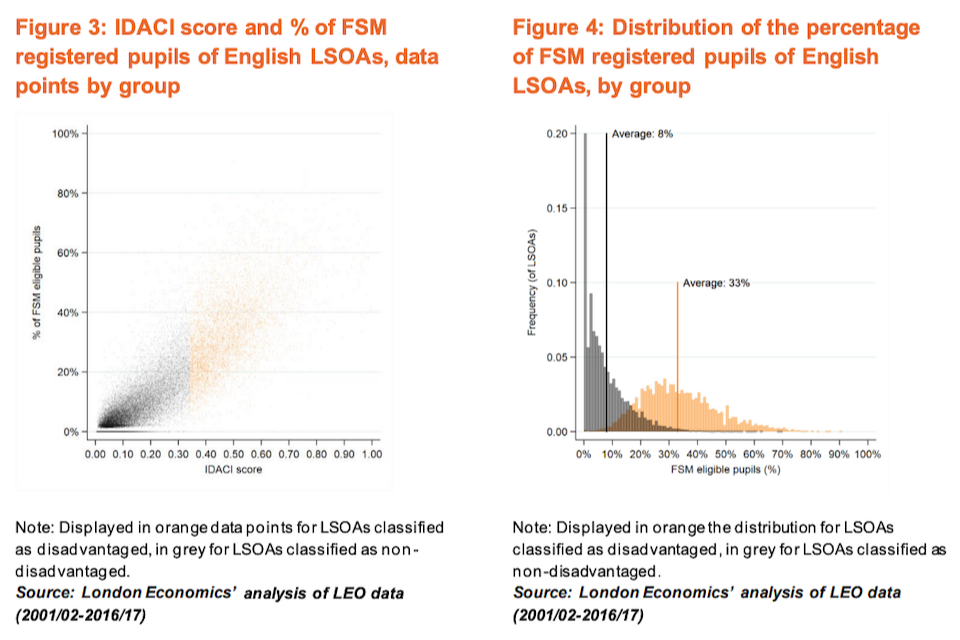
Note: Displayed in orange the distribution for LSOAs classified as disadvantaged, in grey for LSOAs classified as non-disadvantaged. Source: London Economics’ analysis of LEO data (2001/02-2016/17)
Finally, in Table 3, we show how the average proportion of FSM varies along the IDACI score distribution, if we divide the LSOAs into 5 equal groups based on the value of the quintiles. The group of most deprived LSOAs corresponds to the disadvantaged definition used in the Social Mobility Commission analysis and, as already mentioned, around one third of pupils in these areas were in receipt of FSM at age 15. The corresponding proportion in the group identifying the 20% of areas slightly less deprived (i.e. second most deprived quintile) stands at 16.4%. More generally, the proportion of pupils in receipt of FSM roughly doubles as we move from one quintile to the next (from less to more deprived areas), starting from just 1.8% in the quintile of least deprived LSOAs.
Table 3: Average IDACI score and % of FSM registered pupils by quintile of IDACI distribution
| Quintiles of IDACI score distribution | |||||
| Least deprived 20% of LSOAs | 2^ | 3^ | 4^ | Most deprived 20% of LSOAs | |
| Average IDACI score | 0.03 | 0.08 | 0.15 | 0.26 | 0.48 |
| Average % of FSM registered pupils | 1.8% | 4.1% | 8.3% | 16.4% | 33.3% |
Note: The most deprived 20% of LSOAs identifies disadvantaged areas in the definition used. Source: London Economics’ analysis of LEO data (2001/02-2016/17)
Would the 2 measures of disadvantage identify the same pupils?
Despite the strong positive correlation observed between the IDACI score (and the subsequent recoding based on ranking decile) and the percentage of free school meal registered pupils at LSOA level, at individual level there may be pupils belonging to an area classified as ‘disadvantaged’ but not registered for free school meals (or vice versa). For this reason, the 2 measures are not equivalent in terms of classification of pupils into the 2 groups of ‘disadvantaged’ and ‘non-disadvantaged’. As displayed in Figure 5, the 2 measures are consistent for around 80% of pupils: in fact, 72% of pupils from the 3 cohorts of interest are classified as ‘non-disadvantaged’ using both measures and 7% are classified as ‘disadvantaged’ irrespective of the measure used. However, 15% of pupils are only classified as disadvantaged when using the IDACI-based measures, while 6% of pupils would be classified as disadvantaged if we use the FSM-registration criteria instead.
Figure 5: Proportion of pupils from the 3 cohorts defined as disadvantaged using the 2 measures of disadvantage

Measuring disadvantaged in LEO
Overall the analysis indicated a strong and positive association between the IDACI score and the proportion of free school meal registered pupils in each LSOA, with a correlation between the 2 measures of disadvantage of 0.87. Additionally, classifying LSOAs as ‘disadvantaged’ and ‘non-disadvantaged’ based on their IDACI ranking position, the analysis suggested that 33% of pupils from ‘disadvantaged’ areas were registered for FSM compared to 8% in ‘non- disadvantaged’ areas.
Despite this positive association, it is important to note that the 2 measures of disadvantage do not necessarily identify the same pupils (i.e. some pupils are classified as disadvantaged according to one definition but non-disadvantaged according to the other). This is the case because the IDACI-based indicator measures the ‘average’ socio-economic status of the residential area of the pupil, whereas the free school meal registration is individual-specific and provides a tool to distinguish specific individual circumstances from the average socio-economic status of the area of residence. As a result, the classification of pupils as ‘disadvantaged’ and ‘non-disadvantaged’ depends pivotally on the measure of disadvantage under consideration (though being consistent for 80% of the pupils in the available cohorts). This is factored in in the main report, where the following approach was undertaken:
-
for consistency with the analysis based on the Individualised Learner Record data, the IDACI-based measure of ‘disadvantage’ is use as main definition of ‘disadvantage’, however[footnote 13]
-
to capture individual-level variation in socio-economic status within areas, the econometric analysis also controls for free school meals registration
3. Overview of disadvantaged neighbourhoods
Data from the 2011 census can be used to better understand the characteristics of individuals living in those neighbourhoods defined as disadvantaged and how these compare to those from non-disadvantaged areas. Reflecting the geographical locations of disadvantaged areas, the regions with the highest concentration of disadvantaged learners in 2011 were the north-west and London - both characterised by large urban agglomerations - accounting for 21.3% and 20.8% of the overall disadvantaged population, respectively. Other regions with large proportions of disadvantaged were the west Midlands (14.9% of all disadvantaged) and Yorkshire and the Humber (13.7%). In contrast, 22.1% of the non-disadvantaged population lived in the south-east (compared to 6.6% of disadvantaged).
Figure 6: Disadvantaged and non-disadvantaged population by region of residence in 2011
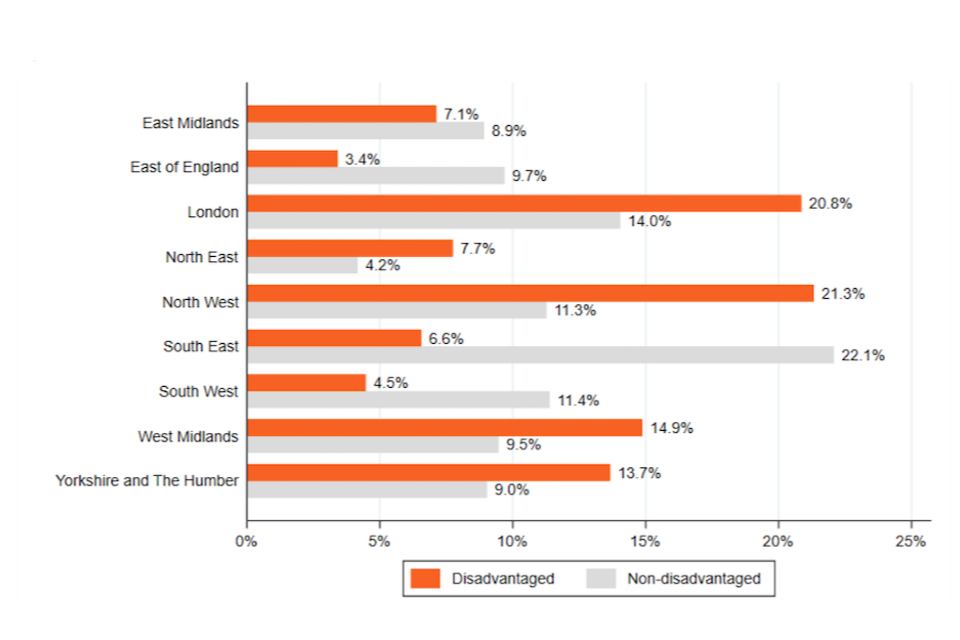
Source: London Economics’ analysis of 2011 Census data and IMD (2010) data
There appear to be some differences in the demographic characteristics of the disadvantaged population compared to non-disadvantaged. Whereas, as expected, the gender distribution is essentially identical between the 2 groups (50.6% and 50.9% of females for disadvantaged and non-disadvantaged respectively), the disadvantaged population appear to be younger than the non-disadvantaged population (Figure 7). Indeed:
-
22.3% of those living in disadvantaged areas in 2011 were aged 15 or below compared to 18.0% of non-disadvantaged
-
In aggregate, 52.9% of those living in disadvantaged areas in 2011 were aged 34 or below, compared to 42.0% of non-disadvantaged
-
Only 12.2% of those living in disadvantaged areas in 2011 were aged 65 or above, compared to 17.4% in non-disadvantaged areas
Figure 7: Gender and age composition of disadvantaged and non-disadvantaged neighbourhoods in 2011
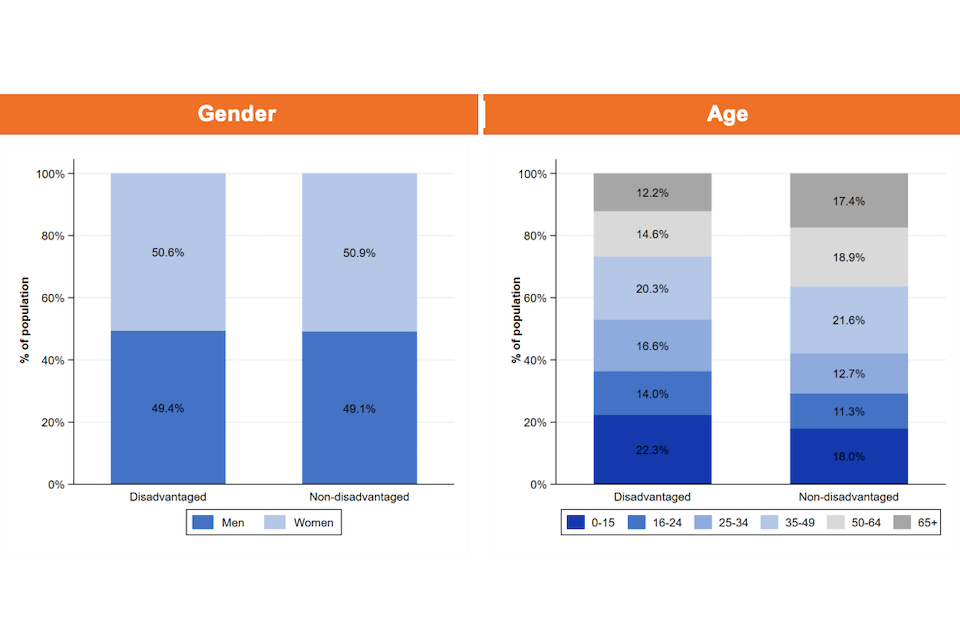
Source: London Economics’ analysis of 2011 Census data and IMD (2010) data
Additionally, substantial differences existed in terms of ethnic backgrounds of individuals belonging to the 2 groups, with individuals from BAME backgrounds accounting for larger population shares in disadvantaged neighbourhoods than in non-disadvantaged areas. This is shown in Table 4, which presents the ethnic composition of disadvantaged and non- disadvantaged areas as well as the gap between the 2 groups (in percentage points).[footnote 14] In fact, only 66.0% of those living in disadvantaged areas were white-British, compared to 83.3% of those in non-disadvantaged areas. Conversely, there was a larger representation of all other ethnic groups in disadvantaged areas, with large discrepancies for the:
-
Asian-Pakistani population, accounting for 5.4% of the disadvantaged population and 1.3% of non-disadvantaged population
-
Black-African population, accounting for 4.4% of the disadvantaged population and 1.2% of the non-disadvantaged population
Table 4: Ethnic composition of disadvantaged and non-disadvantaged neighbourhoods in 2011
| White | Asian | Black | Other | |||||||
| British | Other | Indian | Pakistani | Bangladeshi | Other | African | Caribbean | Other | Other/ mixed | |
| Non- disadvantaged | 83.3% | 5.4% | 2.5% | 1.3% | 0.4% | 2.1% | 1.2% | 0.8% | 0.3% | 2.8% |
| Disadvantaged | 66.0% | 6.8% | 3.1% | 5.4% | 2.4% | 2.9% | 4.4% | 2.4% | 1.3% | 5.3% |
| Gap | -17.3pp | 1.5pp | 0.6pp | 4.1pp | 2.0pp | 0.9pp | 3.2pp | 1.6pp | 0.9pp | 2.5pp |
Source: London Economics’ analysis of 2011 Census data and IMD (2010) data. Contains National Statistics data
Finally, we looked at the proportion of the population reporting being affected by some form of disability in the 2 groups. Following the 2011 census, the definition of disability here considered refers to ‘a long-term health problem or disability that limits a person’s day-to-day activities (limited a lot/limited a little), and has lasted, or is expected to last, at least 12 months’. The proportion of people reporting some form of disability stood at 21.2% for individuals from the disadvantaged group and 16.7% for those from non-disadvantaged (Figure 8). If we limit the definition to those with disabilities with a high impact on day-to-day activities, the figures stood at 11.3% and 7.6% for the 2 groups, respectively.
Figure 8: Proportion of population affected by disability, by disadvantaged and non- disadvantaged neighbourhoods in 2011

Note: Due to rounding errors, totals may not sum to 100%. Source: London Economics’ analysis of 2011 Census data and IMD (2010) data
4. Becoming an apprentice
This section provides supporting charts to the analysis of selection into apprenticeship training presented in the main report. To facilitate the navigation through the report, the structure of this section reflects the structure of the main report.
4.1 Employer’s characteristics
Supporting tables and charts: levy-support
Figure 9 provides information on the proportion of levy-supported apprenticeship starts in 2017/18 by region of origin of the apprentice and disadvantaged background. The upper panel of the chart displays the difference in percentage points in the share of levy-supported starts across the group of disadvantaged and non-disadvantaged apprentices. A negative gap (i.e. below the horizontal) indicates that a larger proportion of starts from non-disadvantaged backgrounds were levy-supported, compared to starts by learners from disadvantaged backgrounds.
Figure 9: Proportion of levy-supported apprenticeship starts by region of origin of the apprentice and disadvantaged background
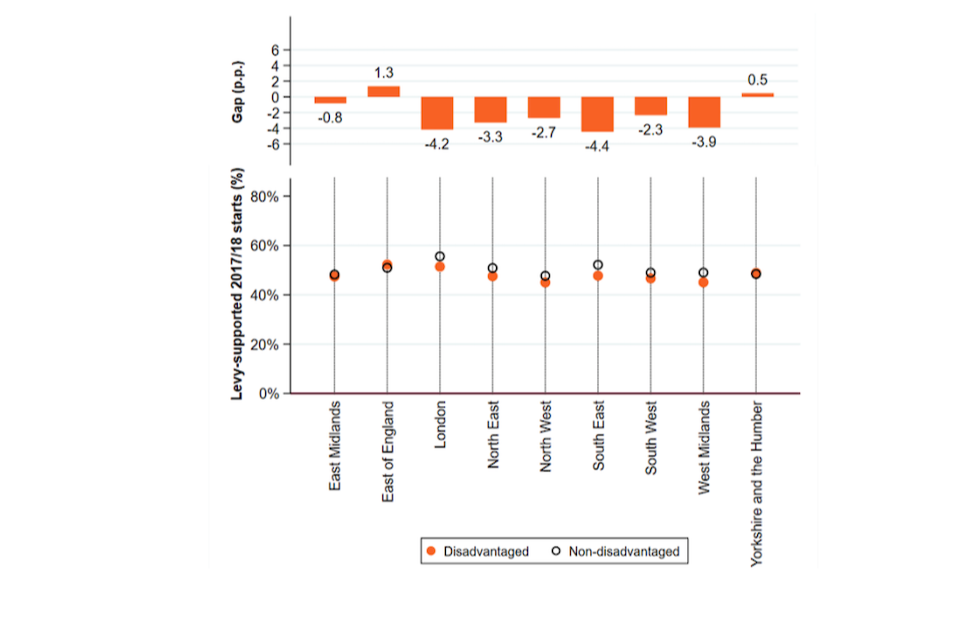
Source: London Economics’ analysis of ILR (2017/18) and IMD (2010) data
Figure 10 provides information on the proportion of levy-supported apprenticeship starts in 2017/18 by region of origin of the apprentice and disadvantaged background - further disaggregated by level of the apprenticeship. The upper panel of the chart displays the difference in percentage points in the share of levy-supported starts across the group of disadvantaged and non-disadvantaged learners. Again, a negative gap indicates that a larger proportion of starts from non-disadvantaged background were levy-supported compared to disadvantaged learners.
Figure 10: Proportion of levy-supported apprenticeship starts by region of origin of the apprentice, level of the apprenticeship and disadvantaged background
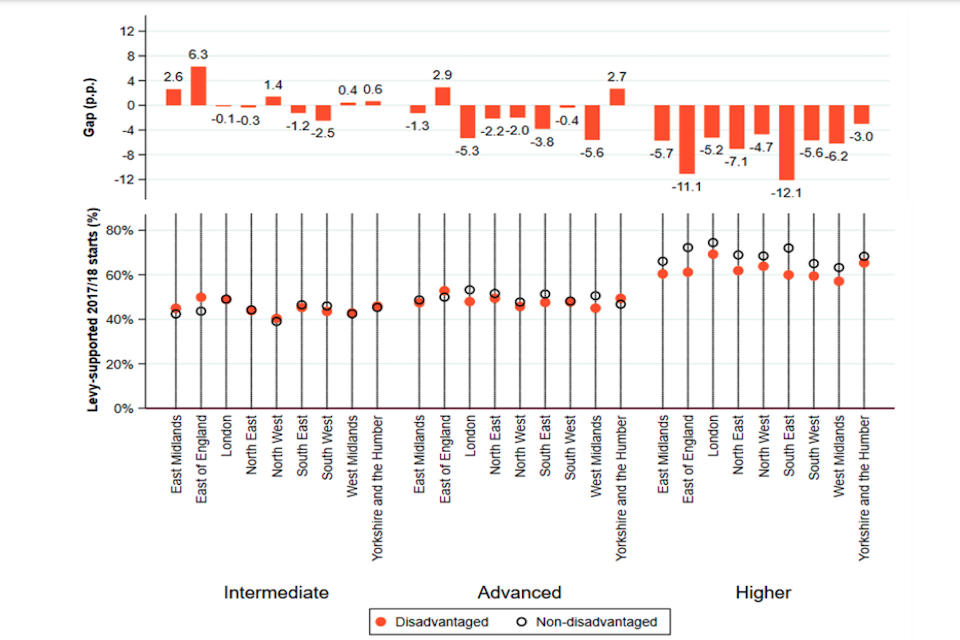
Source: London Economics’ analysis of ILR (2017/18) and IMD (2010) data
5. Understanding the type of training received
This section provides supporting charts to the analysis of training ‘quality’ or ‘value’ presented in the main report. To facilitate the navigation through the report, the structure of this section reflects the structure of the main report.
Supporting tables and charts: Level of apprenticeship starts
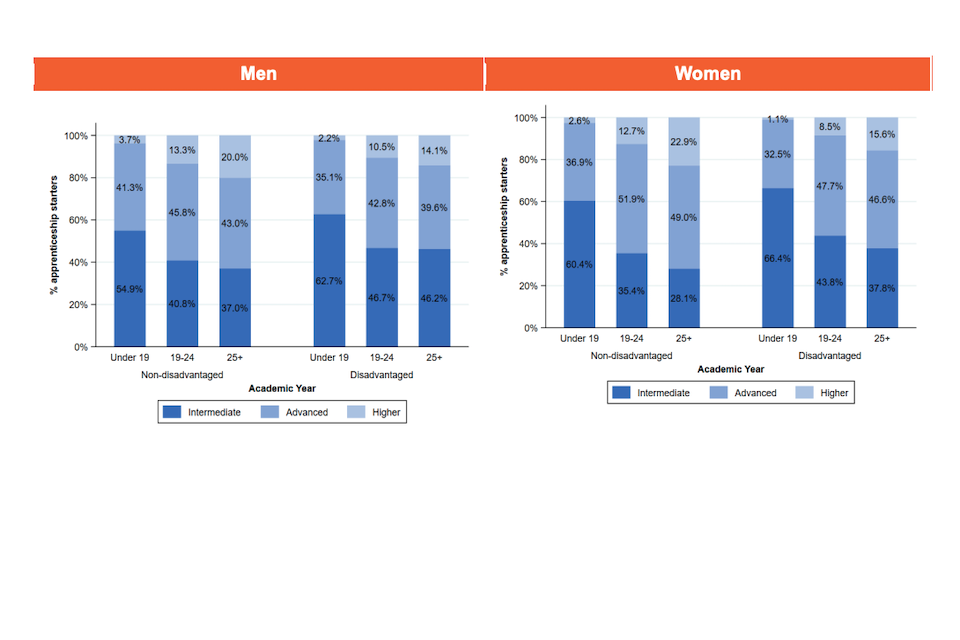
Figure 11 provides information on the level-composition of 2017/18 starters by disadvantaged and non-disadvantaged socio-economic backgrounds further disaggregated by age band (measured at start of the programme) and gender.
Figure 11: Apprenticeship level by disadvantaged status, gender and age band (2017/18)
Supporting tables and charts: Planned training duration at the start of the apprenticeship
Figure 12 provides information on the average planned duration of apprenticeship starts between the academic years 2015/16 and 2017/18 by subject area of study and level. The chart depicts the clear association between subject area and level of the apprenticeship and average planned duration, as well as the increase in the average duration of apprenticeship programme over time.
Figure 12: Average planned duration of apprenticeship training by subject area of study and level, 2015/16-2017/18
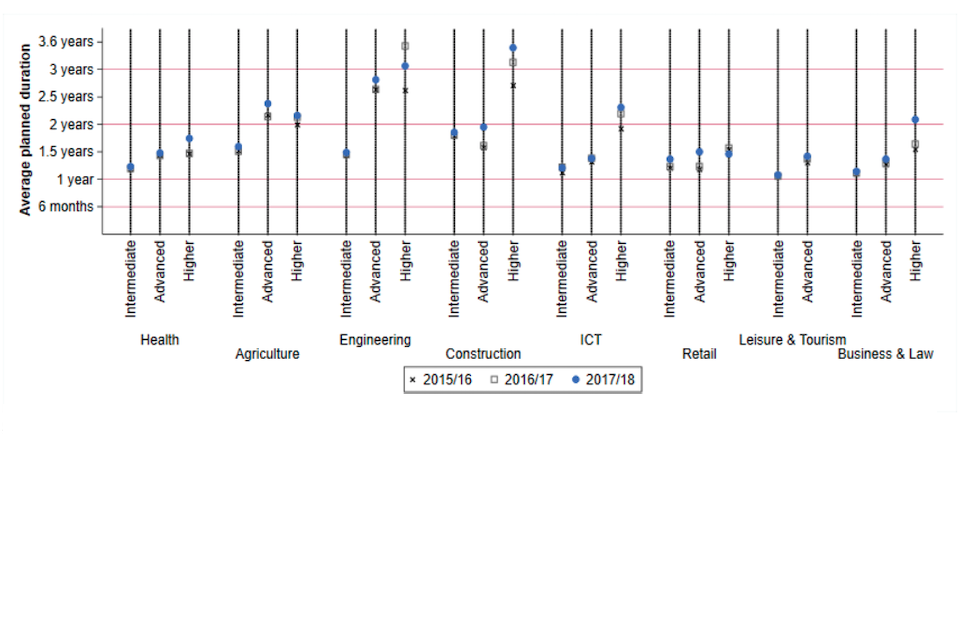
Source: London Economics’ analysis of ILR (2015/16 and 2017/18) and IMD (2010)
6. Understanding apprenticeships’ completion and achievement
This section provides supporting information to the analysis of attrition presented in the main report.
6.1 Data description
The analysis of attrition made use of information from the apprentice-employer matched dataset combining information from the ILR, the IDBR and the 2010 IMD.
In order to allow for sufficient training time, however, we restrict the analysis in this section to apprenticeships that started during the academic years 2013/14 and 2014/15 and track these apprentices for 36 months up to the academic years 2016/17 and 2017/18, respectively. The relevant ILR data was transformed into an ‘attrition database’ recording every apprenticeship start in the relevant period and the entire educational history associated with each start. Furthermore, following the Department for Education’s business rules, we exclude from the database any apprenticeships that resulted in a transfer to a different programme or provider, or withdrew from the apprenticeship within the funding qualifying period.[footnote 15]
As reported in Table 5, the sample used for this analysis comprises 236,613 intermediate apprenticeships, 119,355 advanced apprenticeships and 7,491 higher apprenticeships (total 363,459) for the 2013/14 academic year and 245,894 intermediate apprenticeships, 150,968 advanced apprenticeships and 16,331 higher apprenticeships (total 413,193) starting in 2014/15. For the purpose of this analysis, we pool together the 2 cohorts which allows for a richer analysis at the disaggregated level.
Table 5: Sample sizes after application of DfE’s business rules
| 2013/14 | 2014/15 | |||||
| Disadvantaged | Non- disadvantaged | All | Disadvantaged | Non- disadvantaged | All | |
| Intermediate | 62,897 | 173,716 | 236,613 | 67,325 | 178,569 | 245,894 |
| Advanced | 26,259 | 93,096 | 119,355 | 35,079 | 115,889 | 150,968 |
| Higher | 1,521 | 5,970 | 7,491 | 3,710 | 12,621 | 16,331 |
| All | 90,677 | 272,782 | 363,459 | 106,114 | 307,079 | 413,193 |
Source: London Economics’ analysis of the ILR (2013/14-2017/18) data and IMD (2010) data
6.2 Descriptive analysis
Supporting tables: Average actual duration of apprenticeships
Table 6 provides detailed information on the actual duration (in days) of the training, disaggregated by level of the apprenticeship, gender, age and disadvantaged status. Actual duration is calculated as the difference between end date and start date, and has been adjusted to account for apprentices who temporarily withdrew by deducting the amount of time when an apprentice had a temporary spell of absence from the apprenticeship. The figures have been obtained by pooling together apprenticeship starts in the academic year 2013/14 and 2014/15. A dash (-) indicates that there were fewer than 100 learners in a cell and the figure was omitted.
Table 6: Actual duration (days) of apprentices who completed and achieved within 3 years
| Men | Women | ||||||
| Age group | Disadvantaged | Non- disadvantaged | Diff. | Disadvantaged | Non- disadvantaged | Diff. | |
| Intermediate | |||||||
| Under 19 | 513.3 | 533.1 | -19.8 | 441.1 | 448.8 | -7.7 | |
| 19 to 24 | 459.5 | 467.9 | -8.4 | 423.2 | 415.4 | 7.7 | |
| 25 and over | 439.7 | 440.7 | -1.0 | 444.6 | 439.5 | 5.1 | |
| All | 465.3 | 481.8 | -16.5 | 437.3 | 434.9 | 2.5 | |
| Advanced | |||||||
| Under 19 | 547.1 | 588.0 | -40.9 | 498.5 | 497.1 | 1.4 | |
| 19 to 24 | 526.4 | 543.8 | -17.4 | 483.5 | 477.0 | 6.6 | |
| 25 and over | 496.8 | 501.7 | -5.0 | 495.3 | 489.6 | 5.7 | |
| All | 521.3 | 547.3 | -26.1 | 491.8 | 486.4 | 5.4 | |
| Higher | |||||||
| Under 19 | 686.8 | 726.6 | -39.8 | - | - | - | |
| 19-24 | 660.9 | 652.9 | 7.9 | 573.3 | 599.5 | -27.2 | |
| 25 and over | 497.3 | 544.3 | -47.0 | 529.5 | 543.6 | -14.2 | |
| All | 558.0 | 612.9 | -54.9 | 535.8 | 554.9 | -19.1 |
Note: Duration rates for completion and achieved within 36 months. Actual duration is calculated as the difference between end date and start date and has been adjusted to account for apprentices who temporarily withdrew by deducting the amount of time when an apprentice had a temporary spell of absence from the apprenticeship. Pooled over academic years 2013/14 and 2014/15. A dash (-) indicates that there were fewer than 100 learners in a cell and the figure was omitted. Source: London Economics’ analysis of the ILR (2013/14-2017/18) data and IMD (2010) data
Supporting tables: Achievement rates at 36 months
Table 7 provides detailed information on achievement rates at 36 months, disaggregated by level of the apprenticeship, gender, age and disadvantaged status. The figures have been obtained by pooling together apprenticeship starts in the academic year 2013/14 and 2014/15. A dash (-) indicates that there were fewer than 100 learners in a cell and the figure was omitted.
Table 7: Achievement rates at 36 months by apprenticeship level, gender, age and disadvantaged status
| Men | Women | ||||||
| Age group | Disadvantaged | Non- Disadvantaged | Diff. | Disadvantaged | Non- Disadvantaged | Diff. | |
| Intermediate | |||||||
| Under 19 | 62.3% | 67.8% | -5.5pp | 64.9% | 70.8% | -5.9pp | |
| 19 to 24 | 62.0% | 67.6% | -5.6pp | 62.4% | 66.0% | -3.6pp | |
| 25 and over | 64.4% | 65.9% | -1.5pp | 62.7% | 64.6% | -1.9pp | |
| All | 63.1% | 67.1% | -4.0pp | 63.1% | 66.8% | -3.7pp | |
| Advanced | |||||||
| Under 19 | 53.3% | 54.2% | -2.3pp | 67.8% | 72.5% | -4.7pp | |
| 19-24 | 62.1% | 64.4% | -2.3pp | 65.1% | 69.1% | -4.0pp | |
| 25 and over | 58.2% | 59.8% | -1.6pp | 61.2% | 62.0% | -0.8pp | |
| All | 58.3% | 59.7% | -1.3pp | 63.4% | 66.5% | -3.1pp | |
| Higher | |||||||
| Under 19 | 29.6% | 48.7% | -19.1pp | - | - | - | |
| 19-24 | 42.7% | 50.4% | -7.8pp | 47.2% | 52.2% | -5.3pp | |
| 25 and over | 54.0% | 53.7% | 0.3pp | 52.7% | 54.7% | -2.0pp | |
| All | 47.6% | 51.6% | -4.1pp | 51.8% | 54.2% | -2.9pp |
Note: Achievement rates for completion within 36 months. Pooled over academic years 2013/14 and 2014/15. A dash (-) indicates that there were fewer than 100 learners in a cell and the figure was omitted. Source: London Economics’ analysis of the ILR (2013/14-2017/18) data and IMD (2010) data
Table 8a and Table 8b provide detailed information on achievement rates at 36 months, further disaggregated by level and subject area of study of the apprenticeship, gender and disadvantaged status. The figures have been obtained by pooling together apprenticeship starts in the academic year 2013/14 and 2014/15. A dash (-) indicates that there were fewer than 100 learners in a cell and the figure was omitted.
Table 8a: Achievement rates at 36 months by apprenticeship level, gender, subject and disadvantaged status
| Men | Women | ||||||
| Disadvantaged | Non- disadvantaged | Diff. | Disadvantaged | Non- disadvantaged | Diff. | ||
| Health | |||||||
| Intermediate | 59.5% | 64.4% | -4.9pp | 63.8% | 64.8% | -1.1pp | |
| Advanced | 59.8% | 60.1% | -0.3pp | 62.5% | 64.1% | -1.5pp | |
| Higher | 53.4% | 55.2% | 1.8pp | 52.1% | 53.1% | -1.0pp | |
| All | 59.3% | 62.7% | -3.4pp | 62.7% | 63.8% | -1.1pp | |
| Agriculture | |||||||
| Intermediate | 63.4% | 71.7% | -8.2pp | 68.7% | 74.6% | -5.9pp | |
| Advanced | 64.7% | 66.9% | -2.2pp | 59.0% | 65.5% | -6.4pp | |
| Higher | - | - | - | - | - | - | |
| All | 63.6% | 70.5% | -6.9pp | 65.7% | 70.7% | -4.9pp | |
| Engineering | |||||||
| Intermediate | 68.5% | 71.2% | -2.7pp | 67.8% | 71.1% | -3.3pp | |
| Advanced | 45.2% | 47.6% | -2.4pp | 49.1% | 53.2% | -4.1pp | |
| Higher | - | - | - | - | - | - | |
| All | 61.7% | 61.1% | 0.6pp | 64.9% | 67.0% | -2.1pp | |
| Construction | |||||||
| Intermediate | 58.0% | 63.2% | -5.1pp | 60.2% | 61.1% | -0.9pp | |
| Advanced | 74.8% | 74.8% | 0.0pp | - | - | - | |
| Higher | - | - | - | - | - | - | |
| All | 60.6% | 65.8% | -5.2pp | 60.2% | 61.1% | -0.9pp | |
| ICT | |||||||
| Intermediate | 64.6% | 78.9% | -14.2pp | 61.8% | 67.2% | -5.4pp | |
| Advanced | 71.2% | 73.6% | -2.4pp | 71.1% | 74.6% | -3.5pp | |
| Higher | 39.0% | 58.8% | -19.9pp | - | - | - | |
| All | 66.6% | 73.9% | -7.3pp | 66.3% | 70.7% | -4.4pp |
Note: Achievement rates for completion within 36 months. Pooled over academic years 2013/14 and 2014/15. A dash (-) indicates that there were fewer than 100 learners in a cell and the figure was omitted. Source: London Economics’ analysis of the ILR (2013/14-2017/18) data and IMD (2010) data
Table 8b: Achievement rates at 36 months by apprenticeship level, gender, subject and disadvantaged status
| Men | Women | ||||||
| Disadvantaged | Non- disadvantaged | Diff. | Disadvantaged | Non- disadvantaged | Diff. | ||
| Retail | |||||||
| Intermediate | 62.3% | 64.8% | -2.5pp | 59.8% | 65.5% | -5.7pp | |
| Advanced | 60.7% | 62.5% | -1.8pp | 65.7% | 70.2% | -4.6pp | |
| Higher | - | - | - | - | - | - | |
| All | 62.1% | 64.4% | -2.3pp | 61.1% | 66.8% | -5.7pp | |
| Leisure * | |||||||
| Intermediate | 67.7% | 71.3% | -3.7pp | 70.3% | 71.9% | -1.6pp | |
| Advanced | 70.7% | 78.2% | -7.5pp | 70.8% | 78.2% | -7.4pp | |
| Higher | - | - | - | - | - | - | |
| All | 68.9% | 74.8% | -5.9pp | 70.5% | 74.8% | -4.3pp | |
| Business ** | |||||||
| Intermediate | 60.8% | 64.7% | -4.0pp | 63.7% | 68.2% | -4.5pp | |
| Advanced | 60.3% | 63.5% | -3.3pp | 63.3% | 66.7% | -3.4pp | |
| Higher | 48.6% | 50.6% | -2.0pp | 51.6% | 55.5% | -4.0pp | |
| All | 60.2% | 63.6% | -3.3pp | 63.1% | 67.0% | -3.9pp | |
| Other | |||||||
| Intermediate | - | - | - | - | - | - | |
| Advanced | 49.5% | 60.3% | -10.8pp | 56.0% | 67.3% | -11.3pp | |
| Higher | - | - | - | - | - | - | |
| All | 49.5% | 60.3% | -10.8pp | 56.0% | 67.3% | -11.3pp |
Note: *Leisure and Tourism **Business and Law. Achievement rates for completion within 36 months. Pooled over academic years 2013/14 and 2014/15. A dash (-) indicates that there were fewer than 100 learners in a cell and the figure was omitted. Source: London Economics’ analysis of the ILR (2013/14-2017/18) data and IMD (2010) data
Table 9 provides detailed information on achievement rates at 36 months, further disaggregated by level of the apprenticeship, size of the employer, gender and disadvantaged status. The figures have been obtained by pooling together apprenticeship starts in the academic year 2013/14 and 2014/15.
Table 9: Achievement rates at 36 months by apprenticeship level, gender, firm size and disadvantaged status
| Men | Women | ||||||
| Disadvantaged | Non- disadvantaged | Diff. | Disadvantaged | Non- disadvantaged | Diff. | ||
| Small enterprise | |||||||
| Intermediate | 62.4% | 65.9% | -3.5pp | 62.4% | 67.0% | -4.6pp | |
| Advanced | 55.7% | 56.3% | -0.6pp | 63.8% | 66.3% | -2.5pp | |
| Higher | 42.7% | 48.3% | -5.6pp | 52.0% | 53.6% | -1.6pp | |
| All | 60.2% | 62.1% | -1.9pp | 62.5% | 66.0% | -3.5pp | |
| Medium enterprise | |||||||
| Intermediate | 65.1% | 68.1% | -3.0pp | 67.4% | 63.5% | 3.9pp | |
| Advanced | 58.5% | 61.5% | -3.0pp | 66.8% | 63.4% | 3.4pp | |
| Higher | 50.6% | 52.7% | -2.1pp | 51.7% | 50.2% | 1.5pp | |
| All | 62.8% | 65.1% | -2.3pp | 66.6% | 63.1% | 3.5pp | |
| Large enterprise | |||||||
| Intermediate | 63.8% | 67.4% | -3.6pp | 64.7% | 66.2% | -1.5pp | |
| Advanced | 60.9% | 61.8% | -0.9pp | 63.0% | 66.5% | -3.5pp | |
| Higher | 53.8% | 53.3% | 0.5pp | 55.4% | 56.7% | -1.3pp | |
| All | 62.9% | 65.2% | -2.3pp | 63.7% | 65.9% | -2.2pp |
Note: Achievement rates for completion within 36 months. Pooled over academic years 2013/14 and 2014/15. Source: London Economics’ analysis of the ILR (2013/14-2017/18) data and IMD (2010) data
Supporting tables: Timely completion
Table 10 provides information on the proportion of apprentices achieving their course on time among those completing and successfully achieving the apprenticeship within 36 months. Following the approach used by the Department for Education, timely achievers are defined as those achieving within the planned end date plus a further 90 days. This measure provides an indication on whether an apprentice completed their course within the planned timeframe. The figures have been obtained by pooling together apprenticeship starts in the academic year 2013/14 and 2014/15. A dash (-) indicates that there were fewer than 100 learners in a cell and the figure was omitted.
Table 10: Proportion achieving apprenticeship within 90 days of planned end date out of number of apprentices who completed and achieved within 3 years
| Men | Women | ||||||
| Disadvantaged | Non- disadvantaged | Diff. | Disadvantaged | Non- disadvantaged | Diff. | ||
| Intermediate | |||||||
| Under 19 | 79.8% | 77.8% | 2.1pp | 84.5% | 83.0% | 1.5pp | |
| 19 to 24 | 79.0% | 77.6% | 1.3pp | 81.6% | 81.8% | -0.2pp | |
| 25 and over | 81.2% | 80.3% | 0.9pp | 78.9% | 79.4% | -0.6pp | |
| All | 80.1% | 78.5% | 1.6pp | 81.0% | 81.2% | -0.2pp | |
| Advanced | |||||||
| Under 19 | 79.2% | 75.5% | 3.7pp | 76.4% | 75.2% | 1.2pp | |
| 19 to 24 | 73.5% | 70.1% | 3.5pp | 75.3% | 74.6% | 0.7pp | |
| 25 and over | 75.0% | 73.6% | 1.4pp | 73.2% | 74.5% | -1.3pp | |
| All | 75.5% | 72.6% | 2.9pp | 74.4% | 74.7% | -0.3pp | |
| Higher | |||||||
| Under 19 | - | - | - | - | - | - | |
| 19 to 24 | 58.3% | 57.3% | 0.9pp | 64.9% | 59.4% | 5.5pp | |
| 25 and over | 74.5% | 68.5% | 6.0pp | 72.4% | 72.1% | 0.3pp | |
| All | 69.5% | 63.3% | 6.2pp | 71.3% | 69.5% | 1.8pp |
Note: Achievement rates for completion within 36 months. Pooled over academic years 2013/14 and 2014/15. A dash ( -) indicates that there were fewer than 100 learners in a cell and the figure was omitted. Difference may not equal difference in reported numbers due to rounding. Source: London Economics’ analysis of the ILR (2013/14-2017/18) data and IMD (2010) data
6.3 Econometric analysis
Methodology
To investigate the existence of a disadvantage gap in the likelihood of completing the apprenticeship within 36 months from the start of the programme by stripping out the effect of personal characteristics other than those incorporated into the neighbourhood deprivation metric, we estimated a Probit model of the following form:
P(yi) = [delta]disi + [beta]xi,t + [epsilon],t
where:
-
the dependent variable is the probability of successfully completing and achieving the apprenticeship within 36 months from the start of the programme
-
disi indicates whether the individual is classified as disadvantaged by the IMD (2010) measure
- xi,t is a vector of control variables including information on:
- ethnicity
- gender
- a dummy for whether the apprentice is reported to have a disability
- subject area of the apprenticeship
- enterprise size band
- enterprise region
-
age band of the apprentice[footnote 16]
- Additionally, the aggregate regression presented in the main report (obtained by pooling together apprenticeships at different levels) controls for the level of the apprenticeship. Furthermore, standard errors have been clustered at apprenticeship level for the aggregate regression
The model is estimated separately for men and women and by level of the apprenticeships. The estimates presented in Table 11 are further obtained by estimating the model for each subject area separately.
Supporting tables: disadvantage gap by subject area of study
Table 11 provides estimates (marginal effects) for the disadvantage gap in the likelihood of achieving the apprenticeship within 36 months from the start of the programme by gender, level of the apprenticeship and subject area. The figures have been obtained by pooling together apprenticeship starts in the academic year 2013/14 and 2014/15. A dash (-) indicates that the model has not been estimated due to insufficient sample size.
Table 11: Estimates of the disadvantage gap in the likelihood of achieving the apprenticeship within 36 months from the start of the programme (marginal effects), by gender, level and subject area
| Men | Women | |||||
| Intermediate | Advanced | Higher | Intermediate | Advanced | Higher | |
| Health | -0.050*** | -0.016 | -0.020 | -0.018*** | -0.021*** | 0.010 |
| Observations | 21,015 | 9,769 | 1,598 | 72,167 | 62,442 | 7,601 |
| Agriculture | -0.084*** | -0.051 | - | -0.056* | -0.082 | - |
| Observations | 5,160 | 1,550 | - | 1,860 | 1,521 | - |
| Engineering | -0.026*** | -0.011 | 0.020 | -0.036** | -0.0074 | - |
| Observations | 58,709 | 39,855 | 514 | 6,099 | 1,642 | - |
| Construction | -0.044*** | -0.010 | 0.20* | -0.015 | 0.100 | - |
| Observations | 20,354 | 5,533 | 139 | 284 | 225 | - |
| ICT | -0.089*** | -0.030** | -0.084** | -0.0089 | -0.031 | -0.11 |
| Observations | 4,108 | 11,428 | 1,251 | 1,658 | 1,540 | 174 |
| Retail | -0.037*** | 0.000 | 0.16 | -0.048*** | -0.038*** | 0.030 |
| Observations | 47,566 | 10,497 | 172 | 53,949 | 18,431 | 189 |
| Leisure and Tourism | -0.027* | -0.053*** | - | -0.0055 | -0.023 | - |
| Observations | 6,085 | 5,655 | - | 3,598 | 2,825 | - |
| Business and Law | -0.035*** | -0.023*** | -0.007 | -0.037*** | -0.027*** | -0.032** |
| Observations | 48,643 | 23,024 | 3,859 | 77,309 | 41,357 | 6,296 |
| Other | 0.024 | -0.084* * | - | -0.039 | -0.11** | - |
| Observations | 330 | 1,178 | - | 297 | 783 | - |
Note: Pooled over academic years 2013/14 and 2014/15. *** p<0.01, ** p<0.05, * p<0.1. Standard errors are robust. A dash (-) indicates that the model has not been estimated due to insufficient sample size. Source: London Economics’ analysis of the ILR (2013/14-2017/18) data, IDBR (2014-2018) and IMD (2010) data
7. Progressing from apprenticeships into further and higher education
This section provides supporting information to the analysis of progression into Further and Higher Education presented in the main report.
7.1 Data description
The analysis of progression into further and higher education made use of information from the Longitudinal Education Outcomes (LEO) data on the 3 cohorts of English-domiciled KS4 leavers in the academic years 2001/02-2003/04. At the time the analysis was undertaken, the LEO data was available up to the 2016/17 academic year, thus allowing us to follow learners up to the age of 28 (or 30 depending on the cohort). As such, to allow for sufficient time, the analysis of progression from apprenticeships to further and higher education was undertaken for learners achieving the apprenticeship before the age of 21 or between the age of 21 and 24 (separately). Apprenticeships at Intermediate and Advanced level have been considered separately, while the incidence of higher apprenticeships in the age groups considered was not sufficient to allow for a separate analysis.
In order to identify learners from disadvantaged backgrounds in LEO, the IDACI measure at key stage 4 has been used, classifying disadvantaged learners as those with an IDACI score in the bottom 2 deciles. Learners with no IDACI information have been dropped from the sample[footnote 17]. The size of the final sample, disaggregated by level of the apprenticeship, age group and disadvantaged status, is presented in Table 12.
Table 12: Post-cleaning sample sizes of LEO for analysis of progression into further and higher education
| Achieved by the age of 21 | Achieved between 21 and 24 | |||||
| Level of apprenticeship achieved | Disadvantaged | Non- disadvantaged | All | Disadvantaged | Non- disadvantaged | All |
| Intermediate | 30,859 | 104,980 | 135,839 | 4,140 | 9,593 | 13,733 |
| Advanced | 13,073 | 69,094 | 82,167 | 4,284 | 17,389 | 21,673 |
| All | 38,698 | 151,186 | 189,884 | 8,164 | 26,190 | 34,354 |
Note: Some individuals have achieved both an Intermediate and advanced apprenticeship by the age of 21 / between age of 21 and 24 and as a result the column totals may not sum. Source: London Economics’ analysis of LEO data (2001/02-2016/17)
7.2 Descriptive analysis
Supporting tables: Progression rates for English learners achieving an apprenticeship between the age of 21 and 24
Table 13 provides progression rates of English learners who undertook an intermediate apprenticeship between the age of 21 and 24, combined with the incidence of the highest qualification achieved by 2016/17 for learners in this group who progressed and achieved at higher levels. Figures only display the highest level achieved by 2016/17 and not all intermediate qualifications that may have been attained. ‘any academic L3’ includes 1 or more A-levels; ‘any vocational L3’ includes BTEC at Level 3, NVQ level 3, other full and non-full level 3 vocational qualifications; ‘L4 vocational’ includes HNC, HND and higher apprenticeships.
Table 13: Progression rates of English learners who undertook an intermediate apprenticeship between the age of 21 and 24 (%)
| Men | Women | |||
| Progressed to | Disadvantaged | Non-disadvantaged | Disadvantaged | Non-disadvantaged |
| Any qualification | 16.7% | 20.7% | 23.8% | 25.5% |
| Highest qualification achieved by 2016/17 by those who progressed and achieved at higher levels: | ||||
| Any academic L3 | 2.4% | 1.9% | 5.9% | 5.1% |
| Any vocational L3 | 12.0% | 13.0% | 17.6% | 14.9% |
| Advanced apprenticeship | 76.6% | 75.4% | 67.6% | 69.8% |
| Any vocational L4 | 3.0% | 3.4% | 3.8% | 3.9% |
| First degree and other equivalent HE qualification | 4.8% | 5.3% | 5.0% | 4.7% |
| Postgraduate education | 1.2% | 1.0% | 0.4% | 1.2% |
Note: Figures show the percentage of English learners (from the 2001/02-2003/04 cohort) who completed an Intermediate Apprenticeship between the age of 21 and 24 that then went on to complete a higher-level qualification by the end of 2016/17. Figures only display the highest level achieved by 2016/17, not all intermediate steps. Any academic L3 includes 1 or more A- levels. Any vocational L3 includes BTEC at level 3, NVQ level 3, other full and non-full level 3 vocational qualifications. Higher apprenticeships are included in L4 vocational. Columns may not sum to 100 due to rounding. Source: London Economics’ analysis of LEO data (2001/02-2016/17)
Table 14 provides progression rates of English learners who undertook an advanced apprenticeship between the age of 21 and 24 combined with the incidence of the highest qualification achieved by 2016/17 for learners in this group who progressed and achieved at higher levels. Figures only display the highest level achieved by 2016/17 and not all intermediate qualifications that may have been attained. ‘L4 vocational’ includes HNC, HND and higher apprenticeships.
Table 14: Progression rates of English learners who undertook an advanced apprenticeship between the age of 21 and 24 (%)
| Men | Women | |||
| Upgraded to | Disadvantaged | Non-disadvantaged | Disadvantaged | Non-disadvantaged |
| Any qualification | 5.3% | 6.9% | 7.4% | 8.5% |
| Highest qualification achieved at the age of 28 (30) by those who progressed and achieved at higher levels: | ||||
| Any vocational L4 | 56.6% | 53.6% | 45.9% | 45.9% |
| First degree and other equivalent HE qualification | 39.6% | 43.5% | 50.0% | 51.8% |
| Postgraduate Education | 3.8% | 2.9% | 2.7% | 3.5% |
Note: Figures show the percentage of English learners (from the 2001/02-2003/04 cohort) who completed an advanced apprenticeship between the age of 21 and 24 that then went on to complete a higher-level qualification by the end of 2016/17. Figures only display the highest level achieved by 2016/17, not all intermediate steps. Higher apprenticeships are included in L4 vocational. Columns may not sum to 100 due to rounding. Source: London Economics’ analysis of LEO data (2001/02- 2016/17)
7.3 Econometric analysis
Methodology
To investigate the existence of a disadvantage gap in the likelihood of progressing and achieving at higher levels by stripping out the effect of personal characteristics other than those incorporated into the neighbourhood deprivation metric, we estimated a Probit model of the following form:
P(yi) = [delta]disi + [beta]xi,t + [epsilon]i,t
where:
-
the dependent variable is the probability of progressing and achieving a qualification at a higher level by 2016/17
-
disi indicates whether the individual is classified as disadvantaged by the IDACI measure
- xi,t is a vector of control variables including information on:
- a dummy for whether the pupil was registered for free school meals (FSM) at KS4
- a dummy for whether the individual was ethnically white
- a dummy for gender
- a dummy for special education needs (SEN) status at KS4
- key stage 2 maths and English test score
- A dummy for whether the pupils achieved 5 or more A*-G GCSEs
- Key Stage 4 establishment controls
- a cohort dummy
- subject area of the apprenticeship, and
-
a dummy for whether the individual attended a state school
- All regressions were estimated separately by gender, level of the apprenticeship and age group (individuals who achieved the apprenticeship by the age of 21 and those who achieved the apprenticeship between the age of 21 and 24)
The relevant results are presented in the main report.
Supporting tables: disadvantage gap for achievers between the age of 21 and 24
Table 15 provides estimates of the disadvantage gap in the likelihood of progressing and achieving qualifications at higher levels for individuals achieving an apprenticeship (marginal effects) by the age of 21 and between the age of 21 and 24, by level and gender.
Table 15: Estimates of the disadvantage gap in the likelihood of progressing and achieving qualifications at higher levels for individuals achieving an apprenticeship (marginal effects), by age group, level and gender
| Intermediate apprenticeship | Advanced apprenticeship | |
| Apprenticeship achieved by the age of 21 | ||
| Men | -0.040 *** | -0.001 |
| Observations | 68,952 | 49,996 |
| Women | -0.029 *** | -0.001 |
| Observations | 56,743 | 23,430 |
| Apprenticeship achieved between the age of 21 and 24 | ||
| Men | -0.015 | -0.001 |
| Observations | 7,747 | 9,909 |
| Women | -0.013 | 0.000 |
| Observations | 5,309 | 10,350 |
Note: * indicates that the estimate is statistically significant at 10% ** at 5% and *** at 1% confidence levels. Source: London Economics’ analysis of LEO data (2001/02-2016/17)
8. Entry into the labour market
This section provides supporting information to the analysis of labour market outcomes presented in the main report.
8.1 Data description
The analysis of labour market outcomes associated with attainment of an apprenticeship made use of information from the Longitudinal Education Outcomes (LEO) data on the 3 cohorts of English-domiciled KS4 leavers in the academic years 2001/02-2003/04. At the time the analysis was undertaken, the LEO data was available up to the 2016/17 academic year, thus allowing us to follow learners into the labour market up to the age of 28 (or 30 depending on the cohort). In the study, the labour market outcomes were measured at the age of 28, the latest age with available information for each of the 3 cohorts of interest. Consistently with the rest of the study, the analysis was undertaken by gender and for apprenticeships at Intermediate and advanced-levels separately. The incidence of higher apprenticeship in the age group considered was not sufficient to allow for a separate analysis.
In order to identify learners from disadvantaged backgrounds in LEO, the IDACI (measured at Key Stage 4) was used, classifying disadvantaged learners as those with an IDACI score in the bottom 2 deciles. Learners with no IDACI information have been dropped from the sample.[footnote 18] The size of the final sample, disaggregated by level of the apprenticeship, gender and disadvantaged status, is presented in Table 16.
Table 16: Post-cleaning sample sizes of LEO for analysis of labour market outcomes
| Men | Women | |||||
| Highest qualification at age 28 | Disadvantaged | Non- disadvantaged | All | Disadvantaged | Non- disadvantaged | All |
| Advanced | 8,706 | 48,169 | 56,875 | 6,588 | 25,725 | 32,313 |
| Intermediate | 12,070 | 38,604 | 50,674 | 10,062 | 28,835 | 38,897 |
| Level 1 voc. | 13,913 | 23,814 | 37,727 | 9,046 | 12,853 | 21,899 |
| All | 34,689 | 110,587 | 145,276 | 25,696 | 67,413 | 93,109 |
Source: London Economics’ analysis of LEO data (2001/02-2016/17)
8.2 Descriptive analysis
Supporting tables: Proportion of the year spent on benefits dependency
Table 17 provides information on the average proportion of individuals in receipt of at least one labour market benefit at age 28, by socio-economic background and highest qualification. The following labour market benefits have been considered: jobseekers’ allowance, income support or employment and support allowance.
Table 17: Average proportion of individuals in receipt of at least one labour market benefit at age 28, by socio-economic background and highest qualification
| Men | Women | |||||
| Highest qualification | Disadvantaged | Non- disadvantaged | Difference | Disadvantaged | Non- disadvantaged | Difference |
| Advanced apprenticeship | 0.8% | 0.3% | -0.4pp | 0.7% | 0.4% | -0.3pp |
| Intermediate apprenticeship | 2.2% | 1.0% | -1.3pp | 1.7% | 1.0% | -0.8pp |
| L1 vocational qualification | 7.2% | 4.2% | -3.0pp | 5.2% | 3.8% | -1.4pp |
Note: Figures show benefit dependency, expressed as the proportion of the year in receipt of jobseekers’ allowance, income support or employment and support allowance, of individuals aged 28 who are not in education (earnings from self-employment have been included). Source: London Economics’ analysis of LEO data (2001/02-2016/17)
8.3 Econometric analysis
Methodology
This analysis considers the impact of disadvantaged status on 3 labour market outcomes:
-
Earnings - expressed as daily earnings (i.e. total annual gross pay divided by total number of days in employment in the tax years)
-
Employment – expressed as proportion of the year in employment (number of days in employment in the tax year divided by 365 or 366)
-
Benefit dependency – expressed as a proportion of the year in receipt of at least one of the following active labour market benefits: jobseekers’ allowance (and job training allowance), income support, and employment and support allowance
All outcome variables are measured at age 28, and in order to avoid any overlap between academic and tax year and to allow sufficient potential job search time, we only retain those individuals who have achieved their highest qualification by age 26.
We estimate a model of the form:
yi,28 = [delta]disi + [beta]xi,t + [epsilon]i,t
where:
-
yi,28 represents the dependent variable measured at age 28 (log daily earnings, proportion of the year in employment, or proportion of the year in receipt of benefits)
-
disi indicates whether the individual is classified as disadvantaged by the IDACI measure
-
xi,t is a vector of control variables including information on the ethnic background of the individual, time elapsed since the learner left education, previous eligibility for free school meals (FSM), special education needs (SEN) status, key stage 2 maths and English test score, whether achieved 5 or more A*-G GCSEs, key stage 4 establishment controls, a cohort dummy, subject area and (for the earnings regression) postcode area of residence in the tax year[footnote 19] and source of income (PAYE only, self-assessment only, or both)[footnote 20]
-
Treatment groups and counterfactual groups are as reported in Table 18
-
All regressions were estimated separately for males and females
-
The earnings regressions were estimated using Ordinary Least Squares (OLS), while both the employment and the benefits regression were estimated using a fractional logit (Generalised Linear Model, GLM)[footnote 21]
Table 18: Treatment and counterfactual groups for the econometric analysis of the labour market outcomes
| Model | Treatment group | Counterfactual group | Notes |
| Common counterfactual | |||
| Individuals in possession of an intermediate apprenticeship as highest qualification at the age of 28 | Individuals in possession of a level 1 vocational qualification as highest qualification at the age of 28 | Estimated jointly for the group of disadvantaged and non- disadvantaged | |
| Individuals in possession of an advanced apprenticeship as highest qualification at the age of 28 | Individuals in possession of an intermediate apprenticeship as highest qualification at the age of 28 | ||
| Same-socio economic counterfactual (Level-below) | |||
| Individuals in possession of an intermediate apprenticeship as highest qualification at the age of 28 | Individuals in possession of a level 1 vocational qualification as highest qualification at the age of 28 | Estimated separately for the group of disadvantaged and non- disadvantaged | |
| Individuals in possession of an advanced apprenticeship as highest qualification at the age of 28 | Individuals in possession of an intermediate apprenticeship as highest qualification at the age of 28 | ||
| Same-socio economic counterfactual (Same level-below) | |||
| Individuals in possession of a level 2 qualification plus an intermediate apprenticeship as highest qualification at the age of 28 | Individuals in possession of a level 2 vocational qualification as highest qualification at the age of 28 | Estimated separately for the group of disadvantaged and non- disadvantaged | |
| Individuals in possession of a level 3 vocational qualification plus an advanced apprenticeship as highest qualification at the age of 28 | Individuals in possession of a level 3 vocational qualification as highest qualification at the age of 28 |
Source: London Economics
Supporting tables: Econometric results, additional results
Table 19 provides the estimated percentage effects associated with attainment of an apprenticeship on daily earnings, by level of apprenticeship, gender and socio-economic background, using a common-counterfactual approach. The model was estimated jointly for individuals from disadvantaged and non-disadvantaged backgrounds. Outcome variables were measured at the age of 28.
Table 19: Percentage effects on daily earnings, by level of apprenticeship, gender and socio-economic background – Common counterfactual
| Men | Women | |||
| Highest qualification | Disadvantaged | Non- disadvantaged | Disadvantaged | Non- disadvantaged |
| Advanced apprenticeship | 16.1% | 15.6% | 12.5% | 14.8% |
| Observations | 98,408 | 98,408 | 59,654 | 59,654 |
| Intermediate apprenticeship | 19.8% | 22.9% | 9.5% | 13.9% |
| Observations | 57,024 | 57,024 | 35,371 | 35,371 |
Note: Individuals in education and not in employment at the age of 28 have been excluded from the sample. Earnings have been adjusted for outliers, excluding individuals in the top and bottom percentile. The counterfactual group for the treatment group in possession of an advanced apprenticeship (as highest qualification) consist of individuals in possession of an intermediate apprenticeship (as highest qualification), irrespective of the socio -economic background. The counterfactual group for the treatment group in possession of an intermediate apprenticeship (as highest qualification) consists of individuals in possession of a level 1 vocational qualification (as highest qualification), irrespective of the socio -economic background. Percentage effect reported after exponentiating coefficient (exp(δ)-1). All figures are statistically significant at 1% confidence level. Source: London Economics’ analysis of LEO data (2001/02-2016/17)
Table 20 provides the estimated marginal effects associated with attainment of an apprenticeship on the proportion of the year spent in employment, by level of apprenticeship, gender and socio-economic background, using a common-counterfactual approach. The model was estimated jointly for individuals from disadvantaged and non-disadvantaged backgrounds. Outcome variables were measured at the age of 28.
Table 20: Marginals effects on employment probability, by level of apprenticeship, gender and socio-economic background – Common counterfactual
| Men | Women | |||
| Highest qualification | Disadvantaged | Non- disadvantaged | Disadvantaged | Non- disadvantaged |
| Advanced Apprenticeship | 0.052*** | 0.036*** | 0.086*** | 0.091*** |
| Observations | 137,094 | 137,094 | 87,408 | 87,408 |
| Intermediate Apprenticeship | 0.083*** | 0.096*** | 0.108*** | 0.136*** |
| Observations | 81,845 | 81,845 | 55,893 | 55,893 |
Note: Individuals in education at the age of 28 have been excluded from the sample. The counterfactual group for the treatment group in possession of an advanced apprenticeship (as highest qualification) consist of individuals in possession of an intermediate apprenticeship (as highest qualification), irrespective of the socio -economic background. The counterfactual group for the treatment group in possession of an intermediate apprenticeship (as highest qualification) consists of individuals in possession of a level 1 vocational qualification (as highest qualification), irrespective of the socio -economic background. All figures are statistically significant at 1% confidence level. Source: London Economics’ analysis of LEO data (2001/02- 2016/17)
Table 21 provides the estimated marginal effects associated with progressing from a level below (or a same level) qualification to an apprenticeship on the proportion of the year spent in employment, by level of apprenticeship, gender and socio-economic background. The model was estimated separately for individuals from disadvantaged and non-disadvantaged backgrounds. Outcome variables were measured at the age of 28.
Table 21: Marginals effects of being from a disadvantaged background on employment probability, by level of apprenticeship, gender and socio-economic background – Same socio-economic background counterfactual
| Men | Women | |||
| Highest qualification | Disadvantaged | Non- disadvantaged | Disadvantaged | Non- disadvantaged |
| Level-below counterfactual | ||||
| Advanced apprenticeship | 0.041*** | 0.019*** | 0.083*** | 0.061*** |
| Observations | 20,022 | 84,209 | 16,078 | 53,114 |
| Intermediate apprenticeship | 0.093*** | 0.091*** | 0.141*** | 0.114*** |
| Observations | 23,467 | 58,378 | 17,016 | 38,877 |
| Same-level counterfactual | ||||
| Advanced apprenticeship | 0.037*** | 0.016*** | 0.071*** | 0.038*** |
| Observations | 11,828 | 50,091 | 14,875 | 55,541 |
| Intermediate apprenticeship | 0.059*** | 0.050*** | 0.098*** | 0.072*** |
| Observations | 26,082 | 59,654 | 17,605 | 37,166 |
Note: Individuals in education at the age of 28 have been excluded from the sample. The level below counterfactual comprises individuals holding a level 1 vocational qualification (as highest) for intermediate apprenticeship and an intermediate apprenticeship (as highest) for advanced apprenticeship. The same-level counterfactual comprises of individuals holding a level 2 vocational qualification as highest for intermediate apprenticeships and a level 3 vocational qualification (as highest) for advanced apprenticeships. The regressions are estimated separately for individuals from disadvantaged and non -disadvantaged socio-economic backgrounds. All figures are statistically significant at 1% confidence level. Source: London Economics’ analysis of LEO data (2001/02-2016/17)
Table 22 provides the estimated marginal effects associated with attainment of an apprenticeship on the proportion of the year spent in receipt of benefits, by level of apprenticeship, gender and socio-economic background, using a common-counterfactual approach. The model was estimated jointly for individuals from disadvantaged and non- disadvantaged backgrounds. Outcome variables were measured at the age of 28.
Table 22: Marginal effects of being from a disadvantaged background on benefit dependency probability, by level of apprenticeship, gender and socio-economic background – Common counterfactual
| Men | Women | |||
| Highest qualification | Disadvantaged | Non- disadvantaged | Disadvantaged | Non- disadvantaged |
| Advanced apprenticeship | -0.011*** | -0.015*** | -0.011*** | -0.012*** |
| Observations | 140,160 | 140,160 | 90,158 | 90,158 |
| Intermediate apprenticeship | -0.020*** | -0.029*** | -0.015*** | -0.020*** |
| Observations | 84,479 | 84,479 | 58,478 | 58,478 |
Note: Individuals in education at the age of 28 have been excluded from the sample. Benefit dependency is expressed as the proportion of the year in receipt of jobseekers’ allowance, income support or employment and support allowance. The counterfactual group for the treatment group in possession of an advanced apprenticeship (as highest qualification) consist of individuals in possession of an intermediate apprenticeship (as highest qualification), irrespective of the socio -economic background. The counterfactual group for the treatment group in possession of an intermediate apprenticeship (as highest qualification) consists of individuals in possession of a level 1 vocational qualification (as highest qualification), irrespective of the socio-economic background. All figures are statistically significant at 1% confidence. Source: London Economics’ analysis of LEO data (2001/02-2016/17)
Table 23 provides the estimated marginal effects associated with progressing from a level below (or a same level) qualification to an apprenticeship on the proportion of the year spent in receipt of benefits, by level of apprenticeship, gender and socio-economic background. The model was estimated separately for individuals from disadvantaged and non-disadvantaged backgrounds. Outcome variables were measured at the age of 28.
Table 23: Marginal effects of being from a disadvantaged background on benefit dependency probability, by level of apprenticeship, gender and socio-economic background – Same socio-economic background counterfactual
| Men | Women | |||
| Highest qualification | Disadvantaged | Non- disadvantaged | Disadvantaged | Non- disadvantaged |
| Level-below counterfactual | ||||
| Advanced apprenticeship | -0.009*** | -0.004*** | -0.009*** | -0.004*** |
| Observations | 20,169 | 84,905 | 16,226 | 53,466 |
| Intermediate apprenticeship | -0.037*** | -0.020*** | -0.022*** | -0.016*** |
| Observations | 24,542 | 59,937 | 18,224 | 40,254 |
| Same-level counterfactual | ||||
| Advanced apprenticeship | -0.015*** | -0.007*** | -0.011*** | -0.003*** |
| Observations | 12,036 | 50,751 | 15,152 | 56,133 |
| Intermediate apprenticeship | -0.023*** | -0.014*** | -0.017*** | -0.010*** |
| Observations | 26,836 | 60,823 | 18,483 | 38,150 |
Note: Individuals in education at the age of 28 have been excluded from the sample. Benefit dependency is expressed as the proportion of the year in receipt of jobseekers’ allowance, income support or employment and support allowance earnings have been adjusted for outliers, excluding individuals in the top and bottom percentile. The level below counterfactual comprises individuals holding a level 1 vocational qualification (as highest) for intermediate apprenticeship and an intermediate Apprenticeship (as highest) for Advanced Apprenticeship. The same-level counterfactual comprises of individuals holding a level 2 vocational qualification as highest for intermediate apprenticeships and a level 3 vocational qualification (as highest) for advanced apprenticeships. The regressions are estimated separately for individuals from disadvantaged and non -disadvantaged socio-economic backgrounds. All figures are statistically significant at 1% confidence level. Source: London Economics’ analysis of LEO data (2001/02-2016/17)
Free school meals
In order to test the robustness of the analysis of labour market outcomes, we re-estimated the earnings differentials, using an alternative definition of disadvantage based on registration for free school meals at key stage 4. Presented in the section, the results using this alternative definition of disadvantage are comparable to those presented in the main report, suggesting that the IDACI-based measure of disadvantage is robust.
Table 24 provides the percentage effect associated with attainment of an apprenticeship on daily earnings, by level of apprenticeship, gender and socio-economic background, using a common-counterfactual approach. The model was estimated jointly for individuals from disadvantaged and non-disadvantaged backgrounds, where the classification of individuals is based on registration for free school meals at key stage 4. Outcome variables were measured at the age of 28.
Table 24: Percentage effects on daily earnings, by level of apprenticeship, gender and socio-economic background – Common counterfactual – Free school meals definition
| Men | Women | |||
| Highest qualification | Disadvantaged | Non- disadvantaged | Disadvantaged | Non- disadvantaged |
| Advanced Apprenticeship | 12.3% | 16.1% | 13.5% | 14.1% |
| Observations | 98,401 | 98,401 | 59,653 | 59,653 |
| Intermediate Apprenticeship | 18.3% | 22.8% | 8.3% | 13.4% |
| Observations | 57,017 | 57,017 | 35,369 | 35,369 |
Note: Individuals in education and not in employment at the age of 28 have been excluded from the sample. Earnings have been adjusted for outliers, excluding individuals in the top and bottom percentile. The counterfactual group for the treatmen t group in possession of an advanced apprenticeship (as highest qualification) consist of individuals in possession of an intermediate apprenticeship (as highest qualification), irrespective of the socio -economic background. The counterfactual group for the treatment group in possession of an intermediate apprenticeship (as highest qualification) consists of individuals in possession of a level 1 vocational qualification (as highest qualification), irrespective of the socio -economic background. Percentage effect reported after exponentiating coefficient (exp( δ)-1). All figures are statistically significant at 1% confidence level. Source: London Economics’ analysis of LEO data (2001/02-2016/17)
Table 25 provides the percentage effect associated with progressing from a level below (or same level) qualification to an apprenticeship on daily earnings, by level of apprenticeship, gender and socio-economic background, using a common-counterfactual approach. The model was estimated for individuals from disadvantaged and non-disadvantaged backgrounds separately, where the classification of individuals is based on registration for free school meals at key stage 4. Outcome variables were measured at the age of 28.
Table 25: Percentage effects on daily earnings, by level of apprenticeship, gender and socio-economic background – Same socio-economic background counterfactual – Free school meals definition
| Men | Women | |||
| Highest qualification | Disadvantaged | Non- disadvantaged | Disadvantaged | Non- disadvantaged |
| Level-below counterfactual | ||||
| Advanced apprenticeship | 12.4% | 13.2% | 16.1% | 12.3% |
| Observations | 7,509 | 69,397 | 6,030 | 44,131 |
| Intermediate apprenticeship | 25.7% | 20.7% | 15.1% | 11.3% |
| Observations | 9,675 | 47,330 | 5,857 | 29,511 |
| Same-level counterfactual | ||||
| Advanced apprenticeship | 19.4% | 16.9% | 10.6% | 3.0% |
| Observations | 5,036 | 42,433 | 5,897 | 46,740 |
| Intermediate apprenticeship | 20.0% | 8.5% | 12.1% | 6.4% |
| Observations | 11,408 | 49,708 | 6,582 | 29,086 |
Note: Individuals in education and not in employment at the age of 28 have been excluded from the sample. Earnings have been adjusted for outliers, excluding individuals in the top and bottom percentile. The level below counterfactual comprises individuals holding a level 1 vocational qualification (as highest) for intermediate apprenticeship and an intermediate apprenticeship (as highest) for advanced apprenticeship. The same-level counterfactual comprises of individuals holding a level 2 vocational qualification as highest for intermediate apprenticeships and a level 3 vocational qualification (as highest) for advanced apprenticeships. The regressions are estimated separately for individuals from disadvantaged and non-disadvantaged socio-economic backgrounds. Percentage effect reported after exponentiating coefficient (exp( δ)-1). All figures are statistically significant at 1% confidence level. Source: London Economics’ analysis of LEO data (2001/02-2016/17)
Triple differences
In order to investigate the extent to which any difference in returns associated with apprenticeships persists over time, we conducted a difference-in-difference-in-difference analysis (also known as triple-differences). This model starts from a standard difference-in- differences model, where individuals are split into a ‘treatment’ and a ‘control’ group. In this instance, the treatment group is comprised of disadvantaged learners that re-enrol and complete an apprenticeship (at Intermediate or advanced level) after spending at least one year in employment. The control group are disadvantaged learners with the same level of prior attainment, as for the treatment group, who do not subsequently achieve an apprenticeship.
Figure 13: Difference-in-differences analysis for disadvantaged learners

Source: London Economics
Taking the difference between the earnings of the 2 groups prior to the apprenticeship, and the difference after the apprenticeship, we calculated the difference between these 2 differences to arrive at an estimate of the Average Treatment effect on the Treated (ATT ).
ATT = (wT,1− wT,0) − (wC,1− wC,0)
where wT,1 is the average wage of the treatment group after the treatment, and wT,0 is the average wage of the treatment group prior to the treatment (and the same for the control group when the subscript is C rather than T). This concept can also be demonstrated graphically in Figure 13 above.
In order to understand whether there is a disadvantage gap in the ATT effect, we undertook a difference-in-difference-in-differences approach. This approach added an additional step where the estimation above is undertaken for disadvantaged and non-disadvantaged learners separately. By then taking the difference between the 2 ATTs, it is possible to measure the extent to which the impact associated with attainment of the Apprenticeship differs for individuals from disadvantaged and non-disadvantaged backgrounds.
There are some issues in the implementation of the approach described above in the context of this analysis. In particular:
-
The first issue concerns the definition of t and t+1. While the natural choice for t+1 is age 28 (since this is the latest observable age for all the 3 cohorts), the choice of t is less obvious, and the following should be considered:
-
age of entry into the labour market. The data suggests some variation in the age of entry into the labour market. To take an example, approximately 16% of individuals achieving a level 1 vocational qualification and then proceeding to undertake an intermediate apprenticeship (after some time spent in employment) entered the labour market for the first time at age 17, 30% at age 18, 22% at age 19 and 12% at age 20
-
age of start of the apprenticeship. Again, the data presents relevant variation in the age of start of the apprenticeship (and, therefore, in the length of the period spent in employment before starting the apprenticeship)
-
A second issue concerns the likely overestimation of days in employment for young people and subsequent underestimation of daily/annual earnings. Given the unstable nature of employment at young ages, labour market information at time t-1 are less reliable than at later ages and likely to be biased
-
Finally, more generally the analysis suffers from a small sample size issue (for the treatment group). Regardless of the specific choice of t-1, there are very few individuals undertaking the particular educational pathway required for the analysis (for example, achieving an intermediate apprenticeship at a very early age, spending sufficient time in employment, subsequently starting an advanced apprenticeship and completing it by the age of 28, latest age available in the data)
In order to overcome the above issues, the model has been estimated using a range of different approaches to identify treatment and control groups. A summary of these approaches is provided in Table 27. As it is not immediately clear which approach is preferred, Table 26 reports the range of estimates for the disadvantage gap in the ATT effects obtained using the different approaches. However, given the small sample size for the treatment group, the results of this element of the analysis are for information only and should be treated with caution.
Table 26: Triple differences – Relative percentage effect (between disadvantaged and non-disadvantaged apprentices) associated with attainment of an apprenticeship on earnings, by level of apprenticeship and gender
| Men | Women | |
| Advanced Apprenticeship | -3.1% - 0.3% | 0.0% - 16.1% |
| Observations | 5,004 – 14,194 | 4,660– 12,147 |
| Intermediate Apprenticeship | -0.1% - 21.3% | 5.5% - 8.3% |
| Observations | 1,773- 5,482 | 864 – 3,115 |
Note: Coefficient results are presented as a range of estimates depending on the specific approach taken. Percentage effect reported after exponentiating coefficient (exp(δ)-1). The results presented are not statistically significant below the 10% significance level. Source: London Economics’ analysis of LEO data (2001/02-2016/17)
Table 27: Definition of treatment and counterfactual group for the analysis of triple differences
| Treatment group | Counterfactual group | Definition of t-1 | |
| Intermediate apprenticeship | |||
| Approach 1 | Individuals who achieved a level 1 vocational qualification, spent time in employment, started an intermediate apprenticeship between the ages of 19 and 24 and were in employment at age 28 (with intermediate apprenticeship as highest qualification at age 28). | Individuals who achieved a level 1 vocational qualification as highest and are in employment at age 28. Within this pool, the counterfactual group has then been selected using a propensity score matching strategy (by age of treated individual). | t-1 earnings measured the year before enrolling into the apprenticeship programme (if not available, 2 year or (maximum) 3 years prior to enrolment into the programme) |
| Approach 2 | Individuals who achieved a level 1 vocational or academic qualification, spent time in employment, started an intermediate apprenticeship between the ages of 19 and 24 and were in employment at age 28 (with intermediate apprenticeship as highest qualification at age 28). | Individuals who achieved a level 1 vocational or academic qualification as highest and are in employment at age 28. Within this pool, the counterfactual group has then been selected using a propensity score matching strategy (by age of treated individual). | t-1 earnings measured the year before enrolling into the apprenticeship programme (if not available, 2 year or (maximum) 3 years prior to enrolment into the programme) |
| Advanced apprenticeship | |||
| Approach 1 | Individuals who achieved an intermediate apprenticeship, spent time in employment, started an advanced apprenticeship between the ages of 19 and 24 and were in employment at age 28 (with advanced apprenticeship as highest qualification at age 28). | Individuals who achieved an intermediate apprenticeship as highest qualification and were in employment at age 28. Within this pool, the counterfactual group has then been selected using a propensity score matching strategy (by age of treated individual). | t-1 earnings measured the year before enrolling into the apprenticeship programme (if not available, 2 year or 3 years prior to enrolment into the programme) |
| Approach 2 | Individuals who achieved an intermediate apprenticeship, were in employment at age 20, start an advanced apprenticeship between the ages of 21 and 24 and were in employment at age 28 (with advanced apprenticeship as highest qualification at age 28) | All individuals who achieved an intermediate apprenticeship as highest qualification and were in employment at age 20 and age 28. | Earnings measured at age 20, for both treatment and counterfactual group. Observations are dropped if age 20 earnings information is not available. |
| Approach 3 | Individuals who achieved an intermediate apprenticeship, were in employment at age 20 (or 19), start an advanced apprenticeship between the ages of 21 and 24 and were in employment at age 28 (with advanced apprenticeship as highest qualification at age 28). | All individuals who achieved an intermediate apprenticeship as highest qualification and were in employment at age 20 and age 28. | Earnings measured at age 20, for both treatment and counterfactual group. Observations in the counterfactual groups are dropped if age 20 earnings information is not available. Observations in the treatment groups with no age 20 earnings are retained if age 19 earnings information is available. |
Source: London Economics
9. About the Commission
The Social Mobility Commission is an independent advisory non-departmental public body established under the Life Chances Act 2010 as modified by the Welfare Reform and Work Act 2016. It has a duty to assess progress in improving social mobility in the UK and to promote social mobility in England.
The Commission board comprises:
- Sandra Wallace, Joint Deputy Chair, Joint Managing Director Europe at DLA Piper
- Steven Cooper, Joint Deputy Chair, Chief Executive Officer , C. Hoare and Co
- Alastair da Costa, Chair of Capital City College Group
- Farrah Storr, Editor-in-chief, Elle
- Harvey Matthewson, Aviation Activity Officer at Aerobility and Volunteer
- Jessica Oghenegweke, Presenter, BBC Earth Kids
- Jody Walker, Senior Vice President at TJX Europe (TK Maxx and Home Sense in the UK)
- Liz Williams, CEO @FutureDotNow.UK
- Pippa Dunn, Founder of Broody, helping entrepreneurs and start ups
- Saeed Atcha, Chief Executive Officer of Youth Leads UK
- Sam Friedman, Associate Professor in Sociology at London School of Economics
- Sammy Wright, Vice Principal of Southmoor Academy, Sunderland
10. About London Economics
London Economics is one of Europe’s leading specialist economics and policy consultancies. Based in London and with offices and associate offices in 5 other European capitals, we advise an international client base throughout Europe and beyond on economic and financial analysis, litigation support, policy development and evaluation, business strategy, and regulatory and competition policy.
Our consultants are highly-qualified economists who apply a wide range of analytical tools to tackle complex problems across the business and policy spheres. Our approach combines the use of economic theory and sophisticated quantitative methods, including the latest insights from behavioural economics, with practical know-how ranging from commonly used market research tools to advanced experimental methods at the frontier of applied social science. For more information, please visit www.londoneconomics.co.uk
Head Office: Somerset House, New Wing, Strand, London, WC2R 1LA, United Kingdom.
w: londoneconomics.co.uk
social media: @LE_Education
t: +44 (0)20 3701 7700
f : +44 (0)20 3701 7701
social media: @LondonEconomics
10.1 Authors
Alice Battiston, Rhys Williams, Pietro Patrignani and Gavan Conlon
Access to the data was granted through the Department for Education-funded Centre for Vocational Education Research (CVER). Responsibility for the information and views set out in this report lies entirely with the authors.
-
Businesses with no employees or with turnover below tax thresholds and some non-profit organisations are not listed in the IDBR. ↩
-
Department for Education (2018) ‘Learners and Apprentices Survey 2018’. Abel, G.A, Barclay, M.E., Payne, R.A.(2016) ‘Adjusted indices of multiple deprivation to enable comparisons within and between constituent countries of the UK including an illustration using mortality rates’, BMJ Open. Welch, C.A., Harrison, D. A., Hutchings, A., Rowan, K. (2010) ‘The association between deprivation and hospital mortality for admissions to critical care units in England’, Journal of Critical Care vol. 25(3) ↩
-
The matching approach was initially developed to match the ILR 2017/18 to the IDBR and then implemented for all other years. ↩
-
Conlon et al. (2017), “Matching firms engaged in publicly funded training in the Inter Departmental Business Register”, Technical Report for CVER Briefing Note 003, Centre for Vocational Education Research ↩
-
This approach was suggested by the Department for Education. In some EDS instances, some companies are incorrectly assigned to ‘Hays’ and ‘Carillion’ references because they incorrectly reported their trade name and address. ↩
-
St Mary’s University Twickenham London (2017), ‘The take-up of Free School Meals in Catholic schools in England and Wales’ ↩
-
This is also confirmed in Taylor, C. (2017), ‘The reliability of Free School Meal eligibility as a Measure of Socio- Economic Disadvantage: Evidence from the Millennium Cohort Study in Wales’ ↩
-
London Economics (2008) ‘Assessing Current and Potential Provision of Free School Meals’ ↩
-
Perry, C. (2010), ‘Free School Meal Entitlement as a measure of deprivation’ and Taylor, C. (2017), ‘The reliability of Free School Meal eligibility as a Measure of Socio-Economic Disadvantage: Evidence from the Millennium Cohort Study in Wales’ ↩
-
Institute for Fiscal Studies (2013) ‘A comparison of commonly used socio-economic indicators: their relationships to educational disadvantage and relevance to Teach First’, and Education data lab (2019), ‘The 2019 Income Deprivation Affecting Children Index’ (blog) ↩
-
No information on free school meals registration at KS4 is available in the full ILR. ↩
-
defined as % of disadvantaged by ethnic group X - % of non-disadvantaged by ethnic group X ↩
-
Qualification achievement rates business rules 2017 to 2018 (ESFA) ↩
-
Age at which the individual started the learning aim. ↩
-
Further information on cleaning steps can be found in London Economics (2019), The Value of Progression in Further Education, CVER Research Discussion Paper 022. ↩
-
Further information on cleaning steps can be found in London Economics (2019), The Value of Progression in Further Education, CVER Research Discussion Paper 022. ↩
-
The postcode area forms the initial characters of the alphanumeric UK postcode (for example, AB). There are currently 121 geographic postcode areas in the UK. Postcode information is provided through the HM Revenue and Custom P14 file containing information on annual earnings and therefore is not available for the other outcome variables. ↩
-
Due to the assumptions used for self-employment, all individuals with positive income from self-employment (either from sole trading or partnership) are considered to be in employment for 100% of the tax year. ↩
-
Note that here the dependent variable is expressed as a proportion varying between 0 and 1. ↩