Analysis relating to State Pension age changes from the 1995 and 2011 Pensions Acts
Published 7 June 2019
1. Policy Background
The Pensions Act 1995 equalised State Pension age for men and women. The Pensions Act 2011 brought forward the timetable for increasing women’s State Pension age to 65, and for increasing men and women’s State Pension age to 66. State Pension age for women has risen gradually since 2010 and reached 65 in November 2018. The State Pension age for both men and women will reach 66 by 2020, with further rises legislated to 67 by 2028 and 68 by 2046.
The Pension Act 2014 (section 27) included a commitment that the government would hold a State Pension age review once every parliament, with each review to report within 6 years of the previous one. The first review was published on 19 July 2017.
The review proposed bringing forward the legislated increase to 68 between 2037 and 2039. A further review will be carried out before legislating to bring forward the rise in State Pension age to 68.
This analytical release contains new analysis that was produced by the Department for Work and Pensions (DWP) relating to State Pension age changes from the 1995 and 2011 Pensions Acts. It is a mix of different analyses, including updated cost modelling, and analysis of the people affected by the State Pension age changes.
The analysis includes:
- an estimate of the costs of reducing women’s State Pension age to 60 and men’s State Pension age to 65, over the period 2010/11 to 2025/26. This updates a previous cost estimate of the cost of reversing women’s State Pension age changes that was published in 2016.
- estimates of private pension wealth of men and women born between 1942 and 1966 by age and sex
- employment rates of women born between 1950 and 1958
- a time-series of private pension participation since 1997 split by sex, public/private sector and industry
2. Cost of reversing women’s State Pension age back to 60 and men’s State Pension age back to 65 over the period 2010/11 to 2025/26
The following tables show the estimated costs of reversing women’s State Pension age back to 60 and men’s State Pension age back to 65 over the period 2010/11 to 2025/26.
Table 1: Total cost estimate of reversing the State Pension age changes from the 1995 and 2011 Acts, over the period 2010/11 to 2025/26, 2018/19 price terms, £ billions
| £ billions | Men | Women | Total |
|---|---|---|---|
| State Pension | 17.6 | 188.4 | 206.0 |
| Other pensioner benefits | 19.4 | 9.9 | 29.3 |
| Working age benefits | -3.2 | -16.9 | -20.1 |
| Total | 33.8 | 181.4 | 215.2 |
Notes:
- Estimated costs have been rounded to the nearest 100 million. Costs are in 2018/19 price terms.
- 2010/11 is the first year of the State Pension age changes brought in by the 1995 Pensions Act, which raised women’s State Pension age to 65.
- 2025/26 is the final year in which people are affected by the State Pension age changes brought in by the 2011 Pensions Act, which brought forward the increase in women’s State Pension age to 65 and the increase in State Pension age to 66 for both men and women.
- The costs of reducing the State Pension age to 60 for women and 65 for men would continue to accrue after 2025/26.
- Calculations on the number of people affected are based on population estimates and projections from the Office for National Statistics (ONS).
- Average amounts are based on DWP published statistics.
- State Pension and new State Pension are assumed to be uprated going forwards by average earnings[footnote 1], and Additional Pension is assumed to be uprated by the Consumer Price Index (CPI), based on economic assumptions from the Office for Budget Responsibility (OBR).
- Costs of Pension Credit and Winter Fuel Payments (including the cost of men receiving Pension Credit and Winter Fuel Payment from women’s State Pension age) have been included.
- Savings on working age benefits that would not be paid have also been included. This includes Jobseekers Allowance, Employment Support Allowance, Income Support and Universal Credit.
Table 2: Total cost estimate of reversing the State Pension age changes from the 1995 and 2011 Acts, over the period 2010/11 to 2025/26, 2018/19 price terms, £ billions, by year
| Year | Men | Women | Total |
|---|---|---|---|
| 2010/11 | 0.0 | 0.6 | 0.6 |
| 2011/12 | 0.1 | 2.0 | 2.1 |
| 2012/13 | 0.2 | 3.4 | 3.6 |
| 2013/14 | 0.4 | 4.8 | 5.2 |
| 2014/15 | 0.6 | 6.2 | 6.8 |
| 2015/16 | 0.7 | 7.9 | 8.6 |
| 2016/17 | 0.9 | 9.3 | 10.2 |
| 2017/18 | 1.1 | 11.2 | 12.3 |
| 2018/19 | 1.3 | 13.2 | 14.5 |
| 2019/20 | 2.7 | 15.0 | 17.7 |
| 2020/21 | 3.8 | 16.3 | 20.1 |
| 2021/22 | 4.1 | 16.8 | 20.9 |
| 2022/23 | 4.3 | 17.5 | 21.8 |
| 2023/24 | 4.4 | 18.3 | 22.7 |
| 2024/25 | 4.5 | 19.1 | 23.6 |
| 2025/26 | 4.6 | 19.9 | 24.5 |
| Total | 33.8 | 181.4 | 215.2 |
Notes: 1. Estimated costs have been rounded to the nearest hundred million. Costs are in 2018/19 price terms.
2.1 Comparison with previously published costs
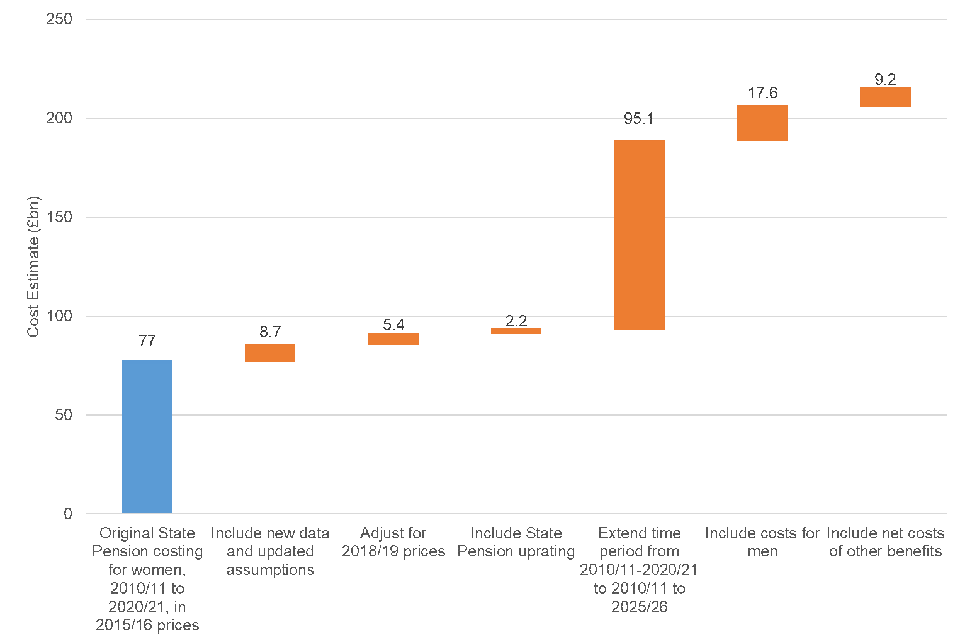
This analysis replaces a cost estimate that was published in 2016 which estimated that the cost of undoing State Pension age changes for women between 2010/11 and 2020/21 would be £77 billion (in 2015/16 prices). The key reasons the costs shown here differ from that £77 billion are[footnote 2]:
- the costs cover the time period 2010/11 to 2025/26, whereas the £77 billion figure covered the time period 2010/11 to 2020/21
- the costs cover men and women, whereas the £77 billion figure covered women only
- the costs include the costs of Pension Credit and Winter Fuel Payment, and savings from working age benefits. The £77 billion figure covered the State Pension only.
- the costs assume that the State Pension will be uprated in future years by average earnings (the legislated minimum). The £77 billion figure assumed no uprating of the State Pension.
- the £77 billion figure was calculated before the new State Pension was introduced
- the costs are based on updated data and assumptions (for example, we now have actual data on the average amount of State Pension payments in 2015/16, 2016/17 and 2017/18, which we did not have when the £77bn cost was estimated)
- the costs are in 2018/19 price terms, while the £77 billion was in 2015/16 price terms
Chart 1 shows how we get from the previously published figure of £77 billion to the new cost figure of £215 billion for the cost of reversing State Pension age changes. The largest change results from extending the time period from 2010/11 - 2020/21 to 2010/11 - 2025/26.
Chart 1: Comparison of the new cost estimate and the previously published figure of £77 billion
""
3. Private pension wealth of men and women born between 1942 and 1966 by age and sex
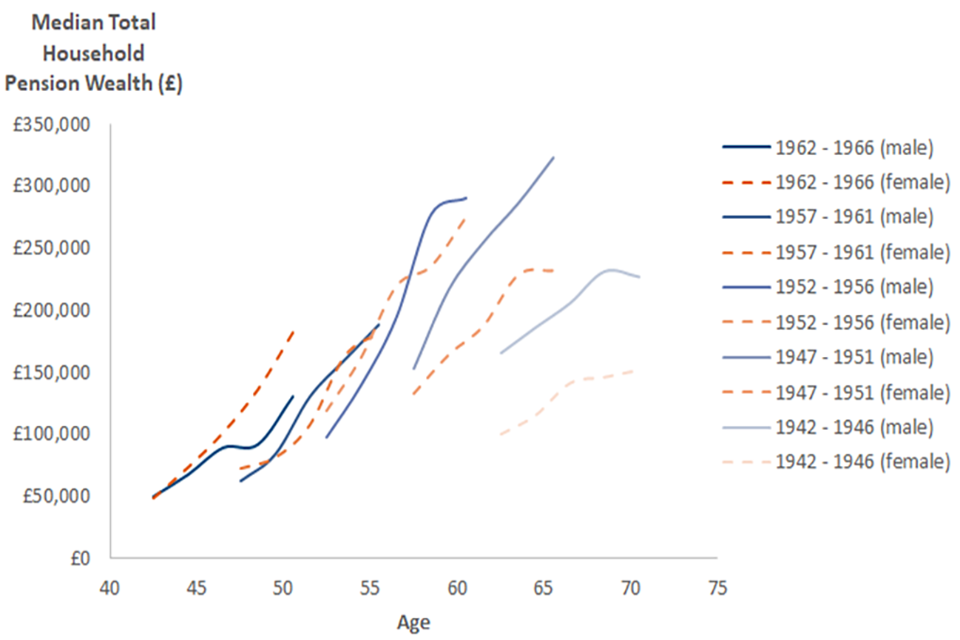
The following charts use the Office for National Statistics’ (ONS) Wealth and Assets Survey to look at wealth over time for different birth cohorts (ages) by gender. Generally, successive age cohorts tend to have greater pension wealth than the ones that came before them. The 1957-1961 cohort could be one exception to this, as according to the most recent data, they are not wealthier than the 1952-1956 cohort were at the same age.
When interpreting the charts, if the series to the left of another series (representing a younger cohort) tends to be higher, then the younger cohort tends to have done better than the one that came before. If it is below, then it has tended to do less well.
Chart 2: Total household private pension wealth by age and sex
""
Source: ONS Wealth and Assets Survey (2007 to 2015)
Note: Data is in nominal price terms
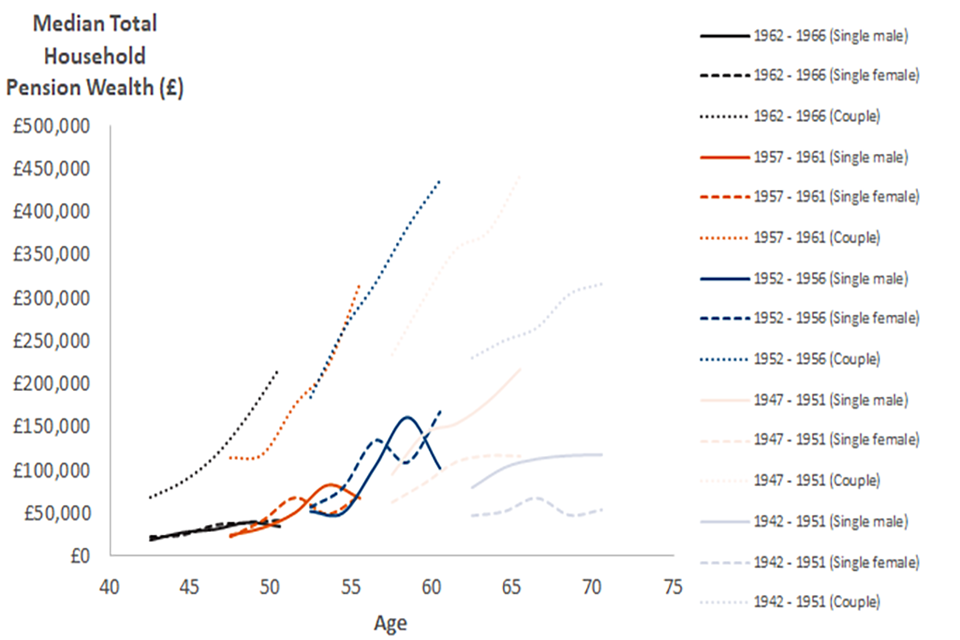
The chart shows estimates of wealth at household level; this means that totals for ‘men’ will also include the wealth of anyone else living in a household with men. The chart below splits household wealth by single men, single women and couples.
Chart 3: Total household private pension wealth by age and household composition
""
Source: ONS Wealth and Assets Survey
Note: Data is in nominal price terms
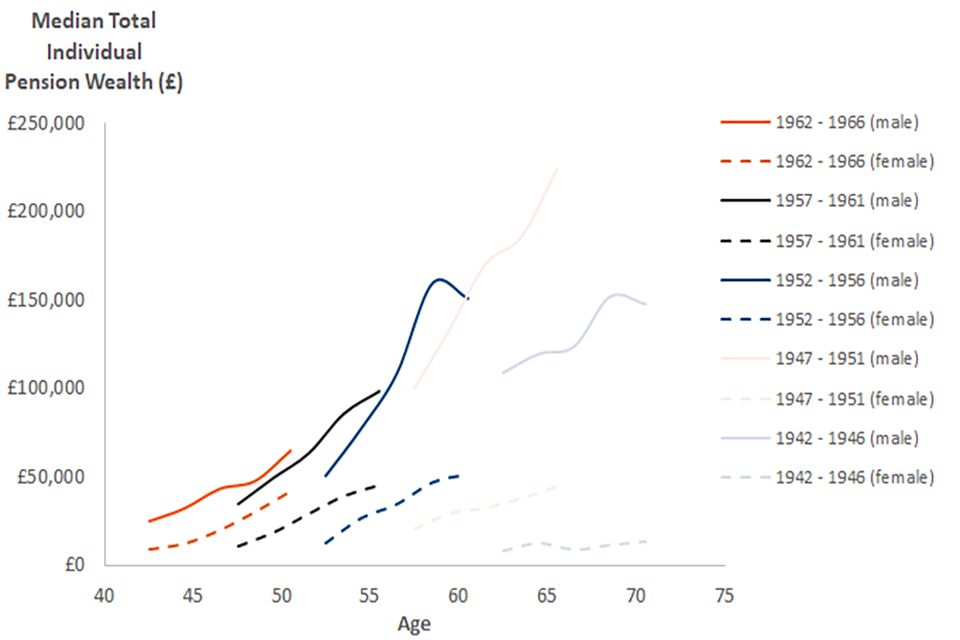
The following chart shows the individual private pension wealth of men and women. It shows that there is a gap between median private pension wealth between men and women, the gap has been closing in more recent cohorts.
Chart 4: Total individual private pension wealth by age and sex
""
Source: ONS Wealth and Assets Survey
Note: Data is in nominal price terms.
The table below shows the distribution of individual private pension wealth for those born between 1951 and 1961 based on the latest data. There is a wide range of outcomes for both men and women; 38% of men and 51% of women have less than £50,000 of private pension wealth.
Table 3: Individual private pension wealth of those born 1951 to 1961
| Amount | Male | Female |
|---|---|---|
| £0 to £50,000 | 38% | 51% |
| Between £50,001 and £500,000 | 40% | 39% |
| Over £500,000 | 23% | 10% |
Source: ONS Wealth and Assets Survey 2014 to 2016
4. Employment rates of women born between 1950 and 1959
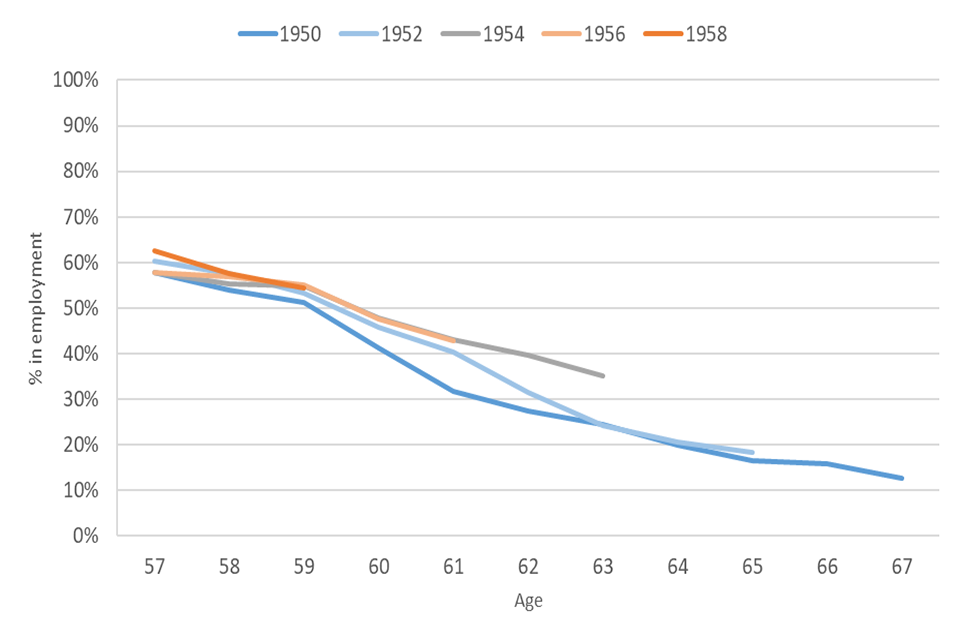
Department for Work and Pensions (DWP) statistics show that employment rates for women aged 60 to 64 have seen some of the strongest growth of any demographic in recent years.
Further analysis of employment data in the Annual Population Survey (APS) also shows an improving employment picture for women born between 1950 and 1958. Generally, women in more recent birth cohorts have higher employment rates than their predecessors in later life.
Chart 5: Employment rate by age of women born between April 1950 and March 1959
""
Source: Annual Population Survey (APS)
Note: the APS is not longitudinal; each wave includes a different sample of women. The chart does not include those who are self-employed.
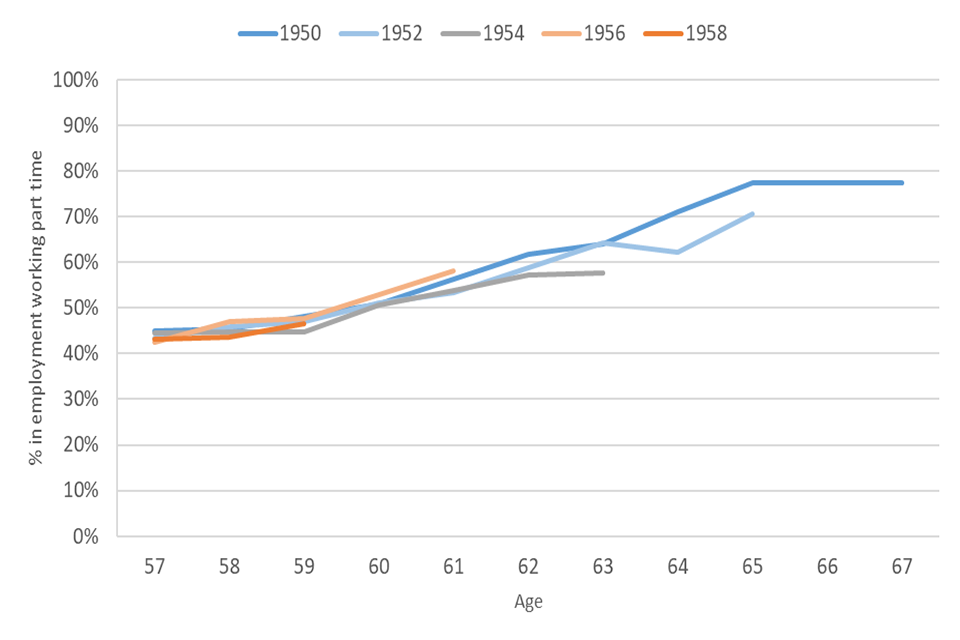
Although employment rates fall the closer a woman gets to State Pension age, the likelihood that their employment is part time increases as shown in Chart 6. Little variation is seen across birth cohorts.
Chart 6: Part-time employment rate by age, of employed women born between April 1950 and March 1959
""
Source: Annual Population Survey (APS)
Note: the APS is not longitudinal; each wave includes a different sample of women.
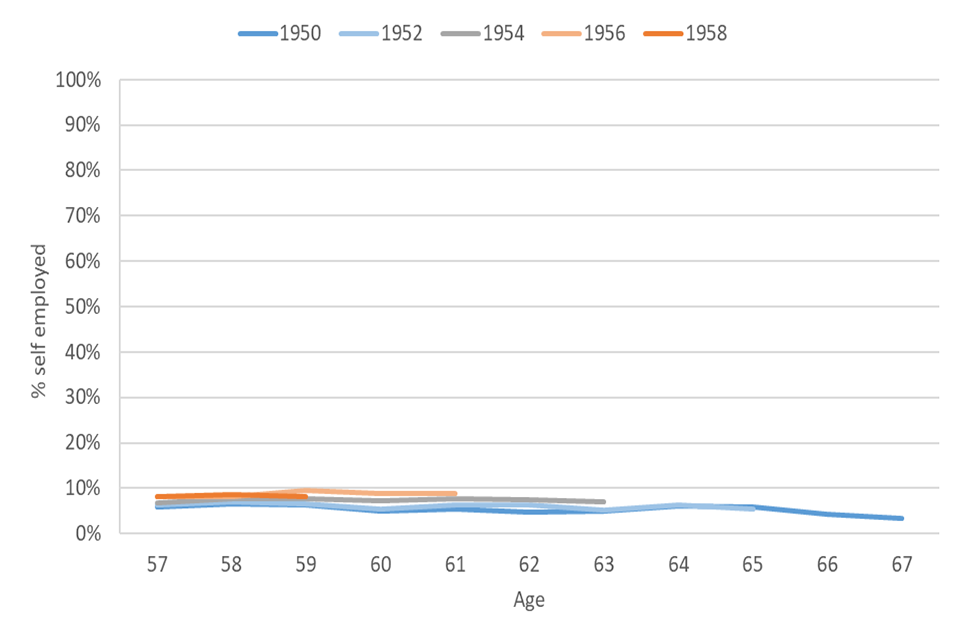
Although employment rates fall in later life, the rate of self-employment remains relatively stable, albeit low as shown in Chart 7. However, more recent birth cohorts have seen a higher incidence of self-employment in their late 50s than their predecessors.
Chart 7: Self-employment rate by age of women born between April 1950 and March 1959
""
Source: Annual Population Survey (APS)
Note: the APS is not longitudinal; each wave includes a different sample of women.
5. Employment and pension participation
The table below uses Office for National Statistics data to show the proportion of employees who are female working in different sectors and industries. Women made up a relatively large proportion of the workforce in the public sector over the last 20 years, and the majority of workers in education and human health and social work.
Table 3: Proportion of all employees who are female, by sector and industry
| Sector | April to June 1997 | April to June 2007 | April to June 2017 |
|---|---|---|---|
| Accommodation and food services | 60% | 55% | 54% |
| Administrative and support services | 45% | 43% | 46% |
| Agriculture, forestry and fishing | 27% | 29% | 26% |
| Construction | 12% | 13% | 13% |
| Education | 70% | 72% | 72% |
| Financial and insurance activities | 53% | 48% | 44% |
| Human health and social work activities | 81% | 80% | 77% |
| Information and communication | 34% | 29% | 31% |
| Manufacturing | 27% | 24% | 25% |
| Mining, energy and water supply | 19% | 23% | 20% |
| Other services | 57% | 55% | 54% |
| Professional, scientific and technical activities | 42% | 46% | 43% |
| Public admin and defence; social security | 45% | 50% | 52% |
| Real estate activities | 49% | 52% | 50% |
| Transport and storage | 20% | 20% | 20% |
| Wholesale, retail and repair of motor vehicles | 49% | 48% | 47% |
| Public sector | 62% | 65% | 66% |
| Private sector | 41% | 40% | 42% |
| All in employment | 46% | 46% | 47% |
Source: DWP calculations using ONS Labour Market Statistics (EMP13)
Note: The estimates are derived from the Labour Force Survey which is a household survey so sector and industry responses are based on the respondents’ perception of the sector and industry in which they are employed.
Pension participation in the public sector has historically been higher than in the private sector. Women in the public sector have had a higher rate of pension participation than men or women in the private sector.
Table 4: Proportion of employees participating in a pension
| Pension type | Sex | 1997 | 2007 | 2017 |
|---|---|---|---|---|
| Private | Male | 52% | 44% | 72% |
| Female | 38% | 34% | 61% | |
| Public | Male | 88% | 88% | 89% |
| Female | 78% | 83% | 88% |
Source: DWP calculations using ONS Annual Survey of Hours and Earnings
Note: Estimates refer to April of the relevant year.
The table below shows that there was a wide range of pension participation in different private sector industries in 1997, either due to higher provision of pensions by employers or higher take-up of those pensions by employees. Over the last decade the difference between the highest and lowest rates of participation has closed substantially, likely as a result of workplace pension reforms.
Table 5: Proportion of private sector employees participating in a pension
| Sector | 1997 | 2007 | 2017 |
|---|---|---|---|
| Accommodation and food services | 18% | 8% | 43% |
| Administrative and support services | 25% | 19% | 58% |
| Agriculture, forestry and fishing | 24% | 20% | 54% |
| Construction | 42% | 36% | 64% |
| Education | 54% | 43% | 64% |
| Financial and insurance activities | 76% | 80% | 90% |
| Human health and social work activities | 19% | 27% | 65% |
| Information and communication | 63% | 60% | 78% |
| Manufacturing | 58% | 57% | 81% |
| Mining, energy and water supply | 61% | 63% | 89% |
| Other services | 34% | 25% | 46% |
| Professional, scientific and technical activities | 47% | 46% | 73% |
| Public admin and defence; social security | Refer to note 2 on the notes to table | ||
| Real estate activities | 26% | 33% | 63% |
| Transport and storage | 46% | 42% | 80% |
| Wholesale, retail and repair of motor vehicles | 37% | 32% | 64% |
| Overall | 46% | 40% | 68% |
Source: DWP calculations using ONS Annual Survey of Hours and Earnings
Notes:
- Data up to 2008 is based on Standard Industrial Classification (SIC) 2003. From 2008 onwards, SIC 2007 is used, creating a slight break in the series. Therefore, care should be taken when interpreting the full time series.
- The sample size for ‘public admin and defence; social security’ is too small for reliable estimate of pension participation.
- Estimates refer to April of the relevant year.
6. Statement of compliance with the Code of Practice for Statistics
The Code of Practice for Statistics (the Code) is built around 3 main concepts, or pillars:
- trustworthiness – is about having confidence in the people and organisations that publish statistics
- quality – is about using data and methods that produce statistics
- value – is about publishing statistics that support society’s needs
The following explains how we have applied the pillars of the code in a proportionate way.
6.1 Trustworthiness
DWP analysts work to a professional competency framework and Civil Service core values of – integrity, honesty, objectivity, and impartiality. The analysis in this release has been scrutinised and received sign off by the expert lead analyst.
We protect the security of our data in order to maintain the privacy of the citizen, fulfil relevant legal obligations and uphold our guarantee that no statistics will be produced that are likely to identify an individual, while at the same time taking account of our obligation to obtain maximum value from the data we hold for statistical purposes. All analysts are given security training and the majority of data accessed by analysts is obfuscated and access is business case controlled based to the minimum data required.
6.2 Quality
The analysis presented is derived from DWP administrative and survey data. The methodology and calculations have been quality assured by DWP analysts.
6.3 Value
This release updates an illustrative estimate that was produced in 2015/16 for the Work and Pensions Select Committee of the cost of reversing legislated increases in women’s State Pension age.
This will reduce the administrative burden of answering Parliamentary Questions, Freedom of Information requests and ad hoc queries to ensure timely responses to public queries around the cost of reversing the current legislated increases in women’s State Pension age.
The figures have been seen in advance by Ministers and officials.
7. Further Information
You can find more information on:
- CPI
- average earnings
- OBR’s Economic Assumptions R4
- OBR’s Fiscal Sustainability Report
- ONS mid-year population estimates for Great Britain
- ONS mid-year population projections, 2016-based, Great Britain
- GDP deflators and corresponding guidance
- State Pension statistics on Stat-Xplore
- DWP benefits statistics
8. Contact information
For press enquiries, contact DWP Press Office on 020 3267 5125.
-
This is a conservative assumption, as average earnings (the legislated requirement) results in lower costs than uprating by the ‘triple lock’ (the highest of average earnings, CPI, and 2.5%) would. The government has committed to uprating by the triple lock for the remainder of this parliament. ↩
-
If we reduce the scope of the new cost estimate to the same scope as was used for the 2015/16 estimate (that is, the cost of State Pension payments to women only for the period 2010/11 to 2020/21, assuming no uprating of the State Pension), we get an estimate of £85.7 billion in 2015/16 prices, or £91.1 billion in 2018/19 prices. ↩
